Attached files
| file | filename |
|---|---|
| EX-99.2 - EX-99.2 - REGIONS FINANCIAL CORP | d381058dex992.htm |
| EX-99.1 - EX-99.1 - REGIONS FINANCIAL CORP | d381058dex991.htm |
| 8-K - 8-K - REGIONS FINANCIAL CORP | d381058d8k.htm |
 Regions Financial
2nd Quarter Earnings
Conference Call
July 24, 2012
Exhibit 99.3 |
 2
PRUDENT AND PROFITABLE GROWTH DRIVEN BY SOLID
BUSINESS PERFORMANCE
With each passing quarter, we are better positioned
for ultimate outperformance.
•
Experienced continued growth in
commercial and industrial portfolio
•
Conservative low loan-to-deposit ratio
provides considerable flexibility to take
advantage of lending opportunities that will
benefit future revenue growth
•
Significantly grew mortgage loan
production and related fee income
•
Reduced operating expenses and credit
costs
•
Continued asset quality improvement
2Q12 Financial Highlights
Diluted EPS
$0.20
Pre-tax Pre-provision
Income
$503
million
EPS from Continuing
Operations
$0.20
Impact of Series A
Discount
$0.05
(1)
Non-GAAP–
See
slides
13-17
for
GAAP
to
non-GAAP
reconciliation
1
1 |
 3
2Q12 FINANCIAL HIGHLIGHTS
(1)
Non-GAAP–
See slides 13-17 for GAAP to non-GAAP reconciliation
(2) From Continuing Operations
($ in millions, except EPS)
2Q11
1Q12
2Q12
From Continuing Operations
Net Interest Income
$ 856
$ 827
$ 838
$ 11
1%
$ (18)
-2%
Non-Interest Revenue
543
524
507
(17)
-3%
(36)
-7%
Non-Interest Expense
956
913
842
(71)
-8%
(114)
-12%
Pre-tax
Pre-provision
Income
(PPI)
(non-GAAP)
443
438
503
65
15%
60
14%
Net Charge-Offs
548
332
265
(67)
-20%
(283)
-52%
Loan Loss Reserve Reduction
(150)
(215)
(239)
(24)
11%
(89)
59%
Loan Loss Provision
398
117
26
(91)
-78%
(372)
-93%
Preferred Expense
54
54
71
17
31%
17
31%
Net Income Available to Common Shareholders
from Continuing Operations
25
185
280
95
51%
255
NM
Net Income / (Loss) from Discontinued
Operations
30
(40)
4
44
-110%
(26)
-87%
Net Income Available to Common Shareholders
$ 55
$ 145
$ 284
$ 139
96%
$ 229
NM
Diluted EPS
$0.04
$0.11
$0.20
$0.09
82%
$0.16
NM
Diluted EPS from Continuing Operations
$0.02
$0.14
$0.20
$0.06
43%
$0.18
NM
Diluted EPS excluding Preferred Expense
2
$0.06
$0.19
$0.25
$0.06
32%
$0.19
NM
Diluted EPS from Discontinued Operations
$0.02
($0.03)
$0.00
$0.03
NM
($0.02)
NM
2Q12 vs. 1Q12
2Q12 vs. 2Q11
1 |
 4
COMMERCIAL AND INDUSTRIAL LOANS GREW 4% OVER
LAST QUARTER
•
Commercial & industrial loan balances
on an average basis increased $902
million, or 4% linked quarter reflecting
strength in our middle market portfolio
•
Commercial & industrial line utilization
rose 130 basis points to 44.4%
•
Investor real estate totaled $9.4 billion
at quarter end and has now been
reduced to 12% of total loans down
from 17% one year ago
•
Loan yield remained flat linked quarter
despite the low rate environment
* Average Balances
Commercial and Industrial Loan Balances*
9% increase Y-O-Y
Total Loan Balances* and Loan Yields
$23,506
$23,953
$24,310
$24,748
$25,650
2Q11
3Q11
4Q11
1Q12
2Q12
$81,106
$80,513
$78,702
$77,168
$76,670
4.27%
4.31%
4.35%
4.29%
4.29%
2Q11
3Q11
4Q11
1Q12
2Q12
Avg. Loan Balance
Loan Yield |
 5
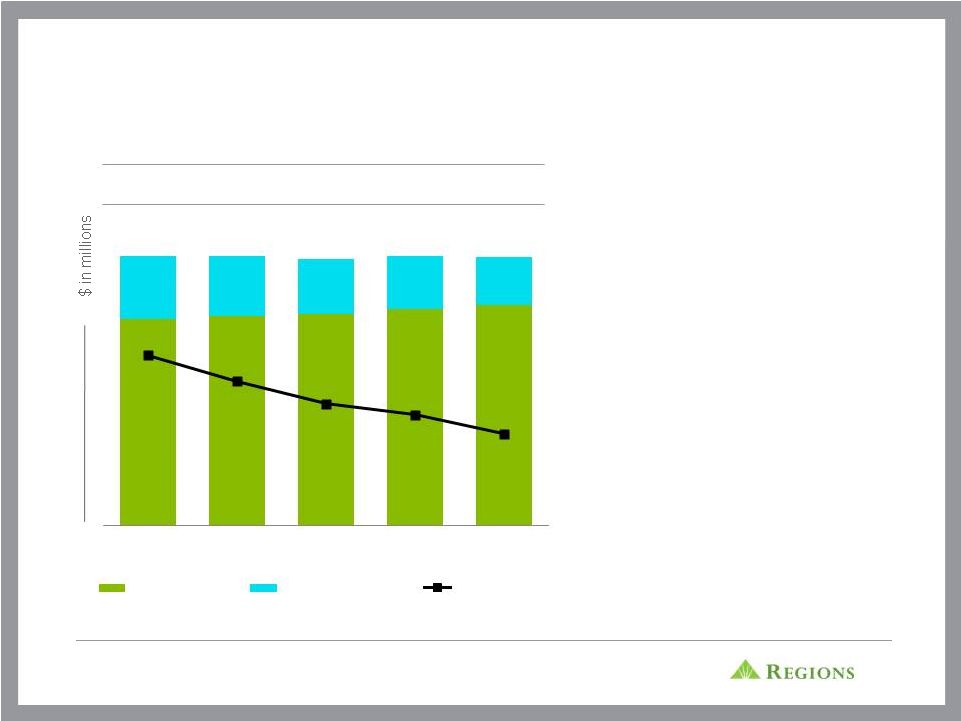
FUNDING MIX CONTINUES TO IMPROVE AS DEPOSIT
COSTS DECLINED 5 BPS
•
Avg. time deposits as a % of avg.
deposits decreased to 18% in 2Q12
from 23% in 2Q11
•
Deposit repricing opportunities
remain, maturities include:
•
3Q12 -
$2.9B at 1.2%
•
4Q12 -
$3.0B at 2.1%
•
1H13 -
$4.6B at 1.8%
•
2H13 -
$1.9B at 0.8%
•
Deposit costs declined 5 bps linked
quarter, down 21 bps year-over-year
•
Total funding mix improved to 60 bps,
down 20 bps from one year ago
* Average Balances
Deposit Balances* and Deposit Costs
73,616
74,778
75,381
77,008
78,688
22,506
21,369
19,774
19,053
17,175
$96,122
$96,147
$95,155
$96,061
$95,863
53 bps
46 bps
40 bps
37 bps
32 bps
2Q11
3Q11
4Q11
1Q12
2Q12
Low Cost Deposits
Time Deposits + Other
Deposit Cost |
 6
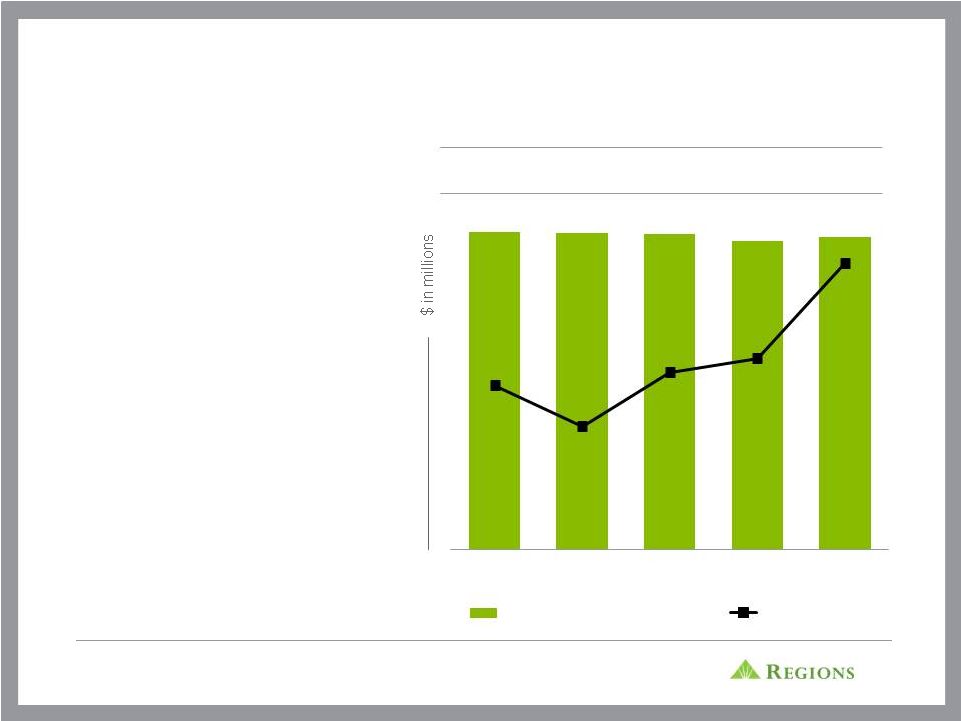
NET INTEREST MARGIN IMPROVES 7 BPS
•
Net interest margin favorably impacted by
improvements in deposit costs, lower
excess cash and lower non-accrual
balances
•
Cash reserves negatively impacted net
interest margin 8 bps in 2Q12 compared to
13 bps in 1Q12, an improvement of 5 bps
•
Non-accruals negatively impacted net
interest margin 7 bps in 2Q12 compared to
10 bps in 1Q12, an improvement of 3 bps
•
Securities portfolio totals $27 billion as a
result of cash deployment
•
Net interest margin expected to remain
relatively stable in second half of 2012
(1)
From continuing operations
Net
Interest
Income
and
Net
Interest
Margin¹
$864
$859
$858
$839
$850
3.07%
3.04%
3.08%
3.09%
3.16%
2Q11
3Q11
4Q11
1Q12
2Q12
Net Interest Income (FTE)
Net Interest Margin |
 7
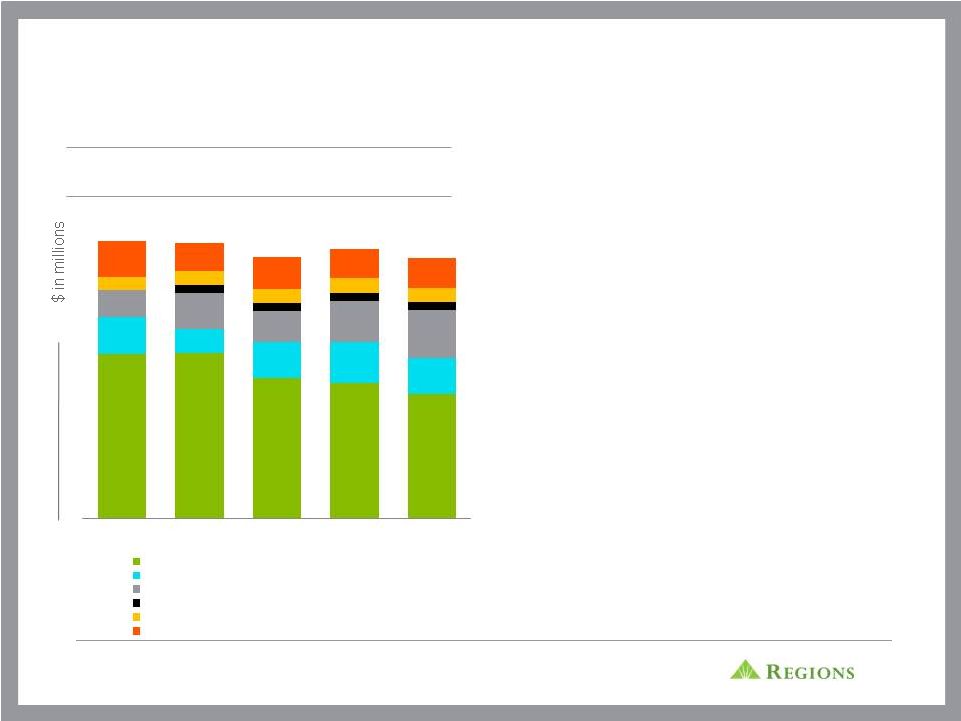
NON-INTEREST REVENUE DRIVEN BY 17% INCREASE IN
MORTGAGE INCOME
•
Non-interest revenue decreased 3%
linked quarter
•
Mortgage revenues increased 17%
linked quarter and 80% over last year
•
HARP II expected to increase
mortgage volume by $1 billion in
2012
•
Service charges declined due to the
establishment of a reserve for certain
customer fee refunds resulting from a
change in the company’s non-sufficient
funds policy
Fee
Income
by
Quarter
1
(1)
From continuing operations adjusted to exclude security gains and leveraged lease
terminations gains–Non-GAAP, see appendix for GAAP to Non-GAAP
reconciliation 308
310
263
254
233
70
44
68
77
67
50
68
57
77
90
-
15
14
15
25
27
26
28
26
66
52
60
55
57
$519
$516
$490
$505
$488
2Q11
3Q11
4Q11
1Q12
2Q12
Service charges
Capital Markets, Investment Income & Trust
Mortgage Income
Credit Card Income
Insurance Income
Other
16 |
 8
REDUCTION IN CREDIT COSTS DRIVE NON-INTEREST
EXPENSES DOWN 8% LINKED QUARTER
(1) Non-GAAP excludes 4Q11 goodwill impairment
Non-Interest
Expenses
•
Diligent and continued focus on reducing
expenses through efficiencies
•
Non-interest expenses were 8% lower than
prior quarter and down 12% year-over-year
•
Other real estate expenses decreased $13
million over prior quarter or 57%
•
Held for sale experienced net gains of $26
million related to property sales, reflecting asset
value improvements
•
Headcount reduced by 544 positions, or 2%
over the last year
Other Real Estate and HFS Expenses
$956
$850
$871
$913
$842
2Q11
3Q11
4Q11
1Q12
2Q12
$41
$48
$33
$15
$(16)
2Q11
3Q11
4Q11
1Q12
2Q12
1 |
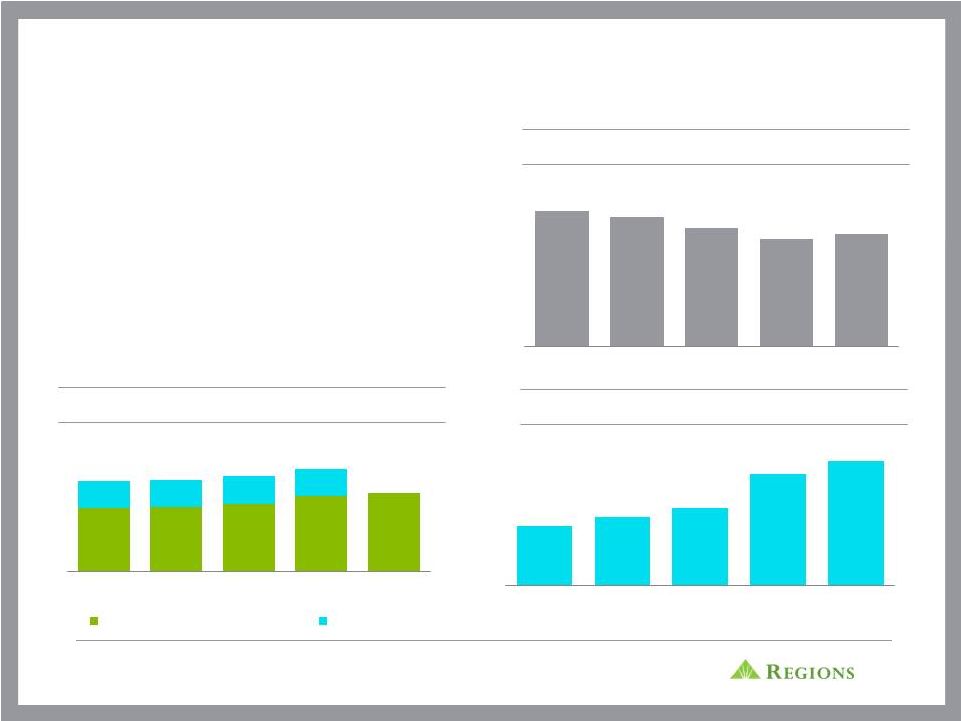
 CONTINUED MOMENTUM IN ASSET QUALITY METRICS
NPL Gross Migration
NPLs and Coverage Ratio
Business Services Criticized Loans
Loan Loss Provision
43% Decline*
31% Decline in Total NPLs*
31% Decline*
93% Decline*
*Year-over-year change
**Excludes loans held for sale
$2,784
$2,710
$2,372
$2,151
$1,915
112%
109%
116%
118%
120%
2Q11
3Q11
4Q11
1Q12
2Q12
NPLs**
ALL / NPL**
$555
$755
$561
$381
$315
2Q11
3Q11
4Q11
1Q12
2Q12
$7,899
$7,305
$6,370
$5,979
$5,436
2Q11
3Q11
4Q11
1Q12
2Q12
396
355
279
192
136
152
156
150
140
129
(150)
(156)
(134)
(215)
(239)
$398
$355
$295
$117
$26
2Q11
3Q11
4Q11
1Q12
2Q12
Business Services and HFS
Consumer
Reserve Reduction
9 |
 10
STRONG CAPITAL RATIOS
Loan to Deposit Ratio
Tier 1 Capital Ratio
Tier 1 Common Ratio
(1)
Current Quarter ratios are estimated
(2)
Non-GAAP –
See appendix for reconciliation
(3)
Includes Series A Preferred Stock and associated warrant
(4)
Based on ending balances
•
The impact of the warrant redemption related to the
repayment of Series A preferred stock was $45
million during the second quarter
•
Basel III Tier 1 Common ratio estimated under the
new proposed rules at 8.0%
•
Low loan to deposit ratio allows Regions to be
ready for loan growth when the market demand
increases
(1)
(1)
(2)
(3)
84%
83%
81%
79%
80%
2Q11
3Q11
4Q11
1Q12
2Q12
8.8%
9.0%
9.4%
10.5%
11.0%
3.8%
3.8%
3.9%
3.8%
12.6%
12.8%
13.3%
14.3%
11.0%
2Q11
3Q11
4Q11
1Q12
2Q12
Tier 1 Capital Excluding TARP
TARP Impact
7.9%
8.2%
8.5%
9.6%
10.0%
2Q11
3Q11
4Q11
1Q12
2Q12
(2)
(4) |
 11
APPENDIX |
 12
FORWARD-LOOKING STATEMENTS |
 13
NON-GAAP RECONCILIATION: NET INCOME / (LOSS) AND
EARNINGS PER SHARE
(1)
There are no preferred shares allocable to discontinued operations.
(2)
In the second quarter of 2010, Regions recorded a $200 million charge to account for
a probable, reasonably estimable loss related to a pending settlement of regulatory matters. At that
time, Regions assumed that the entire charge would be non-deductible for income
tax purposes. $75 million of the regulatory charge relates to continuing operations. The settlement was
finalized during the second quarter of 2011. At the time of settlement, Regions had
better information related to tax implications. Approximately $125 million of the settlement charge will be
deductible for federal income tax purposes. Accordingly, during the second quarter
of 2011, Regions adjusted federal income taxes to account for the impact of the deduction. The
adjustment reduced Regions' provision for income taxes by approximately $44 million
for the second quarter of 2011, of which approximately $17 million relates to continuing operations. .
`
(1)
($ amounts in millions, except per share data)
06/30/12
03/31/12
12/31/11
9/30/11
6/30/11
Net income (loss) available to common shareholders (GAAP)
284
$
145
$
(602)
$
101
$
55
$
Preferred dividends and accretion (GAAP)
71
54
54
54
54
Income (loss) from discontinued operations, net of tax (GAAP)
4
(40)
(467)
14
30
Income (loss) from continuing operations (GAAP)
A
351
$
239
$
(81)
$
141
$
79
$
B
284
$
145
$
(602)
$
101
$
55
$
Goodwill impairment, net of tax
-
-
731
-
-
Regulatory charge and related tax benefit
-
-
-
-
(44)
C
284
$
145
$
129
$
101
$
11
$
B
284
$
145
$
(602)
$
101
$
55
$
4
(40)
(467)
14
30
D
280
185
(135)
87
25
-
-
253
-
-
-
-
-
-
(17)
E
280
$
185
$
118
$
87
$
8
$
F
1,418
1,283
1,259
1,261
1,260
A/F
0.25
$
0.19
$
(0.06)
$
0.11
$
0.06
$
B/F
0.20
$
0.11
$
(0.48)
$
0.08
$
0.04
$
`
D/F
0.20
$
0.14
$
(0.11)
$
0.07
$
0.02
$
E/F
0.20
$
0.14
$
0.09
$
0.07
$
0.01
$
Earnings per common share from continuing operations,
excluding goodwill impairment and regulatory charge and
related tax benefit -
diluted (non-GAAP)
Income from continuing operations available to common
shareholders, excluding goodwill impairment and regulatory
charge and related tax benefit (non-GAAP)
Weighted-average diluted shares
Earnings (loss) per common share -diluted (GAAP)
Earnings (loss) per common share from continuing operations -
diluted (GAAP)
Earnings (loss) per common share from continuing operations,
excluding preferred dividends and accretion -diluted (non-
GAAP)
Regulatory charge and related tax benefit from continuing
operations
(2)
As of and for Quarter Ended
Net income (loss) available to common shareholders (GAAP)
Income available to common shareholders, excluding goodwill
impairment and regulatory charge and related tax benefit (non-
GAAP)
Net income (loss) available to common shareholders (GAAP)
Income (loss) from discontinued operations, net of tax (GAAP)
Income (loss) from continuing operations available to common
shareholders (GAAP)
Goodwill impairment from continuing operations (non-
deductible)
The table below presents earnings (loss) per share from continuing operations, excluding preferred
dividends and accretion (non-GAAP). The table also presents computations of earnings (loss) and certain other financial measures, excluding goodwill impairment
and regulatory charge and related tax benefit (non-GAAP) all recorded in 2011. The preferred
dividends and accretion, goodwill impairment charge, and the regulatory charge and related tax benefit are included in financial results presented in accordance with
generally accepted accounting principles (GAAP). Regions believes that the exclusion of the
preferred dividends and accretion, goodwill impairment and the regulatory charge and related tax benefit in expressing earnings (loss) and certain other financial
measures, including "earnings (loss) per common share, excluding preferred dividends and
accretion" and "earnings (loss) per common share, excluding goodwill impairment and regulatory charge and related tax benefit" provides a meaningful base for period-
to-period comparisons, which management believes will assist investors in analyzing the operating
results of the Company and predicting future performance. These non-GAAP financial measures are also used by management to assess the performance of
Regions' business because management does not consider the preferred dividends and accretion,
goodwill impairment and regulatory charge and related tax benefit to be relevant to ongoing operating results. Management and the Board of Directors utilize
these non-GAAP financial measures for the following purposes: preparation of Regions' operating
budgets; monthly financial performance reporting; monthly close-out reporting of consolidated results (management only); and presentations to investors of
Company performance. Regions believes that presenting these non-GAAP financial measures will permit
investors to assess the performance of the Company on the same basis as that applied by management and the Board of Directors. Non-GAAP financial
measures have inherent limitations, are not required to be uniformly applied and are not audited.
Although these non-GAAP financial measures are frequently used by stakeholders in the evaluation of a company, they have limitations as analytical tools, and
should not be considered in isolation, or as a substitute for analyses of results as reported under
GAAP. In particular, a measure of earnings that excludes the preferred dividends and accretion, goodwill impairment charge, and the regulatory charge and related
tax benefit does not represent the amount that effectively accrues directly to stockholders (i.e. the
preferred dividends and accretion, goodwill impairment charge, and the regulatory charge are reductions in earnings and stockholders' equity). |
 14
NON-GAAP RECONCILIATION: PRE-TAX PRE-PROVISION
INCOME
The Pre-Tax Pre-Provision Income from Continuing Operations table below presents computations
of pre-tax pre-provision income from continuing operations excluding certain
adjustments (non-GAAP). Regions believes that the exclusion of these adjustments provides a
meaningful base for period-to-period comparisons, which management believes will assist
investors in analyzing the operating results of the Company and predicting future
performance. These non-GAAP financial measures are also used by management to assess the performance
of Regions' business. It is possible that the activities related to the adjustments may recur;
however, management does not consider the activities related to the adjustments to be
indications of ongoing operations. Regions believes that presentation of these non-GAAP financial
measures will permit investors to assess the performance of the Company on the same basis as that
applied by management. Non-GAAP financial measures have inherent limitations, are
not required to be uniformly applied and are not audited. Although these non-GAAP financial
measures are frequently used by stakeholders in the evaluation of a company, they have limitations as
analytical tools, and should not be considered in isolation, or as a substitute for analyses
of results as reported under GAAP. In particular, a measure of income that excludes
certain adjustments does not represent the amount that effectively accrues directly to
stockholders. ($ amounts in millions)
6/30/12
3/31/12
12/31/11
9/30/11
6/30/11
common shareholders (GAAP)
280
$
185
$
(135)
$
87
$
25
$
95
$
51.4%
255
$
NM
71
54
54
54
54
17
31.5%
17
31.5%
126
82
18
17
(34)
44
53.7%
160
NM
taxes (GAAP)
477
321
(63)
158
45
156
48.6%
432
NM
26
117
295
355
398
(91)
-77.8%
(372)
-93.5%
(non-GAAP)
503
438
232
513
443
65
14.8%
60
13.5%
-
-
253
-
-
-
-
-
-
excluding goodwill impairment (non-GAAP)
503
438
485
513
443
65
14.8%
60
13.5%
Quarter Ended
2Q12
vs. 1Q12
2Q12
vs. 2Q11
Income (loss) from continuing operations available to
Preferred dividends (GAAP)
Income tax expense (benefit) (GAAP)
Income (loss) from continuing operations before income
Provision for loan losses (GAAP)
Pre-tax pre-provision income from continuing operations
Pre-tax pre-provision income from continuing operations,
Goodwill impairment |
 15
NON-GAAP RECONCILIATION: FEE INCOME RATIOS AND
EFFICIENCY RATIOS
($ amounts in millions)
6/30/12
3/31/12
12/31/11
9/30/11
6/30/11
Continuing Operations
Non-interest expense (GAAP)
842
$
913
$
1,124
$
850
$
956
$
Adjustments:
Securities impairment, net
(2)
-
(2)
-
-
Branch consolidation and property and equipment charges
-
-
2
-
(77)
Goodwill impairment
-
-
(253)
-
-
Adjusted non-interest expense (non-GAAP)
G
840
$
913
$
871
$
850
$
879
$
Net interest income, taxable-equivalent basis (GAAP)
850
$
839
$
858
$
859
$
864
$
Non-interest income (GAAP)
507
$
524
$
507
$
513
$
543
$
Adjustments:
Securities (gains) losses, net
(12)
(12)
(7)
1
(24)
Leveraged lease termination (gains) losses, net
(7)
(7)
(10)
2
-
Adjusted non-interest income (non-GAAP)
H
488
505
490
516
519
Adjusted total revenue (non-GAAP)
I
1,338
$
1,344
$
1,348
$
1,375
$
1,383
$
Fee income ratio (non-GAAP)
H/I
36.5%
37.6%
36.4%
37.5%
37.5%
Efficiency ratio (non-GAAP)
G/I
62.8%
67.9%
64.6%
61.8%
63.6%
As of and for Quarter Ended
The table below presents computations of the efficiency ratio (non-GAAP), which
is a measure of productivity, generally calculated as non-interest expense divided by total
revenue. The table also shows the fee ratio (non-GAAP), generally
calculated as non-interest income divided by total revenue. Management uses these ratios to monitor
performance and believes these measures provide meaningful information to
investors. Non-interest expense (GAAP) is presented excluding certain adjustments to arrive at
adjusted non-interest expense (non-GAAP), which is the numerator for the
efficiency ratio. Non-interest income (GAAP) is presented excluding certain adjustments to arrive at
adjusted non-interest income (non-GAAP), which is the numerator for the fee
ratio. Net interest income on a fully taxable-equivalent basis (GAAP) and non-interest income are
added together to arrive at total revenue (GAAP). Adjustments are made to
arrive at adjusted total revenue (non-GAAP), which is the denominator for the fee and efficiency ratios.
Regions believes that the exclusion of these adjustments provides a meaningful base
for period-to-period comparisons, which management believes will assist investors in
analyzing the operating results of the Company and predicting future
performance. These non-GAAP financial measures are also used by management to assess the performance
of
Regions'
business.
It
is
possible
that
the
activities
related
to
the
adjustments
may
recur;
however,
management
does
not
consider
the
activities
related
to
the
adjustments
to
be
indications of ongoing operations. Regions believes that presentation of
these non-GAAP financial measures will permit investors to assess the performance of the Company on
the same basis as that applied by management. |
 16
Stockholders' equity (GAAP)
14,455
$
17,534
$
16,499
$
17,263
$
16,888
$
Accumulated other comprehensive (income) loss
(54)
60
69
(92)
177
Non-qualifying goodwill and intangibles
(4,852)
(4,881)
(4,900)
(5,649)
(5,668)
Disallowed deferred tax assets
(336)
(345)
(432)
(506)
(498)
Disallowed servicing assets
(33)
(36)
(35)
(35)
(35)
Qualifying non-controlling interests
92
92
92
92
92
Qualifying trust preferred securities
846
846
846
846
846
Tier 1 capital (regulatory)
10,118
$
13,270
$
12,139
$
11,919
$
11,802
$
Qualifying non-controlling interests
(92)
(92)
(92)
(92)
(92)
Qualifying trust preferred securities
(846)
(846)
(846)
(846)
(846)
Preferred stock
-
(3,429)
(3,419)
(3,409)
(3,399)
Tier 1 common equity (non-GAAP)
O
9,180
$
8,903
$
7,782
$
7,572
$
7,465
$
Risk-weighted assets (regulatory)
P
91,769
92,546
91,449
92,786
93,865
Tier 1 common risk-based ratio (non-GAAP)
O/P
10.0%
9.6%
8.5%
8.2%
7.9%
NON-GAAP RECONCILIATION: TIER 1 COMMON
($ amounts in millions, except per share data)
6/30/12
3/31/12
12/31/11
9/30/11
6/30/11
As of and for Quarter Ended
(1)
Current quarter amount and the resulting ratio is estimated
The following table provides calculations of Tier 1 capital (regulatory) and "Tier 1 common
equity" (non-GAAP). Traditionally, the Federal Reserve and other banking
regulatory bodies have assessed a bank's capital adequacy based on Tier 1 capital, the calculation of
which is not prescribed in amount by federal banking regulations. In connection with the
Company's Comprehensive Capital Assessment and Review ("CCAR"), these regulators are supplementing their assessment of the capital adequacy
of a bank based on a variation of Tier 1 capital, known as Tier 1 common equity. While not
prescribed in amount by federal banking regulations, analysts and banking regulators have
assessed Regions' capital adequacy using the Tier 1 common equity measure. Because Tier 1 common equity is not formally defined by GAAP or
prescribed in any amount by federal banking regulations, this measure is considered to be a
non-GAAP financial measure and other entities may calculate differently than Regions'
disclosed calculations. Since analysts and banking regulators may assess Regions' capital adequacy using Tier 1 common equity, we believe that it is useful to
provide investors the ability to assess Regions' capital adequacy on this same basis.
Tier 1 common equity is often expressed as a percentage of risk-weighted assets. Under the
risk-based capital framework, a company's balance sheet assets and credit equivalent amounts
of off-balance sheet items are assigned to one of four broad risk categories. The aggregated dollar amount in each category is then multiplied by the
risk-weighted category. The resulting weighted values from each of the four categories are
added together and this sum is the risk-weighted assets total that, as adjusted, comprises
the denominator of certain risk-based capital ratios. Tier 1 capital is then divided by this denominator (risk-weighted assets) to determine the Tier 1 capital ratio.
Adjustments are made to Tier 1 capital to arrive at Tier 1 common equity (non-GAAP). Tier 1
common equity (non-GAAP) is also divided by the risk-weighted assets to determine the
Tier 1 common equity ratio (non-GAAP). The amounts disclosed as risk-weighted assets are calculated consistent with banking regulatory requirements.
-
CONSOLIDATED
(1)
TIER
1
COMMON
RISK-BASED
RATIO |
 NON-GAAP RECONCILIATION: TIER 1 CAPITAL
(1) Current quarter amounts and the resulting ratios are estimated
Regions' Series A preferred stock was repurchased on April 4, 2012 and the warrant to purchase 48.3
million shares of Regions common stock was retired on May 2, 2012. The following table
presents the calculations of Tier 1 capital and the Tier 1 capital ratio, adjusted as if the repurchase of the
shares and the retirement of the warrant occurred on the last day of the quarter for each prior period
presented. The amount retired includes the Series A preferred stock plus the remaining
balance of the related discount. ($ amounts in millions)
6/30/12
3/31/12
12/31/11
9/30/11
6/30/11
TIER 1 RISK-BASED RATIO
Stockholders' equity
14,455
$
17,534
$
16,499
$
17,263
$
16,888
$
Accumulated other comprehensive (income) loss
(54)
60
69
(92)
177
Non-qualifying goodwill and intangibles
(4,852)
(4,881)
(4,900)
(5,649)
(5,668)
Disallowed deferred tax assets
(336)
(345)
(432)
(506)
(498)
Disallowed servicing assets
(33)
(36)
(35)
(35)
(35)
Qualifying non-controlling interests
92
92
92
92
92
Qualifying trust preferred securities
846
846
846
846
846
Tier 1 capital as reported
10,118
$
13,270
$
12,139
$
11,919
$
11,802
$
Series
A
Preferred
Stock
Retirement
(Reduction
to
Stockholders' equity)
-
$
(3,500)
$
(3,500)
$
(3,500)
$
(3,500)
$
-
(45)
(45)
(45)
(45)
Tier 1 capital as adjusted to exclude Series A Preferred Stock
10,118
$
9,725
$
8,594
$
8,374
$
8,257
$
Risk-weighted
assets
1
91,769
92,546
91,449
92,786
93,865
Tier
1
capital
ratio
1
11.0%
14.3%
13.3%
12.8%
12.6%
11.0%
10.5%
9.4%
9.0%
8.8%
Quarter Ended
17
Tier
1
capital
ratio
excluding
Series
A
Preferred
Stock
and
associated
warrant
1
Retirement
of
warrant
to
purchase
48.3
million
shares
of
common
stock |
 NON-GAAP RECONCILIATION: BASEL III
(1)
Under Basel III, regulatory capital must be reduced by purchased credit card relationship intangible
assets. The majority of these assets are allowed in Basel I capital. (2)
Regions continues to develop systems and internal controls to calculate risk-weighted assets as
required by Basel III. The amount included above is a reasonable approximation based
on our understanding of the requirements, as outlined in the June 2012 Notices of Proposed Rulemakings.
18
The following table provides calculations of Tier 1 common equity (non-GAAP), based on
Regions’ current understanding of Basel III requirements, as proposed by the U.S. Notices
of Proposed Rulemaking released in June 2012. Regions currently calculates its risk-based capital ratios under guidelines adopted by the
Federal Reserve based on the 1988 Capital Accord (“Basel I”) of the Basel Committee on
Banking Supervision (the “Basel Committee”). The calculations provided below are
estimates, based on Regions’ current understanding of the framework, including the Company’s reading of the requirements, and informal
feedback received through the regulatory process. Regions’ understanding of the framework is
evolving and will likely change as the regulations are finalized. The NPR comment period
ends in early September and changes could result. Such changes could result in materially different capital ratios from what we have
estimated. Because the Basel III implementation regulations are not formally defined by GAAP and
have not yet been finalized and codified, these measures are considered to be non-GAAP
financial measures, and other entities may calculate them differently from Regions’ disclosed calculations. Since analysts and
banking regulators may assess Regions’ capital adequacy using the Basel III framework, the Company
believes that it is useful to provide investors the ability to assess Regions’ capital
adequacy on the same basis. Estimate based on June
2012 U.S. Notices of
Proposed Rulemaking
($ amounts in millions)
6/30/2012
Stockholders' equity (GAAP)
14,455
$
Non-qualifying
goodwill
and
intangibles
(1)
(5,005)
Adjustments, including other comprehensive income related to cash flow hedges,
disallowed deferred tax
assets,
threshold
deductions
and
other
adjustments
(548)
Basel III Tier 1 Common Equity (non-GAAP)
8,902
$
Basel I risk-weighted assets (regulatory)
91,769
$
Basel
III
risk-weighted
assets
(non-GAAP)
(2)
111,782
$
Basel III Tier 1 Common Ratio (non-GAAP)
8.0% |
 |