Attached files
| file | filename |
|---|---|
| 8-K - FORM 8-K - WINTRUST FINANCIAL CORP | d382425d8k.htm |
Exhibit 99.1
Wintrust Financial Corporation
727 North Bank Lane, Lake Forest, Illinois 60045
News Release
| FOR IMMEDIATE RELEASE | July 18, 2012 |
FOR MORE INFORMATION CONTACT:
Edward J. Wehmer, President & Chief Executive Officer
David A. Dykstra, Senior Executive Vice President & Chief Operating Officer
(847) 615-4096
Web site address: www.wintrust.com
WINTRUST FINANCIAL CORPORATION REPORTS SECOND QUARTER 2012 NET INCOME OF $25.6 MILLION, AN INCREASE OF 10% FROM THE 2012 FIRST QUARTER AND 118% FROM THE 2011 SECOND QUARTER
LAKE FOREST, ILLINOIS – Wintrust Financial Corporation (“Wintrust” or “the Company”) (Nasdaq WTFC) announced net income of $25.6 million or $0.52 per diluted common share for the second quarter of 2012 compared to net income of $23.2 million or $0.50 per diluted common share for the first quarter of 2012 and $11.8 million or $0.25 per diluted common share for the second quarter of 2011.
Highlights Compared With the First Quarter of 2012:
| • | 18% annualized growth in average total loans, excluding covered loans and loans held for sale |
| • | 12% annualized growth in total deposits |
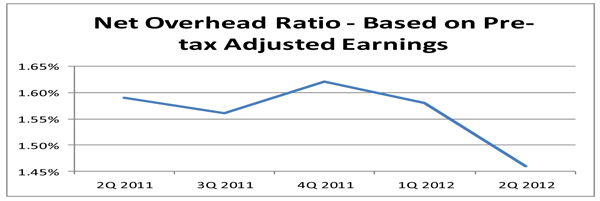
| • | 12 basis point decline in net overhead ratio, based on pre-tax adjusted earnings, to 1.46% down from 1.58% |
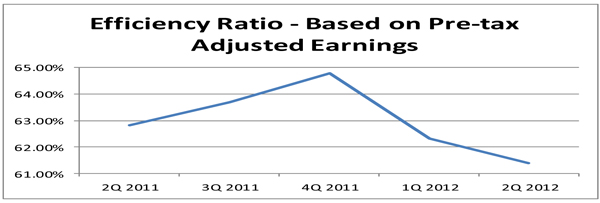
| • | 61.38% efficiency ratio, based on pre-tax adjusted earnings, an improvement from 62.31% |
| • | Pre-tax adjusted earnings increased by 8% to $68.8 million |
| • | Total non-performing assets as a percentage of total assets remained unchanged at 1.17% |
| • | Completed the acquisition of Macquarie Premium Funding Inc., the Canadian insurance premium funding business of Macquarie Group |
| • | Net interest income increased $2.4 million while the net interest margin declined by 4 basis points |
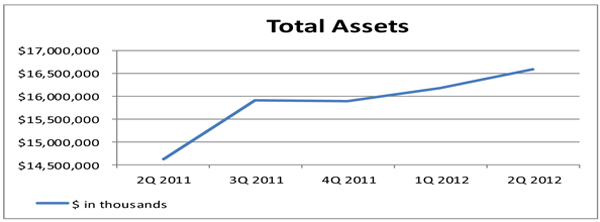
The Company’s total assets of $16.6 billion at June 30, 2012 increased $2.0 billion from June 30, 2011. Total deposits as of June 30, 2012 were $13.1 billion, an increase of $1.8 billion from June 30, 2011. Noninterest bearing deposits increased by $650 million or 47% since June 30, 2011, while NOW, wealth management, money market and savings deposits increased $1.0 billion or 21% during the same time period. Total time certificates of deposit at
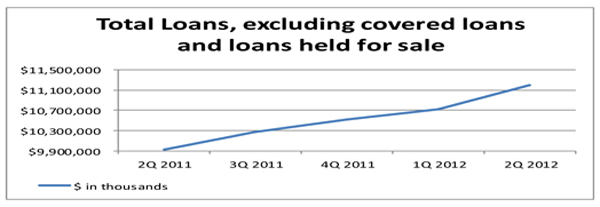
June 30, 2012 increased $109.4 million or 2% compared to June 30, 2011. Total loans, including loans held for sale but excluding covered loans, were $11.7 billion as of June 30, 2012, an increase of $1.7 billion over June 30, 2011.
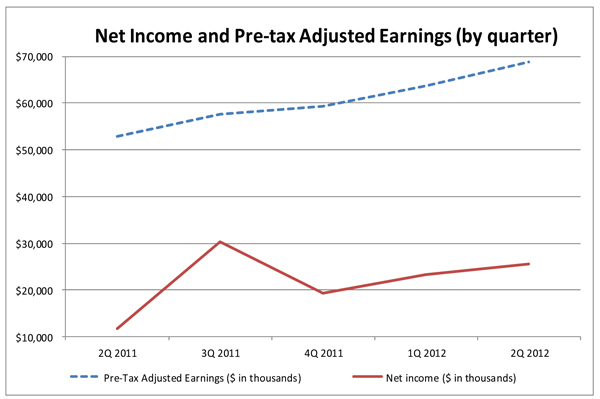
Edward J. Wehmer, President and Chief Executive Officer, commented, “Our reported second quarter net income of $25.6 million represents a 10% increase over the $23.2 million of net income reported in the first quarter of 2012 and a 118% increase over the $11.8 million of net income reported in the second quarter of 2011. On a year-to-date basis, our reported net income increased to $48.8 million in 2012, a 73% increase over the $28.2 million of reported net income in 2011. The second quarter of 2012 was highlighted by strong loan and deposit growth, continued improvement in expense control and stable credit quality measures. Improvements in two of our most important measures, pre-tax adjusted earnings and net income, reflect our efforts to grow the franchise and enhance profitability.”
Mr. Wehmer continued, “Total loans outstanding, excluding covered loans and loans held for sale, increased $485 million in the second quarter, including growth attributable to our Canadian insurance premium funding business. Loan growth for the quarter was strong in the commercial, commercial real-estate and commercial premium finance receivables portfolios. Commercial loans increased $129 million, commercial real-estate loans increased $81 million and commercial premium finance receivables increased $317 million in the second quarter. Funding of this loan growth was primarily through growth in deposits which increased $392 million in the second quarter.”
Mr. Wehmer further commented, “Pre-tax adjusted earnings continue to grow, increasing to $69 million in the second quarter of 2012, an 8% increase over the first quarter of 2012 and a 30% increase over the second quarter of 2011. The improvement in pre-tax adjusted earnings reflects continued expense management efforts and growth of net interest income. Our net overhead and efficiency ratios calculated on a pre-tax adjusted earnings basis both continued to improve in the second quarter. These are important expense control measures for the Company. Improvement in both of these ratios reflects our ability to leverage our existing infrastructure. Net interest income increased during the second quarter as growth in average earning assets offset a small decline in the net interest margin. The decline in the net interest margin was primarily attributable to current economic conditions creating an interest rate environment that is not favorable for loan pricing in the banking industry.”
Commenting on credit quality, Mr. Wehmer noted, “The Company’s credit quality metrics exhibited some of the bumpiness that we have been describing that could occur. One large credit, which should be removed from non-performing status shortly, accounted for approximately $13 million of the new non-performing loan inflows this
2
quarter. Overall, the ratio of non-performing assets to total assets remained the same as the end of the first quarter of 2012 at 1.17%. Our credit workout teams continue to make good progress on addressing total non-performing assets as we wind our way through this credit cycle.”
Turning to the future, Mr. Wehmer noted, “Our loan pipeline for internal loan growth remains very strong. Growth in net interest income should be positively impacted by this anticipated loan growth, incorporation of a full quarter of the Canadian commercial premium finance business, paying off our securitization in the middle of the third quarter and further deposit re-pricing opportunities on the funding side. The continued low asset yields as a result of the rate and economic environment will be a bit of a headwind.”
In closing, Mr. Wehmer added, “We continue to see opportunities across all facets of our franchise both organically and through acquisitions. Continued discipline in our approach to growth will allow us to expand where it makes the most sense. Growing franchise value while increasing profitability remains our main objective.”
3
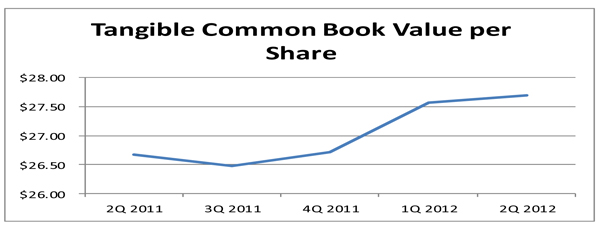
The graphs below illustrate the growth in total assets, total loans excluding covered loans and loans held for sale, total deposits and tangible common book value per share over the most recent five quarters.

4
The graphs below depict trends in net income, pre-tax adjusted earnings, efficiency ratio based on pre-tax adjusted earnings and net overhead ratio based on pre-tax adjusted earnings over the most recent five quarters. See “Supplement Financial Measures/Ratios” for additional information on these performance measures/ratios.
5
Wintrust’s key operating measures and growth rates for the second quarter of 2012, as compared to the sequential and linked quarters are shown in the table below:
| % or (4) basis point (bp) |
% or basis point (bp) |
|||||||||||||||||||
| change | change | |||||||||||||||||||
| Three Months Ended | from | from | ||||||||||||||||||
| June 30, 2012 |
March 31, 2012 |
June 30, 2011 |
1st Quarter 2012 |
2nd Quarter 2011 |
||||||||||||||||
| Net income |
$ | 25,595 | $ | 23,210 | $ | 11,750 | 10 | % | 118 | % | ||||||||||
| Net income per common share - diluted |
$ | 0.52 | $ | 0.50 | $ | 0.25 | 4 | % | 108 | % | ||||||||||
| Pre-tax adjusted earnings (2) |
$ | 68,841 | $ | 63,688 | $ | 52,860 | 8 | % | 30 | % | ||||||||||
| Net revenue (1) |
$ | 179,205 | $ | 172,918 | $ | 145,358 | 4 | % | 23 | % | ||||||||||
| Net interest income |
$ | 128,270 | $ | 125,895 | $ | 108,706 | 2 | % | 18 | % | ||||||||||
| Net interest margin (2) |
3.51 | % | 3.55 | % | 3.40 | % | (4 | )bp | 11 | bp | ||||||||||
| Net overhead ratio (2) (3) |
1.63 | % | 1.80 | % | 1.72 | % | (17 | )bp | (9 | )bp | ||||||||||
| Net overhead ratio, based on pre-tax adjusted earnings (2) (3) |
1.46 | % | 1.58 | % | 1.59 | % | (12 | )bp | (13 | )bp | ||||||||||
| Return on average assets |
0.63 | % | 0.59 | % | 0.33 | % | 4 | bp | 30 | bp | ||||||||||
| Return on average common equity |
6.08 | % | 5.90 | % | 3.05 | % | 18 | bp | 303 | bp | ||||||||||
| At end of period |
||||||||||||||||||||
| Total assets |
$ | 16,576,282 | $ | 16,172,018 | $ | 14,615,897 | 10 | % | 13 | % | ||||||||||
| Total loans, excluding loans held-for-sale, excluding covered loans |
$ | 11,202,842 | $ | 10,717,384 | $ | 9,925,077 | 18 | % | 13 | % | ||||||||||
| Total loans, including loans held-for-sale, excluding covered loans |
$ | 11,728,946 | $ | 11,067,712 | $ | 10,064,041 | 24 | % | 17 | % | ||||||||||
| Total deposits |
$ | 13,057,581 | $ | 12,665,853 | $ | 11,259,260 | 12 | % | 16 | % | ||||||||||
| Total shareholders’ equity |
$ | 1,722,074 | $ | 1,687,921 | $ | 1,473,386 | 8 | % | 17 | % | ||||||||||
| (1) | Net revenue is net interest income plus non-interest income. |
| (2) | See “Supplemental Financial Measures/Ratios” for additional information on this performance measure/ratio. |
| (3) | The net overhead ratio is calculated by netting total non-interest expense and total non-interest income, annualizing this amount, and dividing by that period’s average total assets. A lower ratio indicates a higher degree of efficiency. |
| (4) | Period-end balance sheet percentage changes are annualized. |
Certain returns, yields, performance ratios, or quarterly growth rates are “annualized” in this presentation to represent an annual time period. This is done for analytical purposes to better discern for decision-making purposes underlying performance trends when compared to full-year or year-over-year amounts. For example, a 5% growth rate for a quarter would represent an annualized 20% growth rate. Additional supplemental financial information showing quarterly trends can be found on the Company’s web site at www.wintrust.com by choosing “Financial Reports” under the “Investor Relations” heading, and then choosing “Supplemental Financial Information.”
6
Items Impacting Comparative Financial Results: Acquisitions and Capital
Acquisitions – completed in the past twelve months
On June 8, 2012, the Company, through its wholly-owned subsidiary Lake Forest Bank and Trust Company (“Lake Forest Bank”), completed its previously announced acquisition of Macquarie Premium Funding Inc., the Canadian insurance premium funding business of Macquarie Group. Through this transaction, Lake Forest Bank acquired approximately $213 million of gross premium finance receivables outstanding. The Company recorded goodwill of approximately $22 million on the acquisition.
On April 13, 2012, the Company’s wholly-owned subsidiary bank, Old Plank Trail Community Bank, N.A. (“Old Plank Trail Bank”), completed its previously announced acquisition of a branch of Suburban Bank & Trust Company (“Suburban”) located in Orland Park, Illinois. Through this transaction, Old Plank Trail Bank acquired approximately $52 million of deposits and $3 million of loans. The Company recorded goodwill of $1.5 million on the branch acquisition.
On March 30, 2012, the Company’s wholly-owned subsidiary, The Chicago Trust Company, N.A. (“CTC”), completed its previously announced acquisition of the trust operations of Suburban. Through this transaction, CTC acquired trust accounts having assets under administration of approximately $160 million, in addition to land trust accounts and various other assets. The Company recorded goodwill of $1.8 million on the acquisition.
On February 10, 2012, the Company announced that its wholly-owned subsidiary bank, Barrington Bank and Trust Company, N.A. (“Barrington”), acquired certain assets and liabilities and the banking operations of Charter National Bank and Trust (“Charter National”) in an FDIC-assisted transaction. Charter National operated two locations: one in Hoffman Estates and one in Hanover Park.
On September 30, 2011, the Company completed its acquisition of Elgin State Bancorp, Inc. (“ESBI”). ESBI was the parent company of Elgin State Bank, which operated three banking locations in Elgin, Illinois. As part of the transaction, Elgin State Bank merged into the Company’s wholly-owned subsidiary bank, St. Charles Bank & Trust Company (“St. Charles”), and the three acquired banking locations are operating as branches of St. Charles under the brand name Elgin State Bank. Elgin State Bank had approximately $262 million in assets and $240 million in deposits as of the acquisition date, prior to purchase accounting adjustments. The Company recorded goodwill of approximately $5.0 million on the acquisition.
On July 8, 2011, the Company announced that its wholly-owned subsidiary bank, Northbrook Bank & Trust Company (“Northbrook”), acquired certain assets and liabilities and the banking operations of First Chicago Bank &
7
Trust (“First Chicago”) in an FDIC-assisted transaction. First Chicago operated seven locations in Illinois: three in Chicago and one each in Bloomingdale, Itasca, Norridge and Park Ridge.
On July 1, 2011, the Company completed its acquisition of Great Lakes Advisors, Inc. (“Great Lakes Advisors”), a Chicago-based investment manager with approximately $2.4 billion in assets under management. The Company recorded goodwill of $15.7 million on the acquisition. Great Lakes Advisors merged with Wintrust’s existing asset management business, Wintrust Capital Management, LLC and operates as “Great Lakes Advisors, LLC, a Wintrust Wealth Management Company”.
Summary of FDIC-assisted transactions in the past twelve months
| • | Barrington assumed approximately $89 million of the outstanding deposits and approximately $94 million of assets of Charter National on February 10, 2012, prior to purchase accounting adjustments. A bargain purchase gain of $785,000 was recognized on this transaction. |
| • | Northbrook assumed approximately $887 million of the outstanding deposits and approximately $959 million of assets of First Chicago on July 8, 2011, prior to purchase accounting adjustments. A bargain purchase gain of $27.4 million was recognized on this transaction. |
Loans comprise the majority of the assets acquired in the FDIC-assisted transactions and are subject to loss sharing agreements with the FDIC where the FDIC has agreed to reimburse the Company for 80% of losses incurred on the purchased loans. Additionally, the loss share agreements with the FDIC require the Company to reimburse the FDIC in the event that actual losses on covered assets are lower than the original loss estimates agreed upon with the FDIC with respect to such assets in the loss share agreements. We refer to the loans subject to these loss-sharing agreements as “covered loans.” We use the term “covered assets” to refer to the total of covered loans, covered OREO and certain other covered assets. The agreements with the FDIC require that the Company follow certain servicing procedures or risk losing FDIC reimbursement of losses related to covered assets.
Stock Offerings
On March 14, 2012, the Company announced the pricing of 110,000 shares, or $110,000,000 aggregate liquidation preference, of Non-Cumulative Perpetual Convertible Preferred Stock, Series C (“Preferred Stock”). On March 15, 2012, the Company’s underwriters exercised their option to purchase 16,500, or $16,500,000 aggregate liquidation preference, of Preferred Stock. After giving effect to the exercise of the overallotment option, the underwriters purchased an aggregate of 126,500 shares or $126,500,000 aggregate liquidation preference, of Preferred Stock in the offering.
8
Capital Ratios
As of June 30, 2012, the Company’s estimated capital ratios were 13.5% for total risk-based capital, 12.4% for tier 1 risk-based capital and 10.2% for leverage, above the well capitalized guidelines. Additionally, the Company’s tangible common equity ratio was 7.4% at June 30, 2012. Assuming full conversion of preferred stock, the tangible common equity ratio was 8.4% at June 30, 2012.
Financial Performance Overview – Second Quarter 2012
For the second quarter of 2012, net interest income totaled $128.3 million, an increase of $2.4 million as compared to the first quarter of 2012 and $19.6 million as compared to the second quarter of 2011. The increases in net interest income on both a sequential and linked quarter basis are the result of:
| • | The change in deposit mix and loan growth positively impacted net interest income in the second quarter of 2012 as compared to the first quarter of 2012 and second quarter of 2011. |
| • | Average earning assets for the second quarter of 2012 increased by $1.9 billion compared to the second quarter of 2011. Average earning asset growth over the past 12 months was primarily a result of the $1.4 billion increase in average loans, excluding covered loans, $241.7 million of average covered loan growth from the FDIC-assisted bank acquisitions and a $192.2 million increase in average liquidity management and other earning assets. Growth in average loans included a $563.7 million increase in commercial loans as a result of the Company’s commercial banking initiative and the Elgin State Bank acquisition completed at the end of the third quarter of 2011. Additionally, increases totaling $343.6 million in average residential real loans, which includes mortgages held for sale, were the result of higher residential originations in the current quarter as a result of lower mortgage interest rates. Average commercial insurance premium finance loans increased $245.7 million in the second quarter of 2012. The last significant category of average loans which had an increase was the commercial real estate loan portfolio which increased $230.1 million. These increases were partially offset by a decrease in average home equity loans of $57.8 million. The average earning asset growth of $1.9 billion over the past 12 months was primarily funded by a $1.3 billion increase in the average balances of interest-bearing deposits and an increase in the average balance of net free funds of $588.8 million. |
| • | During the second quarter of 2012, the Company repurchased an additional $67.2 million of the $600 million Class A notes issued in the third quarter of 2009 as part of its loan securitization. As of June 30, 2012, the Company has repurchased a total of $239.2 million of the $600 million Class A notes. |
9
The net interest margin for the second quarter of 2012 was 3.51% compared to 3.55% in the first quarter of 2012 and 3.40% in the second quarter of 2011. The changes in net interest margin on both a linked and sequential quarter basis are the result of:
| • | The four basis point decrease in net interest margin in the second quarter of 2012 compared to the first quarter of 2012 resulted from lower yields on liquidity management assets and loans and lower market yields on mortgages held for sale partially offset by the positive re-pricing of retail interest-bearing deposits along with a more favorable deposit mix. |
| • | The 11 basis point increase in the second quarter of 2012 compared to the second quarter of 2011 was primarily attributable to a 31 basis point decline in the cost of interest-bearing deposits and a 95 basis point decline in the cost of wholesale borrowings over the last 12 months. Offsetting this was a 41 basis point decline in our yield on total loans as a result of an interest rate environment that has not been favorable for loan pricing in the banking industry. |
Non-interest income totaled $50.9 million in the second quarter of 2012, increasing $3.9 million, or 8.3%, compared to the first quarter of 2012 and increasing $14.3 million, or 39%, compared to the second quarter of 2011. The increase in the second quarter of 2012 compared to the first quarter of 2012 is primarily attributable to higher mortgage banking revenues and wealth management revenues, partially offset by trading losses, less income from investment partnerships and no acquisition-related bargain purchase gains as gains were recorded during the first quarter of 2012 as a result of the Charter National FDIC-assisted transaction. The increase in the second quarter of 2012 compared to the second quarter of 2011 was primarily attributable to higher mortgage banking revenues and wealth management revenues, partially offset by a decrease in bargain purchase gains and trading losses. Mortgage banking revenue increased $7.1 million when compared to the first quarter of 2012 and increased $12.8 million when compared to the second quarter of 2011. The increase in mortgage banking revenue in the current quarter as compared to the second quarter of 2011 resulted primarily from an increase in gains on sales of loans, which was driven by higher origination volumes in the current quarter due to a favorable mortgage interest rate environment partially offset by lower mortgage servicing rights (“MSR”) valuations. Loans sold to the secondary market were $854 million in the second quarter of 2012 compared to $715 million in the first quarter of 2012 and $459 million in the second quarter of 2011 (see “Non-Interest Income” section later in this release for further detail).
Non-interest expense totaled $117.2 million in the second quarter of 2012, decreasing $573,000 compared to the first quarter of 2012 and increasing $20.0 million, or 21%, compared to the second quarter of 2011. The increase
10
compared to the second quarter of 2011 was primarily attributable to a $15.1 million increase in salaries and employee benefits. Salaries and employee benefits expense increased primarily as a result of a $5.2 million increase in salaries caused by the addition of employees from the various acquisitions and larger staffing as the Company grows, an $8.7 million increase in bonus and commissions primarily attributable to the increase in variable pay based revenue and the Company’s long-term incentive program and a $1.2 million increase from employee benefits (primarily health plan and payroll taxes related).
Financial Performance Overview – First Six Months of 2012
The net interest margin for the first six months of 2012 was 3.53% compared to 3.44% in the first six months of 2011. Average earnings assets for the first six months of 2012 totaled $14.5 billion, an increase of $1.7 billion compared to the prior year period. This average earning asset growth is primarily a result of the $1.2 billion increase in average loans, excluding covered loans, $290.9 million of average covered loan growth from the FDIC-assisted bank acquisitions and a $162.7 million increase in liquidity management and other earning assets. The majority of the increase in average loans was comprised of increases of $528.2 million in commercial loans, $204.8 million in commercial real estate loans, $310.1 million in premium finance receivables and $200.4 million in residential real estate loans, partially offset by a $23.9 million decrease in home equity and all other loans. The average earning asset growth of $1.7 billion in the first six months of 2012 compared to the prior year period was primarily funded by a $1.1 billion increase in the average balances of interest-bearing deposits and an increase in the average balance of net free funds of $461.3 million.
Non-interest income totaled $98.0 million in the first six months of 2012, increasing $20.4 million, or 26%, compared to the first six months of 2011. The change is primarily attributable to higher mortgage banking revenues and wealth management revenues, partially offset by lower bargain purchase gains recorded during the current period relating to FDIC-assisted acquisitions than during the comparable period. Mortgage banking revenue increased $19.7 million when compared to the first six months of 2011. The increase in the first six months of 2012 results primarily from an increase in gains on sales of loans, which was driven by higher origination volumes due to a favorable mortgage interest rate environment in 2012. Loans sold to the secondary market were $1.6 billion in the first six months of 2012 compared to $1.0 billion in the first six months of 2011.
Non-interest expense totaled $234.9 million in the first six months of 2012, increasing $39.6 million compared to the first six months of 2011. The increase compared to the first six months of 2011 was primarily attributable to a $28.0 million increase in salaries and employee benefits. Salaries and employee benefits expense
11
increased primarily as a result of a $10.0 million increase in salaries caused by the addition of employees from the various acquisitions and larger staffing as the Company grows, a $14.7 million increase in bonus and commissions primarily attributable to the increase in variable pay based revenue and the Company’s long-term incentive program and a $3.3 million increase from employee benefits (primarily health plan and payroll taxes related).
Financial Performance Overview – Credit Quality
The ratio of non-performing assets to total assets remained the same at June 30, 2012 compared to the first quarter of 2012. Non-performing assets, excluding covered assets, totaled $193.5 million, or 1.17% of total assets at June 30, 2012, compared to $189.9 million, or 1.17% of total assets, at March 31, 2012 and $238.8 million, or 1.57% of total assets, at June 30, 2011.
Non-performing loans, excluding covered loans, totaled $120.9 million, or 1.08% of total loans, at June 30, 2012, compared to $113.6 million, or 1.06% of total loans, at March 31, 2012 and $156.1 million, or 1.57% of total loans, at June 30, 2011. The increase in commercial non-performing loans was primarily related to one credit relationship totaling approximately $13 million. OREO, excluding covered OREO, of $72.6 million at June 30, 2012, decreased $3.7 million compared to $76.2 million at March 31, 2012 and decreased $10.2 million compared to $82.8 million at June 30, 2011.
The provision for credit losses, excluding the provision for covered loan losses, totaled $18.4 million for the second quarter of 2012 compared to $15.2 million for the first quarter of 2012 and $28.7 million in the second quarter of 2011. Net charge-offs as a percentage of loans, excluding covered loans, for the second quarter of 2012 totaled 62 basis points on an annualized basis compared to 53 basis points on an annualized basis in the first quarter of 2012 and 106 basis points on an annualized basis in the second quarter of 2011.
Excluding the allowance for covered loan losses, the allowance for credit losses at June 30, 2012 totaled $124.8 million, or 1.11% of total loans, compared to $124.1 million, or 1.16% of total loans, at March 31, 2012 and $119.7 million, or 1.21% of total loans, at June 30, 2011.
12
WINTRUST FINANCIAL CORPORATION
Selected Financial Highlights
| Three Months Ended June 30, |
Six Months Ended June 30, |
|||||||||||||||
| 2012 | 2011 | 2012 | 2011 | |||||||||||||
| Selected Financial Condition Data (at end of period): |
||||||||||||||||
| Total assets |
$ | 16,576,282 | $ | 14,615,897 | ||||||||||||
| Total loans, excluding covered loans |
11,202,842 | 9,925,077 | ||||||||||||||
| Total deposits |
13,057,581 | 11,259,260 | ||||||||||||||
| Junior subordinated debentures |
249,493 | 249,493 | ||||||||||||||
| Total shareholders’ equity |
1,722,074 | 1,473,386 | ||||||||||||||
| Selected Statements of Income Data: |
||||||||||||||||
| Net interest income |
$ | 128,270 | $ | 108,706 | $ | 254,165 | $ | 218,320 | ||||||||
| Net revenue (1) |
179,205 | 145,358 | 352,123 | 295,859 | ||||||||||||
| Pre-tax adjusted earnings (2) |
68,841 | 52,860 | 132,529 | 103,892 | ||||||||||||
| Net income |
25,595 | 11,750 | 48,805 | 28,152 | ||||||||||||
| Net income per common share - Basic |
$ | 0.63 | $ | 0.31 | $ | 1.24 | $ | 0.75 | ||||||||
| Net income per common share - Diluted |
$ | 0.52 | $ | 0.25 | $ | 1.02 | $ | 0.60 | ||||||||
| Selected Financial Ratios and Other Data: |
||||||||||||||||
| Performance Ratios: |
||||||||||||||||
| Net interest margin (2) |
3.51 | % | 3.40 | % | 3.53 | % | 3.44 | % | ||||||||
| Non-interest income to average assets |
1.26 | % | 1.04 | % | 1.23 | % | 1.11 | % | ||||||||
| Non-interest expense to average assets |
2.89 | % | 2.76 | % | 2.94 | % | 2.80 | % | ||||||||
| Net overhead ratio (2) (3) |
1.63 | % | 1.72 | % | 1.71 | % | 1.69 | % | ||||||||
| Net overhead ratio, based on pre-tax adjusted earnings (2) (3) |
1.46 | % | 1.59 | % | 1.44 | % | 1.29 | % | ||||||||
| Efficiency ratio (2) (4) |
65.63 | % | 67.22 | % | 66.91 | % | 66.11 | % | ||||||||
| Efficiency ratio, based on pre-tax adjusted earnings (2) (4) |
61.38 | % | 62.81 | % | 61.83 | % | 63.18 | % | ||||||||
| Return on average assets |
0.63 | % | 0.33 | % | 0.61 | % | 0.40 | % | ||||||||
| Return on average common equity |
6.08 | % | 3.05 | % | 5.99 | % | 3.76 | % | ||||||||
| Average total assets |
$ | 16,319,207 | $ | 14,105,136 | $ | 16,077,279 | $ | 14,059,339 | ||||||||
| Average total shareholders’ equity |
1,695,440 | 1,460,071 | 1,630,051 | 1,449,031 | ||||||||||||
| Average loans to average deposits ratio (excluding covered loans) |
88.2 | % | 90.9 | % | 88.2 | % | 91.1 | % | ||||||||
| Average loans to average deposits ratio (including covered loans) |
93.4 | % | 94.8 | % | 93.4 | % | 94.5 | % | ||||||||
| Common Share Data at end of period: |
||||||||||||||||
| Market price per common share |
$ | 35.50 | $ | 32.18 | ||||||||||||
| Book value per common share (2) |
$ | 35.86 | $ | 33.63 | ||||||||||||
| Tangible common book value per share (2) |
$ | 27.69 | $ | 26.67 | ||||||||||||
| Common shares outstanding |
36,340,843 | 34,988,125 | ||||||||||||||
| Other Data at end of period:(8) |
||||||||||||||||
| Leverage Ratio (5) |
10.2 | % | 10.3 | % | ||||||||||||
| Tier 1 capital to risk-weighted assets (5) |
12.4 | % | 12.3 | % | ||||||||||||
| Total capital to risk-weighted assets (5) |
13.5 | % | 13.5 | % | ||||||||||||
| Tangible common equity ratio (TCE) (2)(7) |
7.4 | % | 7.9 | % | ||||||||||||
| Tangible common equity ratio, assuming full conversion of preferred stock (2) (7) |
8.4 | % | 8.2 | % | ||||||||||||
| Allowance for credit losses (6) |
$ | 124,823 | $ | 119,697 | ||||||||||||
| Non-performing loans |
$ | 120,920 | $ | 156,072 | ||||||||||||
| Allowance for credit losses to total loans (6) |
1.11 | % | 1.21 | % | ||||||||||||
| Non-performing loans to total loans |
1.08 | % | 1.57 | % | ||||||||||||
| Number of: |
||||||||||||||||
| Bank subsidiaries |
15 | 15 | ||||||||||||||
| Non-bank subsidiaries |
8 | 7 | ||||||||||||||
| Banking offices |
100 | 88 | ||||||||||||||
| (1) | Net revenue includes net interest income and non-interest income |
| (2) | See “Supplemental Financial Measures/Ratios” for additional information on this performance measure/ratio. |
| (3) | The net overhead ratio is calculated by netting total non-interest expense and total non-interest income, annualizing this amount, and dividing by that period’s total average assets. A lower ratio indicates a higher degree of efficiency. |
| (4) | The efficiency ratio is calculated by dividing total non-interest expense by tax-equivalent net revenue (less securities gains or losses). A lower ratio indicates more efficient revenue generation. |
| (5) | Capital ratios for current quarter-end are estimated. |
| (6) | The allowance for credit losses includes both the allowance for loan losses and the allowance for unfunded lending-related commitments, but excludes the allowance for covered loan losses. |
| (7) | Total shareholders’ equity minus preferred stock and total intangible assets divided by total assets minus total intangible assets. |
| (8) | Asset quality ratios exclude covered loans. |
13
WINTRUST FINANCIAL CORPORATION AND SUBSIDIARIES
CONSOLIDATED STATEMENTS OF CONDITION
| (In thousands) |
(Unaudited) June 30, 2012 |
December 31, 2011 |
(Unaudited) June 30, 2011 |
|||||||||
| Assets |
||||||||||||
| Cash and due from banks |
$ | 176,529 | $ | 148,012 | $ | 140,434 | ||||||
| Federal funds sold and securities purchased under resale agreements |
15,227 | 21,692 | 43,634 | |||||||||
| Interest-bearing deposits with other banks |
1,117,888 | 749,287 | 990,308 | |||||||||
| Available-for-sale securities, at fair value |
1,196,702 | 1,291,797 | 1,456,426 | |||||||||
| Trading account securities |
608 | 2,490 | 509 | |||||||||
| Federal Home Loan Bank and Federal Reserve Bank stock, at cost |
92,792 | 100,434 | 86,761 | |||||||||
| Brokerage customer receivables |
31,448 | 27,925 | 29,736 | |||||||||
| Mortgage loans held-for-sale, at fair value |
511,566 | 306,838 | 133,083 | |||||||||
| Mortgage loans held-for-sale, at lower of cost or market |
14,538 | 13,686 | 5,881 | |||||||||
| Loans, net of unearned income, excluding covered loans |
11,202,842 | 10,521,377 | 9,925,077 | |||||||||
| Covered loans |
614,062 | 651,368 | 408,669 | |||||||||
|
|
|
|
|
|
|
|||||||
| Total loans |
11,816,904 | 11,172,745 | 10,333,746 | |||||||||
| Less: Allowance for loan losses |
111,920 | 110,381 | 117,362 | |||||||||
| Less: Allowance for covered loan losses |
20,560 | 12,977 | 7,443 | |||||||||
|
|
|
|
|
|
|
|||||||
| Net loans |
11,684,424 | 11,049,387 | 10,208,941 | |||||||||
| Premises and equipment, net |
449,608 | 431,512 | 403,577 | |||||||||
| FDIC indemnification asset |
222,568 | 344,251 | 110,049 | |||||||||
| Accrued interest receivable and other assets |
710,275 | 444,912 | 389,634 | |||||||||
| Trade date securities receivable |
— | 634,047 | 322,091 | |||||||||
| Goodwill |
330,896 | 305,468 | 283,301 | |||||||||
| Other intangible assets |
21,213 | 22,070 | 11,532 | |||||||||
|
|
|
|
|
|
|
|||||||
| Total assets |
$ | 16,576,282 | $ | 15,893,808 | $ | 14,615,897 | ||||||
|
|
|
|
|
|
|
|||||||
| Liabilities and Shareholders’ Equity |
||||||||||||
| Deposits: |
||||||||||||
| Non-interest bearing |
$ | 2,047,715 | $ | 1,785,433 | 1,397,433 | |||||||
| Interest bearing |
11,009,866 | 10,521,834 | 9,861,827 | |||||||||
|
|
|
|
|
|
|
|||||||
| Total deposits |
13,057,581 | 12,307,267 | 11,259,260 | |||||||||
| Notes payable |
2,457 | 52,822 | 1,000 | |||||||||
| Federal Home Loan Bank advances |
564,301 | 474,481 | 423,500 | |||||||||
| Other borrowings |
375,523 | 443,753 | 432,706 | |||||||||
| Secured borrowings - owed to securitization investors |
360,825 | 600,000 | 600,000 | |||||||||
| Subordinated notes |
15,000 | 35,000 | 40,000 | |||||||||
| Junior subordinated debentures |
249,493 | 249,493 | 249,493 | |||||||||
| Trade date securities payable |
19,025 | 47 | 2,243 | |||||||||
| Accrued interest payable and other liabilities |
210,003 | 187,412 | 134,309 | |||||||||
|
|
|
|
|
|
|
|||||||
| Total liabilities |
14,854,208 | 14,350,275 | 13,142,511 | |||||||||
|
|
|
|
|
|
|
|||||||
| Shareholders’ Equity: |
||||||||||||
| Preferred stock |
176,337 | 49,768 | 49,704 | |||||||||
| Common stock |
36,573 | 35,982 | 34,988 | |||||||||
| Surplus |
1,013,428 | 1,001,316 | 969,315 | |||||||||
| Treasury stock |
(7,374 | ) | (112 | ) | (50 | ) | ||||||
| Retained earnings |
501,139 | 459,457 | 415,297 | |||||||||
| Accumulated other comprehensive income (loss) |
1,971 | (2,878 | ) | 4,132 | ||||||||
|
|
|
|
|
|
|
|||||||
| Total shareholders’ equity |
1,722,074 | 1,543,533 | 1,473,386 | |||||||||
|
|
|
|
|
|
|
|||||||
| Total liabilities and shareholders’ equity |
$ | 16,576,282 | $ | 15,893,808 | $ | 14,615,897 | ||||||
|
|
|
|
|
|
|
|||||||
14
WINTRUST FINANCIAL CORPORATION AND SUBSIDIARIES
CONSOLIDATED STATEMENTS OF INCOME (UNAUDITED)
| Three Months Ended June 30, |
Six Months Ended June 30, |
|||||||||||||||
| (In thousands, except per share data) |
2012 | 2011 | 2012 | 2011 | ||||||||||||
| Interest income |
||||||||||||||||
| Interest and fees on loans |
$ | 144,100 | $ | 132,338 | $ | 287,655 | $ | 268,881 | ||||||||
| Interest bearing deposits with banks |
203 | 870 | 451 | 1,806 | ||||||||||||
| Federal funds sold and securities purchased under resale agreements |
6 | 23 | 18 | 55 | ||||||||||||
| Securities |
10,510 | 11,438 | 22,357 | 20,978 | ||||||||||||
| Trading account securities |
10 | 10 | 19 | 23 | ||||||||||||
| Federal Home Loan Bank and Federal Reserve Bank stock |
641 | 572 | 1,245 | 1,122 | ||||||||||||
| Brokerage customer receivables |
221 | 194 | 432 | 360 | ||||||||||||
|
|
|
|
|
|
|
|
|
|||||||||
| Total interest income |
155,691 | 145,445 | 312,177 | 293,225 | ||||||||||||
|
|
|
|
|
|
|
|
|
|||||||||
| Interest expense |
||||||||||||||||
| Interest on deposits |
17,273 | 22,404 | 35,303 | 46,360 | ||||||||||||
| Interest on Federal Home Loan Bank advances |
2,867 | 4,010 | 6,451 | 7,968 | ||||||||||||
| Interest on notes payable and other borrowings |
2,274 | 2,715 | 5,376 | 5,345 | ||||||||||||
| Interest on secured borrowings - owed to securitization investors |
1,743 | 2,994 | 4,292 | 6,034 | ||||||||||||
| Interest on subordinated notes |
126 | 194 | 295 | 406 | ||||||||||||
| Interest on junior subordinated debentures |
3,138 | 4,422 | 6,295 | 8,792 | ||||||||||||
|
|
|
|
|
|
|
|
|
|||||||||
| Total interest expense |
27,421 | 36,739 | 58,012 | 74,905 | ||||||||||||
|
|
|
|
|
|
|
|
|
|||||||||
| Net interest income |
128,270 | 108,706 | 254,165 | 218,320 | ||||||||||||
| Provision for credit losses |
20,691 | 29,187 | 38,091 | 54,531 | ||||||||||||
|
|
|
|
|
|
|
|
|
|||||||||
| Net interest income after provision for credit losses |
107,579 | 79,519 | 216,074 | 163,789 | ||||||||||||
|
|
|
|
|
|
|
|
|
|||||||||
| Non-interest income |
||||||||||||||||
| Wealth management |
13,393 | 10,601 | 25,794 | 20,837 | ||||||||||||
| Mortgage banking |
25,607 | 12,817 | 44,141 | 24,448 | ||||||||||||
| Service charges on deposit accounts |
3,994 | 3,594 | 8,202 | 6,905 | ||||||||||||
| Gains on available-for-sale securities, net |
1,109 | 1,152 | 1,925 | 1,258 | ||||||||||||
| Gain on bargain purchases, net |
(55 | ) | 746 | 785 | 10,584 | |||||||||||
| Trading losses, net |
(928 | ) | (30 | ) | (782 | ) | (470 | ) | ||||||||
| Other |
7,815 | 7,772 | 17,893 | 13,977 | ||||||||||||
|
|
|
|
|
|
|
|
|
|||||||||
| Total non-interest income |
50,935 | 36,652 | 97,958 | 77,539 | ||||||||||||
|
|
|
|
|
|
|
|
|
|||||||||
| Non-interest expense |
||||||||||||||||
| Salaries and employee benefits |
68,139 | 53,079 | 137,169 | 109,178 | ||||||||||||
| Equipment |
5,466 | 4,409 | 10,866 | 8,673 | ||||||||||||
| Occupancy, net |
7,728 | 6,772 | 15,790 | 13,277 | ||||||||||||
| Data processing |
3,840 | 3,147 | 7,458 | 6,670 | ||||||||||||
| Advertising and marketing |
2,179 | 1,440 | 4,185 | 3,054 | ||||||||||||
| Professional fees |
3,847 | 4,533 | 7,451 | 8,079 | ||||||||||||
| Amortization of other intangible assets |
1,089 | 704 | 2,138 | 1,393 | ||||||||||||
| FDIC insurance |
3,477 | 3,281 | 6,834 | 7,799 | ||||||||||||
| OREO expenses, net |
5,848 | 6,577 | 13,026 | 12,385 | ||||||||||||
| Other |
15,572 | 13,264 | 30,027 | 24,807 | ||||||||||||
|
|
|
|
|
|
|
|
|
|||||||||
| Total non-interest expense |
117,185 | 97,206 | 234,944 | 195,315 | ||||||||||||
|
|
|
|
|
|
|
|
|
|||||||||
| Income before taxes |
41,329 | 18,965 | 79,088 | 46,013 | ||||||||||||
| Income tax expense |
15,734 | 7,215 | 30,283 | 17,861 | ||||||||||||
|
|
|
|
|
|
|
|
|
|||||||||
| Net income |
$ | 25,595 | $ | 11,750 | $ | 48,805 | $ | 28,152 | ||||||||
|
|
|
|
|
|
|
|
|
|||||||||
| Preferred stock dividends and discount accretion |
$ | 2,644 | $ | 1,033 | $ | 3,890 | $ | 2,064 | ||||||||
|
|
|
|
|
|
|
|
|
|||||||||
| Net income applicable to common shares |
$ | 22,951 | $ | 10,717 | $ | 44,915 | $ | 26,088 | ||||||||
|
|
|
|
|
|
|
|
|
|||||||||
| Net income per common share - Basic |
$ | 0.63 | $ | 0.31 | $ | 1.24 | $ | 0.75 | ||||||||
|
|
|
|
|
|
|
|
|
|||||||||
| Net income per common share - Diluted |
$ | 0.52 | $ | 0.25 | $ | 1.02 | $ | 0.60 | ||||||||
|
|
|
|
|
|
|
|
|
|||||||||
| Cash dividends declared per common share |
$ | — | $ | — | $ | 0.09 | $ | 0.09 | ||||||||
|
|
|
|
|
|
|
|
|
|||||||||
| Weighted average common shares outstanding |
36,329 | 34,971 | 36,266 | 34,950 | ||||||||||||
| Dilutive potential common shares |
7,770 | 8,438 | 7,723 | 8,437 | ||||||||||||
|
|
|
|
|
|
|
|
|
|||||||||
| Average common shares and dilutive common shares |
44,099 | 43,409 | 43,989 | 43,387 | ||||||||||||
|
|
|
|
|
|
|
|
|
|||||||||
15
SUPPLEMENTAL FINANCIAL MEASURES/RATIOS
The accounting and reporting policies of Wintrust conform to generally accepted accounting principles (“GAAP”) in the United States and prevailing practices in the banking industry. However, certain non-GAAP performance measures and ratios are used by management to evaluate and measure the Company’s performance. These include taxable-equivalent net interest income (including its individual components), net interest margin (including its individual components), the efficiency ratio, tangible common equity ratio, tangible common book value per share and pre-tax adjusted earnings. Management believes that these measures and ratios provide users of the Company’s financial information a more meaningful view of the performance of the interest-earning assets and interest-bearing liabilities and of the Company’s operating efficiency. Other financial holding companies may define or calculate these measures and ratios differently.
Management reviews yields on certain asset categories and the net interest margin of the Company and its banking subsidiaries on a fully taxable-equivalent (“FTE”) basis. In this non-GAAP presentation, net interest income is adjusted to reflect tax-exempt interest income on an equivalent before-tax basis. This measure ensures comparability of net interest income arising from both taxable and tax-exempt sources. Net interest income on a FTE basis is also used in the calculation of the Company’s efficiency ratio. The efficiency ratio, which is calculated by dividing non-interest expense by total taxable-equivalent net revenue (less securities gains or losses), measures how much it costs to produce one dollar of revenue. Securities gains or losses are excluded from this calculation to better match revenue from daily operations to operational expenses. Management considers the tangible common equity ratio and tangible book value per common share as useful measurements of the Company’s equity. Pre-tax adjusted earnings is a significant metric in assessing the Company’s operating performance. Pre-tax adjusted earnings is calculated by adjusting income before taxes to exclude the provision for credit losses and certain significant items.
The net overhead ratio and the efficiency ratio are primarily reviewed by the Company based on pre-tax adjusted earnings. The Company believes that these measures provide a more meaningful view of the Company’s operating efficiency and expense management. The net overhead ratio, based on pre-tax adjusted earnings, is calculated by netting total adjusted non-interest expense and total adjusted non-interest income, annualizing this amount, and dividing it by total average assets. Adjusted non-interest expense is calculated by subtracting OREO expenses, covered loan collection expense, defeasance cost and seasonal payroll tax fluctuation. Adjusted non-interest income is calculated by adding back the recourse obligation on loans previously sold and subtracting gains or adding back losses on investment partnerships, bargain purchase, trading and available-for-sale securities activity.
The efficiency ratio, based on pre-tax adjusted earnings, is calculated by dividing adjusted non-interest expense by adjusted taxable-equivalent net revenue. Adjusted taxable-equivalent net revenue is comprised of fully taxable equivalent net interest income and adjusted non-interest income.
16
The following table presents a reconciliation of certain non-GAAP performance measures and ratios used by the Company to evaluate and measure the Company’s performance to the most directly comparable GAAP financial measures for the last 5 quarters:
| Three Months Ended | Six Months Ended | |||||||||||||||||||||||||||
| June 30, | March 31, | December 31, | September 30, | June 30, | June 30, | |||||||||||||||||||||||
| (Dollars and shares in thousands) |
2012 | 2012 | 2011 | 2011 | 2011 | 2012 | 2011 | |||||||||||||||||||||
| Calculation of Net Interest Margin and Efficiency Ratio |
||||||||||||||||||||||||||||
| (A) Interest Income (GAAP) |
$ | 155,691 | $ | 156,486 | $ | 157,617 | $ | 154,951 | $ | 145,445 | $ | 312,177 | $ | 293,225 | ||||||||||||||
| Taxable-equivalent adjustment: |
||||||||||||||||||||||||||||
| - Loans |
135 | 134 | 132 | 100 | 110 | 269 | 226 | |||||||||||||||||||||
| - Liquidity management assets |
333 | 329 | 320 | 313 | 296 | 662 | 591 | |||||||||||||||||||||
| - Other earning assets |
3 | 3 | 2 | 6 | 2 | 6 | 5 | |||||||||||||||||||||
|
|
|
|
|
|
|
|
|
|
|
|
|
|
|
|||||||||||||||
| Interest Income - FTE |
$ | 156,162 | $ | 156,952 | $ | 158,071 | $ | 155,370 | $ | 145,853 | $ | 313,114 | $ | 294,047 | ||||||||||||||
| (B) Interest Expense (GAAP) |
27,421 | 30,591 | 32,970 | 36,541 | 36,739 | 58,012 | 74,905 | |||||||||||||||||||||
|
|
|
|
|
|
|
|
|
|
|
|
|
|
|
|||||||||||||||
| Net interest income - FTE |
$ | 128,741 | $ | 126,361 | $ | 125,101 | $ | 118,829 | $ | 109,114 | $ | 255,102 | $ | 219,142 | ||||||||||||||
|
|
|
|
|
|
|
|
|
|
|
|
|
|
|
|||||||||||||||
| (C) Net Interest Income (GAAP) (A minus B) |
$ | 128,270 | $ | 125,895 | $ | 124,647 | $ | 118,410 | $ | 108,706 | $ | 254,165 | $ | 218,320 | ||||||||||||||
|
|
|
|
|
|
|
|
|
|
|
|
|
|
|
|||||||||||||||
| (D) Net interest margin (GAAP) |
3.49 | % | 3.54 | % | 3.44 | % | 3.36 | % | 3.38 | % | 3.52 | % | 3.42 | % | ||||||||||||||
| Net interest margin - FTE |
3.51 | % | 3.55 | % | 3.45 | % | 3.37 | % | 3.40 | % | 3.53 | % | 3.44 | % | ||||||||||||||
| (E) Efficiency ratio (GAAP) |
65.80 | % | 68.42 | % | 70.17 | % | 57.34 | % | 67.41 | % | 67.09 | % | 66.30 | % | ||||||||||||||
| Efficiency ratio - FTE |
65.63 | % | 68.24 | % | 69.99 | % | 57.21 | % | 67.22 | % | 66.91 | % | 66.11 | % | ||||||||||||||
| Efficiency ratio - Based on pre-tax adjusted earnings |
61.38 | % | 62.31 | % | 64.76 | % | 63.69 | % | 62.81 | % | 61.83 | % | 63.18 | % | ||||||||||||||
| (F) Net Overhead Ratio (GAAP) |
1.63 | % | 1.80 | % | 1.83 | % | 1.00 | % | 1.72 | % | 1.71 | % | 1.69 | % | ||||||||||||||
| Net Overhead ratio - Based on pre-tax adjusted earnings |
1.46 | % | 1.58 | % | 1.62 | % | 1.56 | % | 1.59 | % | 1.44 | % | 1.29 | % | ||||||||||||||
| Calculation of Tangible Common Equity ratio (at period end) |
||||||||||||||||||||||||||||
| Total shareholders’ equity |
$ | 1,722,074 | $ | 1,687,921 | $ | 1,543,533 | $ | 1,528,187 | $ | 1,473,386 | ||||||||||||||||||
| (G) Less: Preferred stock |
(176,337 | ) | (176,302 | ) | (49,768 | ) | (49,736 | ) | (49,704 | ) | ||||||||||||||||||
| Less: Intangible assets |
(352,109 | ) | (329,396 | ) | (327,538 | ) | (324,782 | ) | (294,833 | ) | ||||||||||||||||||
|
|
|
|
|
|
|
|
|
|
|
|||||||||||||||||||
| (H) Total tangible common shareholders’ equity |
$ | 1,193,628 | $ | 1,182,223 | $ | 1,166,227 | $ | 1,153,669 | $ | 1,128,849 | ||||||||||||||||||
|
|
|
|
|
|
|
|
|
|
|
|||||||||||||||||||
| Total assets |
$ | 16,576,282 | $ | 16,172,018 | $ | 15,893,808 | $ | 15,914,804 | $ | 14,615,897 | ||||||||||||||||||
| Less: Intangible assets |
(352,109 | ) | (329,396 | ) | (327,538 | ) | (324,782 | ) | (294,833 | ) | ||||||||||||||||||
|
|
|
|
|
|
|
|
|
|
|
|||||||||||||||||||
| (I) Total tangible assets |
$ | 16,224,173 | $ | 15,842,622 | $ | 15,566,270 | $ | 15,590,022 | $ | 14,321,064 | ||||||||||||||||||
|
|
|
|
|
|
|
|
|
|
|
|||||||||||||||||||
| Tangible common equity ratio (H/I) |
7.4 | % | 7.5 | % | 7.5 | % | 7.4 | % | 7.9 | % | ||||||||||||||||||
| Tangible common equity ratio, assuming full conversion of prefered stock ((H-G)/I) |
8.4 | % | 8.6 | % | 7.8 | % | 7.7 | % | 8.2 | % | ||||||||||||||||||
| Calculation of Pre-Tax Adjusted Earnings |
||||||||||||||||||||||||||||
| Income before taxes |
$ | 41,329 | $ | 37,759 | $ | 31,974 | $ | 50,046 | $ | 18,965 | $ | 79,088 | $ | 46,013 | ||||||||||||||
| Add: Provision for credit losses |
20,691 | 17,400 | 18,817 | 29,290 | 29,187 | 38,091 | 54,531 | |||||||||||||||||||||
| Add: OREO expenses, net |
5,848 | 7,178 | 8,821 | 5,134 | 6,577 | 13,026 | 12,385 | |||||||||||||||||||||
| Add: Recourse obligation on loans previously sold |
(36 | ) | 36 | 986 | 266 | (916 | ) | — | (813 | ) | ||||||||||||||||||
| Add: Covered loan collection expense |
1,323 | 1,399 | 944 | 336 | 806 | 2,722 | 1,551 | |||||||||||||||||||||
| Add: Defeasance cost |
148 | 848 | — | — | — | 996 | — | |||||||||||||||||||||
| Add: Seasonal payroll tax fluctuation |
(271 | ) | 2,265 | (932 | ) | (781 | ) | (131 | ) | 1,994 | 1,713 | |||||||||||||||||
| Less: (Gain) loss from investment partnerships |
(65 | ) | (1,395 | ) | (723 | ) | 1,439 | 240 | (1,460 | ) | (116 | ) | ||||||||||||||||
| Less: Gain on bargain purchases, net |
55 | (840 | ) | — | (27,390 | ) | (746 | ) | (785 | ) | (10,584 | ) | ||||||||||||||||
| Less: Trading (gains) losses |
928 | (146 | ) | (216 | ) | (591 | ) | 30 | 782 | 470 | ||||||||||||||||||
| Less: Gains on available-for-sale securities, net |
(1,109 | ) | (816 | ) | (309 | ) | (225 | ) | (1,152 | ) | (1,925 | ) | (1,258 | ) | ||||||||||||||
|
|
|
|
|
|
|
|
|
|
|
|
|
|
|
|||||||||||||||
| Pre-tax adjusted earnings |
$ | 68,841 | $ | 63,688 | $ | 59,362 | $ | 57,524 | $ | 52,860 | $ | 132,529 | $ | 103,892 | ||||||||||||||
|
|
|
|
|
|
|
|
|
|
|
|
|
|
|
|||||||||||||||
| Calculation of book value per share |
||||||||||||||||||||||||||||
| Total shareholders’ equity |
$ | 1,722,074 | $ | 1,687,921 | $ | 1,543,533 | $ | 1,528,187 | $ | 1,473,386 | ||||||||||||||||||
| Less: Preferred stock |
(176,337 | ) | (176,302 | ) | (49,768 | ) | (49,736 | ) | (49,704 | ) | ||||||||||||||||||
|
|
|
|
|
|
|
|
|
|
|
|||||||||||||||||||
| (J) Total common equity |
$ | 1,545,737 | $ | 1,511,619 | $ | 1,493,765 | $ | 1,478,451 | $ | 1,423,682 | ||||||||||||||||||
|
|
|
|
|
|
|
|
|
|
|
|||||||||||||||||||
| Actual common shares outstanding |
36,341 | 36,289 | 35,978 | 35,924 | 34,988 | |||||||||||||||||||||||
| Add: TEU conversion shares |
6,760 | 6,593 | 7,666 | 7,666 | 7,342 | |||||||||||||||||||||||
|
|
|
|
|
|
|
|
|
|
|
|||||||||||||||||||
| (K) Common shares used for book value calculation |
43,101 | 42,882 | 43,644 | 43,590 | 42,330 | |||||||||||||||||||||||
|
|
|
|
|
|
|
|
|
|
|
|||||||||||||||||||
| Book value per share (J/K) |
$ | 35.86 | $ | 35.25 | $ | 34.23 | $ | 33.92 | $ | 33.63 | ||||||||||||||||||
| Tangible common book value per share (H/K) |
$ | 27.69 | $ | 27.57 | $ | 26.72 | $ | 26.47 | $ | 26.67 | ||||||||||||||||||
17
LOANS
Loan Portfolio Mix and Growth Rates
| % Growth | ||||||||||||||||||||
| From (1) | From | |||||||||||||||||||
| (Dollars in thousands) |
June 30, 2012 |
December 31, 2011 |
June 30, 2011 |
December 31, 2011 |
June 30, 2011 |
|||||||||||||||
| Balance: |
||||||||||||||||||||
| Commercial |
$ | 2,673,181 | $ | 2,498,313 | $ | 2,132,436 | 14 | % | 25 | % | ||||||||||
| Commercial real-estate |
3,666,519 | 3,514,261 | 3,374,668 | 9 | 9 | |||||||||||||||
| Home equity |
820,991 | 862,345 | 880,702 | (10 | ) | (7 | ) | |||||||||||||
| Residential real-estate |
375,494 | 350,289 | 329,381 | 14 | 14 | |||||||||||||||
| Premium finance receivables - commercial |
1,830,044 | 1,412,454 | 1,429,436 | 59 | 28 | |||||||||||||||
| Premium finance receivables - life insurance |
1,656,200 | 1,695,225 | 1,619,668 | (5 | ) | 2 | ||||||||||||||
| Indirect consumer (2) |
72,482 | 64,545 | 57,718 | 25 | 26 | |||||||||||||||
| Consumer and other |
107,931 | 123,945 | 101,068 | (26 | ) | 7 | ||||||||||||||
|
|
|
|
|
|
|
|
|
|
|
|||||||||||
| Total loans, net of unearned income, excluding covered loans |
$ | 11,202,842 | $ | 10,521,377 | $ | 9,925,077 | 13 | % | 13 | % | ||||||||||
| Covered loans |
614,062 | 651,368 | 408,669 | (12 | ) | 50 | ||||||||||||||
|
|
|
|
|
|
|
|
|
|
|
|||||||||||
| Total loans, net of unearned income |
$ | 11,816,904 | $ | 11,172,745 | $ | 10,333,746 | 12 | % | 14 | % | ||||||||||
|
|
|
|
|
|
|
|
|
|
|
|||||||||||
| Mix: |
||||||||||||||||||||
| Commercial |
23 | % | 22 | % | 20 | % | ||||||||||||||
| Commercial real-estate |
31 | 31 | 33 | |||||||||||||||||
| Home equity |
7 | 8 | 8 | |||||||||||||||||
| Residential real-estate |
3 | 3 | 3 | |||||||||||||||||
| Premium finance receivables - commercial |
15 | 13 | 14 | |||||||||||||||||
| Premium finance receivables - life insurance |
14 | 15 | 16 | |||||||||||||||||
| Indirect consumer (2) |
1 | 1 | 1 | |||||||||||||||||
| Consumer and other |
1 | 1 | 1 | |||||||||||||||||
|
|
|
|
|
|
|
|||||||||||||||
| Total loans, net of unearned income, excluding covered loans |
95 | % | 94 | % | 96 | % | ||||||||||||||
| Covered loans |
5 | 6 | 4 | |||||||||||||||||
|
|
|
|
|
|
|
|||||||||||||||
| Total loans, net of unearned income |
100 | % | 100 | % | 100 | % | ||||||||||||||
|
|
|
|
|
|
|
|||||||||||||||
| (1) | Annualized |
| (2) | Includes autos, boats, snowmobiles and other indirect consumer loans. |
18
| > 90 Days | Allowance | |||||||||||||||||||
| As of June 30, 2012 | % of | Past Due | For Loan | |||||||||||||||||
| Total | and Still | Losses | ||||||||||||||||||
| (Dollars in thousands) |
Balance | Balance | Nonaccrual | Accruing | Allocation | |||||||||||||||
| Commercial: |
||||||||||||||||||||
| Commercial and industrial |
$ | 1,621,061 | 25.6 | % | $ | 27,911 | $ | — | $ | 17,477 | ||||||||||
| Franchise |
178,619 | 2.8 | 1,792 | — | 1,764 | |||||||||||||||
| Mortgage warehouse lines of credit |
123,804 | 2.0 | — | — | 913 | |||||||||||||||
| Community Advantage - homeowner associations |
73,289 | 1.2 | — | — | 183 | |||||||||||||||
| Aircraft |
22,803 | 0.4 | 428 | — | 151 | |||||||||||||||
| Asset-based lending |
489,207 | 7.7 | 342 | — | 5,457 | |||||||||||||||
| Municipal |
79,708 | 1.3 | — | — | 784 | |||||||||||||||
| Leases |
77,806 | 1.2 | — | — | 241 | |||||||||||||||
| Other |
1,842 | — | — | — | 13 | |||||||||||||||
| Purchased non-covered commercial loans (1) |
5,042 | 0.1 | — | 486 | — | |||||||||||||||
|
|
|
|
|
|
|
|
|
|
|
|||||||||||
| Total commercial |
$ | 2,673,181 | 42.3 | % | $ | 30,473 | $ | 486 | $ | 26,983 | ||||||||||
|
|
|
|
|
|
|
|
|
|
|
|||||||||||
| Commercial Real-Estate: |
||||||||||||||||||||
| Residential construction |
$ | 44,726 | 0.7 | % | $ | 892 | $ | — | $ | 1,215 | ||||||||||
| Commercial construction |
156,695 | 2.5 | 3,011 | — | 3,666 | |||||||||||||||
| Land |
165,269 | 2.6 | 13,459 | — | 6,848 | |||||||||||||||
| Office |
570,434 | 9.0 | 4,796 | — | 6,176 | |||||||||||||||
| Industrial |
598,217 | 9.4 | 1,820 | — | 5,721 | |||||||||||||||
| Retail |
562,783 | 8.9 | 8,158 | — | 5,940 | |||||||||||||||
| Multi-family |
337,781 | 5.3 | 3,312 | — | 9,624 | |||||||||||||||
| Mixed use and other |
1,179,152 | 18.5 | 20,629 | — | 14,611 | |||||||||||||||
| Purchased non-covered commercial real-estate (1) |
51,462 | 0.8 | — | 2,232 | — | |||||||||||||||
|
|
|
|
|
|
|
|
|
|
|
|||||||||||
| Total commercial real-estate |
$ | 3,666,519 | 57.7 | % | $ | 56,077 | $ | 2,232 | $ | 53,801 | ||||||||||
|
|
|
|
|
|
|
|
|
|
|
|||||||||||
| Total commercial and commercial real-estate |
$ | 6,339,700 | 100.0 | % | $ | 86,550 | $ | 2,718 | $ | 80,784 | ||||||||||
|
|
|
|
|
|
|
|
|
|
|
|||||||||||
| Commercial real-estate - collateral location by state: |
||||||||||||||||||||
| Illinois |
$ | 3,015,007 | 82.2 | % | ||||||||||||||||
| Wisconsin |
337,186 | 9.2 | ||||||||||||||||||
|
|
|
|
|
|||||||||||||||||
| Total primary markets |
$ | 3,352,193 | 91.4 | % | ||||||||||||||||
|
|
|
|
|
|||||||||||||||||
| Florida |
56,479 | 1.5 | ||||||||||||||||||
| Arizona |
39,219 | 1.1 | ||||||||||||||||||
| Indiana |
48,682 | 1.3 | ||||||||||||||||||
| Other (no individual state greater than 0.5%) |
169,946 | 4.7 | ||||||||||||||||||
|
|
|
|
|
|||||||||||||||||
| Total |
$ | 3,666,519 | 100.0 | % | ||||||||||||||||
|
|
|
|
|
|||||||||||||||||
| (1) | Purchased loans represent loans acquired with evidence of credit quality deterioration since origination, in accordance with ASC 310-30. Loan agings are based upon contractually required payments. |
19
DEPOSITS
Deposit Portfolio Mix and Growth Rates
| % Growth | ||||||||||||||||||||
| (Dollars in thousands) |
June 30, 2012 |
December 31, 2011 |
June 30, 2011 |
From (1) December 31, 2011 |
From June 30, 2011 |
|||||||||||||||
| Balance: |
||||||||||||||||||||
| Non-interest bearing |
$ | 2,047,715 | $ | 1,785,433 | $ | 1,397,433 | 30 | % | 47 | % | ||||||||||
| NOW |
1,780,872 | 1,698,778 | 1,530,068 | 10 | 16 | |||||||||||||||
| Wealth Management deposits (2) |
954,319 | 788,311 | 737,428 | 42 | 29 | |||||||||||||||
| Money Market |
2,335,238 | 2,263,253 | 1,985,661 | 6 | 18 | |||||||||||||||
| Savings |
958,295 | 888,592 | 736,974 | 16 | 30 | |||||||||||||||
| Time certificates of deposit |
4,981,142 | 4,882,900 | 4,871,696 | 4 | 2 | |||||||||||||||
|
|
|
|
|
|
|
|
|
|
|
|||||||||||
| Total deposits |
$ | 13,057,581 | $ | 12,307,267 | $ | 11,259,260 | 12 | % | 16 | % | ||||||||||
|
|
|
|
|
|
|
|
|
|
|
|||||||||||
| Mix: |
||||||||||||||||||||
| Non-interest bearing |
16 | % | 15 | % | 12 | % | ||||||||||||||
| NOW |
14 | 14 | 14 | |||||||||||||||||
| Wealth Management deposits (2) |
7 | 6 | 6 | |||||||||||||||||
| Money Market |
18 | 18 | 18 | |||||||||||||||||
| Savings |
7 | 7 | 7 | |||||||||||||||||
| Time certificates of deposit |
38 | 40 | 43 | |||||||||||||||||
|
|
|
|
|
|
|
|||||||||||||||
| Total deposits |
100 | % | 100 | % | 100 | % | ||||||||||||||
|
|
|
|
|
|
|
|||||||||||||||
| (1) | Annualized |
| (2) | Represents deposit balances of the Company’s subsidiary banks from brokerage customers of Wayne Hummer Investments, trust and asset management customers of The Chicago Trust Company and brokerage customers from unaffiliated companies which have been placed into deposit accounts of the Banks. |
Time Certificates of Deposit
Maturity/Re-pricing Analysis
As of June 30, 2012
| CDARs & | Weighted-Average | |||||||||||||||||||||||
| (Dollars in thousands) |
Brokered Certificates of Deposit (1) |
MaxSafe Certificates of Deposit (1) |
Variable Rate Certificates of Deposit (2) |
Other Fixed Rate Certificates of Deposit (1) |
Total
Time Certificates of Deposits |
Rate of Maturing Time Certificates of Deposit (3) |
||||||||||||||||||
| 1-3 months |
$ | 46,296 | $ | 65,049 | $ | 166,307 | $ | 772,536 | $ | 1,050,188 | 1.03 | % | ||||||||||||
| 4-6 months |
5,877 | 45,408 | — | 720,289 | 771,574 | 0.90 | % | |||||||||||||||||
| 7-9 months |
117,397 | 32,061 | — | 557,303 | 706,761 | 0.90 | % | |||||||||||||||||
| 10-12 months |
140,672 | 34,344 | — | 641,434 | 816,450 | 0.73 | % | |||||||||||||||||
| 13-18 months |
126,096 | 35,429 | — | 498,882 | 660,407 | 1.16 | % | |||||||||||||||||
| 19-24 months |
42,050 | 17,929 | — | 261,878 | 321,857 | 1.21 | % | |||||||||||||||||
| 24+ months |
111,879 | 25,074 | — | 516,952 | 653,905 | 2.08 | % | |||||||||||||||||
|
|
|
|
|
|
|
|
|
|
|
|
|
|||||||||||||
| Total |
$ | 590,267 | $ | 255,294 | $ | 166,307 | $ | 3,969,274 | 4,981,142 | 1.11 | % | |||||||||||||
|
|
|
|
|
|
|
|
|
|
|
|
|
|||||||||||||
| (1) | This category of certificates of deposit is shown by contractual maturity date. |
| (2) | This category includes variable rate certificates of deposit and savings certificates with the majority repricing on at least a monthly basis. |
| (3) | Weighted-average rate excludes the impact of purchase accounting fair value adjustments. |
20
NET INTEREST INCOME
The following table presents a summary of Wintrust’s average balances, net interest income and related net interest margins, calculated on a fully tax-equivalent basis, for the second quarter of 2012 compared to the second quarter of 2011 (linked quarters):
| For the Three Months
Ended June 30, 2012 |
For the Three Months Ended June 30, 2011 |
|||||||||||||||||||||||
| (Dollars in thousands) |
Average | Interest | Rate | Average | Interest | Rate | ||||||||||||||||||
| Liquidity management assets (1) (2) (7) |
$ | 2,781,730 | $ | 11,693 | 1.69 | % | $ | 2,591,398 | $ | 13,198 | 2.04 | % | ||||||||||||
| Other earning assets (2) (3) (7) |
30,761 | 233 | 3.04 | 28,886 | 208 | 2.89 | ||||||||||||||||||
| Loans, net of unearned income (2) (4) (7) |
11,300,395 | 130,293 | 4.64 | 9,859,789 | 124,047 | 5.05 | ||||||||||||||||||
| Covered loans |
659,783 | 13,943 | 8.50 | 418,129 | 8,400 | 8.06 | ||||||||||||||||||
|
|
|
|
|
|
|
|
|
|
|
|
|
|||||||||||||
| Total earning assets (7) |
$ | 14,772,669 | $ | 156,162 | 4.25 | % | $ | 12,898,202 | $ | 145,853 | 4.54 | % | ||||||||||||
|
|
|
|
|
|
|
|
|
|
|
|
|
|||||||||||||
| Allowance for loan and covered loan losses |
(134,077 | ) | (125,537 | ) | ||||||||||||||||||||
| Cash and due from banks |
152,118 | 135,670 | ||||||||||||||||||||||
| Other assets |
1,528,497 | 1,196,801 | ||||||||||||||||||||||
|
|
|
|
|
|||||||||||||||||||||
| Total assets |
$ | 16,319,207 | $ | 14,105,136 | ||||||||||||||||||||
|
|
|
|
|
|||||||||||||||||||||
| Interest-bearing deposits |
$ | 10,815,018 | $ | 17,273 | 0.64 | % | $ | 9,491,778 | $ | 22,404 | 0.95 | % | ||||||||||||
| Federal Home Loan Bank advances |
514,513 | 2,867 | 2.24 | 421,502 | 4,010 | 3.82 | ||||||||||||||||||
| Notes payable and other borrowings |
422,146 | 2,274 | 2.17 | 338,304 | 2,715 | 3.22 | ||||||||||||||||||
| Secured borrowings - owed to securitization investors |
407,259 | 1,743 | 1.72 | 600,000 | 2,994 | 2.00 | ||||||||||||||||||
| Subordinated notes |
23,791 | 126 | 2.10 | 45,440 | 194 | 1.69 | ||||||||||||||||||
| Junior subordinated notes |
249,493 | 3,138 | 4.97 | 249,493 | 4,422 | 7.01 | ||||||||||||||||||
|
|
|
|
|
|
|
|
|
|
|
|
|
|||||||||||||
| Total interest-bearing liabilities |
$ | 12,432,220 | $ | 27,421 | 0.89 | % | $ | 11,146,517 | $ | 36,739 | 1.32 | % | ||||||||||||
|
|
|
|
|
|
|
|
|
|
|
|
|
|||||||||||||
| Non-interest bearing deposits |
1,993,880 | 1,349,549 | ||||||||||||||||||||||
| Other liabilities |
197,667 | 148,999 | ||||||||||||||||||||||
| Equity |
1,695,440 | 1,460,071 | ||||||||||||||||||||||
|
|
|
|
|
|||||||||||||||||||||
| Total liabilities and shareholders’ equity |
$ | 16,319,207 | $ | 14,105,136 | ||||||||||||||||||||
|
|
|
|
|
|||||||||||||||||||||
| Interest rate spread (5) (7) |
3.36 | % | 3.22 | % | ||||||||||||||||||||
| Net free funds/contribution (6) |
$ | 2,340,449 | 0.15 | % | $ | 1,751,685 | 0.18 | % | ||||||||||||||||
|
|
|
|
|
|
|
|
|
|
|
|
|
|||||||||||||
| Net interest income/Net interest margin (7) |
$ | 128,741 | 3.51 | % | $ | 109,114 | 3.40 | % | ||||||||||||||||
|
|
|
|
|
|
|
|
|
|||||||||||||||||
| (1) | Liquidity management assets include available-for-sale securities, interest earning deposits with banks, federal funds sold and securities purchased under resale agreements. |
| (2) | Interest income on tax-advantaged loans, trading securities and securities reflects a tax-equivalent adjustment based on a marginal federal corporate tax rate of 35%. The total adjustments for the three months ended June 30, 2012 and 2011 were $471,000 and $408,000, respectively. |
| (3) | Other earning assets include brokerage customer receivables and trading account securities. |
| (4) | Loans, net of unearned income, include loans held-for-sale and non-accrual loans. |
| (5) | Interest rate spread is the difference between the yield earned on earning assets and the rate paid on interest-bearing liabilities. |
| (6) | Net free funds are the difference between total average earning assets and total average interest-bearing liabilities. The estimated contribution to net interest margin from net free funds is calculated using the rate paid for total interest-bearing liabilities. |
| (7) | See “Supplemental Financial Measures/Ratios” for additional information on this performance ratio. |
The 11 basis point increase in the second quarter of 2012 compared to the second quarter of 2011 was primarily attributable to a 31 basis point decline in the cost of interest-bearing deposits and a 95 basis point decline in the cost of wholesale borrowings over the last 12 months. Offsetting this was a 41 basis point decline in our yield on total loans as a result of an interest rate environment that has not been favorable for loan pricing in the banking industry.
The majority of covered loans are accounted for in accordance with ASC 310-30. As such, the yield on these loans at the acquisition date represents a fair value loan yield. In periods subsequent to the quarter of acquisition, the Company has experienced cash collections generally better than estimated for the initial valuation. Overall, expected losses have decreased and expected estimated lives have increased, which together have led to generally higher effective yields as estimated cash flows on the pools of loans have improved.
21
The following table presents a summary of Wintrust’s average balances, net interest income and related net interest margins, calculated on a fully tax-equivalent basis, for the second quarter of 2012 compared to the first quarter of 2012 (sequential quarters):
| For the Three Months
Ended June 30, 2012 |
For the Three Months Ended March 31, 2012 |
|||||||||||||||||||||||
| (Dollars in thousands) |
Average | Interest | Rate | Average | Interest | Rate | ||||||||||||||||||
| Liquidity management assets (1) (2) (7) |
$ | 2,781,730 | $ | 11,693 | 1.69 | % | $ | 2,756,833 | $ | 13,040 | 1.90 | % | ||||||||||||
| Other earning assets (2) (3) (7) |
30,761 | 233 | 3.04 | 30,499 | 224 | 2.96 | ||||||||||||||||||
| Loans, net of unearned income (2) (4) (7) |
11,300,395 | 130,293 | 4.64 | 10,848,016 | 128,784 | 4.77 | ||||||||||||||||||
| Covered loans |
659,783 | 13,943 | 8.50 | 667,242 | 14,904 | 8.98 | ||||||||||||||||||
|
|
|
|
|
|
|
|
|
|
|
|
|
|||||||||||||
| Total earning assets (7) |
$ | 14,772,669 | $ | 156,162 | 4.25 | % | $ | 14,302,590 | $ | 156,952 | 4.41 | % | ||||||||||||
|
|
|
|
|
|
|
|
|
|
|
|
|
|||||||||||||
| Allowance for loan and covered loan losses |
(134,077 | ) | (131,769 | ) | ||||||||||||||||||||
| Cash and due from banks |
152,118 | 143,869 | ||||||||||||||||||||||
| Other assets |
1,528,497 | 1,520,660 | ||||||||||||||||||||||
|
|
|
|
|
|||||||||||||||||||||
| Total assets |
$ | 16,319,207 | $ | 15,835,350 | ||||||||||||||||||||
|
|
|
|
|
|||||||||||||||||||||
| Interest-bearing deposits |
$ | 10,815,018 | $ | 17,273 | 0.64 | % | $ | 10,481,822 | $ | 18,030 | 0.69 | % | ||||||||||||
| Federal Home Loan Bank advances |
514,513 | 2,867 | 2.24 | 470,345 | 3,584 | 3.06 | ||||||||||||||||||
| Notes payable and other borrowings |
422,146 | 2,274 | 2.17 | 505,814 | 3,102 | 2.47 | ||||||||||||||||||
| Secured borrowings - owed to securitization investors |
407,259 | 1,743 | 1.72 | 514,923 | 2,549 | 1.99 | ||||||||||||||||||
| Subordinated notes |
23,791 | 126 | 2.10 | 35,000 | 169 | 1.91 | ||||||||||||||||||
| Junior subordinated notes |
249,493 | 3,138 | 4.97 | 249,493 | 3,157 | 5.01 | ||||||||||||||||||
|
|
|
|
|
|
|
|
|
|
|
|
|
|||||||||||||
| Total interest-bearing liabilities |
$ | 12,432,220 | $ | 27,421 | 0.89 | % | $ | 12,257,397 | $ | 30,591 | 1.00 | % | ||||||||||||
|
|
|
|
|
|
|
|
|
|
|
|
|
|||||||||||||
| Non-interest bearing deposits |
1,993,880 | 1,832,627 | ||||||||||||||||||||||
| Other liabilities |
197,667 | 180,664 | ||||||||||||||||||||||
| Equity |
1,695,440 | 1,564,662 | ||||||||||||||||||||||
|
|
|
|
|
|||||||||||||||||||||
| Total liabilities and shareholders’ equity |
$ | 16,319,207 | $ | 15,835,350 | ||||||||||||||||||||
|
|
|
|
|
|||||||||||||||||||||
| Interest rate spread (5) (7) |
3.36 | % | 3.41 | % | ||||||||||||||||||||
| Net free funds/contribution (6) |
$ | 2,340,449 | 0.15 | % | $ | 2,045,193 | 0.14 | % | ||||||||||||||||
|
|
|
|
|
|
|
|
|
|
|
|
|
|||||||||||||
| Net interest income/Net interest margin (7) |
$ | 128,741 | 3.51 | % | $ | 126,361 | 3.55 | % | ||||||||||||||||
|
|
|
|
|
|
|
|
|
|||||||||||||||||
| (1) | Liquidity management assets include available-for-sale securities, interest earning deposits with banks, federal funds sold and securities purchased under resale agreements. |
| (2) | Interest income on tax-advantaged loans, trading securities and securities reflects a tax-equivalent adjustment based on a marginal federal corporate tax rate of 35%. The total adjustments for the three months ended June 30, 2012 was $471,000 and for the three months ended March 31, 2012 was $466,000. |
| (3) | Other earning assets include brokerage customer receivables and trading account securities. |
| (4) | Loans, net of unearned income, include loans held-for-sale and non-accrual loans. |
| (5) | Interest rate spread is the difference between the yield earned on earning assets and the rate paid on interest-bearing liabilities. |
| (6) | Net free funds are the difference between total average earning assets and total average interest-bearing liabilities. The estimated contribution to net interest margin from net free funds is calculated using the rate paid for total interest-bearing liabilities. |
| (7) | See “Supplemental Financial Measures/Ratios” for additional information on this performance ratio. |
The four basis point decrease in net interest margin in the second quarter of 2012 compared to the first quarter of 2012 resulted from lower yields on liquidity management assets and loans partially offset by the positive re-pricing of retail interest-bearing deposits along with a more favorable deposit mix.
22
The following table presents a summary of Wintrust’s average balances, net interest income and related net interest margins, calculated on a fully tax-equivalent basis, for the six months ended June 30, 2012 compared to the six months ended June 30, 2011:
| For the Six Months Ended June 30, 2012 |
For the Six Months Ended June 30, 2011 |
|||||||||||||||||||||||
| (Dollars in thousands) |
Average | Interest | Rate | Average | Interest | Rate | ||||||||||||||||||
| Liquidity management assets (1) (2) (7) |
$ | 2,769,282 | $ | 24,733 | 1.80 | % | $ | 2,608,863 | $ | 24,552 | 1.90 | % | ||||||||||||
| Other earning assets (2) (3) (7) |
30,631 | 457 | 3.00 | 28,305 | 389 | 2.77 | ||||||||||||||||||
| Loans, net of unearned income (2) (4) (7) |
11,074,205 | 259,077 | 4.70 | 9,854,578 | 253,634 | 5.19 | ||||||||||||||||||
| Covered loans |
663,512 | 28,847 | 8.74 | 372,608 | 15,472 | 8.37 | ||||||||||||||||||
|
|
|
|
|
|
|
|
|
|
|
|
|
|||||||||||||
| Total earning assets (7) |
$ | 14,537,630 | $ | 313,114 | 4.33 | % | $ | 12,864,354 | $ | 294,047 | 4.61 | % | ||||||||||||
|
|
|
|
|
|
|
|
|
|
|
|
|
|||||||||||||
| Allowance for loan and covered loan losses |
(132,923 | ) | (122,093 | ) | ||||||||||||||||||||
| Cash and due from banks |
147,993 | 143,921 | ||||||||||||||||||||||
| Other assets |
1,524,579 | 1,173,157 | ||||||||||||||||||||||
|
|
|
|
|
|||||||||||||||||||||
| Total assets |
$ | 16,077,279 | $ | 14,059,339 | ||||||||||||||||||||
|
|
|
|
|
|||||||||||||||||||||
| Interest-bearing deposits |
$ | 10,648,420 | $ | 35,303 | 0.67 | % | $ | 9,514,337 | $ | 46,360 | 0.98 | % | ||||||||||||
| Federal Home Loan Bank advances |
492,429 | 6,451 | 2.63 | 418,777 | 7,968 | 3.84 | ||||||||||||||||||
| Notes payable and other borrowings |
463,980 | 5,376 | 2.33 | 302,540 | 5,345 | 3.56 | ||||||||||||||||||
| Secured borrowings - owed to securitization investors |
461,091 | 4,292 | 1.87 | 600,000 | 6,034 | 2.03 | ||||||||||||||||||
| Subordinated notes |
29,396 | 295 | 1.98 | 47,707 | 406 | 1.69 | ||||||||||||||||||
| Junior subordinated notes |
249,493 | 6,295 | 4.99 | 249,493 | 8,792 | 7.01 | ||||||||||||||||||
|
|
|
|
|
|
|
|
|
|
|
|
|
|||||||||||||
| Total interest-bearing liabilities |
$ | 12,344,809 | $ | 58,012 | 0.94 | % | $ | 11,132,854 | $ | 74,905 | 1.35 | % | ||||||||||||
|
|
|
|
|
|
|
|
|
|
|
|
|
|||||||||||||
| Non-interest bearing deposits |
1,913,253 | 1,305,705 | ||||||||||||||||||||||
| Other liabilities |
189,166 | 171,749 | ||||||||||||||||||||||
| Equity |
1,630,051 | 1,449,031 | ||||||||||||||||||||||
|
|
|
|
|
|||||||||||||||||||||
| Total liabilities and shareholders’ equity |
$ | 16,077,279 | $ | 14,059,339 | ||||||||||||||||||||
|
|
|
|
|
|||||||||||||||||||||
| Interest rate spread (5) (7) |
3.39 | % | 3.26 | % | ||||||||||||||||||||
| Net free funds/contribution (6) |
$ | 2,192,821 | 0.14 | % | $ | 1,731,500 | 0.18 | % | ||||||||||||||||
|
|
|
|
|
|
|
|
|
|
|
|
|
|||||||||||||
| Net interest income/Net interest margin (7) |
$ | 255,102 | 3.53 | % | $ | 219,142 | 3.44 | % | ||||||||||||||||
|
|
|
|
|
|
|
|
|
|||||||||||||||||
| (1) | Liquidity management assets include available-for-sale securities, interest earning deposits with banks, federal funds sold and securities purchased under resale agreements. |
| (2) | Interest income on tax-advantaged loans, trading securities and securities reflects a tax-equivalent adjustment based on a marginal federal corporate tax rate of 35%. The total adjustments for both of the six months ended June 30, 2012 and 2011 were $937,000 and $822,000, respectively. |
| (3) | Other earning assets include brokerage customer receivables and trading account securities. |
| (4) | Loans, net of unearned income, include loans held-for-sale and non-accrual loans. |
| (5) | Interest rate spread is the difference between the yield earned on earning assets and the rate paid on interest-bearing liabilities. |
| (6) | Net free funds are the difference between total average earning assets and total average interest-bearing liabilities. The estimated contribution to net interest margin from net free funds is calculated using the rate paid for total interest-bearing liabilities. |
| (7) | See “Supplemental Financial Measures/Ratios” for additional information on this performance ratio. |
The net interest margin for the first six months of 2012 was 3.53% compared to 3.44% in the first six months of 2011. Average earnings assets for the first six months of 2012 totaled $14.5 billion, an increase of $1.7 billion compared to the prior year period. This average earning asset growth is primarily a result of the $1.2 billion increase in average loans, excluding covered loans, $290.9 million of average covered loan growth from the FDIC-assisted bank acquisitions and a $162.7 million increase in liquidity management and other earning assets. The majority of the increase in average loans was comprised of increases of $528.2 million in commercial loans, $204.8 million in commercial real estate loans, $310.1 million in premium finance receivables and $200.4 million in residential real estate loans, partially offset by a $23.9 million decrease in home equity and all other loans. The average earning asset growth of $1.7 billion in the first six months of 2012 compared to the prior year period was primarily funded by a $1.1 billion increase in the average balances of interest-bearing deposits and an increase in the average balance of net free funds of $461.3 million.
23
NON-INTEREST INCOME
For the second quarter of 2012, non-interest income totaled $50.9 million, an increase of $14.3 million, or 39%, compared to the second quarter of 2011. The increase was primarily attributable to higher mortgage banking revenues and wealth management revenues, partially offset by a decrease in bargain purchase gains and trading losses. On a year-to-date basis, non-interest income for the first six months of 2012 totaled $98.0 million and increased $20.4 million, or 26%, compared to the same period in 2011.
The following table presents non-interest income by category for the periods presented:
| Three Months Ended June 30, |
$ | % | ||||||||||||||
| (Dollars in thousands) |
2012 | 2011 | Change | Change | ||||||||||||
| Brokerage |
$ | 6,396 | $ | 6,208 | $ | 188 | 3 | |||||||||
| Trust and asset management |
6,997 | 4,393 | 2,604 | 59 | ||||||||||||
|
|
|
|
|
|
|
|
|
|||||||||
| Total wealth management |
13,393 | 10,601 | 2,792 | 26 | ||||||||||||
|
|
|
|
|
|
|
|
|
|||||||||
| Mortgage banking |
25,607 | 12,817 | 12,790 | 100 | ||||||||||||
| Service charges on deposit accounts |
3,994 | 3,594 | 400 | 11 | ||||||||||||
| Gains on available-for-sale securities, net |
1,109 | 1,152 | (43 | ) | (4 | ) | ||||||||||
| Gain on bargain purchases, net |
(55 | ) | 746 | (801 | ) | NM | ||||||||||
| Trading losses, net |
(928 | ) | (30 | ) | (898 | ) | NM | |||||||||
| Other: |
||||||||||||||||
| Fees from covered call options |
3,114 | 2,287 | 827 | 36 | ||||||||||||
| Bank Owned Life Insurance |
505 | 661 | (156 | ) | (24 | ) | ||||||||||
| Administrative services |
823 | 781 | 42 | 5 | ||||||||||||
| Miscellaneous |
3,373 | 4,043 | (670 | ) | (17 | ) | ||||||||||
|
|
|
|
|
|
|
|
|
|||||||||
| Total Other |
7,815 | 7,772 | 43 | 1 | ||||||||||||
|
|
|
|
|
|
|
|
|
|||||||||
| Total Non-Interest Income |
$ | 50,935 | $ | 36,652 | $ | 14,283 | 39 | |||||||||
|
|
|
|
|
|
|
|
|
|||||||||
NM – Not Meaningful
| Six Months Ended June 30, |
$ | % | ||||||||||||||
| (Dollars in thousands) |
2012 | 2011 | Change | Change | ||||||||||||
| Brokerage |
$ | 12,718 | $ | 12,533 | $ | 185 | 1 | |||||||||
| Trust and asset management |
13,076 | 8,304 | 4,772 | 57 | ||||||||||||
|
|
|
|
|
|
|
|
|
|||||||||
| Total wealth management |
25,794 | 20,837 | 4,957 | 24 | ||||||||||||
|
|
|
|
|
|
|
|
|
|||||||||
| Mortgage banking |
44,141 | 24,448 | 19,693 | 81 | ||||||||||||
| Service charges on deposit accounts |
8,202 | 6,905 | 1,297 | 19 | ||||||||||||
| Gains on available-for-sale securities, net |
1,925 | 1,258 | 667 | 53 | ||||||||||||
| Gain on bargain purchases, net |
785 | 10,584 | (9,799 | ) | (93 | ) | ||||||||||
| Trading losses, net |
(782 | ) | (470 | ) | (312 | ) | 66 | |||||||||
| Other: |
||||||||||||||||
| Fees from covered call options |
6,237 | 4,757 | 1,480 | 31 | ||||||||||||
| Bank Owned Life Insurance |
1,424 | 1,537 | (113 | ) | (7 | ) | ||||||||||
| Administrative services |
1,589 | 1,498 | 91 | 6 | ||||||||||||
| Miscellaneous |
8,643 | 6,185 | 2,458 | 40 | ||||||||||||
|
|
|
|
|
|
|
|
|
|||||||||
| Total Other |
17,893 | 13,977 | 3,916 | 28 | ||||||||||||
|
|
|
|
|
|
|
|
|
|||||||||
| Total Non-Interest Income |
$ | 97,958 | $ | 77,539 | $ | 20,419 | 26 | |||||||||
|
|
|
|
|
|
|
|
|
|||||||||
NM – Not Meaningful
The significant changes in non-interest income for the quarter ended June 30, 2012 compared to the quarter ended June 30, 2011 are discussed below.
Wealth management revenue totaled $13.4 million in the second quarter of 2012 and $10.6 million in the second quarter of 2011, an increase of 26%. The increase is mostly attributable to additional revenues resulting from the acquisition of Great Lakes Advisors in the third quarter of 2011 and the acquisition of a community bank trust operation on March 30, 2012. Wealth management revenue is comprised of the trust and asset management revenue of The Chicago Trust Company and Great Lakes Advisors and the brokerage commissions, money managed fees and insurance product commissions at Wayne Hummer Investments.
24
For the quarter ended June 30, 2012, mortgage banking revenue totaled $25.6 million, an increase of $12.8 million when compared to the second quarter of 2011. The increase in mortgage banking revenue in the second quarter of 2012 as compared to the second quarter of 2011 resulted primarily from an increase in gain on sales of loans, which were driven by higher origination volumes due to a favorable mortgage interest rate environment in 2012 and better pricing in the current quarter. Mortgage banking revenue includes revenue from activities related to originating, selling and servicing residential real estate loans for the secondary market.
A summary of mortgage banking components is shown below:
| Mortgage banking revenue | ||||||||||||||||||||
| Three Months Ended | Six Months Ended | |||||||||||||||||||
| (Dollars in thousands) |
June 30, 2012 |
March 31, 2012 |
June 30, 2011 |
June 30, 2012 |
June 30, 2011 |
|||||||||||||||
| Mortgage loans originated and sold |
$ | 853,585 | $ | 714,655 | $ | 458,538 | $ | 1,568,240 | $ | 1,020,626 | ||||||||||
| Mortgage loans serviced for others |
$ | 980,534 | $ | 963,514 | $ | 943,542 | ||||||||||||||
| Fair value of mortgage servicing rights (MSRs) |
$ | 6,647 | $ | 7,201 | $ | 8,762 | ||||||||||||||
| MSRs as a percentage of loans serviced |
0.68 | % | 0.75 | % | 0.93 | % | ||||||||||||||
Increased originations in the current quarter as compared to the second quarter of 2011 were primarily the result of a favorable mortgage banking interest rate environment.
The Company recognized $928,000 in trading losses in the second quarter of 2012 compared to trading losses of $30,000 in the second quarter of 2011. The increase in trading losses resulted primarily from fair value adjustments related to interest rate derivatives not designated as hedges, primarily an interest rate cap that the Company uses to manage interest rate risk associated with rising rates on various fixed rate, longer term earning assets.
Other non-interest income for the second quarter of 2012 totaled $7.8 million, essentially unchanged from the second quarter of 2011. Fees from certain covered call option transactions increased by $827,000 in the second quarter of 2012 as compared to the same period in the prior year. Historically, compression in the net interest margin was effectively offset by the Company’s covered call strategy. An illustration of the past effectiveness of this strategy is shown in the Supplemental Financial Information section (see page titled “Net Interest Margin (Including Call Option Income)”). Miscellaneous income decreased in the second quarter of 2012 compared to the prior year quarter as a result of decreased income from accretion and adjustments to the FDIC loss share assets, a loss on sale of property, and decreased ATM fees, partially offset by increased swap fee revenue. The swap fee revenue recognized on this customer-based activity is a function of the pace of organic loan growth, the shape of the LIBOR curve and the customers’ expectations of interest rates.
25
NON-INTEREST EXPENSE
Non-interest expense for the second quarter of 2012 totaled $117.2 million and increased approximately $20.0 million, or 21%, compared to the second quarter of 2011. On a year-to-date basis, non-interest expense for the first six months of 2012 totaled $234.9 million and increased $39.6 million, or 20%, compared to the same period in 2011.
The following table presents non-interest expense by category for the periods presented:
| Three Months Ended June 30, |
$ | % | ||||||||||||||
| (Dollars in thousands) |
2012 | 2011 | Change | Change | ||||||||||||
| Salaries and employee benefits: |
||||||||||||||||
| Salaries |
$ | 37,237 | $ | 32,008 | 5,229 | 16 | ||||||||||
| Commissions and bonus |
19,388 | 10,760 | 8,628 | 80 | ||||||||||||
| Benefits |
11,514 | 10,311 | 1,203 | 12 | ||||||||||||
|
|
|
|
|
|
|
|
|
|||||||||
| Total salaries and employee benefits |
68,139 | 53,079 | 15,060 | 28 | ||||||||||||
| Equipment |
5,466 | 4,409 | 1,057 | 24 | ||||||||||||
| Occupancy, net |
7,728 | 6,772 | 956 | 14 | ||||||||||||
| Data processing |
3,840 | 3,147 | 693 | 22 | ||||||||||||
| Advertising and marketing |
2,179 | 1,440 | 739 | 51 | ||||||||||||
| Professional fees |
3,847 | 4,533 | (686 | ) | (15 | ) | ||||||||||
| Amortization of other intangible assets |
1,089 | 704 | 385 | 55 | ||||||||||||
| FDIC insurance |
3,477 | 3,281 | 196 | 6 | ||||||||||||
| OREO expenses, net |
5,848 | 6,577 | (729 | ) | (11 | ) | ||||||||||
| Other: |
||||||||||||||||
| Commissions - 3rd party brokers |
1,069 | 991 | 78 | 8 | ||||||||||||
| Postage |
1,330 | 1,170 | 160 | 14 | ||||||||||||
| Stationery and supplies |
1,035 | 888 | 147 | 17 | ||||||||||||
| Miscellaneous |
12,138 | 10,215 | 1,923 | 19 | ||||||||||||
|
|
|
|
|
|
|
|
|
|||||||||
| Total other |
15,572 | 13,264 | 2,308 | 17 | ||||||||||||
|
|
|
|
|
|
|
|
|
|||||||||
| Total Non-Interest Expense |
$ | 117,185 | $ | 97,206 | $ | 19,979 | 21 | |||||||||
|
|
|
|
|
|
|
|
|
|||||||||
| Six Months Ended June 30, |
$ | % | ||||||||||||||
| (Dollars in thousands) |
2012 | 2011 | Change | Change | ||||||||||||
| Salaries and employee benefits: |
||||||||||||||||
| Salaries |
$ | 75,170 | $ | 65,143 | 10,027 | 15 | ||||||||||
| Commissions and bonus |
36,190 | 21,474 | 14,716 | 69 | ||||||||||||
| Benefits |
25,809 | 22,561 | 3,248 | 14 | ||||||||||||
|
|
|
|
|
|
|
|
|
|||||||||
| Total salaries and employee benefits |
137,169 | 109,178 | 27,991 | 26 | ||||||||||||
| Equipment |
10,866 | 8,673 | 2,193 | 25 | ||||||||||||
| Occupancy, net |
15,790 | 13,277 | 2,513 | 19 | ||||||||||||
| Data processing |
7,458 | 6,670 | 788 | 12 | ||||||||||||
| Advertising and marketing |
4,185 | 3,054 | 1,131 | 37 | ||||||||||||
| Professional fees |
7,451 | 8,079 | (628 | ) | (8 | ) | ||||||||||
| Amortization of other intangible assets |
2,138 | 1,393 | 745 | 53 | ||||||||||||
| FDIC insurance |
6,834 | 7,799 | (965 | ) | (12 | ) | ||||||||||
| OREO expenses, net |
13,026 | 12,385 | 641 | 5 | ||||||||||||
| Other: |
||||||||||||||||
| Commissions - 3rd party brokers |
2,090 | 2,021 | 69 | 3 | ||||||||||||
| Postage |
2,753 | 2,248 | 505 | 22 | ||||||||||||
| Stationery and supplies |
1,954 | 1,728 | 226 | 13 | ||||||||||||
| Miscellaneous |
23,230 | 18,810 | 4,420 | 23 | ||||||||||||
|
|
|
|
|
|
|
|
|
|||||||||
| Total other |
30,027 | 24,807 | 5,220 | 21 | ||||||||||||
|
|
|
|
|
|
|
|
|
|||||||||
| Total Non-Interest Expense |
$ | 234,944 | $ | 195,315 | $ | 39,629 | 20 | |||||||||
|
|
|
|
|
|
|
|
|
|||||||||
The significant changes in non-interest expense for the quarter ended June 30, 2012 compared to the quarter ended June 30, 2011 are discussed below.
Salaries and employee benefits comprised 58% of total non-interest expense in the second quarter of 2012 as compared to 55% in the second quarter of 2011. Salaries and employee benefits expense increased $15.1 million, or 28%, in the second quarter of 2012 compared to the second quarter of 2011 primarily as a result of a $5.2 million increase in salaries
26
caused by the addition of employees from the various acquisitions and larger staffing as the Company grows, an $8.7 million increase in bonus and commissions primarily attributable to the increase in variable pay based revenue and the Company’s long-term incentive program and a $1.2 million increase from employee benefits (primarily health plan and payroll taxes related).
Equipment expense totaled $5.5 million for the second quarter of 2012, an increase of $1.1 million compared to the second quarter of 2011. The increase is primarily the result of additional equipment depreciation as well as maintenance and repair costs associated with the increasing number of facilities due to acquisition activity. Equipment expense includes depreciation on equipment, maintenance and repairs, equipment rental and software license fees.
Occupancy expense for the second quarter of 2012 was $7.7 million, an increase of $1.0 million, or 14%, compared to the same period in 2011. The increase is primarily the result of rent expense on additional leased premises and depreciation and property taxes on owned locations which were obtained in the FDIC-assisted acquisitions. Occupancy expense includes depreciation on premises, real estate taxes, utilities and maintenance of premises, as well as net rent expense for leased premises.
OREO expense totaled $5.8 million in the second quarter of 2012, a decrease of $729,000 compared to $6.6 million in the second quarter of 2011. The decrease in total OREO expenses is primarily related to decreased OREO costs partially offset by higher valuation adjustments of properties held in OREO in the second quarter of 2012 as compared to the second quarter of 2011. OREO costs include all costs related to obtaining, maintaining and selling other real estate owned properties.
Miscellaneous expenses in the second quarter of 2012 increased $1.9 million, or 19% compared to the same period in the prior year. The increase in the second quarter of 2012 compared to the same period in the prior year is attributable to increased expenses related to covered loans, general growth in the Company’s business and costs incurred for defeasance of secured borrowings owed to securitization investors in the second quarter of 2012. Miscellaneous expense includes ATM expenses, correspondent bank charges, directors’ fees, telephone, travel and entertainment, corporate insurance, dues and subscriptions, problem loan expenses and lending origination costs that are not deferred.
As previously discussed in this release, the accounting and reporting policies of Wintrust conform to GAAP in the United States and prevailing practices in the banking industry. However, certain non-GAAP performance measures and ratios are used by management to evaluate and measure the Company’s performance. One significant metric that is used by the Company in assessing operating performance is pre-tax adjusted earnings. Pre-tax adjusted earnings is calculated by adjusting income before taxes to exclude the provision for credit losses and certain significant items. Two ratios the Company uses to measure expense management are the efficiency ratio and the net overhead ratio. The efficiency ratio, which is calculated by dividing non-interest expense by total taxable-equivalent net revenue (less securities gains and losses), measures how much it costs to produce one dollar of revenue. The net overhead ratio is calculated by netting total non-interest expense and total non-interest income and dividing by total average assets. In both cases, a lower ratio indicates a higher degree of efficiency. See “Supplemental Financial Measures/Ratios” section earlier in this document for further detail on these non-GAAP measures/ratios.
The efficiency ratio and net overhead ratio are primarily reviewed by the Company based on pre-tax adjusted earnings. The Company believes that these measures provide a more meaningful view of the Company’s operating efficiency and expense management. The efficiency ratio, based on pre-tax adjusted earnings, was 61.38% for the second quarter of 2012, compared to 62.81% in the second quarter of 2011. The net overhead ratio, based on pre-tax adjusted earnings, was 1.46% in the second quarter of 2012, compared to 1.59% in the second quarter of 2011. These lower ratios indicate a higher degree of efficiency in the second quarter of 2012 as compared to the prior year quarter as the Company has leveraged its existing infrastructure.
27
ASSET QUALITY
Allowance for Credit Losses, excluding covered loans
| Three Months Ended June 30, |
Six Months Ended June 30, |
|||||||||||||||
| (Dollars in thousands) |
2012 | 2011 | 2012 | 2011 | ||||||||||||
| Allowance for loan losses at beginning of period |
$ | 111,023 | $ | 115,049 | $ | 110,381 | $ | 113,903 | ||||||||
| Provision for credit losses |
18,394 | 28,666 | 33,548 | 53,042 | ||||||||||||
| Other adjustments |
(272 | ) | — | (510 | ) | — | ||||||||||
| Reclassification from/(to) allowance for unfunded lending-related commitments |
175 | (317 | ) | 327 | 1,799 | |||||||||||
| Charge-offs: |
||||||||||||||||
| Commercial |
6,046 | 7,583 | 9,308 | 16,723 | ||||||||||||
| Commercial real estate |
9,226 | 20,691 | 17,455 | 34,033 | ||||||||||||
| Home equity |
1,732 | 1,300 | 4,322 | 2,073 | ||||||||||||
| Residential real estate |
388 | 282 | 563 | 1,557 | ||||||||||||
| Premium finance receivables - commercial |
744 | 1,893 | 1,581 | 3,400 | ||||||||||||
| Premium finance receivables - life insurance |
3 | 214 | 16 | 244 | ||||||||||||
| Indirect consumer |
33 | 44 | 84 | 164 | ||||||||||||
| Consumer and other |
51 | 266 | 361 | 426 | ||||||||||||
|
|
|
|
|
|
|
|
|
|||||||||
| Total charge-offs |
18,223 | 32,273 | 33,690 | 58,620 | ||||||||||||
|
|
|
|
|
|
|
|
|
|||||||||
| Recoveries: |
||||||||||||||||
| Commercial |
246 | 301 | 503 | 567 | ||||||||||||
| Commercial real estate |
174 | 463 | 305 | 801 | ||||||||||||
| Home equity |
171 | 19 | 333 | 27 | ||||||||||||
| Residential real estate |
3 | 3 | 5 | 5 | ||||||||||||
| Premium finance receivables - commercial |
153 | 5,375 | 430 | 5,643 | ||||||||||||
| Premium finance receivables - life insurance |
18 | 12 | 39 | 12 | ||||||||||||
| Indirect consumer |
21 | 42 | 51 | 108 | ||||||||||||
| Consumer and other |
37 | 22 | 198 | 75 | ||||||||||||
|
|
|
|
|
|
|
|
|
|||||||||
| Total recoveries |
823 | 6,237 | 1,864 | 7,238 | ||||||||||||
|
|
|
|
|
|
|
|
|
|||||||||
| Net charge-offs |
(17,400 | ) | (26,036 | ) | (31,826 | ) | (51,382 | ) | ||||||||
| Allowance for loan losses at period end |
$ | 111,920 | $ | 117,362 | $ | 111,920 | $ | 117,362 | ||||||||
| Allowance for unfunded lending-related commitments at period end |
12,903 | 2,335 | 12,903 | 2,335 | ||||||||||||
|
|
|
|
|
|
|
|
|
|||||||||
| Allowance for credit losses at period end |
$ | 124,823 | $ | 119,697 | $ | 124,823 | $ | 119,697 | ||||||||
|
|
|
|
|
|
|
|
|
|||||||||
| Annualized net charge-offs by category as a percentage of its own respective category’s average: |
||||||||||||||||
| Commercial |
0.91 | % | 1.45 | % | 0.71 | % | 1.65 | % | ||||||||
| Commercial real estate |
1.01 | 2.40 | 0.97 | 1.99 | ||||||||||||
| Home equity |
0.76 | 0.58 | 0.95 | 0.46 | ||||||||||||
| Residential real estate |
0.20 | 0.25 | 0.16 | 0.62 | ||||||||||||
| Premium finance receivables - commercial |
0.14 | (0.99 | ) | 0.15 | (0.33 | ) | ||||||||||
| Premium finance receivables - life insurance |
— | 0.05 | — | 0.03 | ||||||||||||
| Indirect consumer |
0.07 | 0.02 | 0.10 | 0.21 | ||||||||||||
| Consumer and other |
0.05 | 0.98 | 0.27 | 0.69 | ||||||||||||
|
|
|
|
|
|
|
|
|
|||||||||
| Total loans, net of unearned income, excluding covered loans |
0.62 | % | 1.06 | % | 0.58 | % | 1.05 | % | ||||||||
|
|
|
|
|
|
|
|
|
|||||||||
| Net charge-offs as a percentage of the provision for credit losses |
94.60 | % | 90.83 | % | 94.87 | % | 96.87 | % | ||||||||
| Loans at period-end |
$ | 11,202,842 | $ | 9,925,077 | ||||||||||||
| Allowance for loan losses as a percentage of loans at period end |
1.00 | % | 1.18 | % | ||||||||||||
| Allowance for unfunded lending-related commitments as a percentage of loans at period end |
0.11 | 0.03 | ||||||||||||||
|
|
|
|
|
|||||||||||||
| Allowance for credit losses as a percentage of loans at period end |
1.11 | % | 1.21 | % | ||||||||||||
|
|
|
|
|
|||||||||||||
28
The table below summarizes the calculation of allowance for loan losses for the Company’s core loan portfolio and niche and purchased loan portfolio as of June 30, 2012.
| As of June 30, 2012 | ||||||||||||
| (Dollars in thousands) |
Recorded Investment |
Calculated Allowance |
As a percentage of its own respective category’s balance |
|||||||||
| Commercial: |
||||||||||||
| Commercial and industrial (1) |
$ | 1,612,527 | $ | 17,477 | 1.08 | % | ||||||
| Asset-based lending (1) |
487,830 | 5,457 | 1.12 | |||||||||
| Municipal |
79,708 | 784 | 0.98 | |||||||||
| Leases |
77,806 | 241 | 0.31 | |||||||||
| Other |
1,842 | 13 | 0.71 | |||||||||
| Commercial real-estate: |
||||||||||||
| Residential construction |
44,726 | 1,215 | 2.72 | |||||||||
| Commercial construction (1) |
156,150 | 3,666 | 2.35 | |||||||||
| Land |
165,269 | 6,848 | 4.14 | |||||||||
| Office (1) |
555,968 | 6,176 | 1.11 | |||||||||
| Industrial (1) |
593,033 | 5,721 | 0.96 | |||||||||
| Retail (1) |
556,958 | 5,940 | 1.07 | |||||||||
| Multi-family (1) |
336,565 | 9,624 | 2.86 | |||||||||
| Mixed use and other (1) |
1,152,100 | 14,611 | 1.27 | |||||||||
| Home equity (1) |
811,571 | 13,878 | 1.71 | |||||||||
| Residential real-estate (1) |
372,450 | 6,724 | 1.81 | |||||||||
|
|
|
|
|
|
|
|||||||
| Total core loan portfolio |
$ | 7,004,503 | $ | 98,375 | 1.40 | % | ||||||
|
|
|
|
|
|
|
|||||||
| Commercial: |
||||||||||||
| Franchise |
$ | 178,619 | $ | 1,764 | 0.99 | % | ||||||
| Mortgage warehouse lines of credit |
123,804 | 913 | 0.74 | |||||||||
| Community Advantage - homeowner associations |
73,289 | 183 | 0.25 | |||||||||
| Aircraft |
22,803 | 151 | 0.66 | |||||||||
| Purchased non-covered commercial loans (2) |
14,953 | — | — | |||||||||
| Commercial real-estate: |
||||||||||||
| Purchased non-covered commercial real-estate (2) |
105,750 | — | — | |||||||||
| Purchased non-covered home equity (2) |
9,420 | — | — | |||||||||
| Purchased non-covered residential real-estate (2) |
3,044 | — | — | |||||||||
| Premium finance receivables |
||||||||||||
| Commercial insurance loans |
1,830,044 | 7,410 | 0.40 | |||||||||
| Life insurance loans (1) |
1,111,237 | 1,112 | 0.10 | |||||||||
| Purchased life insurance loans (2) |
544,963 | — | — | |||||||||
| Indirect consumer |
72,482 | 640 | 0.88 | |||||||||
| Consumer and other (1) |
105,946 | 1,372 | 1.29 | |||||||||
| Purchased non-covered consumer and other (2) |
1,985 | — | — | |||||||||
|
|
|
|
|
|
|
|||||||
| Total niche and purchased loan portfolio |
$ | 4,198,339 | $ | 13,545 | 0.32 | % | ||||||
|
|
|
|
|
|
|
|||||||
| Total loans, net of unearned income, excluding covered loans |
$ | 11,202,842 | $ | 111,920 | 1.00 | % | ||||||
|
|
|
|
|
|
|
|||||||
| (1) | Excludes purchased loans reported in accordance with ASC 310-20 and ASC 310-30. |
| (2) | Purchased loans represent loans reported in accordance with ASC 310-20 and ASC 310-30. |
29
The allowance for credit losses, excluding the allowance for covered loan losses, is comprised of the allowance for loan losses and the allowance for unfunded lending-related commitments. The allowance for loan losses is a reserve against loan amounts that are actually funded and outstanding while the allowance for unfunded lending-related commitments (separate liability account) relates to certain amounts that Wintrust is committed to lend but for which funds have not yet been disbursed. The provision for credit losses, excluding the provision for covered loan losses, may contain both a component related to funded loans (provision for loan losses) and a component related to lending-related commitments (provision for unfunded loan commitments and letters of credit). Total credit-related reserves also include the credit discounts on the purchased life insurance premium finance receivables which are netted with the loan balance.
The provision for credit losses, excluding the provision for covered loan losses, totaled $18.4 million for the second quarter of 2012, $15.2 million for the first quarter of 2012 and $28.7 million for the second quarter of 2011. For the quarter ended June 30, 2012, net charge-offs, excluding covered loans, totaled $17.4 million compared to $14.4 million in the first quarter of 2012 and $26.0 million recorded in the second quarter of 2011. Annualized net charge-offs as a percentage of average loans, excluding covered loans, were 0.62% in the second quarter of 2012, 0.53% in the first quarter of 2012 and 1.06% in the second quarter of 2011. The lower level of provision for credit losses and the allowance for credit losses in 2012, reflect the improvements in credit quality metrics compared to 2011.
Management believes the allowance for credit losses is appropriate to provide for inherent losses in the portfolio. There can be no assurances however, that future losses will not exceed the amounts provided for, thereby affecting future results of operations. The amount of future additions to the allowance for credit losses will be dependent upon management’s assessment of the appropriateness of the allowance based on its evaluation of economic conditions, changes in real estate values, interest rates, the regulatory environment, the level of past-due and non-performing loans, and other factors. The increase in the allowance for credit losses from the end of the prior quarter reflects the continued changes in real estate values on certain types of credits, specifically credits with residential development collateral valuation exposure and loan growth.
As part of a quarterly review performed by management to determine if the Company’s allowance for loan losses is appropriate, an analysis is prepared on the loan portfolio based upon a breakout of core loans and niche loans. A summary of the allowance for loan losses calculated for the loan components in both the core loan portfolio and the niche loan portfolio is shown on the previous page. The allowance for loan losses to core loans was 1.40% at June 30, 2012 compared to 0.32% for niche loans and 1.00% for the entire loan portfolio. Outstanding core loans at June 30, 2012 represent 63% of all loans outstanding while the calculated allowance for loan losses on core loans represents 88% of the total allowance for loan losses. A key component of calculating the allowance for loan losses and determining the appropriateness of the allowance for loan losses at quarter-end is historical net charge-offs. Over the past three years, 89% of all net charge-offs have occurred in the core loan portfolio.
The Company also provides a provision for covered loan losses on covered loans and an allowance for covered loan losses on covered loans. Please see “Covered Assets” later in this document for more detail.
30
The table below shows the aging of the Company’s loan portfolio, excluding covered loans, at June 30, 2012:
| As of June 30, 2012 (Dollars in thousands) |
Nonaccrual | 90+ days and still accruing |
60-89 days past due |
30-59 days past due |
Current | Total Loans | ||||||||||||||||||
| Loan Balances: |
||||||||||||||||||||||||
| Commercial |
||||||||||||||||||||||||
| Commercial and industrial |
$ | 27,911 | $ | — | $ | 5,557 | $ | 17,227 | $ | 1,570,366 | $ | 1,621,061 | ||||||||||||
| Franchise |
1,792 | — | — | — | 176,827 | 178,619 | ||||||||||||||||||
| Mortgage warehouse lines of credit |
— | — | — | — | 123,804 | 123,804 | ||||||||||||||||||
| Community Advantage - homeowners association |
— | — | — | — | 73,289 | 73,289 | ||||||||||||||||||
| Aircraft |
428 | — | — | 170 | 22,205 | 22,803 | ||||||||||||||||||
| Asset-based lending |
342 | — | 172 | 1,074 | 487,619 | 489,207 | ||||||||||||||||||
| Municipal |
— | — | — | — | 79,708 | 79,708 | ||||||||||||||||||
| Leases |
— | — | — | 1 | 77,805 | 77,806 | ||||||||||||||||||
| Other |
— | — | — | — | 1,842 | 1,842 | ||||||||||||||||||
| Purchased non-covered commercial (1) |
— | 486 | — | 57 | 4,499 | 5,042 | ||||||||||||||||||
|
|
|
|
|
|
|
|
|
|
|
|
|
|||||||||||||
| Total commercial |
30,473 | 486 | 5,729 | 18,529 | 2,617,964 | 2,673,181 | ||||||||||||||||||
|
|
|
|
|
|
|
|
|
|
|
|
|
|||||||||||||
| Commercial real-estate: |
||||||||||||||||||||||||
| Residential construction |
892 | — | 6,041 | 5,773 | 32,020 | 44,726 | ||||||||||||||||||
| Commercial construction |
3,011 | — | 13,131 | 330 | 140,223 | 156,695 | ||||||||||||||||||
| Land |
13,459 | — | 3,276 | 6,044 | 142,490 | 165,269 | ||||||||||||||||||
| Office |
4,796 | — | 891 | 1,868 | 562,879 | 570,434 | ||||||||||||||||||
| Industrial |
1,820 | — | 3,158 | 1,320 | 591,919 | 598,217 | ||||||||||||||||||
| Retail |
8,158 | — | 1,351 | 6,657 | 546,617 | 562,783 | ||||||||||||||||||
| Multi-family |
3,312 | — | 151 | 1,447 | 332,871 | 337,781 | ||||||||||||||||||
| Mixed use and other |
20,629 | — | 15,530 | 16,063 | 1,126,930 | 1,179,152 | ||||||||||||||||||
| Purchased non-covered commercial real-estate (1) |
— | 2,232 | 2,352 | 1,057 | 45,821 | 51,462 | ||||||||||||||||||
|
|
|
|
|
|
|
|
|
|
|
|
|
|||||||||||||
| Total commercial real-estate |
56,077 | 2,232 | 45,881 | 40,559 | 3,521,770 | 3,666,519 | ||||||||||||||||||
|
|
|
|
|
|
|
|
|
|
|
|
|
|||||||||||||
| Home equity |
10,583 | — | 2,182 | 3,195 | 805,031 | 820,991 | ||||||||||||||||||
| Residential real estate |
9,387 | — | 3,765 | 1,558 | 360,128 | 374,838 | ||||||||||||||||||
| Purchased non-covered residential real estate (1) |
— | — | — | — | 656 | 656 | ||||||||||||||||||
| Premium finance receivables |
||||||||||||||||||||||||
| Commercial insurance loans |
7,404 | 5,184 | 4,796 | 7,965 | 1,804,695 | 1,830,044 | ||||||||||||||||||
| Life insurance loans |
— | — | — | 30 | 1,111,207 | 1,111,237 | ||||||||||||||||||
| Purchased life insurance loans (1) |
— | — | — | — | 544,963 | 544,963 | ||||||||||||||||||
| Indirect consumer |
132 | 234 | 51 | 312 | 71,753 | 72,482 | ||||||||||||||||||
| Consumer and other |
1,446 | — | 483 | 265 | 105,669 | 107,863 | ||||||||||||||||||
| Purchased non-covered consumer and other (1) |
— | — | — | — | 68 | 68 | ||||||||||||||||||
|
|
|
|
|
|
|
|
|
|
|
|
|
|||||||||||||
| Total loans, net of unearned income, excluding covered loans |
$ | 115,502 | $ | 8,136 | $ | 62,887 | $ | 72,413 | $ | 10,943,904 | $ | 11,202,842 | ||||||||||||
| Covered loans |
— | 145,115 | 14,658 | 7,503 | 446,786 | 614,062 | ||||||||||||||||||
|
|
|
|
|
|
|
|
|
|
|
|
|
|||||||||||||
| Total loans, net of unearned income |
$ | 115,502 | $ | 153,251 | $ | 77,545 | $ | 79,916 | $ | 11,390,690 | $ | 11,816,904 | ||||||||||||
|
|
|
|
|
|
|
|
|
|
|
|
|
|||||||||||||
| (1) | Purchased loans represent loans acquired with evidence of credit quality deterioration since origination, in accordance with ASC 310-30. Loan agings are based upon contractually required payments. |
31
| Aging as a % of Loan Balance: |
Nonaccrual | 90+ days and still accruing |
60-89 days past due |
30-59 days past due |
Current | Total Loans | ||||||||||||||||||
| Commercial |
||||||||||||||||||||||||
| Commercial and industrial |
1.7 | % | — | % | 0.3 | % | 1.1 | % | 96.9 | % | 100.0 | % | ||||||||||||
| Franchise |
1.0 | — | — | — | 99.0 | 100.0 | ||||||||||||||||||
| Mortgage warehouse lines of credit |
— | — | — | — | 100.0 | 100.0 | ||||||||||||||||||
| Community Advantage - homeowners association |
— | — | — | — | 100.0 | 100.0 | ||||||||||||||||||
| Aircraft |
1.9 | — | — | 0.7 | 97.4 | 100.0 | ||||||||||||||||||
| Asset-based lending |
0.1 | — | — | 0.2 | 99.7 | 100.0 | ||||||||||||||||||
| Municipal |
— | — | — | — | 100.0 | 100.0 | ||||||||||||||||||
| Leases |
— | — | — | — | 100.0 | 100.0 | ||||||||||||||||||
| Other |
— | — | — | — | 100.0 | 100.0 | ||||||||||||||||||
| Purchased non-covered commercial (1) |
— | 9.6 | — | 1.1 | 89.3 | 100.0 | ||||||||||||||||||
|
|
|
|
|
|
|
|
|
|
|
|
|
|||||||||||||
| Total commercial |
1.1 | — | 0.2 | 0.7 | 98.0 | 100.0 | ||||||||||||||||||
|
|
|
|
|
|
|
|
|
|
|
|
|
|||||||||||||
| Commercial real-estate |
||||||||||||||||||||||||
| Residential construction |
2.0 | — | 13.5 | 12.9 | 71.6 | 100.0 | ||||||||||||||||||
| Commercial construction |
1.9 | — | 8.4 | 0.2 | 89.5 | 100.0 | ||||||||||||||||||
| Land |
8.1 | — | 2.0 | 3.7 | 86.2 | 100.0 | ||||||||||||||||||
| Office |
0.8 | — | 0.2 | 0.3 | 98.7 | 100.0 | ||||||||||||||||||
| Industrial |
0.3 | — | 0.5 | 0.2 | 99.0 | 100.0 | ||||||||||||||||||
| Retail |
1.4 | — | 0.2 | 1.2 | 97.2 | 100.0 | ||||||||||||||||||
| Multi-family |
1.0 | — | — | 0.4 | 98.6 | 100.0 | ||||||||||||||||||
| Mixed use and other |
1.7 | — | 1.3 | 1.4 | 95.6 | 100.0 | ||||||||||||||||||
| Purchased non-covered commercial real-estate (1) |
— | 4.3 | 4.6 | 2.1 | 89.0 | 100.0 | ||||||||||||||||||
|
|
|
|
|
|
|
|
|
|
|
|
|
|||||||||||||
| Total commercial real-estate |
1.5 | 0.1 | 1.3 | 1.1 | 96.0 | 100.0 | ||||||||||||||||||
|
|
|
|
|
|
|
|
|
|
|
|
|
|||||||||||||
| Home equity |
1.3 | — | 0.3 | 0.4 | 98.0 | 100.0 | ||||||||||||||||||
| Residential real estate |
2.5 | — | 1.0 | 0.4 | 96.1 | 100.0 | ||||||||||||||||||
| Purchased non-covered residential real estate (1) |
— | — | — | — | 100.0 | 100.0 | ||||||||||||||||||
| Premium finance receivables |
||||||||||||||||||||||||
| Commercial insurance loans |
0.4 | 0.3 | 0.3 | 0.4 | 98.6 | 100.0 | ||||||||||||||||||
| Life insurance loans |
— | — | — | — | 100.0 | 100.0 | ||||||||||||||||||
| Purchased life insurance loans (1) |
— | — | — | — | 100.0 | 100.0 | ||||||||||||||||||
| Indirect consumer |
0.2 | 0.3 | 0.1 | 0.4 | 99.0 | 100.0 | ||||||||||||||||||
| Consumer and other |
1.3 | — | 0.4 | 0.2 | 98.1 | 100.0 | ||||||||||||||||||
| Purchased non-covered consumer and other (1) |
— | — | — | — | 100.0 | 100.0 | ||||||||||||||||||
|
|
|
|
|
|
|
|
|
|
|
|
|
|||||||||||||
| Total loans, net of unearned income, excluding covered loans |
1.0 | 0.1 | 0.6 | 0.6 | 97.7 | % | 100.0 | % | ||||||||||||||||
| Covered loans |
— | 23.6 | 2.4 | 1.2 | 72.8 | 100.0 | ||||||||||||||||||
|
|
|
|
|
|
|
|
|
|
|
|
|
|||||||||||||
| Total loans, net of unearned income |
1.0 | 1.3 | 0.7 | 0.7 | 96.3 | % | 100.0 | % | ||||||||||||||||
|
|
|
|
|
|
|
|
|
|
|
|
|
|||||||||||||
As of June 30, 2012, $62.9 million of all loans, excluding covered loans, or 0.6%, were 60 to 89 days past due and $72.4 million, or 0.6%, were 30 to 59 days (or one payment) past due. As of March 31, 2012, $57.8 million of all loans, excluding covered loans, or 0.5%, were 60 to 89 days past due and $139.6 million, or 1.3%, were 30 to 59 days (or one payment) past due. The majority of the commercial and commercial real estate loans shown as 60 to 89 days and 30 to 59 days past due are included on the Company’s internal problem loan reporting system. Loans on this system are closely monitored by management on a monthly basis.
The Company’s home equity and residential loan portfolios continue to exhibit low delinquency ratios. Home equity loans at June 30, 2012 that are current with regard to the contractual terms of the loan agreement represent 98.0% of the total home equity portfolio. Residential real estate loans at June 30, 2012 that are current with regards to the contractual terms of the loan agreements comprise 96.1% of total residential real estate loans outstanding, which includes purchased non-covered residential real-estate.
32
The table below shows the aging of the Company’s loan portfolio, excluding covered loans, at March 31, 2012:
| As of March 31, 2012 (Dollars in thousands) |
Nonaccrual | 90+ days and still accruing |
60-89 days past due |
30-59 days past due |
Current | Total Loans | ||||||||||||||||||
| Loan Balances: |
||||||||||||||||||||||||
| Commercial |
||||||||||||||||||||||||
| Commercial and industrial |
$ | 17,392 | $ | — | $ | 9,210 | $ | 24,634 | $ | 1,454,783 | $ | 1,506,019 | ||||||||||||
| Franchise |
1,792 | — | — | 100 | 167,385 | 169,277 | ||||||||||||||||||
| Mortgage warehouse lines of credit |
— | — | — | — | 136,438 | 136,438 | ||||||||||||||||||
| Community Advantage - homeowners association |
— | — | — | — | 75,786 | 75,786 | ||||||||||||||||||
| Aircraft |
260 | — | 428 | 1,189 | 18,014 | 19,891 | ||||||||||||||||||
| Asset-based lending |
391 | — | 926 | 970 | 472,524 | 474,811 | ||||||||||||||||||
| Municipal |
— | — | — | — | 76,885 | 76,885 | ||||||||||||||||||
| Leases |
— | — | — | 11 | 77,660 | 77,671 | ||||||||||||||||||
| Other |
— | — | — | — | 1,733 | 1,733 | ||||||||||||||||||
| Purchased non-covered commercial (1) |
— | 424 | 1,063 | — | 4,458 | 5,945 | ||||||||||||||||||
|
|
|
|
|
|
|
|
|
|
|
|
|
|||||||||||||
| Total commercial |
19,835 | 424 | 11,627 | 26,904 | 2,485,666 | 2,544,456 | ||||||||||||||||||
|
|
|
|
|
|
|
|
|
|
|
|
|
|||||||||||||
| Commercial real-estate: |
||||||||||||||||||||||||
| Residential construction |
1,807 | — | — | 4,469 | 49,835 | 56,111 | ||||||||||||||||||
| Commercial construction |
2,389 | — | 3,100 | — | 159,230 | 164,719 | ||||||||||||||||||
| Land |
25,306 | — | 6,606 | 6,833 | 145,297 | 184,042 | ||||||||||||||||||
| Office |
8,534 | — | 4,310 | 5,471 | 542,393 | 560,708 | ||||||||||||||||||
| Industrial |
1,864 | — | 6,683 | 10,101 | 572,255 | 590,903 | ||||||||||||||||||
| Retail |
7,323 | 73 | — | 8,797 | 511,884 | 528,077 | ||||||||||||||||||
| Multi-family |
3,708 | — | 1,496 | 4,691 | 315,043 | 324,938 | ||||||||||||||||||
| Mixed use and other |
11,773 | — | 17,745 | 30,689 | 1,063,733 | 1,123,940 | ||||||||||||||||||
| Purchased non-covered commercial real-estate (1) |
— | 2,959 | 301 | 1,601 | 47,461 | 52,322 | ||||||||||||||||||
|
|
|
|
|
|
|
|
|
|
|
|
|
|||||||||||||
| Total commercial real-estate |
62,704 | 3,032 | 40,241 | 72,652 | 3,407,131 | 3,585,760 | ||||||||||||||||||
|
|
|
|
|
|
|
|
|
|
|
|
|
|||||||||||||
| Home equity |
12,881 | — | 2,049 | 6,576 | 818,858 | 840,364 | ||||||||||||||||||
| Residential real estate |
5,329 | — | 453 | 13,530 | 341,358 | 360,670 | ||||||||||||||||||
| Purchased non-covered residential real estate (1) |
— | — | — | — | 657 | 657 | ||||||||||||||||||
| Premium finance receivables |
||||||||||||||||||||||||
| Commercial insurance loans |
7,650 | 4,619 | 3,360 | 17,612 | 1,479,389 | 1,512,630 | ||||||||||||||||||
| Life insurance loans |
— | — | — | 389 | 1,132,970 | 1,133,359 | ||||||||||||||||||
| Purchased life insurance loans (1) |
— | — | — | — | 560,404 | 560,404 | ||||||||||||||||||
| Indirect consumer |
152 | 257 | 53 | 317 | 66,666 | 67,445 | ||||||||||||||||||
| Consumer and other |
121 | — | 20 | 1,601 | 109,723 | 111,465 | ||||||||||||||||||
| Purchased non-covered consumer and other (1) |
— | — | — | — | 174 | 174 | ||||||||||||||||||
|
|
|
|
|
|
|
|
|
|
|
|
|
|||||||||||||
| Total loans, net of unearned income, excluding covered loans |
$ | 108,672 | $ | 8,332 | $ | 57,803 | $ | 139,581 | $ | 10,402,996 | $ | 10,717,384 | ||||||||||||
| Covered loans |
— | 182,011 | 20,254 | 28,249 | 460,706 | 691,220 | ||||||||||||||||||
|
|
|
|
|
|
|
|
|
|
|
|
|
|||||||||||||
| Total loans, net of unearned income |
$ | 108,672 | $ | 190,343 | $ | 78,057 | $ | 167,830 | $ | 10,863,702 | $ | 11,408,604 | ||||||||||||
|
|
|
|
|
|
|
|
|
|
|
|
|
|||||||||||||
| (1) | Purchased loans represent loans acquired with evidence of credit quality deterioration since origination, in accordance with ASC 310-30. Loan agings are based upon contractually required payments. |
33
| Aging as a % of Loan Balance: |
Nonaccrual | 90+ days and still accruing |
60-89 days past due |
30-59 days past due |
Current | Total Loans | ||||||||||||||||||
| Commercial |
||||||||||||||||||||||||
| Commercial and industrial |
1.2 | % | — | % | 0.6 | % | 1.6 | % | 96.6 | % | 100.0 | % | ||||||||||||
| Franchise |
1.1 | — | — | 0.1 | 98.8 | 100.0 | ||||||||||||||||||
| Mortgage warehouse lines of credit |
— | — | — | — | 100.0 | 100.0 | ||||||||||||||||||
| Community Advantage - homeowners association |
— | — | — | — | 100.0 | 100.0 | ||||||||||||||||||
| Aircraft |
1.3 | — | 2.2 | 6.0 | 90.5 | 100.0 | ||||||||||||||||||
| Asset-based lending |
0.1 | — | 0.2 | 0.2 | 99.5 | 100.0 | ||||||||||||||||||
| Municipal |
— | — | — | — | 100.0 | 100.0 | ||||||||||||||||||
| Leases |
— | — | — | — | 100.0 | 100.0 | ||||||||||||||||||
| Other |
— | — | — | — | 100.0 | 100.0 | ||||||||||||||||||
| Purchased non-covered commercial (1) |
— | 7.1 | 17.9 | — | 75.0 | 100.0 | ||||||||||||||||||
|
|
|
|
|
|
|
|
|
|
|
|
|
|||||||||||||
| Total commercial |
0.8 | — | 0.5 | 1.1 | 97.6 | 100.0 | ||||||||||||||||||
|
|
|
|
|
|
|
|
|
|
|
|
|
|||||||||||||
| Commercial real-estate |
||||||||||||||||||||||||
| Residential construction |
3.2 | — | — | 8.0 | 88.8 | 100.0 | ||||||||||||||||||
| Commercial construction |
1.5 | — | 1.9 | — | 96.6 | 100.0 | ||||||||||||||||||
| Land |
13.8 | — | 3.6 | 3.7 | 78.9 | 100.0 | ||||||||||||||||||
| Office |
1.5 | — | 0.8 | 1.0 | 96.7 | 100.0 | ||||||||||||||||||
| Industrial |
0.3 | — | 1.1 | 1.7 | 96.9 | 100.0 | ||||||||||||||||||
| Retail |
1.4 | — | — | 1.7 | 96.9 | 100.0 | ||||||||||||||||||
| Multi-family |
1.1 | — | 0.5 | 1.4 | 97.0 | 100.0 | ||||||||||||||||||
| Mixed use and other |
1.0 | — | 1.6 | 2.7 | 94.7 | 100.0 | ||||||||||||||||||
| Purchased non-covered commercial real-estate (1) |
— | 5.7 | 0.6 | 3.1 | 90.6 | 100.0 | ||||||||||||||||||
|
|
|
|
|
|
|
|
|
|
|
|
|
|||||||||||||
| Total commercial real-estate |
1.7 | 0.1 | 1.1 | 2.0 | 95.1 | 100.0 | ||||||||||||||||||
|
|
|
|
|
|
|
|
|
|
|
|
|
|||||||||||||
| Home equity |
1.5 | — | 0.2 | 0.8 | 97.5 | 100.0 | ||||||||||||||||||
| Residential real estate |
1.5 | — | 0.1 | 3.8 | 94.6 | 100.0 | ||||||||||||||||||
| Purchased non-covered residential real estate (1) |
— | — | — | — | 100.0 | 100.0 | ||||||||||||||||||
| Premium finance receivables |
||||||||||||||||||||||||
| Commercial insurance loans |
0.5 | 0.3 | 0.2 | 1.2 | 97.8 | 100.0 | ||||||||||||||||||
| Life insurance loans |
— | — | — | — | 100.0 | 100.0 | ||||||||||||||||||
| Purchased life insurance loans (1) |
— | — | — | — | 100.0 | 100.0 | ||||||||||||||||||
| Indirect consumer |
0.2 | 0.4 | 0.1 | 0.5 | 98.8 | 100.0 | ||||||||||||||||||
| Consumer and other |
0.1 | — | — | 1.4 | 98.5 | 100.0 | ||||||||||||||||||
| Purchased non-covered consumer and other (1) |
— | — | — | — | 100.0 | 100.0 | ||||||||||||||||||
|
|
|
|
|
|
|
|
|
|
|
|
|
|||||||||||||
| Total loans, net of unearned income, excluding covered loans |
1.0 | % | 0.1 | % | 0.5 | % | 1.3 | % | 97.1 | % | 100.0 | % | ||||||||||||
| Covered loans |
— | 26.3 | 2.9 | 4.1 | 66.7 | 100.0 | ||||||||||||||||||
|
|
|
|
|
|
|
|
|
|
|
|
|
|||||||||||||
| Total loans, net of unearned income |
1.0 | % | 1.7 | % | 0.7 | % | 1.5 | % | 95.1 | % | 100.0 | % | ||||||||||||
|
|
|
|
|
|
|
|
|
|
|
|
|
|||||||||||||
34
Non-performing Assets, excluding covered assets
The following table sets forth Wintrust’s non-performing assets, excluding covered assets and purchased non-covered loans acquired with evidence of credit quality deterioration since origination, at the dates indicated.
| (Dollars in thousands) |
June 30, 2012 |
March 31, 2012 |
June 30, 2011 |
|||||||||
| Loans past due greater than 90 days and still accruing: |
||||||||||||
| Commercial |
$ | — | $ | — | $ | — | ||||||
| Commercial real-estate |
— | 73 | — | |||||||||
| Home equity |
— | — | — | |||||||||
| Residential real-estate |
— | — | — | |||||||||
| Premium finance receivables - commercial |
5,184 | 4,619 | 4,446 | |||||||||
| Premium finance receivables - life insurance |
— | — | 324 | |||||||||
| Indirect consumer |
234 | 257 | 284 | |||||||||
| Consumer and other |
— | — | — | |||||||||
|
|
|
|
|
|
|
|||||||
| Total loans past due greater than 90 days and still accruing |
5,418 | 4,949 | 5,054 | |||||||||
|
|
|
|
|
|
|
|||||||
| Non-accrual loans: |
||||||||||||
| Commercial |
30,473 | 19,835 | 26,168 | |||||||||
| Commercial real-estate |
56,077 | 62,704 | 89,793 | |||||||||
| Home equity |
10,583 | 12,881 | 15,853 | |||||||||
| Residential real-estate |
9,387 | 5,329 | 7,379 | |||||||||
| Premium finance receivables - commercial |
7,404 | 7,650 | 10,309 | |||||||||
| Premium finance receivables - life insurance |
— | — | 670 | |||||||||
| Indirect consumer |
132 | 152 | 89 | |||||||||
| Consumer and other |
1,446 | 121 | 757 | |||||||||
|
|
|
|
|
|
|
|||||||
| Total non-accrual loans |
115,502 | 108,672 | 151,018 | |||||||||
|
|
|
|
|
|
|
|||||||
| Total non-performing loans: |
||||||||||||
| Commercial |
30,473 | 19,835 | 26,168 | |||||||||
| Commercial real-estate |
56,077 | 62,777 | 89,793 | |||||||||
| Home equity |
10,583 | 12,881 | 15,853 | |||||||||
| Residential real-estate |
9,387 | 5,329 | 7,379 | |||||||||
| Premium finance receivables - commercial |
12,588 | 12,269 | 14,755 | |||||||||
| Premium finance receivables - life insurance |
— | — | 994 | |||||||||
| Indirect consumer |
366 | 409 | 373 | |||||||||
| Consumer and other |
1,446 | 121 | 757 | |||||||||
|
|
|
|
|
|
|
|||||||
| Total non-performing loans |
$ | 120,920 | $ | 113,621 | $ | 156,072 | ||||||
| Other real estate owned |
66,532 | 69,575 | 82,772 | |||||||||
| Other real estate owned - obtained in acquisition |
6,021 | 6,661 | — | |||||||||
|
|
|
|
|
|
|
|||||||
| Total non-performing assets |
$ | 193,473 | $ | 189,857 | $ | 238,844 | ||||||
|
|
|
|
|
|
|
|||||||
| Total non-performing loans by category as a percent of its own respective category’s period-end balance: |
||||||||||||
| Commercial |
1.14 | % | 0.78 | % | 1.23 | % | ||||||
| Commercial real-estate |
1.53 | 1.75 | 2.66 | |||||||||
| Home equity |
1.29 | 1.53 | 1.80 | |||||||||
| Residential real-estate |
2.50 | 1.47 | 2.24 | |||||||||
| Premium finance receivables - commercial |
0.69 | 0.81 | 1.03 | |||||||||
| Premium finance receivables - life insurance |
— | — | 0.06 | |||||||||
| Indirect consumer |
0.51 | 0.61 | 0.65 | |||||||||
| Consumer and other |
1.34 | 0.11 | 0.75 | |||||||||
|
|
|
|
|
|
|
|||||||
| Total loans, net of unearned income |
1.08 | % | 1.06 | % | 1.57 | % | ||||||
|
|
|
|
|
|
|
|||||||
| Total non-performing assets as a percentage of total assets |
1.17 | % | 1.17 | % | 1.63 | % | ||||||
|
|
|
|
|
|
|
|||||||
| Allowance for loan losses as a percentage of total non-performing loans |
92.56 | % | 97.71 | % | 75.20 | % | ||||||
|
|
|
|
|
|
|
|||||||
Non-performing Commercial and Commercial Real Estate
Commercial non-performing loans totaled $30.5 million as of June 30, 2012 compared to $19.8 million as of March 31, 2012 and $26.2 million as of June 30, 2011. The increase in commercial non-performing loans was primarily related to one credit relationship totaling $13 million which should be removed from non-performing status shortly. Commercial
35
real estate non-performing loans totaled $56.1 million as of June 30, 2012 compared to $62.8 million as of March 31, 2012 and $89.8 million as of June 30, 2011.
Management is pursuing the resolution of all credits in this category. At this time, management believes reserves are appropriate to absorb inherent losses that are expected to occur upon the ultimate resolution of these credits.
Non-performing Residential Real Estate and Home Equity
Non-performing home equity and residential real estate loans totaled $20.0 million as of June 30, 2012. The balance increased $1.8 million from March 31, 2012 and decreased $3.3 million from June 30, 2011. The June 30, 2012 non-performing balance is comprised of $9.4 million of residential real estate (44 individual credits) and $10.6 million of home equity loans (38 individual credits). On average, this is approximately 5 non-performing residential real estate loans and home equity loans per chartered bank within the Company. The Company believes control and collection of these loans is very manageable. At this time, management believes reserves are adequate to absorb inherent losses that may occur upon the ultimate resolution of these credits.
Non-performing Commercial Insurance Premium Finance Receivables
The table below presents the level of non-performing property and casualty premium finance receivables as of June 30, 2012 and 2011, and the amount of net charge-offs for the quarters then ended.
| (Dollars in thousands) |
June 30, 2012 |
June 30, 2011 |
||||||
| Non-performing premium finance receivables - commercial |
$ | 12,588 | $ | 14,755 | ||||
| - as a percent of premium finance receivables - commercial outstanding |
0.69 | % | 1.03 | % | ||||
| Net charge-offs (recoveries) of premium finance receivables - commercial |
$ | 591 | $ | (3,482 | ) | |||
| - annualized as a percent of average premium finance receivables - commercial |
0.14 | % | (0.99 | )% | ||||
Fluctuations in this category may occur due to timing and nature of account collections from insurance carriers. The Company’s underwriting standards, regardless of the condition of the economy, have remained consistent. We anticipate that net charge-offs and non-performing asset levels in the near term will continue to be at levels that are within acceptable operating ranges for this category of loans. Management is comfortable with administering the collections at this level of non-performing property and casualty premium finance receivables and believes reserves are adequate to absorb inherent losses that may occur upon the ultimate resolution of these credits.
Due to the nature of collateral for commercial premium finance receivables, it customarily takes 60-150 days to convert the collateral into cash. Accordingly, the level of non-performing commercial premium finance receivables is not necessarily indicative of the loss inherent in the portfolio. In the event of default, Wintrust has the power to cancel the insurance policy and collect the unearned portion of the premium from the insurance carrier. In the event of cancellation, the cash returned in payment of the unearned premium by the insurer should generally be sufficient to cover the receivable balance, the interest and other charges due. Due to notification requirements and processing time by most insurance carriers, many receivables will become delinquent beyond 90 days while the insurer is processing the return of the unearned premium. Management continues to accrue interest until maturity as the unearned premium is ordinarily sufficient to pay-off the outstanding balance and contractual interest due.
36
Nonperforming Loans Rollforward
The table below presents a summary of the changes in the balance of non-performing loans, excluding covered loans, for the three and six month periods ending June 30, 2012 and 2011:
| Three Months Ended | Six Months Ended | |||||||||||||||
| (Dollars in thousands) |
June 30, 2012 |
June 30, 2011 |
June 30, 2012 |
June 30, 2011 |
||||||||||||
| Balance at beginning of period |
$ | 113,621 | $ | 155,387 | $ | 120,084 | $ | 142,132 | ||||||||
| Additions, net |
35,860 | 45,742 | 53,727 | 101,910 | ||||||||||||
| Return to performing status |
(1,116 | ) | (2,193 | ) | (2,038 | ) | (3,368 | ) | ||||||||
| Payments received |
(9,823 | ) | (12,553 | ) | (14,463 | ) | (14,142 | ) | ||||||||
| Transfer to OREO |
(6,555 | ) | (12,926 | ) | (13,156 | ) | (35,351 | ) | ||||||||
| Charge-offs |
(11,637 | ) | (17,611 | ) | (22,944 | ) | (31,711 | ) | ||||||||
| Net change for niche loans (1) |
570 | 226 | (290 | ) | (3,398 | ) | ||||||||||
|
|
|
|
|
|
|
|
|
|||||||||
| Balance at end of period |
$ | 120,920 | $ | 156,072 | $ | 120,920 | $ | 156,072 | ||||||||
|
|
|
|
|
|
|
|
|
|||||||||
| (1) | This includes activity for premium finance receivables and indirect consumer loans. |
Restructured Loans
The table below presents a summary of restructured loans for the respective period, presented by loan category and accrual status:
| (Dollars in thousands) |
June 30, 2012 |
March 31, 2012 |
June 30, 2011 |
|||||||||
| Accruing: |
||||||||||||
| Commercial |
$ | 21,478 | $ | 9,324 | $ | 12,396 | ||||||
| Commercial real estate |
128,662 | 134,516 | 72,363 | |||||||||
| Residential real estate and other |
6,450 | 7,176 | 1,079 | |||||||||
|
|
|
|
|
|
|
|||||||
| Total accrual |
$ | 156,590 | $ | 151,016 | $ | 85,838 | ||||||
|
|
|
|
|
|
|
|||||||
| Non-accrual: (1) |
||||||||||||
| Commercial |
$ | 1,562 | $ | 1,465 | $ | 3,587 | ||||||
| Commercial real estate |
13,215 | 11,805 | 12,308 | |||||||||
| Residential real estate and other |
939 | 760 | 1,311 | |||||||||
|
|
|
|
|
|
|
|||||||
| Total non-accrual |
$ | 15,716 | $ | 14,030 | $ | 17,206 | ||||||
|
|
|
|
|
|
|
|||||||
| Total restructured loans: |
||||||||||||
| Commercial |
$ | 23,040 | $ | 10,789 | $ | 15,983 | ||||||
| Commercial real estate |
141,877 | 146,321 | 84,671 | |||||||||
| Residential real estate and other |
7,389 | 7,936 | 2,390 | |||||||||
|
|
|
|
|
|
|
|||||||
| Total restructured loans |
$ | 172,306 | $ | 165,046 | $ | 103,044 | ||||||
|
|
|
|
|
|
|
|||||||
| (1) | Included in total non-performing loans. |
At June 30, 2012, the Company had $172.3 million in loans with modified terms representing 185 credits in which economic concessions were granted to certain borrowers to better align the terms of their loans with their current ability to pay.
37
The table below presents a summary of restructured loans as of June 30, 2012 and June 30, 2011, and shows the changes in the balance during the periods presented:
| Three Months Ended June 30, 2012 | ||||||||||||||||
| (Dollars in thousands) |
Commercial | Commercial Real Estate |
Residential Real Estate and Other |
Total | ||||||||||||
| Balance at beginning of period |
$ | 10,789 | $ | 146,321 | $ | 7,936 | $ | 165,046 | ||||||||
| Additions during the period |
12,765 | 7,860 | 29 | 20,654 | ||||||||||||
| Reductions: |
||||||||||||||||
| Charge-offs |
(161 | ) | (1,316 | ) | (294 | ) | (1,771 | ) | ||||||||
| Transferred to OREO |
— | — | — | — | ||||||||||||
| Removal of restructured loan status (1) |
(200 | ) | (1,414 | ) | (273 | ) | (1,887 | ) | ||||||||
| Payments received |
(153 | ) | (9,574 | ) | (9 | ) | (9,736 | ) | ||||||||
|
|
|
|
|
|
|
|
|
|||||||||
| Balance at period end |
$ | 23,040 | $ | 141,877 | $ | 7,389 | $ | 172,306 | ||||||||
|
|
|
|
|
|
|
|
|
|||||||||
| Three Months Ended June 30, 2011 | ||||||||||||||||
| (Dollars in thousands) |
Commercial | Commercial Real Estate |
Residential Real Estate and Other |
Total | ||||||||||||
| Balance at beginning of period |
$ | 18,202 | $ | 76,376 | $ | 1,991 | $ | 96,569 | ||||||||
| Additions during the period |
277 | 32,459 | 409 | 33,145 | ||||||||||||
| Reductions: |
||||||||||||||||
| Charge-offs |
(1,533 | ) | (8,766 | ) | (4 | ) | (10,303 | ) | ||||||||
| Transferred to OREO |
— | (4,952 | ) | — | (4,952 | ) | ||||||||||
| Removal of restructured loan status (1) |
— | (926 | ) | — | (926 | ) | ||||||||||
| Payments received |
(963 | ) | (9,520 | ) | (6 | ) | (10,489 | ) | ||||||||
|
|
|
|
|
|
|
|
|
|||||||||
| Balance at period end |
$ | 15,983 | $ | 84,671 | $ | 2,390 | $ | 103,044 | ||||||||
|
|
|
|
|
|
|
|
|
|||||||||
| (1) | Loan was previously classified as a troubled debt restructuring and subsequently performed in compliance with the loan’s modified terms for a period of six months (including over a calendar year-end) at a modified interest rate which represented a market rate at the time of restructuring. Per our TDR policy, the TDR classification is removed. |
38
| Six Months Ended June 30, 2012 | ||||||||||||||||
| (Dollars in thousands) |
Commercial | Commercial Real Estate |
Residential Real Estate and Other |
Total | ||||||||||||
| Balance at beginning of period |
$ | 10,834 | $ | 112,796 | $ | 6,888 | $ | 130,518 | ||||||||
| Additions during the period |
12,883 | 46,379 | 1,089 | 60,351 | ||||||||||||
| Reductions: |
||||||||||||||||
| Charge-offs |
(161 | ) | (2,658 | ) | (294 | ) | (3,113 | ) | ||||||||
| Transferred to OREO |
— | (2,129 | ) | — | (2,129 | ) | ||||||||||
| Removal of restructured loan status (1) |
(200 | ) | (1,877 | ) | (273 | ) | (2,350 | ) | ||||||||
| Payments received |
(316 | ) | (10,634 | ) | (21 | ) | (10,971 | ) | ||||||||
|
|
|
|
|
|
|
|
|
|||||||||
| Balance at period end |
$ | 23,040 | $ | 141,877 | $ | 7,389 | $ | 172,306 | ||||||||
|
|
|
|
|
|
|
|
|
|||||||||
| Six Months Ended June 30, 2011 | ||||||||||||||||
| (Dollars in thousands) |
Commercial | Commercial Real Estate |
Residential Real Estate and Other |
Total | ||||||||||||
| Balance at beginning of period |
$ | 18,028 | $ | 81,366 | $ | 1,796 | $ | 101,190 | ||||||||
| Additions during the period |
1,962 | 39,946 | 604 | 42,512 | ||||||||||||
| Reductions: |
||||||||||||||||
| Charge-offs |
(2,533 | ) | (10,964 | ) | (4 | ) | (13,501 | ) | ||||||||
| Transferred to OREO |
— | (6,743 | ) | — | (6,743 | ) | ||||||||||
| Removal of restructured loan status (1) |
(244 | ) | (5,596 | ) | — | (5,840 | ) | |||||||||
| Payments received |
(1,230 | ) | (13,338 | ) | (6 | ) | (14,574 | ) | ||||||||
|
|
|
|
|
|
|
|
|
|||||||||
| Balance at period end |
$ | 15,983 | $ | 84,671 | $ | 2,390 | $ | 103,044 | ||||||||
|
|
|
|
|
|
|
|
|
|||||||||
| (1) | Loan was previously classified as a troubled debt restructuring and subsequently performed in compliance with the loan’s modified terms for a period of six months (including over a calendar year-end) at a modified interest rate which represented a market rate at the time of restructuring. Per our TDR policy, the TDR classification is removed. |
The Company’s approach to restructuring loans is built on its credit risk rating system which requires credit management personnel to assign a credit risk rating to each loan. In each case, the loan officer is responsible for recommending a credit risk rating for each loan and ensuring the credit risk ratings are appropriate. These credit risk ratings are then reviewed and approved by the bank’s chief credit officer or the director’s loan committee. Credit risk ratings are determined by evaluating a number of factors including a borrower’s financial strength, cash flow coverage, collateral protection and guarantees. The Company’s credit risk rating scale is one through ten with higher scores indicating higher risk. In the case of loans rated six or worse following modification, the Company’s Managed Assets Division evaluates the loan and the credit risk rating and determines that the loan has been restructured to be reasonably assured of repayment and of performance according to the modified terms and is supported by a current, well-documented credit assessment of the borrower’s financial condition and prospects for repayment under the revised terms.
A modification of a loan with an existing credit risk rating of six or worse or a modification of any other credit, which will result in a restructured credit risk rating of six or worse must be reviewed for troubled debt restructuring (“TDR”) classification. In that event, our Managed Assets Division conducts an overall credit and collateral review. A modification of a loan is considered to be a TDR if both (1) the borrower is experiencing financial difficulty and (2) for economic or legal reasons, the bank grants a concession to a borrower that it would not otherwise consider. The modification of a loan where the credit risk rating is five or better both before and after such modification are not reviewed for TDR status. Based on the Company’s credit risk rating system, it considers that borrowers whose credit risk rating is five or better are not experiencing financial difficulties and therefore, are not considered TDRs.
39
TDRs are reviewed at the time of modification and on a quarterly basis to determine if a specific reserve is needed. The carrying amount of the loan is compared to the expected payments to be received, discounted at the loan’s original rate, or for collateral dependent loans, to the fair value of the collateral. Any shortfall is recorded as a specific reserve.
All credits determined to be a TDR will continue to be classified as a TDR in all subsequent periods, unless the borrower has been in compliance with the loan’s modified terms for a period of six months (including over a calendar year-end) and the modified interest rate represented a market rate at the time of a restructuring. The Managed Assets Division, in consultation with the respective loan officer, determines whether the modified interest rate represented a current market rate at the time of restructuring. Using knowledge of current market conditions and rates, competitive pricing on recent loan originations, and an assessment of various characteristics of the modified loan (including collateral position and payment history), an appropriate market rate for a new borrower with similar risk is determined. If the modified interest rate meets or exceeds this market rate for a new borrower with similar risk, the modified interest rate represents a market rate at the time of restructuring. Additionally, before removing a loan from TDR classification, a review of the current or previously measured impairment on the loan and any concerns related to future performance by the borrower is conducted. If concerns exist about the future ability of the borrower to meet its obligations under the loans based on a credit review by the Managed Assets Division, the TDR classification is not removed from the loan.
Each restructured loan was reviewed for impairment at June 30, 2012 and approximately $3.4 million of impairment was present and appropriately reserved for through the Company’s normal reserving methodology in the Company’s allowance for loan losses.
Other Real Estate Owned
The table below presents a summary of other real estate owned, excluding covered other real estate owned, as of June 30, 2012 and shows the activity for the respective period and the balance for each property type:
| Three Months Ended | ||||||||||||
| (Dollars in thousands) |
June 30, 2012 |
March 31, 2012 |
June 30, 2011 |
|||||||||
| Balance at beginning of period |
$ | 76,236 | $ | 86,523 | $ | 85,290 | ||||||
| Disposals/resolved |
(7,523 | ) | (11,681 | ) | (8,253 | ) | ||||||
| Transfers in at fair value, less costs to sell |
8,850 | 6,876 | 10,190 | |||||||||
| Additions from acquisition |
— | — | — | |||||||||
| Fair value adjustments |
(5,010 | ) | (5,482 | ) | (4,455 | ) | ||||||
|
|
|
|
|
|
|
|||||||
| Balance at end of period |
$ | 72,553 | $ | 76,236 | $ | 82,772 | ||||||
|
|
|
|
|
|
|
|||||||
| Period End | ||||||||||||
| Balance by Property Type |
June 30, 2012 |
March 31, 2012 |
June 30, 2011 |
|||||||||
| Residential real estate |
$ | 7,830 | $ | 6,647 | $ | 7,196 | ||||||
| Residential real estate development |
13,464 | 14,764 | 16,591 | |||||||||
| Commercial real estate |
51,259 | 54,825 | 58,985 | |||||||||
|
|
|
|
|
|
|
|||||||
| Total |
$ | 72,553 | $ | 76,236 | $ | 82,772 | ||||||
|
|
|
|
|
|
|
|||||||
40
Covered Assets
In conjunction with FDIC-assisted transactions, the Company entered into loss share agreements with the FDIC. These agreements cover realized losses on loans, foreclosed real estate and certain other assets. These loss share assets are measured separately from the loan portfolios because they are not contractually embedded in the loans and are not transferable with the loans should the Company choose to dispose of them. Fair values at the acquisition dates were estimated based on projected cash flows available for loss-share based on the credit adjustments estimated for each loan pool and the loss share percentages. The loss share assets are also separately measured from the related loans and foreclosed real estate and recorded separately on the Consolidated Statements of Condition. Subsequent to the acquisition date, reimbursements received from the FDIC for actual incurred losses will reduce the loss share assets. Additional expected losses, to the extent such expected losses result in the recognition of an allowance for loan losses, will increase the loss share assets. The loss share agreements with the FDIC require the Company to reimburse the FDIC in the event that actual losses on covered assets are lower than the original loss estimates agreed upon with the FDIC with respect of such assets in the loss share agreements. The allowance for loan losses for loans acquired in FDIC-assisted transactions is determined without giving consideration to the amounts recoverable through loss share agreements (since the loss share agreements are separately accounted for and thus presented “gross” on the balance sheet). On the Consolidated Statements of Income, the provision for credit losses is reported net of changes in the amount recoverable under the loss share agreements. Reductions to expected losses, to the extent such reductions to expected losses are the result of an improvement to the actual or expected cash flows from the covered assets, will reduce the loss share assets. The increases in cash flows for the purchased loans are recognized as interest income prospectively.
The following table provides a comparative analysis for the period end balances of the covered asset components and any changes in the allowance for covered loan losses.
| (Dollars in thousands) |
June 30, 2012 |
March 31, 2012 |
June 30, 2011 |
|||||||||
| Period End Balances: |
||||||||||||
| Loans |
$ | 614,062 | $ | 691,220 | $ | 408,669 | ||||||
| Other real estate owned |
34,860 | 40,851 | 31,053 | |||||||||
| Other assets |
916 | — | — | |||||||||
| FDIC Indemnification asset |
222,568 | 263,212 | 110,049 | |||||||||
|
|
|
|
|
|
|
|||||||
| Total covered assets |
$ | 872,406 | $ | 995,283 | $ | 549,771 | ||||||
|
|
|
|
|
|
|
|||||||
| Allowance for Covered Loan Losses Rollforward: |
||||||||||||
| Balance at beginning of quarter |
$ | 17,735 | $ | 12,977 | $ | 4,844 | ||||||
| Provision for covered loan losses before benefit attributable to FDIC loss share agreements |
11,591 | 11,229 | 2,599 | |||||||||
| Benefit attributable to FDIC loss share agreements |
(9,294 | ) | (8,983 | ) | (2,078 | ) | ||||||
|
|
|
|
|
|
|
|||||||
| Net provision for covered loan losses |
2,297 | 2,246 | 521 | |||||||||
| Increase in FDIC indemnification asset |
9,294 | 8,983 | 2,076 | |||||||||
| Loans charged-off |
(8,793 | ) | (6,523 | ) | — | |||||||
| Recoveries of loans charged-off |
27 | 52 | 2 | |||||||||
|
|
|
|
|
|
|
|||||||
| Net charge-offs |
(8,766 | ) | (6,471 | ) | 2 | |||||||
|
|
|
|
|
|
|
|||||||
| Balance at end of quarter |
$ | 20,560 | $ | 17,735 | $ | 7,443 | ||||||
|
|
|
|
|
|
|
|||||||
41
Changes in Accretable Yield
The excess of cash flows expected to be collected over the carrying value of loans accounted for under ASC 310-30 is referred to as the accretable yield and is recognized in interest income using an effective yield method over the remaining life of the loan, or pool of loans. The accretable yield is affected by:
| • | Changes in interest rate indices for variable rate loans accounted for under ASC 310-30 – Expected future cash flows are based on the variable rates in effect at the time of the regular evaluations of cash flows expected to be collected; |
| • | Changes in prepayment assumptions – Prepayments affect the estimated life of loans accounted for under ASC 310-30 which may change the amount of interest income, and possibly principal, expected to be collected; and |
| • | Changes in the expected principal and interest payments over the estimated life – Updates to expected cash flows are driven by the credit outlook and actions taken with borrowers. Changes in expected future cash flows from loan modifications are included in the regular evaluations of cash flows expected to be collected. |
The following table provides activity for the accretable yield of loans accounted for under ASC 310-30.
| Three Months Ended June 30, 2012 |
Three Months Ended June 30, 2011 |
|||||||||||||||
| (Dollars in thousands) |
Bank Acquisitions |
Life Insurance Premium Finance Loans |
Bank Acquisitions |
Life Insurance Premium Finance Loans |
||||||||||||
| Accretable yield, beginning balance |
$ | 182,222 | $ | 15,848 | $ | 91,332 | $ | 25,543 | ||||||||
| Acquisitions |
— | — | (2,005 | ) | — | |||||||||||
| Accretable yield amortized to interest income |
(13,387 | ) | (2,749 | ) | (7,977 | ) | (5,122 | ) | ||||||||
| Accretable yield amortized to indemnification asset(1) |
(18,063 | ) | — | (5,591 | ) | — | ||||||||||
| Reclassification from non-accretable difference(2) |
7,590 | 1,145 | 1,831 | 3,673 | ||||||||||||
| Increases in interest cash flows due to payments and changes in interest rates |
13,439 | 382 | 3,158 | 797 | ||||||||||||
|
|
|
|
|
|
|
|
|
|||||||||
| Accretable yield, ending balance (3) |
$ | 171,801 | $ | 14,626 | $ | 80,748 | $ | 24,891 | ||||||||
|
|
|
|
|
|
|
|
|
|||||||||
| Six Months Ended June 30, 2012 |
Six Months Ended June 30, 2011 |
|||||||||||||||
| (Dollars in thousands) |
Bank Acquisitions |
Life Insurance Premium Finance Loans |
Bank Acquisitions |
Life Insurance Premium Finance Loans |
||||||||||||
| Accretable yield, beginning balance |
$ | 173,120 | $ | 18,861 | $ | 39,809 | $ | 33,315 | ||||||||
| Acquisitions |
2,288 | — | 5,102 | — | ||||||||||||
| Accretable yield amortized to interest income |
(28,279 | ) | (6,486 | ) | (15,049 | ) | (14,174 | ) | ||||||||
| Accretable yield amortized to indemnification asset(1) |
(39,440 | ) | — | (12,678 | ) | — | ||||||||||
| Reclassification from non-accretable difference(2) |
49,191 | 1,145 | 50,675 | 3,857 | ||||||||||||
| Increases in interest cash flows due to payments and changes in interest rates |
14,921 | 1,106 | 12,889 | 1,893 | ||||||||||||
|
|
|
|
|
|
|
|
|
|||||||||
| Accretable yield, ending balance (3) |
$ | 171,801 | $ | 14,626 | $ | 80,748 | $ | 24,891 | ||||||||
|
|
|
|
|
|
|
|
|
|||||||||
| (1) | Represents the portion of the current period accreted yield, resulting from lower expected losses, applied to reduce the loss share indemnification asset. |
| (2) | Reclassification is the result of subsequent increases in expected principal cash flows. |
| (3) | As of June 30, 2012, the Company estimates that the remaining accretable yield balance to be amortized to the indemnification asset for the bank acquisitions is $88.2 million. The remainder of the accretable yield related to bank acquisitions is expected to be amortized to interest income. |
42
WINTRUST SUBSIDIARIES AND LOCATIONS
Wintrust is a financial holding company whose common stock is traded on the Nasdaq Global Select Market (Nasdaq: WTFC). Its 15 community bank subsidiaries are: Lake Forest Bank & Trust Company, Hinsdale Bank & Trust Company, North Shore Community Bank & Trust Company in Wilmette, Libertyville Bank & Trust Company, Barrington Bank & Trust Company, Crystal Lake Bank & Trust Company, Northbrook Bank & Trust Company, Schaumburg Bank & Trust Company, N.A., Village Bank & Trust in Arlington Heights, Beverly Bank & Trust Company in Chicago, Wheaton Bank & Trust Company, State Bank of The Lakes in Antioch, Old Plank Trail Community Bank, N.A. in New Lenox, St. Charles Bank & Trust Company and Town Bank in Hartland, Wisconsin. The banks also operate facilities in Illinois in Algonquin, Bloomingdale, Buffalo Grove, Cary, Chicago, Clarendon Hills, Deerfield, Downers Grove, Elgin, Frankfort, Geneva, Glencoe, Glen Ellyn, Gurnee, Grayslake, Hanover Park, Highland Park, Highwood, Hoffman Estates, Island Lake, Itasca, Lake Bluff, Lake Villa, Lincoln Park, Lindenhurst, McHenry, Mokena, Mount Prospect, Mundelein, Naperville, North Chicago, Northfield, Norridge, Orland Park, Palatine, Park Ridge, Prospect Heights, Ravenswood, Ravinia, Riverside, Rogers Park, Roselle, Sauganash, Skokie, Spring Grove, Vernon Hills, Wauconda, Western Springs, Willowbrook, Winnetka and Wood Dale and in Delafield, Elm Grove, Madison, Wales, Wisconsin.
Additionally, the Company operates various non-bank business units:
| • | First Insurance Funding Corporation, one of the largest insurance premium finance companies operating in the United States, serves commercial and life insurance loan customers throughout the country. |
| • | First Insurance Funding of Canada serves commercial insurance loan customers throughout Canada |
| • | Tricom, Inc. of Milwaukee provides high-yielding, short-term accounts receivable financing and value-added out-sourced administrative services, such as data processing of payrolls, billing and cash management services, to temporary staffing service clients located throughout the United States. |
| • | Wintrust Mortgage, a division of Barrington Bank & Trust Company, engages primarily in the origination and purchase of residential mortgages for sale into the secondary market through origination offices located throughout the United States. Loans are also originated nationwide through relationships with wholesale and correspondent offices. |
| • | Wayne Hummer Investments, LLC is a broker-dealer providing a full range of private client and brokerage services to clients and correspondent banks located primarily in the Midwest. |
| • | Great Lakes Advisors provides money management services and advisory services to individual accounts. |
| • | Advanced Investment Partners, LLC is an investment management firm specializing in the active management of domestic equity investment strategies. |
| • | The Chicago Trust Company, a trust subsidiary, allows Wintrust to service customers’ trust and investment needs at each banking location. |
| • | Wintrust Information Technology Services Company provides information technology support, item capture and statement preparation services to the Wintrust subsidiaries. |
FORWARD-LOOKING STATEMENTS
This document contains forward-looking statements within the meaning of federal securities laws. Forward-looking information can be identified through the use of words such as “intend,” “plan,” “project,” “expect,” “anticipate,” “believe,” “estimate,” “contemplate,” “possible,” “point,” “will,” “may,” “should,” “would” and “could.” Forward-looking statements and information are not historical facts, are premised on many factors and assumptions, and represent only management’s expectations, estimates and projections regarding future events. Similarly, these statements are not guarantees of future performance and involve certain risks and uncertainties that are difficult to predict, which may include, but are not limited to, those listed below and the Risk Factors discussed under Item 1A of the Company’s 2011 Annual Report on Form 10-K and in any of the Company’s subsequent SEC filings. The Company intends such forward-looking statements to be covered by the safe harbor provisions for forward-looking statements contained in the Private Securities Litigation Reform Act of 1995, and is including this statement for purposes of invoking these safe harbor provisions. Such forward-looking statements may be deemed to include, among other things, statements relating to the Company’s future financial performance, the performance of its loan portfolio, the expected amount of future credit reserves and charge-offs, delinquency trends, growth plans, regulatory developments, securities that the Company may offer from time to time, and management’s long-term performance goals, as well as statements relating to the anticipated effects on financial condition and results of operations from expected developments or events, the Company’s business and growth strategies, including future acquisitions of banks, specialty finance or wealth management businesses, organic growth and plans to form additional de novo banks or branch offices. Actual results could differ materially from those addressed in the forward-looking statements as a
43
result of numerous factors, including the following:
| • | negative economic conditions that adversely affect the economy, housing prices, the job market and other factors that may affect the Company’s liquidity and the performance of its loan portfolios, particularly in the markets in which it operates; |
| • | the extent of defaults and losses on the Company’s loan portfolio, which may require further increases in its allowance for credit losses; |
| • | estimates of fair value of certain of the Company’s assets and liabilities, which could change in value significantly from period to period; |
| • | the financial success and economic viability of the borrowers of our commercial loans; |
| • | the extent of commercial and consumer delinquencies and declines in real estate values, which may require further increases in the Company’s allowance for loan and lease losses; |
| • | changes in the level and volatility of interest rates, the capital markets and other market indices that may affect, among other things, the Company’s liquidity and the value of its assets and liabilities; |
| • | competitive pressures in the financial services business which may affect the pricing of the Company’s loan and deposit products as well as its services (including wealth management services); |
| • | failure to identify and complete favorable acquisitions in the future or unexpected difficulties or developments related to the integration of recent or future acquisitions; |
| • | unexpected difficulties and losses related to FDIC-assisted acquisitions, including those resulting from our loss-sharing arrangements with the FDIC; |
| • | any negative perception of the Company’s reputation or financial strength; |
| • | ability to raise capital on acceptable terms when needed; |
| • | disruption in capital markets, which may lower fair values for the Company’s investment portfolio; |
| • | ability to use technology to provide products and services that will satisfy customer demands and create efficiencies in operations; |
| • | adverse effects on our information technology systems resulting from failures, human error or tampering; |
| • | accuracy and completeness of information the Company receives about customers and counterparties to make credit decisions; |
| • | the ability of the Company to attract and retain senior management experienced in the banking and financial services industries; |
| • | environmental liability risk associated with lending activities; |
| • | losses incurred in connection with repurchases and indemnification payments related to mortgages; |
| • | the loss of customers as a result of technological changes allowing consumers to complete their financial transactions without the use of a bank; |
| • | the soundness of other financial institutions; |
| • | the possibility that certain European Union member states will default on their debt obligations, which may affect |
44
| the Company’s liquidity, financial conditions and results of operations; |
| • | unexpected difficulties or unanticipated developments related to the Company’s strategy of de novo bank formations and openings, which typically require over 13 months of operations before becoming profitable due to the impact of organizational and overhead expenses, startup phase of generating deposits and the time lag typically involved in redeploying deposits into attractively priced loans and other higher yielding earning assets; |
| • | examinations and challenges by tax authorities; |
| • | changes in accounting standards, rules and interpretations and the impact on the Company’s financial statements; |
| • | the ability of the Company to receive dividends from its subsidiaries; |
| • | a decrease in the Company’s regulatory capital ratios, including as a result of further declines in the value of its loan portfolios, or otherwise; |
| • | legislative or regulatory changes, particularly changes in regulation of financial services companies and/or the products and services offered by financial services companies, including those resulting from the Dodd-Frank Act; |
| • | restrictions upon our ability to market our products to consumers and limitations on our ability to profitably operate our mortgage business resulting from the Dodd-Frank Act; |
| • | increased costs of compliance, heightened regulatory capital requirements and other risks associated with changes in regulation and the current regulatory environment, including the Dodd-Frank Act; |
| • | changes in capital requirements resulting from Basel II and III initiatives; |
| • | increases in the Company’s FDIC insurance premiums, or the collection of special assessments by the FDIC; |
| • | delinquencies or fraud with respect to the Company’s premium finance business; |
| • | credit downgrades among commercial and life insurance providers that could negatively affect the value of collateral securing the Company’s premium finance loans; |
| • | the Company’s ability to comply with covenants under its securitization facility and credit facility; |
| • | fluctuations in the stock market, which may have an adverse impact on the Company’s wealth management business and brokerage operation; and |
| • | significant litigation involving the Company. |
Therefore, there can be no assurances that future actual results will correspond to these forward-looking statements. The reader is cautioned not to place undue reliance on any forward-looking statement made by or on behalf of Wintrust. Any such statement speaks only as of the date the statement was made or as of such date that may be referenced within the statement. The Company undertakes no obligation to release revisions to these forward-looking statements or reflect events or circumstances after the date of this press release. Persons are advised, however, to consult further disclosures management makes on related subjects in its reports filed with the Securities and Exchange Commission and in its press releases.
45
CONFERENCE CALL, WEB CAST AND REPLAY
The Company will hold a conference call at 1:00 p.m. (CT) Thursday, July 19, 2012 regarding second quarter 2012 results. Individuals interested in listening should call (877) 363-5049 and enter Conference ID #11619767. A simultaneous audio-only web cast and replay of the conference call may be accessed via the Company’s web site at (http://www.wintrust.com), Investor Relations, Investor News and Events, Presentations & Conference Calls. The text of the second quarter 2012 earnings press release will be available on the home page of the Company’s website at (http://www.wintrust.com) and at the Investor Relations, Investor News and Events, Press Releases link on its website.
46
WINTRUST FINANCIAL CORPORATION
Supplemental Financial Information
5 Quarter Trends
47
WINTRUST FINANCIAL CORPORATION – Supplemental Financial Information
Selected Financial Highlights – 5 Quarter Trends
| (Dollars in thousands, except per share data) |
Three Months Ended | |||||||||||||||||||
| June 30, 2012 |
March 31, 2012 |
December 31, 2011 |
September 30, 2011 |
June 30, 2011 |
||||||||||||||||
| Selected Financial Condition Data (at end of period): |
||||||||||||||||||||
| Total assets |
$ | 16,576,282 | $ | 16,172,018 | $ | 15,893,808 | $ | 15,914,804 | $ | 14,615,897 | ||||||||||
| Total loans, excluding covered loans |
11,202,842 | 10,717,384 | 10,521,377 | 10,272,711 | 9,925,077 | |||||||||||||||
| Total deposits |
13,057,581 | 12,665,853 | 12,307,267 | 12,306,008 | 11,259,260 | |||||||||||||||
| Junior subordinated debentures |
249,493 | 249,493 | 249,493 | 249,493 | 249,493 | |||||||||||||||
| Total shareholders’ equity |
1,722,074 | 1,687,921 | 1,543,533 | 1,528,187 | 1,473,386 | |||||||||||||||
| Selected Statements of Income Data: |
||||||||||||||||||||
| Net interest income |
128,270 | 125,895 | 124,647 | 118,410 | 108,706 | |||||||||||||||
| Net revenue (1) |
179,205 | 172,918 | 169,559 | 185,657 | 145,358 | |||||||||||||||
| Pre-tax adjusted earnings (2) |
68,841 | 63,688 | 59,362 | 57,524 | 52,860 | |||||||||||||||
| Net income |
25,595 | 23,210 | 19,221 | 30,202 | 11,750 | |||||||||||||||
| Net income per common share - Basic |
$ | 0.63 | $ | 0.61 | $ | 0.51 | $ | 0.82 | $ | 0.31 | ||||||||||
| Net income per common share - Diluted |
$ | 0.52 | $ | 0.50 | $ | 0.41 | $ | 0.65 | $ | 0.25 | ||||||||||
| Selected Financial Ratios and Other Data: |
||||||||||||||||||||
| Performance Ratios: |
||||||||||||||||||||
| Net interest margin (2) |
3.51 | % | 3.55 | % | 3.45 | % | 3.37 | % | 3.40 | % | ||||||||||
| Non-interest income to average assets |
1.26 | % | 1.19 | % | 1.11 | % | 1.72 | % | 1.04 | % | ||||||||||
| Non-interest expense to average assets |
2.89 | % | 2.99 | % | 2.94 | % | 2.72 | % | 2.76 | % | ||||||||||
| Net overhead ratio (2) (3) |
1.63 | % | 1.80 | % | 1.83 | % | 1.00 | % | 1.72 | % | ||||||||||
| Net overhead ratio - pre-tax adjusted earnings (2) (3) |
1.46 | % | 1.58 | % | 1.62 | % | 1.56 | % | 1.59 | % | ||||||||||
| Efficiency ratio - FTE (2) (4) |
65.63 | % | 68.24 | % | 69.99 | % | 57.21 | % | 67.22 | % | ||||||||||
| Efficiency ratio - pre-tax adjusted earnings (2) (4) |
61.38 | % | 62.31 | % | 64.76 | % | 63.69 | % | 62.81 | % | ||||||||||
| Return on average assets |
0.63 | % | 0.59 | % | 0.48 | % | 0.77 | % | 0.33 | % | ||||||||||
| Return on average common equity |
6.08 | % | 5.90 | % | 4.87 | % | 7.94 | % | 3.05 | % | ||||||||||
| Average total assets |
$ | 16,319,207 | $ | 15,835,350 | $ | 16,014,209 | $ | 15,526,427 | $ | 14,105,136 | ||||||||||
| Average total shareholders’ equity |
1,695,440 | 1,564,662 | 1,531,936 | 1,507,717 | 1,460,071 | |||||||||||||||
| Average loans to average deposits ratio |
88.2 | % | 88.1 | % | 86.6 | % | 85.0 | % | 90.9 | % | ||||||||||
| Average loans to average deposits ratio (including covered loans) |
93.4 | 93.5 | 91.9 | 90.7 | 94.8 | |||||||||||||||
| Common Share Data at end of period: |
||||||||||||||||||||
| Market price per common share |
$ | 35.50 | $ | 35.79 | $ | 28.05 | $ | 25.81 | $ | 32.18 | ||||||||||
| Book value per common share (2) |
$ | 35.86 | $ | 35.25 | $ | 34.23 | $ | 33.92 | $ | 33.63 | ||||||||||
| Tangible common book value per share (2) |
$ | 27.69 | $ | 27.57 | $ | 26.72 | $ | 26.47 | $ | 26.67 | ||||||||||
| Common shares outstanding |
36,340,843 | 36,289,380 | 35,978,349 | 35,924,066 | 34,988,125 | |||||||||||||||
| Other Data at end of period: (8) |
||||||||||||||||||||
| Leverage Ratio (5) |
10.2 | % | 10.5 | % | 9.4 | % | 9.6 | % | 10.3 | % | ||||||||||
| Tier 1 Capital to risk-weighted assets (5) |
12.4 | % | 12.7 | % | 11.8 | % | 12.0 | % | 12.3 | % | ||||||||||
| Total capital to risk-weighted assets (5) |
13.5 | % | 13.9 | % | 13.0 | % | 13.3 | % | 13.5 | % | ||||||||||
| Tangible common equity ratio (TCE) (2) (7) |
7.4 | % | 7.5 | % | 7.5 | % | 7.4 | % | 7.9 | % | ||||||||||
| Tangible common equity ratio, assuming full conversion of preferred stock (2) (7) |
8.4 | % | 8.6 | % | 7.8 | % | 7.7 | % | 8.2 | % | ||||||||||
| Allowance for credit losses (6) |
$ | 124,823 | $ | 124,101 | $ | 123,612 | $ | 132,051 | $ | 119,697 | ||||||||||
| Non-performing loans |
120,920 | 113,621 | 120,084 | 133,976 | 156,072 | |||||||||||||||
| Allowance for credit losses to total loans (6) |
1.11 | % | 1.16 | % | 1.17 | % | 1.29 | % | 1.21 | % | ||||||||||
| Non-performing loans to total loans |
1.08 | % | 1.06 | % | 1.14 | % | 1.30 | % | 1.57 | % | ||||||||||
| Number of: |
||||||||||||||||||||
| Bank subsidiaries |
15 | 15 | 15 | 15 | 15 | |||||||||||||||
| Non-bank subsidiaries |
8 | 7 | 7 | 7 | 7 | |||||||||||||||
| Banking offices |
100 | 98 | 99 | 99 | 88 | |||||||||||||||
| (1) | Net revenue includes net interest income and non-interest income |
| (2) | See “Supplemental Financial Measures/Ratios” for additional information on this performance measure/ratio. |
| (3) | The net overhead ratio is calculated by netting total non-interest expense and total non-interest income, annualizing this amount, and dividing by that period’s total average assets. A lower ratio indicates a higher degree of efficiency. |
| (4) | The efficiency ratio is calculated by dividing total non-interest expense by tax-equivalent net revenue (less securities gains or losses). A lower ratio indicates more efficient revenue generation. |
| (5) | Capital ratios for current quarter-end are estimated. |
| (6) | The allowance for credit losses includes both the allowance for loan losses and the allowance for unfunded lending-related commitments, but excluding the allowance for covered loan losses. |
| (7) | Total shareholders’ equity minus preferred stock and total intangible assets divided by total assets minus total intangible assets |
| (8) | Asset quality ratios exclude covered loans. |
48
WINTRUST FINANCIAL CORPORATION – SUPPLEMENTAL FINANCIAL INFORMATION
Consolidated Statements of Condition – 5 Quarter Trends
| (In thousands) |
(Unaudited) June 30, 2012 |
(Unaudited) March 31, 2012 |
December 31, 2011 |
(Unaudited) September 30, 2011 |
(Unaudited) June 30, 2011 |
|||||||||||||||
| Assets |
||||||||||||||||||||
| Cash and due from banks |
$ | 176,529 | $ | 146,014 | $ | 148,012 | $ | 147,270 | $ | 140,434 | ||||||||||
| Federal funds sold and securities purchased under resale agreements |
15,227 | 14,588 | 21,692 | 13,452 | 43,634 | |||||||||||||||
| Interest-bearing deposits with other banks |
1,117,888 | 900,755 | 749,287 | 1,101,353 | 990,308 | |||||||||||||||
| Available-for-sale securities, at fair value |
1,196,702 | 1,869,344 | 1,291,797 | 1,267,682 | 1,456,426 | |||||||||||||||
| Trading account securities |
608 | 1,140 | 2,490 | 297 | 509 | |||||||||||||||
| Federal Home Loan Bank and Federal Reserve Bank stock, at cost |
92,792 | 88,216 | 100,434 | 99,749 | 86,761 | |||||||||||||||
| Brokerage customer receivables |
31,448 | 31,085 | 27,925 | 27,935 | 29,736 | |||||||||||||||
| Mortgage loans held-for-sale, at fair value |
511,566 | 339,600 | 306,838 | 204,081 | 133,083 | |||||||||||||||
| Mortgage loans held-for-sale, at lower of cost or market |
14,538 | 10,728 | 13,686 | 8,955 | 5,881 | |||||||||||||||
| Loans, net of unearned income, excluding covered loans |
11,202,842 | 10,717,384 | 10,521,377 | 10,272,711 | 9,925,077 | |||||||||||||||
| Covered loans |
614,062 | 691,220 | 651,368 | 680,075 | 408,669 | |||||||||||||||
|
|
|
|
|
|
|
|
|
|
|
|||||||||||
| Total loans |
11,816,904 | 11,408,604 | 11,172,745 | 10,952,786 | 10,333,746 | |||||||||||||||
| Less: Allowance for loan losses |
111,920 | 111,023 | 110,381 | 118,649 | 117,362 | |||||||||||||||
| Less: Allowance for covered loan losses |
20,560 | 17,735 | 12,977 | 12,496 | 7,443 | |||||||||||||||
|
|
|
|
|
|
|
|
|
|
|
|||||||||||
| Net loans |
11,684,424 | 11,279,846 | 11,049,387 | 10,821,641 | 10,208,941 | |||||||||||||||
| Premises and equipment, net |
449,608 | 434,700 | 431,512 | 412,478 | 403,577 | |||||||||||||||
| FDIC indemnification asset |
222,568 | 263,212 | 344,251 | 379,306 | 110,049 | |||||||||||||||
| Accrued interest receivable and other assets |
710,275 | 463,394 | 444,912 | 468,711 | 389,634 | |||||||||||||||
| Trade date securities receivable |
— | — | 634,047 | 637,112 | 322,091 | |||||||||||||||
| Goodwill |
330,896 | 307,295 | 305,468 | 302,369 | 283,301 | |||||||||||||||
| Other intangible assets |
21,213 | 22,101 | 22,070 | 22,413 | 11,532 | |||||||||||||||
|
|
|
|
|
|
|
|
|
|
|
|||||||||||
| Total assets |
$ | 16,576,282 | $ | 16,172,018 | $ | 15,893,808 | $ | 15,914,804 | $ | 14,615,897 | ||||||||||
|
|
|
|
|
|
|
|
|
|
|
|||||||||||
| Liabilities and Shareholders’ Equity |
||||||||||||||||||||
| Deposits: |
||||||||||||||||||||
| Non-interest bearing |
$ | 2,047,715 | $ | 1,901,753 | $ | 1,785,433 | $ | 1,631,709 | $ | 1,397,433 | ||||||||||
| Interest bearing |
11,009,866 | 10,764,100 | 10,521,834 | 10,674,299 | 9,861,827 | |||||||||||||||
|
|
|
|
|
|
|
|
|
|
|
|||||||||||
| Total deposits |
13,057,581 | 12,665,853 | 12,307,267 | 12,306,008 | 11,259,260 | |||||||||||||||
| Notes payable |
2,457 | 52,639 | 52,822 | 3,004 | 1,000 | |||||||||||||||
| Federal Home Loan Bank advances |
564,301 | 466,391 | 474,481 | 474,570 | 423,500 | |||||||||||||||
| Other borrowings |
375,523 | 411,037 | 443,753 | 448,082 | 432,706 | |||||||||||||||
| Secured borrowings - owed to securitization investors |
360,825 | 428,000 | 600,000 | 600,000 | 600,000 | |||||||||||||||
| Subordinated notes |
15,000 | 35,000 | 35,000 | 40,000 | 40,000 | |||||||||||||||
| Junior subordinated debentures |
249,493 | 249,493 | 249,493 | 249,493 | 249,493 | |||||||||||||||
| Trade date securities payable |
19,025 | — | 47 | 73,874 | 2,243 | |||||||||||||||
| Accrued interest payable and other liabilities |
210,003 | 175,684 | 187,412 | 191,586 | 134,309 | |||||||||||||||
|
|
|
|
|
|
|
|
|
|
|
|||||||||||
| Total liabilities |
14,854,208 | 14,484,097 | 14,350,275 | 14,386,617 | 13,142,511 | |||||||||||||||
|
|
|
|
|
|
|
|
|
|
|
|||||||||||
| Shareholders’ Equity: |
||||||||||||||||||||
| Preferred stock |
176,337 | 176,302 | 49,768 | 49,736 | 49,704 | |||||||||||||||
| Common stock |
36,573 | 36,522 | 35,982 | 35,926 | 34,988 | |||||||||||||||
| Surplus |
1,013,428 | 1,008,326 | 1,001,316 | 997,854 | 969,315 | |||||||||||||||
| Treasury stock |
(7,374 | ) | (6,559 | ) | (112 | ) | (68 | ) | (50 | ) | ||||||||||
| Retained earnings |
501,139 | 478,160 | 459,457 | 441,268 | 415,297 | |||||||||||||||
| Accumulated other comprehensive income (loss) |
1,971 | (4,830 | ) | (2,878 | ) | 3,471 | 4,132 | |||||||||||||
|
|
|
|
|
|
|
|
|
|
|
|||||||||||
| Total shareholders’ equity |
1,722,074 | 1,687,921 | 1,543,533 | 1,528,187 | 1,473,386 | |||||||||||||||
|
|
|
|
|
|
|
|
|
|
|
|||||||||||
| Total liabilities and shareholders’ equity |
$ | 16,576,282 | $ | 16,172,018 | $ | 15,893,808 | $ | 15,914,804 | $ | 14,615,897 | ||||||||||
|
|
|
|
|
|
|
|
|
|
|
|||||||||||
49
WINTRUST FINANCIAL CORPORATION – SUPPLEMENTAL FINANCIAL INFORMATION
Consolidated Statements of Income (Unaudited) – 5 Quarter Trends
| Three Months Ended | ||||||||||||||||||||
| (In thousands, except per share data) |
June 30, 2012 |
March 31, 2012 |
December 31, 2011 |
September 30, 2011 |
June 30, 2011 |
|||||||||||||||
| Interest income |
||||||||||||||||||||
| Interest and fees on loans |
$ | 144,100 | $ | 143,555 | $ | 143,514 | $ | 140,543 | $ | 132,338 | ||||||||||
| Interest bearing deposits with banks |
203 | 248 | 696 | 917 | 870 | |||||||||||||||
| Federal funds sold and securities purchased under resale agreements |
6 | 12 | 33 | 28 | 23 | |||||||||||||||
| Securities |
10,510 | 11,847 | 12,574 | 12,667 | 11,438 | |||||||||||||||
| Trading account securities |
10 | 9 | 6 | 15 | 10 | |||||||||||||||
| Federal Home Loan Bank and Federal Reserve Bank stock |
641 | 604 | 591 | 584 | 572 | |||||||||||||||
| Brokerage customer receivables |
221 | 211 | 203 | 197 | 194 | |||||||||||||||
|
|
|
|
|
|
|
|
|
|
|
|||||||||||
| Total interest income |
155,691 | 156,486 | 157,617 | 154,951 | 145,445 | |||||||||||||||
|
|
|
|
|
|
|
|
|
|
|
|||||||||||
| Interest expense |
||||||||||||||||||||
| Interest on deposits |
17,273 | 18,030 | 19,685 | 21,893 | 22,404 | |||||||||||||||
| Interest on Federal Home Loan Bank advances |
2,867 | 3,584 | 4,186 | 4,166 | 4,010 | |||||||||||||||
| Interest on notes payable and other borrowings |
2,274 | 3,102 | 2,804 | 2,874 | 2,715 | |||||||||||||||
| Interest on secured borrowings - owed to securitization investors |
1,743 | 2,549 | 3,076 | 3,003 | 2,994 | |||||||||||||||
| Interest on subordinated notes |
126 | 169 | 176 | 168 | 194 | |||||||||||||||
| Interest on junior subordinated debentures |
3,138 | 3,157 | 3,043 | 4,437 | 4,422 | |||||||||||||||
|
|
|
|
|
|
|
|
|
|
|
|||||||||||
| Total interest expense |
27,421 | 30,591 | 32,970 | 36,541 | 36,739 | |||||||||||||||
|
|
|
|
|
|
|
|
|
|
|
|||||||||||
| Net interest income |
128,270 | 125,895 | 124,647 | 118,410 | 108,706 | |||||||||||||||
| Provision for credit losses |
20,691 | 17,400 | 18,817 | 29,290 | 29,187 | |||||||||||||||
|
|
|
|
|
|
|
|
|
|
|
|||||||||||
| Net interest income after provision for credit losses |
107,579 | 108,495 | 105,830 | 89,120 | 79,519 | |||||||||||||||
|
|
|
|
|
|
|
|
|
|
|
|||||||||||
| Non-interest income |
||||||||||||||||||||
| Wealth management |
13,393 | 12,401 | 11,686 | 11,994 | 10,601 | |||||||||||||||
| Mortgage banking |
25,607 | 18,534 | 18,025 | 14,469 | 12,817 | |||||||||||||||
| Service charges on deposit accounts |
3,994 | 4,208 | 3,973 | 4,085 | 3,594 | |||||||||||||||
| Gains on available-for-sale securities, net |
1,109 | 816 | 309 | 225 | 1,152 | |||||||||||||||
| Gain on bargain purchases, net |
(55 | ) | 840 | — | 27,390 | 746 | ||||||||||||||
| Trading (losses) gains |
(928 | ) | 146 | 216 | 591 | (30 | ) | |||||||||||||
| Other |
7,815 | 10,078 | 10,703 | 8,493 | 7,772 | |||||||||||||||
|
|
|
|
|
|
|
|
|
|
|
|||||||||||
| Total non-interest income |
50,935 | 47,023 | 44,912 | 67,247 | 36,652 | |||||||||||||||
|
|
|
|
|
|
|
|
|
|
|
|||||||||||
| Non-interest expense |
||||||||||||||||||||
| Salaries and employee benefits |
68,139 | 69,030 | 66,744 | 61,863 | 53,079 | |||||||||||||||
| Equipment |
5,466 | 5,400 | 5,093 | 4,501 | 4,409 | |||||||||||||||
| Occupancy, net |
7,728 | 8,062 | 7,975 | 7,512 | 6,772 | |||||||||||||||
| Data processing |
3,840 | 3,618 | 4,062 | 3,836 | 3,147 | |||||||||||||||
| Advertising and marketing |
2,179 | 2,006 | 3,207 | 2,119 | 1,440 | |||||||||||||||
| Professional fees |
3,847 | 3,604 | 3,710 | 5,085 | 4,533 | |||||||||||||||
| Amortization of other intangible assets |
1,089 | 1,049 | 1,062 | 970 | 704 | |||||||||||||||
| FDIC insurance |
3,477 | 3,357 | 3,244 | 3,100 | 3,281 | |||||||||||||||
| OREO expenses, net |
5,848 | 7,178 | 8,821 | 5,134 | 6,577 | |||||||||||||||
| Other |
15,572 | 14,455 | 14,850 | 12,201 | 13,264 | |||||||||||||||
|
|
|
|
|
|
|
|
|
|
|
|||||||||||
| Total non-interest expense |
117,185 | 117,759 | 118,768 | 106,321 | 97,206 | |||||||||||||||
|
|
|
|
|
|
|
|
|
|
|
|||||||||||
| Income before taxes |
41,329 | 37,759 | 31,974 | 50,046 | 18,965 | |||||||||||||||
| Income tax expense |
15,734 | 14,549 | 12,753 | 19,844 | 7,215 | |||||||||||||||
|
|
|
|
|
|
|
|
|
|
|
|||||||||||
| Net income |
$ | 25,595 | $ | 23,210 | $ | 19,221 | $ | 30,202 | $ | 11,750 | ||||||||||
|
|
|
|
|
|
|
|
|
|
|
|||||||||||
| Preferred stock dividends and discount accretion |
$ | 2,644 | $ | 1,246 | $ | 1,032 | $ | 1,032 | $ | 1,033 | ||||||||||
|
|
|
|
|
|
|
|
|
|
|
|||||||||||
| Net income applicable to common shares |
$ | 22,951 | $ | 21,964 | $ | 18,189 | $ | 29,170 | $ | 10,717 | ||||||||||
|
|
|
|
|
|
|
|
|
|
|
|||||||||||
| Net income per common share - Basic |
$ | 0.63 | $ | 0.61 | $ | 0.51 | $ | 0.82 | $ | 0.31 | ||||||||||
|
|
|
|
|
|
|
|
|
|
|
|||||||||||
| Net income per common share - Diluted |
$ | 0.52 | $ | 0.50 | $ | 0.41 | $ | 0.65 | $ | 0.25 | ||||||||||
|
|
|
|
|
|
|
|
|
|
|
|||||||||||
| Cash dividends declared per common share |
$ | — | $ | 0.09 | $ | — | $ | 0.09 | $ | — | ||||||||||
|
|
|
|
|
|
|
|
|
|
|
|||||||||||
| Weighted average common shares outstanding |
36,329 | 36,207 | 35,958 | 35,550 | 34,971 | |||||||||||||||
| Dilutive potential common shares |
7,770 | 7,530 | 8,480 | 10,551 | 8,438 | |||||||||||||||
|
|
|
|
|
|
|
|
|
|
|
|||||||||||
| Average common shares and dilutive common shares |
44,099 | 43,737 | 44,438 | 46,101 | 43,409 | |||||||||||||||
|
|
|
|
|
|
|
|
|
|
|
|||||||||||
50
WINTRUST FINANCIAL CORPORATION – SUPPLEMENTAL FINANCIAL INFORMATION
Period End Loan Balances – 5 Quarter Trends
| (Dollars in thousands) |
June 30, 2012 |
March 31, 2012 |
December 31, 2011 |
September 30, 2011 |
June 30, 2011 |
|||||||||||||||
| Balance: |
||||||||||||||||||||
| Commercial |
$ | 2,673,181 | $ | 2,544,456 | $ | 2,498,313 | $ | 2,337,098 | $ | 2,132,436 | ||||||||||
| Commercial real estate |
3,666,519 | 3,585,760 | 3,514,261 | 3,465,321 | 3,374,668 | |||||||||||||||
| Home equity |
820,991 | 840,364 | 862,345 | 879,180 | 880,702 | |||||||||||||||
| Residential real-estate |
375,494 | 361,327 | 350,289 | 326,207 | 329,381 | |||||||||||||||
| Premium finance receivables - commercial |
1,830,044 | 1,512,630 | 1,412,454 | 1,417,572 | 1,429,436 | |||||||||||||||
| Premium finance receivables - life insurance |
1,656,200 | 1,693,763 | 1,695,225 | 1,671,443 | 1,619,668 | |||||||||||||||
| Indirect consumer (1) |
72,482 | 67,445 | 64,545 | 62,452 | 57,718 | |||||||||||||||
| Consumer and other |
107,931 | 111,639 | 123,945 | 113,438 | 101,068 | |||||||||||||||
|
|
|
|
|
|
|
|
|
|
|
|||||||||||
| Total loans, net of unearned income, excluding covered loans |
$ | 11,202,842 | $ | 10,717,384 | $ | 10,521,377 | $ | 10,272,711 | $ | 9,925,077 | ||||||||||
| Covered loans |
614,062 | 691,220 | 651,368 | 680,075 | 408,669 | |||||||||||||||
|
|
|
|
|
|
|
|
|
|
|
|||||||||||
| Total loans, net of unearned income |
$ | 11,816,904 | $ | 11,408,604 | $ | 11,172,745 | $ | 10,952,786 | $ | 10,333,746 | ||||||||||
|
|
|
|
|
|
|
|
|
|
|
|||||||||||
| Mix: |
||||||||||||||||||||
| Commercial |
23 | % | 22 | % | 22 | % | 21 | % | 20 | % | ||||||||||
| Commercial real estate |
31 | 32 | 31 | 32 | 33 | |||||||||||||||
| Home equity |
7 | 7 | 8 | 8 | 8 | |||||||||||||||
| Residential real-estate |
3 | 3 | 3 | 3 | 3 | |||||||||||||||
| Premium finance receivables - commercial |
15 | 13 | 13 | 13 | 14 | |||||||||||||||
| Premium finance receivables - life insurance |
14 | 15 | 15 | 15 | 16 | |||||||||||||||
| Indirect consumer (1) |
1 | 1 | 1 | 1 | 1 | |||||||||||||||
| Consumer and other |
1 | 1 | 1 | 1 | 1 | |||||||||||||||
|
|
|
|
|
|
|
|
|
|
|
|||||||||||
| Total loans, net of unearned income, excluding covered loans |
95 | % | 94 | % | 94 | % | 94 | % | 96 | % | ||||||||||
| Covered loans |
5 | 6 | 6 | 6 | 4 | |||||||||||||||
|
|
|
|
|
|
|
|
|
|
|
|||||||||||
| Total loans, net of unearned income |
100 | % | 100 | % | 100 | % | 100 | % | 100 | % | ||||||||||
|
|
|
|
|
|
|
|
|
|
|
|||||||||||
| (1) | Includes autos, boats, snowmobiles and other indirect consumer loans. |
WINTRUST FINANCIAL CORPORATION – SUPPLEMENTAL FINANCIAL INFORMATION
Period End Deposits Balances – 5 Quarter Trends
| (Dollars in thousands) |
June 30, 2012 |
March 31, 2012 |
December 31, 2011 |
September 30, 2011 |
June 30, 2011 |
|||||||||||||||
| Balance: |
||||||||||||||||||||
| Non-interest bearing |
$ | 2,047,715 | $ | 1,901,753 | $ | 1,785,433 | $ | 1,631,709 | $ | 1,397,433 | ||||||||||
| NOW |
1,780,872 | 1,756,313 | 1,698,778 | 1,633,752 | 1,530,068 | |||||||||||||||
| Wealth Management deposits (1) |
954,319 | 933,609 | 788,311 | 730,315 | 737,428 | |||||||||||||||
| Money Market |
2,335,238 | 2,306,726 | 2,263,253 | 2,190,117 | 1,985,661 | |||||||||||||||
| Savings |
958,295 | 943,066 | 888,592 | 867,483 | 736,974 | |||||||||||||||
| Time certificates of deposit |
4,981,142 | 4,824,386 | 4,882,900 | 5,252,632 | 4,871,696 | |||||||||||||||
|
|
|
|
|
|
|
|
|
|
|
|||||||||||
| Total deposits |
$ | 13,057,581 | $ | 12,665,853 | $ | 12,307,267 | $ | 12,306,008 | $ | 11,259,260 | ||||||||||
|
|
|
|
|
|
|
|
|
|
|
|||||||||||
| Mix: |
||||||||||||||||||||
| Non-interest bearing |
16 | % | 15 | % | 15 | % | 13 | % | 12 | % | ||||||||||
| NOW |
14 | 14 | 14 | 13 | 14 | |||||||||||||||
| Wealth Management deposits (1) |
7 | 7 | 6 | 6 | 6 | |||||||||||||||
| Money Market |
18 | 18 | 18 | 18 | 18 | |||||||||||||||
| Savings |
7 | 8 | 7 | 7 | 7 | |||||||||||||||
| Time certificates of deposit |
38 | 38 | 40 | 43 | 43 | |||||||||||||||
|
|
|
|
|
|
|
|
|
|
|
|||||||||||
| Total deposits |
100 | % | 100 | % | 100 | % | 100 | % | 100 | % | ||||||||||
|
|
|
|
|
|
|
|
|
|
|
|||||||||||
| (1) | Represents deposit balances of the Company’s subsidiary banks from brokerage customers of Wayne Hummer Investments, trust and asset management customers of The Chicago Trust Company and brokerage customers from unaffiliated companies which have been placed into deposit accounts of the Banks. |
51
WINTRUST FINANCIAL CORPORATION – SUPPLEMENTAL FINANCIAL INFORMATION
Net Interest Margin (Including Call Option Income) – 5 Quarter Trends
| Three Months Ended | ||||||||||||||||||||
| (Dollars in thousands) |
June 30, 2012 |
March 31, 2012 |
December 31, 2011 |
September 30, 2011 |
June 30, 2011 |
|||||||||||||||
| Net interest income |
$ | 128,741 | $ | 126,361 | $ | 125,101 | $ | 118,828 | $ | 109,114 | ||||||||||
| Call option income |
3,114 | 3,123 | 5,377 | 3,436 | 2,287 | |||||||||||||||
|
|
|
|
|
|
|
|
|
|
|
|||||||||||
| Net interest income including call option income |
$ | 131,855 | $ | 129,484 | $ | 130,478 | $ | 122,264 | $ | 111,401 | ||||||||||
|
|
|
|
|
|
|
|
|
|
|
|||||||||||
| Yield on earning assets |
4.25 | % | 4.41 | % | 4.36 | % | 4.41 | % | 4.54 | % | ||||||||||
| Rate on interest-bearing liabilities |
0.89 | 1.00 | 1.05 | 1.18 | 1.32 | |||||||||||||||
|
|
|
|
|
|
|
|
|
|
|
|||||||||||
| Rate spread |
3.36 | % | 3.41 | % | 3.31 | % | 3.23 | % | 3.22 | % | ||||||||||
| Net free funds contribution |
0.15 | 0.14 | 0.14 | 0.14 | 0.18 | |||||||||||||||
|
|
|
|
|
|
|
|
|
|
|
|||||||||||
| Net interest margin |
3.51 | 3.55 | 3.45 | 3.37 | 3.40 | |||||||||||||||
| Call option income |
0.08 | 0.09 | 0.15 | 0.10 | 0.07 | |||||||||||||||
|
|
|
|
|
|
|
|
|
|
|
|||||||||||
| Net interest margin including call option income |
3.59 | % | 3.64 | % | 3.60 | % | 3.47 | % | 3.47 | % | ||||||||||
|
|
|
|
|
|
|
|
|
|
|
|||||||||||
WINTRUST FINANCIAL CORPORATION – SUPPLEMENTAL FINANCIAL INFORMATION
Net Interest Margin (Including Call Option Income – YTD Trends)
| Six Months Ended June 30, |
Years Ended December 31, |
|||||||||||||||||||
| (Dollars in thousands) |
2012 | 2011 | 2010 | 2009 | 2008 | |||||||||||||||
| Net interest income |
$ | 255,102 | $ | 463,071 | $ | 417,564 | $ | 314,096 | $ | 247,054 | ||||||||||
| Call option income |
6,237 | 13,570 | 2,235 | 1,998 | 29,024 | |||||||||||||||
|
|
|
|
|
|
|
|
|
|
|
|||||||||||
| Net interest income including call option income |
$ | 261,339 | $ | 476,641 | $ | 419,799 | $ | 316,094 | $ | 276,078 | ||||||||||
|
|
|
|
|
|
|
|
|
|
|
|||||||||||
| Yield on earning assets |
4.33 | % | 4.49 | % | 4.80 | % | 5.07 | % | 5.88 | % | ||||||||||
| Rate on interest-bearing liabilities |
0.94 | 1.23 | 1.61 | 2.29 | 3.31 | |||||||||||||||
|
|
|
|
|
|
|
|
|
|
|
|||||||||||
| Rate spread |
3.39 | % | 3.26 | % | 3.19 | % | 2.78 | % | 2.57 | % | ||||||||||
| Net free funds contribution |
0.14 | 0.16 | 0.18 | 0.23 | 0.24 | |||||||||||||||
|
|
|
|
|
|
|
|
|
|
|
|||||||||||
| Net interest margin |
3.53 | 3.42 | 3.37 | 3.01 | 2.81 | |||||||||||||||
| Call option income |
0.09 | 0.10 | 0.02 | 0.02 | 0.33 | |||||||||||||||
|
|
|
|
|
|
|
|
|
|
|
|||||||||||
| Net interest margin including call option income |
3.62 | % | 3.52 | % | 3.39 | % | 3.03 | % | 3.14 | % | ||||||||||
|
|
|
|
|
|
|
|
|
|
|
|||||||||||
52
WINTRUST FINANCIAL CORPORATION – SUPPLEMENTAL FINANCIAL INFORMATION
Quarterly Average Balances – 5 Quarter Trends
| Three Months Ended | ||||||||||||||||||||
| (In thousands) |
June 30, 2012 |
March 31, 2012 |
December 31, 2011 |
September 30, 2011 |
June 30, 2011 |
|||||||||||||||
| Liquidity management assets |
$ | 2,781,730 | $ | 2,756,833 | $ | 3,051,850 | $ | 3,083,508 | $ | 2,591,398 | ||||||||||
| Other earning assets |
30,761 | 30,499 | 28,828 | 28,834 | 28,886 | |||||||||||||||
| Loans, net of unearned income |
11,300,395 | 10,848,016 | 10,662,516 | 10,200,733 | 9,859,789 | |||||||||||||||
| Covered loans |
659,783 | 667,242 | 652,157 | 680,003 | 418,129 | |||||||||||||||
|
|
|
|
|
|
|
|
|
|
|
|||||||||||
| Total earning assets |
$ | 14,772,669 | $ | 14,302,590 | $ | 14,395,351 | $ | 13,993,078 | $ | 12,898,202 | ||||||||||
|
|
|
|
|
|
|
|
|
|
|
|||||||||||
| Allowance for loan losses |
(134,077 | ) | (131,769 | ) | (137,423 | ) | (128,848 | ) | (125,537 | ) | ||||||||||
| Cash and due from banks |
152,118 | 143,869 | 130,437 | 140,010 | 135,670 | |||||||||||||||
| Other assets |
1,528,497 | 1,520,660 | 1,625,844 | 1,522,187 | 1,196,801 | |||||||||||||||
|
|
|
|
|
|
|
|
|
|
|
|||||||||||
| Total assets |
$ | 16,319,207 | $ | 15,835,350 | $ | 16,014,209 | $ | 15,526,427 | $ | 14,105,136 | ||||||||||
|
|
|
|
|
|
|
|
|
|
|
|||||||||||
| Interest-bearing deposits |
$ | 10,815,018 | $ | 10,481,822 | $ | 10,563,090 | $ | 10,442,886 | $ | 9,491,778 | ||||||||||
| Federal Home Loan Bank advances |
514,513 | 470,345 | 474,549 | 486,379 | 421,502 | |||||||||||||||
| Notes payable and other borrowings |
422,146 | 505,814 | 468,139 | 461,141 | 338,304 | |||||||||||||||
| Secured borrowings - owed to securitization investors |
407,259 | 514,923 | 600,000 | 600,000 | 600,000 | |||||||||||||||
| Subordinated notes |
23,791 | 35,000 | 38,370 | 40,000 | 45,440 | |||||||||||||||
| Junior subordinated notes |
249,493 | 249,493 | 249,493 | 249,493 | 249,493 | |||||||||||||||
|
|
|
|
|
|
|
|
|
|
|
|||||||||||
| Total interest-bearing liabilities |
$ | 12,432,220 | $ | 12,257,397 | $ | 12,393,641 | $ | 12,279,899 | $ | 11,146,517 | ||||||||||
|
|
|
|
|
|
|
|
|
|
|
|||||||||||
| Non-interest bearing deposits |
1,993,880 | 1,832,627 | 1,755,446 | 1,553,769 | 1,349,549 | |||||||||||||||
| Other liabilities |
197,667 | 180,664 | 333,186 | 185,042 | 148,999 | |||||||||||||||
| Equity |
1,695,440 | 1,564,662 | 1,531,936 | 1,507,717 | 1,460,071 | |||||||||||||||
|
|
|
|
|
|
|
|
|
|
|
|||||||||||
| Total liabilities and shareholders’ equity |
$ | 16,319,207 | $ | 15,835,350 | $ | 16,014,209 | $ | 15,526,427 | $ | 14,105,136 | ||||||||||
|
|
|
|
|
|
|
|
|
|
|
|||||||||||
WINTRUST FINANCIAL CORPORATION – SUPPLEMENTAL FINANCIAL INFORMATION
Net Interest Margin – 5 Quarter Trends
| Three Months Ended | ||||||||||||||||||||
| June 30, 2012 |
March 31, 2012 |
December 31, 2011 |
September 30, 2011 |
June 30, 2011 |
||||||||||||||||
| Yield earned on: |
||||||||||||||||||||
| Liquidity management assets |
1.69 | % | 1.90 | % | 1.85 | % | 1.87 | % | 2.04 | % | ||||||||||
| Other earning assets |
3.04 | 2.96 | 2.90 | 2.98 | 2.89 | |||||||||||||||
| Loans, net of unearned income |
4.64 | 4.77 | 4.78 | 4.97 | 5.05 | |||||||||||||||
| Covered loans |
8.50 | 8.98 | 9.20 | 7.54 | 8.06 | |||||||||||||||
|
|
|
|
|
|
|
|
|
|
|
|||||||||||
| Total earning assets |
4.25 | % | 4.41 | % | 4.36 | % | 4.41 | % | 4.54 | % | ||||||||||
|
|
|
|
|
|
|
|
|
|
|
|||||||||||
| Rate paid on: |
||||||||||||||||||||
| Interest-bearing deposits |
0.64 | % | 0.69 | % | 0.74 | % | 0.83 | % | 0.95 | % | ||||||||||
| Federal Home Loan Bank advances |
2.24 | 3.06 | 3.50 | 3.40 | 3.82 | |||||||||||||||
| Notes payable and other borrowings |
2.17 | 2.47 | 2.38 | 2.47 | 3.22 | |||||||||||||||
| Secured borrowings - owed to securitization investors |
1.72 | 1.99 | 2.03 | 1.99 | 2.00 | |||||||||||||||
| Subordinated notes |
2.10 | 1.91 | 1.79 | 1.65 | 1.69 | |||||||||||||||
| Junior subordinated notes |
4.97 | 5.01 | 4.77 | 6.96 | 7.01 | |||||||||||||||
|
|
|
|
|
|
|
|
|
|
|
|||||||||||
| Total interest-bearing liabilities |
0.89 | % | 1.00 | % | 1.05 | % | 1.18 | % | 1.32 | % | ||||||||||
|
|
|
|
|
|
|
|
|
|
|
|||||||||||
| Interest rate spread |
3.36 | % | 3.41 | % | 3.31 | % | 3.23 | % | 3.22 | % | ||||||||||
| Net free funds/contribution |
0.15 | 0.14 | 0.14 | 0.14 | 0.18 | |||||||||||||||
|
|
|
|
|
|
|
|
|
|
|
|||||||||||
| Net interest income/Net interest margin |
3.51 | % | 3.55 | % | 3.45 | % | 3.37 | % | 3.40 | % | ||||||||||
|
|
|
|
|
|
|
|
|
|
|
|||||||||||
53
WINTRUST FINANCIAL CORPORATION – SUPPLEMENTAL FINANCIAL INFORMATION
Non-Interest Income – 5 Quarter Trends
| Three Months Ended | ||||||||||||||||||||
| (In thousands) |
June 30, 2012 |
March 31, 2012 |
December 31, 2011 |
September 30, 2011 |
June 30, 2011 |
|||||||||||||||
| Brokerage |
$ | 6,396 | $ | 6,322 | $ | 5,960 | $ | 6,108 | $ | 6,208 | ||||||||||
| Trust and asset management |
6,997 | 6,079 | 5,726 | 5,886 | 4,393 | |||||||||||||||
|
|
|
|
|
|
|
|
|
|
|
|||||||||||
| Total wealth management |
13,393 | 12,401 | 11,686 | 11,994 | 10,601 | |||||||||||||||
|
|
|
|
|
|
|
|
|
|
|
|||||||||||
| Mortgage banking |
25,607 | 18,534 | 18,025 | 14,469 | 12,817 | |||||||||||||||
| Service charges on deposit accounts |
3,994 | 4,208 | 3,973 | 4,085 | 3,594 | |||||||||||||||
| Gains on available-for-sale securities |
1,109 | 816 | 309 | 225 | 1,152 | |||||||||||||||
| Gain on bargain purchases |
(55 | ) | 840 | — | 27,390 | 746 | ||||||||||||||
| Trading gains (losses) |
(928 | ) | 146 | 216 | 591 | (30 | ) | |||||||||||||
| Other: |
||||||||||||||||||||
| Fees from covered call options |
3,114 | 3,123 | 5,377 | 3,436 | 2,287 | |||||||||||||||
| Bank Owned Life Insurance |
505 | 919 | 681 | 351 | 661 | |||||||||||||||
| Administrative services |
823 | 766 | 789 | 784 | 781 | |||||||||||||||
| Miscellaneous |
3,373 | 5,270 | 3,856 | 3,922 | 4,043 | |||||||||||||||
|
|
|
|
|
|
|
|
|
|
|
|||||||||||
| Total other income |
7,815 | 10,078 | 10,703 | 8,493 | 7,772 | |||||||||||||||
|
|
|
|
|
|
|
|
|
|
|
|||||||||||
| Total Non-Interest Income |
$ | 50,935 | $ | 47,023 | $ | 44,912 | $ | 67,247 | $ | 36,652 | ||||||||||
|
|
|
|
|
|
|
|
|
|
|
|||||||||||
WINTRUST FINANCIAL CORPORATION – SUPPLEMENTAL FINANCIAL INFORMATION
Non-Interest Expense – 5 Quarter Trends
| Three Months Ended | ||||||||||||||||||||
| (In thousands) |
June 30, 2012 |
March 31, 2012 |
December 31, 2011 |
September 30, 2011 |
June 30, 2011 |
|||||||||||||||
| Salaries and employee benefits: |
||||||||||||||||||||
| Salaries |
$ | 37,237 | $ | 37,933 | $ | 36,676 | $ | 36,633 | $ | 32,008 | ||||||||||
| Commissions and bonus |
19,388 | 16,802 | 19,263 | 14,984 | 10,760 | |||||||||||||||
| Benefits |
11,514 | 14,295 | 10,805 | 10,246 | 10,311 | |||||||||||||||
|
|
|
|
|
|
|
|
|
|
|
|||||||||||
| Total salaries and employee benefits |
68,139 | 69,030 | 66,744 | 61,863 | 53,079 | |||||||||||||||
| Equipment |
5,466 | 5,400 | 5,093 | 4,501 | 4,409 | |||||||||||||||
| Occupancy, net |
7,728 | 8,062 | 7,975 | 7,512 | 6,772 | |||||||||||||||
| Data processing |
3,840 | 3,618 | 4,062 | 3,836 | 3,147 | |||||||||||||||
| Advertising and marketing |
2,179 | 2,006 | 3,207 | 2,119 | 1,440 | |||||||||||||||
| Professional fees |
3,847 | 3,604 | 3,710 | 5,085 | 4,533 | |||||||||||||||
| Amortization of other intangible assets |
1,089 | 1,049 | 1,062 | 970 | 704 | |||||||||||||||
| FDIC insurance |
3,477 | 3,357 | 3,244 | 3,100 | 3,281 | |||||||||||||||
| OREO expenses, net |
5,848 | 7,178 | 8,821 | 5,134 | 6,577 | |||||||||||||||
| Other: |
||||||||||||||||||||
| Commissions - 3rd party brokers |
1,069 | 1,021 | 872 | 936 | 991 | |||||||||||||||
| Postage |
1,330 | 1,423 | 1,322 | 1,102 | 1,170 | |||||||||||||||
| Stationery and supplies |
1,035 | 919 | 1,186 | 904 | 888 | |||||||||||||||
| Miscellaneous |
12,138 | 11,092 | 11,470 | 9,259 | 10,215 | |||||||||||||||
|
|
|
|
|
|
|
|
|
|
|
|||||||||||
| Total other expense |
15,572 | 14,455 | 14,850 | 12,201 | 13,264 | |||||||||||||||
|
|
|
|
|
|
|
|
|
|
|
|||||||||||
| Total Non-Interest Expense |
$ | 117,185 | $ | 117,759 | $ | 118,768 | $ | 106,321 | $ | 97,206 | ||||||||||
|
|
|
|
|
|
|
|
|
|
|
|||||||||||
54
WINTRUST FINANCIAL CORPORATION – SUPPLEMENTAL FINANCIAL INFORMATION
Allowance for Credit Losses, excluding covered loans – 5 Quarter Trends
| Three Months Ended | ||||||||||||||||||||
| (Dollars in thousands) |
June 30, 2012 |
March 31, 2012 |
December 31, 2011 |
September 30, 2011 |
June 30, 2011 |
|||||||||||||||
| Allowance for loan losses at beginning of period |
$ | 111,023 | $ | 110,381 | $ | 118,649 | $ | 117,362 | $ | 115,049 | ||||||||||
| Provision for credit losses |
18,394 | 15,154 | 16,615 | 28,263 | 28,666 | |||||||||||||||
| Other adjustments |
(272 | ) | (238 | ) | — | — | — | |||||||||||||
| Reclassification from/(to) allowance for unfunded lending-related commitments |
175 | 152 | 171 | (66 | ) | (317 | ) | |||||||||||||
| Charge-offs: |
||||||||||||||||||||
| Commercial |
6,046 | 3,262 | 6,377 | 8,851 | 7,583 | |||||||||||||||
| Commercial real estate |
9,226 | 8,229 | 13,931 | 14,734 | 20,691 | |||||||||||||||
| Home equity |
1,732 | 2,590 | 1,876 | 1,071 | 1,300 | |||||||||||||||
| Residential real estate |
388 | 175 | 1,632 | 926 | 282 | |||||||||||||||
| Premium finance receivables - commercial |
744 | 837 | 1,479 | 1,738 | 1,893 | |||||||||||||||
| Premium finance receivables - life insurance |
3 | 13 | — | 31 | 214 | |||||||||||||||
| Indirect consumer |
33 | 51 | 56 | 24 | 44 | |||||||||||||||
| Consumer and other |
51 | 310 | 824 | 282 | 266 | |||||||||||||||
|
|
|
|
|
|
|
|
|
|
|
|||||||||||
| Total charge-offs |
18,223 | 15,467 | 26,175 | 27,657 | 32,273 | |||||||||||||||
|
|
|
|
|
|
|
|
|
|
|
|||||||||||
| Recoveries: |
||||||||||||||||||||
| Commercial |
246 | 257 | 541 | 150 | 301 | |||||||||||||||
| Commercial real estate |
174 | 131 | 286 | 299 | 463 | |||||||||||||||
| Home equity |
171 | 162 | 5 | 32 | 19 | |||||||||||||||
| Residential real estate |
3 | 2 | 2 | 3 | 3 | |||||||||||||||
| Premium finance receivables - commercial |
153 | 277 | 204 | 159 | 5,375 | |||||||||||||||
| Premium finance receivables - life insurance |
18 | 21 | — | — | 12 | |||||||||||||||
| Indirect consumer |
21 | 30 | 37 | 75 | 42 | |||||||||||||||
| Consumer and other |
37 | 161 | 46 | 29 | 22 | |||||||||||||||
|
|
|
|
|
|
|
|
|
|
|
|||||||||||
| Total recoveries |
823 | 1,041 | 1,121 | 747 | 6,237 | |||||||||||||||
|
|
|
|
|
|
|
|
|
|
|
|||||||||||
| Net charge-offs |
(17,400 | ) | (14,426 | ) | (25,054 | ) | (26,910 | ) | (26,036 | ) | ||||||||||
| Allowance for loan losses at period end |
$ | 111,920 | $ | 111,023 | $ | 110,381 | $ | 118,649 | $ | 117,362 | ||||||||||
| Allowance for unfunded lending-related commitments at period end |
12,903 | 13,078 | 13,231 | 13,402 | 2,335 | |||||||||||||||
|
|
|
|
|
|
|
|
|
|
|
|||||||||||
| Allowance for credit losses at period end |
$ | 124,823 | $ | 124,101 | $ | 123,612 | $ | 132,051 | $ | 119,697 | ||||||||||
|
|
|
|
|
|
|
|
|
|
|
|||||||||||
| Annualized net charge-offs by category as a percentage of its own respective category’s average: |
||||||||||||||||||||
| Commercial |
0.91 | % | 0.49 | % | 0.96 | % | 1.60 | % | 1.45 | % | ||||||||||
| Commercial real estate |
1.01 | 0.92 | 1.56 | 1.69 | 2.40 | |||||||||||||||
| Home equity |
0.76 | 1.15 | 0.85 | 0.47 | 0.58 | |||||||||||||||
| Residential real estate |
0.20 | 0.11 | 1.07 | 0.80 | 0.25 | |||||||||||||||
| Premium finance receivables - commercial |
0.14 | 0.15 | 0.35 | 0.42 | (0.99 | ) | ||||||||||||||
| Premium finance receivables - life insurance |
— | — | — | 0.01 | 0.05 | |||||||||||||||
| Indirect consumer |
0.07 | 0.13 | 0.12 | (0.33 | ) | 0.02 | ||||||||||||||
| Consumer and other |
0.05 | 0.49 | 2.35 | 0.84 | 0.98 | |||||||||||||||
|
|
|
|
|
|
|
|
|
|
|
|||||||||||
| Total loans, net of unearned income, excluding covered loans |
0.62 | % | 0.53 | % | 0.93 | % | 1.05 | % | 1.06 | % | ||||||||||
|
|
|
|
|
|
|
|
|
|
|
|||||||||||
| Net charge-offs as a percentage of the provision for credit losses |
94.60 | % | 95.20 | % | 150.79 | % | 95.21 | % | 90.83 | % | ||||||||||
| Loans at period-end |
$ | 11,202,842 | $ | 10,717,384 | $ | 10,521,377 | $ | 10,272,711 | $ | 9,925,077 | ||||||||||
| Allowance for loan losses as a percentage of loans at period end |
1.00 | % | 1.04 | % | 1.05 | % | 1.15 | % | 1.18 | % | ||||||||||
| Allowance for credit losses as a percentage of loans at period end |
1.11 | % | 1.16 | % | 1.17 | % | 1.29 | % | 1.21 | % | ||||||||||
55
WINTRUST FINANCIAL CORPORATION – SUPPLEMENTAL FINANCIAL INFORMATION
Non-Performing Assets, excluding covered assets – 5 Quarter Trends
| (Dollars in thousands) |
June 30, 2012 |
March 31, 2012 |
December 31, 2011 |
September 30, 2011 |
June 30, 2011 |
|||||||||||||||
| Loans past due greater than 90 days and still accruing: |
||||||||||||||||||||
| Commercial |
$ | — | $ | — | $ | — | $ | — | $ | — | ||||||||||
| Commercial real-estate |
— | 73 | — | 1,105 | — | |||||||||||||||
| Home equity |
— | — | — | — | — | |||||||||||||||
| Residential real-estate |
— | — | — | — | — | |||||||||||||||
| Premium finance receivables - commercial |
5,184 | 4,619 | 5,281 | 4,599 | 4,446 | |||||||||||||||
| Premium finance receivables - life insurance |
— | — | — | 2,413 | 324 | |||||||||||||||
| Indirect consumer |
234 | 257 | 314 | 292 | 284 | |||||||||||||||
| Consumer and other |
— | — | — | — | — | |||||||||||||||
|
|
|
|
|
|
|
|
|
|
|
|||||||||||
| Total loans past due greater than 90 days and still accruing |
5,418 | 4,949 | 5,595 | 8,409 | 5,054 | |||||||||||||||
| Non-accrual loans: |
||||||||||||||||||||
| Commercial |
30,473 | 19,835 | 19,018 | 24,836 | 26,168 | |||||||||||||||
| Commercial real-estate |
56,077 | 62,704 | 66,508 | 69,669 | 89,793 | |||||||||||||||
| Home equity |
10,583 | 12,881 | 14,164 | 15,426 | 15,853 | |||||||||||||||
| Residential real-estate |
9,387 | 5,329 | 6,619 | 7,546 | 7,379 | |||||||||||||||
| Premium finance receivables - commercial |
7,404 | 7,650 | 7,755 | 6,942 | 10,309 | |||||||||||||||
| Premium finance receivables - life insurance |
— | — | 54 | 349 | 670 | |||||||||||||||
| Indirect consumer |
132 | 152 | 138 | 146 | 89 | |||||||||||||||
| Consumer and other |
1,446 | 121 | 233 | 653 | 757 | |||||||||||||||
|
|
|
|
|
|
|
|
|
|
|
|||||||||||
| Total non-accrual loans |
115,502 | 108,672 | 114,489 | 125,567 | 151,018 | |||||||||||||||
| Total non-performing loans: |
||||||||||||||||||||
| Commercial |
30,473 | 19,835 | 19,018 | 24,836 | 26,168 | |||||||||||||||
| Commercial real-estate |
56,077 | 62,777 | 66,508 | 70,774 | 89,793 | |||||||||||||||
| Home equity |
10,583 | 12,881 | 14,164 | 15,426 | 15,853 | |||||||||||||||
| Residential real-estate |
9,387 | 5,329 | 6,619 | 7,546 | 7,379 | |||||||||||||||
| Premium finance receivables - commercial |
12,588 | 12,269 | 13,036 | 11,541 | 14,755 | |||||||||||||||
| Premium finance receivables - life insurance |
— | — | 54 | 2,762 | 994 | |||||||||||||||
| Indirect consumer |
366 | 409 | 452 | 438 | 373 | |||||||||||||||
| Consumer and other |
1,446 | 121 | 233 | 653 | 757 | |||||||||||||||
|
|
|
|
|
|
|
|
|
|
|
|||||||||||
| Total non-performing loans |
$ | 120,920 | $ | 113,621 | $ | 120,084 | $ | 133,976 | $ | 156,072 | ||||||||||
| Other real estate owned |
66,532 | 69,575 | 79,093 | 86,622 | 82,772 | |||||||||||||||
| Other real estate owned - obtained in acquisition |
6,021 | 6,661 | 7,430 | 10,302 | — | |||||||||||||||
|
|
|
|
|
|
|
|
|
|
|
|||||||||||
| Total non-performing assets |
$ | 193,473 | $ | 189,857 | $ | 206,607 | $ | 230,900 | $ | 238,844 | ||||||||||
|
|
|
|
|
|
|
|
|
|
|
|||||||||||
| Total non-performing loans by category as a percent of its own respective category’s period-end balance: |
||||||||||||||||||||
| Commercial |
1.14 | % | 0.78 | % | 0.76 | % | 1.06 | % | 1.23 | % | ||||||||||
| Commercial real-estate |
1.53 | 1.75 | 1.89 | 2.04 | 2.66 | |||||||||||||||
| Home equity |
1.29 | 1.53 | 1.64 | 1.75 | 1.80 | |||||||||||||||
| Residential real-estate |
2.50 | 1.47 | 1.89 | 2.31 | 2.24 | |||||||||||||||
| Premium finance receivables - commercial |
0.69 | 0.81 | 0.92 | 0.81 | 1.03 | |||||||||||||||
| Premium finance receivables - life insurance |
— | — | — | 0.17 | 0.06 | |||||||||||||||
| Indirect consumer |
0.51 | 0.61 | 0.70 | 0.70 | 0.65 | |||||||||||||||
| Consumer and other |
1.34 | 0.11 | 0.19 | 0.58 | 0.75 | |||||||||||||||
|
|
|
|
|
|
|
|
|
|
|
|||||||||||
| Total loans, net of unearned income |
1.08 | % | 1.06 | % | 1.14 | % | 1.30 | % | 1.57 | % | ||||||||||
|
|
|
|
|
|
|
|
|
|
|
|||||||||||
| Total non-performing assets as a percentage of total assets |
1.17 | % | 1.17 | % | 1.30 | % | 1.45 | % | 1.63 | % | ||||||||||
|
|
|
|
|
|
|
|
|
|
|
|||||||||||
| Allowance for loan losses as a percentage of total non-performing loans |
92.56 | % | 97.71 | % | 91.92 | % | 88.56 | % | 75.20 | % | ||||||||||
|
|
|
|
|
|
|
|
|
|
|
|||||||||||
56