Attached files
| file | filename |
|---|---|
| 8-K - FORM 8-K - JOHNSON CONTROLS INC | d382359d8k.htm |
| EX-99.1 - PRESS RELEASE ISSUED BY JOHNSON CONTROLS, INC., DATED JULY 19, 2012 - JOHNSON CONTROLS INC | d382359dex991.htm |
 July
19, 2012 Quarterly update
FY 2012 third quarter
Exhibit 99.2 |
 Agenda
Introduction
Glen Ponczak, Vice President, Global Investor Relations
Overview
Steve Roell, Chairman and Chief Executive Officer
Business results and financial review
Bruce McDonald, Executive Vice President and Chief Financial Officer
Q&A
FORWARD-LOOKING STATEMENT
Johnson Controls, Inc. has made forward-looking statements in this document
pertaining to its financial results for fiscal 2012 and beyond that are
based on preliminary data and are subject to risks and uncertainties. All
statements, other than statements of historical fact, are statements that
are,
or
could
be,
deemed
"forward-looking"
statements
and
include
terms
such
as
"outlook,"
"expectations,"
"estimates"
or
"forecasts."
For
those
statements, the Company cautions that numerous important factors, such as
automotive vehicle production levels, mix and schedules, energy and
commodity
prices,
the
strength
of
the
U.S.
or
other
economies,
currency
exchange
rates,
cancellation
of
or
changes
to
commercial
contracts,
changes in the levels or timing of investments in commercial buildings as well as
other factors discussed in Item 1A of Part I of the Company's most recent
Form 10-k filing (filed November 22, 2011) could affect the Company's actual results and could cause its actual consolidated results to
differ materially from those expressed in any forward-looking statement made
by, or on behalf of, the Company. 2 |
 2012
third quarter* Sales: $10.6 billion
vs. $10.4 billion in Q3 2011
Segment income: $615 million
vs. $541 million in Q3 2011
Net income: $441 million
vs. $383 million in Q3 2011
EPS: $0.64 per diluted share
vs. $0.56 in Q3 2011
3
*Excludes non-recurring items in the 2012 and 2011 quarters
2012 third quarter
Challenging macro environment,
weak foreign currency
Revenue growth less than
expected
-
Negative foreign exchange
impact of $515 million
Net income up 15% to record
$441 million, but lower than
previous guidance of 20%
earnings growth |
 North America auto production up 27% in Q3, but expected
to be up just 4% in Q4
European automotive industry production lower than
expected --
down 5% and weakening
Non-residential building markets not recovering
–
N.A. institutional market: declines in education and healthcare
–
Europe: softness in southern region continues
Soft demand for automotive aftermarket batteries
Record
high
prices
for
battery
“cores”
used
for
recycling
–
Typical: receive one core for every aftermarket battery sold
–
Soft aftermarket demand = few cores coming back
–
Low core supply = higher prices
–
Johnson Controls requires additional cores as initial feedstock for
its South Carolina smelter, launching this summer
4
Challenging macro environment |
 2012
third quarter Positives
Despite market challenges, market share gain and
significant profitability improvements in Building
Efficiency
–
Segment income up 28%
•
Double-digit increases in all five segments
–
Segment margin up 160 basis points
Good opportunities in Asia for building and automotive
businesses
Record warm temperatures a positive to residential
HVAC demand—up 24%
High temperatures shorten battery life—eventual
positive for aftermarket battery demand this winter
5 |
 Restructuring
–
Q3: $52 million
•
Automotive ($11M)
•
Building Efficiency ($41M)
–
Additional restructuring actions likely
in Q4 2012
Continuing cost control initiatives
6
Revised Q4 outlook
0 –
5% year-over-year underlying
earnings growth
Reflects softness in key markets
Continuing battery trends: soft
aftermarket demand, higher
prices for lead to be recycled
General weakness in Europe
Continued operational issues in
automotive
We will continue to adjust as market
conditions warrant
Taking action to reflect market realities and to improve profitability
|
 Despite short-term challenges and disruptions
Our mid-
to long-term strategies and outlook are intact
7
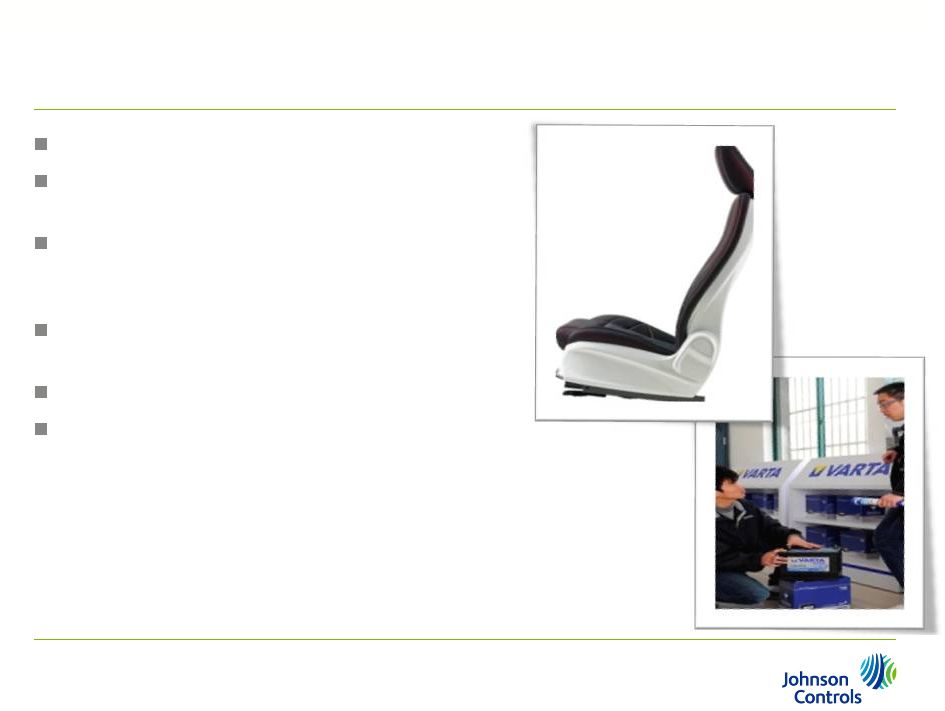
Strong market position in SLI batteries;
ability to drive higher margins through
vertical integration
Investments in AGM battery technology
to support customer demand for start-
stop vehicles
Emerging market leadership in all three
businesses
Higher automotive margins via seating
metals strategy and core product
portfolio / standardization
Building Efficiency market share gains
through our ability to help customers
improve energy efficiency and reduce
greenhouse gas footprint |
 2012
third quarter Building Efficiency
2012
2011
Net sales
$3.8B
$3.9B
(2%)
Revenues up 1%, excluding foreign currency
Higher revenues in Asia, GWS
Europe, Latin America lower
Residential up 24%
Segment income
$264M
$207M
28%
Double-digit margin improvement in all five segments
–
GWS up 86%, North America Service up 49%
Improved labor utilization
Benefits of service delivery technology investments
SG&A cost reduction initiatives
8
Commercial backlog
(at June 30, 2012)
Record $5.3B, up 7%
(ex. currency) |
 2012
third quarter Power Solutions
2012
2011
Net sales
$1.3B
$1.3B (3%)
Revenues up 2% excluding foreign currency
Shipments up 2%
–
OE up 4%; aftermarket up 2%
Demand lower than expected
–
Overall weakness in N.A. automotive aftermarket
Segment income
$149M
$163M (9%)
Higher
cost
of
purchasing
spent
“core”
batteries
for
recycling
–
Building initial feedstock for new South Carolina smelter
Lower European production impacting ramp-up of
AGM demand
9 |
 2012
third quarter Automotive Experience
2012
2011
Net sales
$5.5B
$5.1B
7%
31% increase in North America vs. 27% higher
industry production
–
2011 quarter impacted by Japanese tsunami
Europe
revenues
flat
(excluding
currency)
vs.
5%
lower
industry production
Asia +24%
China sales (mostly non-consolidated): up 24% to $1.2 billion
Segment income*
$202M
$171M
18%
Higher production volumes in North America, Asia
Lower Europe production a negative
–
Complicating efforts to reduce operational inefficiencies
associated with earlier launch difficulties
–
South America unprofitable
Disappointing performance of metals business
10
Return on sales by
geography*
N. America:
6.6%
Europe:
-1.5%
Asia:
12.5%
*Excludes non-recurring items
(vs. 9.3% in 2011)
(vs. 1.9% in 2011)
(vs. 3.8% in 2011) |
 (in millions)
2012
(reported)
2011*
(excluding items)
%
change
2011
(reported)
Sales
$10,581
$10,364
2%
$10,364
Gross profit
% of sales
1,537
14.5%
1,550
15.0%
(1%)
1,550
15.0%
SG&A expenses
992
1,065
(7%)
1,094
Equity income
70
56
25%
56
Segment income
$615
$541
14%
$512
5.8%
5.2%
4.9%
Third quarter 2012
Financial highlights
11
FX
–
Euro
to
U.S.
dollar
average
exchange
rate
at
$1.28
in
Q3
2012
vs.
$1.44
in
2011
Sales
–
Excluding
FX,
sales
up
7%
Gross
profit
–
Higher
volumes
offset
by
business
mix,
higher
lead
costs
and
costs
associated
with
launch difficulties
SG&A
–
Cost
management
initiatives
Equity
income
–
Consolidation
of
hybrid
business
in
2012
and
growth
in
Automotive
Experience
JVs
* 2011 excludes acquisition related costs of $29 million
|
 Third
quarter 2012 Financial highlights
Financing
charges-net
–
Higher
debt
levels
Income tax provision –
2012 tax rate of 16.2% vs. 18.5% in 2011 due to a revised
geographic mix of projected income
12
(in millions, except earnings per share)
2012*
(excluding
items)
2011*
(excluding
items)
2012
(reported)
2011
(reported)
Segment income
$615
$541
$615
$512
Restructuring costs
-
-
52
-
Financing
charges
-
net
59
43
59
43
Income before taxes
556
498
504
469
Income tax provision
90
92
62
89
Net income
466
406
442
380
Income attributable to non-controlling interests
25
23
25
23
Net income attributable to JCI
$441
$383
$417
$357
Diluted earnings per share
$0.64
$0.56
$0.61
$0.52
* 2012 excludes restructuring charges of $52 million ($46 million net of tax)
and non-recurring tax benefits of $22 million; 2011 excludes
acquisition -related costs of $29 million ($26 million net of tax)
|
 2012
third quarter Balance sheet
13
Cash provided by operations of $619 million
Increased capital spending to $447 million,
22% higher than 2011
60 bps improvement in trade working capital
as a percentage of sales (6.7% in Q3 2012 vs.
7.3% in 2011)
Continue to focus on improvements in trade
working capital
Net debt / total capitalization 34%
Pension update
–
Year-over-year funded position continues to
improve
–
Intend to adopt market-to-market
methodology in Q4 2012 |
 14
Focus
Right-size headcount and underlying
cost structure
Divestment of underperforming/non-core
businesses
Footprint changes in certain geographies
Consolidation of operations
Improve profitability
FY 2013 analyst meeting
New York
December / January
Clarity on U.S. and Europe
fiscal and monetary polices
Adjusting to changes in market conditions |