Attached files
| file | filename |
|---|---|
| 8-K - FORM 8-K - MOSAIC CO | d382003d8k.htm |
| EX-99.1 - TRANSCRIPT OF CONFERENCE CALL - MOSAIC CO | d382003dex991.htm |
 The Mosaic Company
Earnings
Conference
Call
–
4th
Quarter
Fiscal
2012
July 17th, 2012
Jim Prokopanko, President and Chief Executive Officer
Larry
Stranghoener,
Executive
Vice
President
and
Chief
Financial
Officer
Laura Gagnon, Vice President Investor Relations
Exhibit 99.2 |
 This presentation contains forward-looking statements within the meaning of
the Private Securities Litigation Reform Act of 1995. Such statements
include, but are not limited to, statements about future financial and operating results. Such statements are based upon the
current beliefs and expectations of The Mosaic Company’s management and are
subject to significant risks and uncertainties. These risks and
uncertainties include but are not limited to the predictability and volatility of, and customer expectations about, agriculture,
fertilizer,
raw
material,
energy
and
transportation
markets
that
are
subject
to
competitive
and
other
pressures
and
economic
and
credit
market conditions; the level of inventories in the distribution channels for crop
nutrients; changes in foreign currency and exchange rates; international
trade risks; changes in government policy; changes in environmental and other governmental regulation, including
greenhouse gas regulation, implementation of the U.S. Environmental Protection
Agency’s numeric water quality standards for the discharge of
nutrients into Florida lakes and streams or possible efforts to reduce the flow of excess nutrients into the Gulf of Mexico;
further developments in judicial or administrative proceedings; difficulties or
delays in receiving, increased costs of or challenges to necessary
governmental permits or approvals; or increased financial assurance requirements; the effectiveness of the Company’s
processes
for
managing
its
strategic
priorities;
adverse
weather
conditions
affecting
operations
in
Central
Florida
or
the
Gulf
Coast
of
the United States, including potential hurricanes or excess rainfall; actual costs
of various items differing from management’s current estimates,
including, among others, asset retirement, environmental remediation, reclamation or other environmental regulation, or
Canadian resources taxes and royalties; accidents and other disruptions involving
Mosaic’s operations, including brine inflows at its Esterhazy,
Saskatchewan potash mine and other potential mine fires, floods, explosions, seismic events or releases of hazardous or
volatile chemicals, as well as other risks and uncertainties reported from time to
time in The Mosaic Company’s reports filed with the Securities and
Exchange Commission. Actual results may differ from those set forth in the forward-looking statements.
Safe Harbor Statement
Slide 2 |
 Mosaic had an excellent year, despite macro challenges
Records set in FY 12
Highest Revenue
Highest Operating Cash Flow
ROIC
(1)
of 15%
>65% shareholder payout ratio
*FY11 includes $569 million gain from sale of Fosfertil
MACRO CHALLENGES
MOSAIC RESULTS
European uncertainty
Distributor de-stocking
Indian government subsidy
change
1. Non-GAAP, reconciliation on slide 24
Slide 3
DIVIDEND INCREASE
400% increase in targeted
dividend since February
$1.00 per share
$6.8
$9.9
$11.1
$1.3
$2.7
$2.6
2010
2011
2012
Net Sales and Operating Earnings
$ in billions
$0.8
$2.5
$1.9
2010
2011
2012
Net Income and Operating Cash Flow
$ in billions |
 A
Year of Progress All-time best safety performance
Operational efficiencies
Expansion on plan
Premium products
Operational processes
South Fort Meade resolution
Potash Tolling agreement resolution
Formation offering completed
Debt restructure
Share repurchase
Dividend increase
Slide 4
Operational Excellence
Innovation
Issue Resolution
Capital Strength |
 Financial Results Review |
 Performance Reflects Grower Demand
Slide 6
Consolidated
Q4 FY12
Q4 FY12
vs.
Q4 FY11
Q4 FY12
vs.
Q3 FY12
Revenue
$2.8 billion
(1)%
29%
Gross Profit
$834 million
(16)%
60%
Operating Cash
Flow
$1.2 billion
28%
208% |
 Earnings
Slide 7
Reported Earnings
($ in million except per share)
Q4 FY12
Earnings Before Taxes
$689
Net Earnings
$507
Earnings per share (diluted)
$1.19
Impact of Notable Items
$(0.06) |
 Potash Segment Highlights
Slide 8
In millions, except MOP price
Q4 FY12
Q3 FY12
Q4 FY11
Net sales
$1,037
$553
$982
Gross Margin
$514
$270
$516
Percent of net sales
50%
49%
53%
Operating earnings
$464
$234
$469
Sales volumes
2.0
1.1
2.2
Production volume
1.9
1.8
2.2
Production operating rate
85%
79%
95%
Avg MOP selling price
$455
$453
$404
Fourth quarter highlights:
Volumes and prices reflect long North American spring season offset by limited
dealer restocking o
Sales
volumes
negatively
impacted
by
Canadian
rail
strike
–
approximately
100,000
tonnes
(timing
issue)
Operating rates increased later in the quarter to prepare for normal summer
maintenance o
Mosaic inventory levels are primarily standard grades, while blend grades remains
limited •
Gross margins were impacted by increased brine
management expenses, mark-to-market on
derivatives and higher depreciation |
 Phosphates Segment Highlights
Slide 9
In millions, except DAP price
Q4 FY12
Q3 FY12
Q4 FY11
Net sales
$1,789
$1,652
$1,882
Gross Margin
$322
$259
$479
Percent of net sales
18%
16%
25%
Operating earnings
$224
$190
$370
Sales volumes
2.9
2.6
2.8
NA production volume
(a)
2.1
2.0
2.1
Finished product operating rate
86%
81%
86%
Avg DAP selling price
$494
$536
$574
(a)
Includes crop nutrient dry concentrates and animal feed ingredients
Fourth quarter highlights:
Average realized price declined, with upward trends during the quarter
Very
strong
volumes,
with
shipments
to
South
and
Central
America
replacing
Indian
sales
North
America
sales
included
summer
fill
volumes
Margins exceeded guidance due to intra-quarter demand-driven price
increases Operating earnings includes an asset retirement obligation
adjustment of $21 million |
 Category
Guidance
–
Fiscal
2013
Potash
Q1 Sales volume 1.8 –
2.2 million tonnes
Q1 MOP selling price $415 –
$440 per tonne
Q1 Operating rate above 70 percent
Phosphates
Q1 Sales volume 2.5 –
2.8 million tonnes
Q1 DAP selling price $510 -
$535 per tonne
Q1 Operating rate above 75 percent
Capital Expenditures
$1.5 -
$1.8 billion
Canadian Resource Taxes and Royalties
$320 –
$380 million
SG&A
$420 –
$445 million
Effective Tax Rate
Upper 20 percent range
Financial Guidance Summary
Slide 10 |
 Disciplined Capital Allocation
1.
Expansion Capital
2.
Potential Investments
3.
Return to shareholders
CAPITAL MANAGEMENT
Maximize shareholder value
through our capital policy
We are confident in our ability to generate significant cash
for investment in our business and shareholder distributions.
Slide 11
Share repurchases allowed by end
of FY13
0.3
0.4
0.8
0.9
1.3
1.6
0.7
2.5
1.2
1.4
2.4
2.7
07
08
09
10
11
12
OPERATING CASH FLOW AND CAPEX
$ IN BILLIONS |
 Fiscal FY13 Outlook |
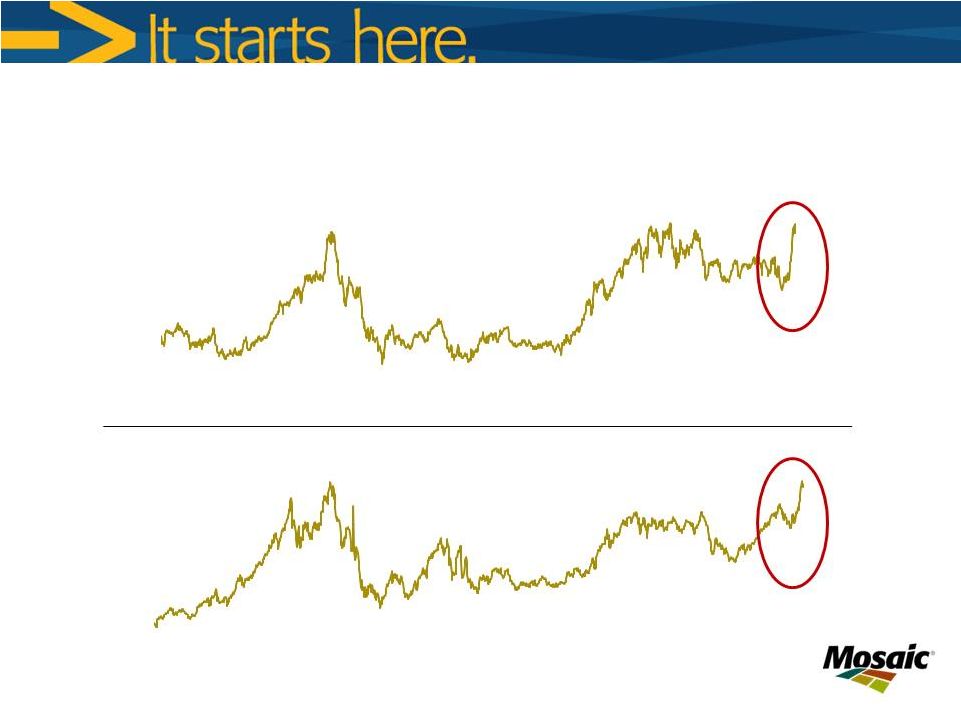 Recent commodity price jumps highlight delicate nature of global
food security
Slide 13
2.5
3.5
4.5
5.5
6.5
7.5
07
08
09
10
11
12
$ BU
Corn Price
Daily Close of Front Month Futures Contract
Source: CME
6.0
8.0
10.0
12.0
14.0
16.0
07
08
09
10
11
12
$ BU
Soybean Price
Daily Close of Front Month Futures Contract
Source: CME |
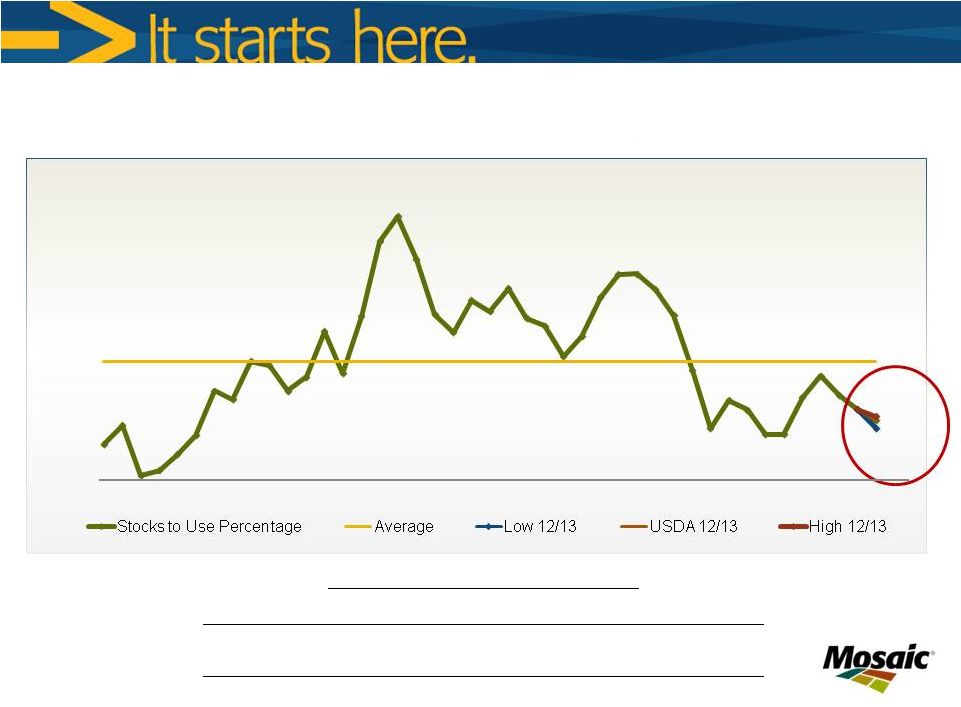 Global stock to use below historical average
Source: USDA and Mosaic
Slide 14
2012/13 Grain and Oilseed Scenario Assumptions
Low
USDA
High
Harvested Area Change
1.35%
1.35%
1.35%
Yield Deviation from Trend *
-0.08
-0.06
-0.04
Demand Growth
1.43%
1.63%
1.83%
* Largest deviation from the 12-year trend 2000-2011 in MT HA
18.4%
18.7%
17.9%
14%
19%
24%
29%
34%
70
72
74
76
78
80
82
84
86
88
90
92
94
96
98
00
02
04
06
08
10
12
WORLD GRAIN AND OILSEED STOCKS TO USE RATIO |
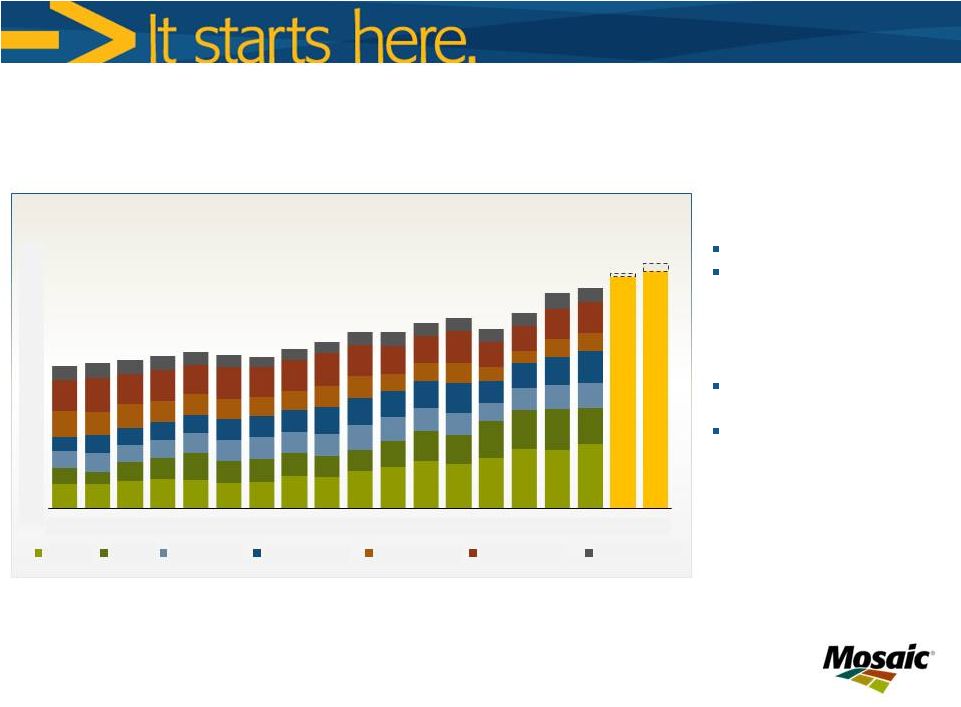 Supply uncertainty
Low inventories
Phosphates: A tight market
INDUSTRY DYNAMICS
MOSAIC
STRENGTHS
Mine productivity
Ammonia manufacturing
Premium products
Slide 15
Calendar years
0
10
20
30
40
50
60
70
95
96
97
98
99
00
01
02
03
04
05
06
07
08
09
10
11E
12F
13F
Mil Tonnes
DAP/MAP/TSP
WORLD PROCESSED PHOSPHATE SHIPMENTS
China
India
Other Asia
Latin America
Europe/FSU
North America
Rest of World
Sources: Fertecon
and Mosaic |
 Uncertain Indian demand
Growing emerging
markets
Muted dealer sentiment
Low natural gas prices
Potash: Stable
Tolling
agreement
benefit
New capacity online
Solution mining
INDUSTRY DYNAMICS
MOSAIC STRENGTHS
Slide 16
Calendar years
0
10
20
30
40
50
60
70
95
96
97
98
99
00
01
02
03
04
05
06
07
08
09
10
11E
12F
13F
Mil Tonnes
KCl
WORLD MURIATE OF POTASH SHIPMENTS
China
India
Other Asia
Latin America
Europe/FSU
North America
Rest of World
Sources: Fertecon
and Mosaic |
 The Mosaic Company
Thank you |
 Earnings
Sensitivity
to
Key
Drivers
(a)
Slide 18
FY12
Actual
Change
FY12
Margin %
Actual
% Impact on
Segment
Margin
Pre-Tax
Impact
EPS
Impact
Marketing
MOP Price ($/tonne) (b)
$448
$50
49.1%
9.0%
$299
$0.50
Potash Volume (million
metric tonnes)
6.7
500
49.1%
4.8%
$158
$0.26
DAP Price ($/tonne)
$555
$50
18.7%
6.1%
$474
$0.79
Phosphate Volume (million
metric tonnes)
11.8
500
18.7%
1.2%
$91
$0.15
Raw Materials
Sulfur ($/lt)
$223
$50
18.7%
2.2%
$173
$0.29
Ammonia ($/tonne)
$528
$50
18.7%
1.3%
$104
$0.17
(a) These factors do not change in isolation; actual results could vary from the
above estimates (b) assumes no change to KMAG pricing
|
 Phosphate Raw Material Costs
Slide 19
Realized costs of raw materials in COGS lag spot prices by approximately 3 months.
Realized ammonia costs, in most periods shown, include a benefit of our
manufacture of ammonia at Faustina. $417
$451 |
 Phosphate Raw Material Costs
Slide 20
$200
$196
Realized costs of raw materials in COGS lag spot prices by approximately 3 months. Sulfur realized
prices include storage, conversion and transformation costs of $10 - $15 / ton. |
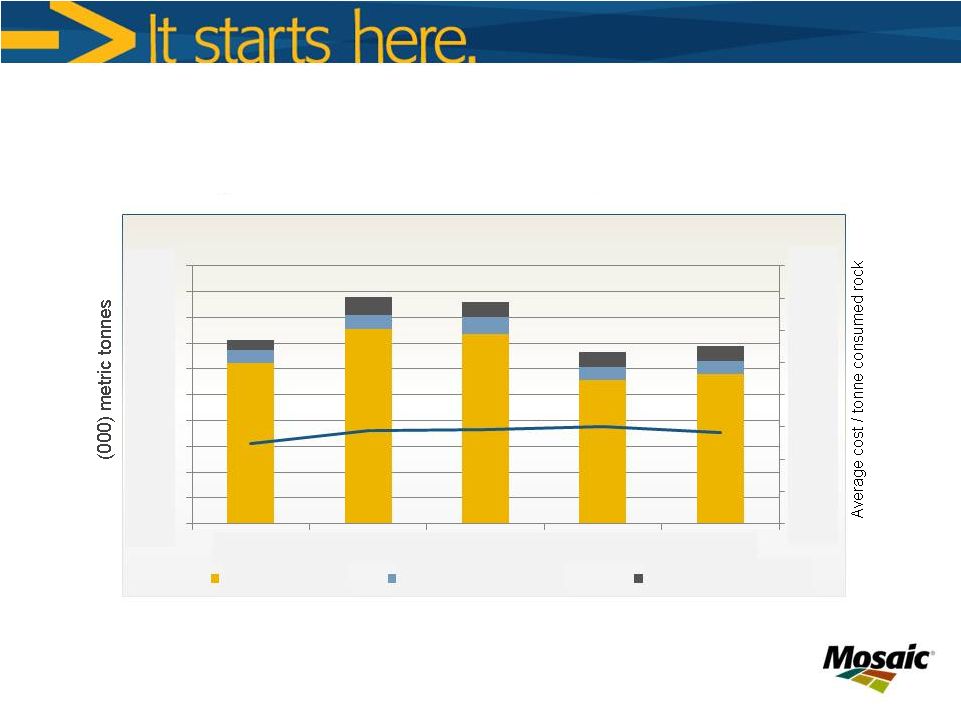 Phosphate Rock Sourcing
Slide 21
$
-
$25
$50
$75
$100
$125
$150
$175
$200
500
1,000
1,500
2,000
2,500
3,000
3,500
4,000
4,500
5,000
Q4 FY11
Q1 FY12
Q2 FY12
Q3 FY12
Q4 FY 12
ROCK MIX USED IN U.S. OPERATIONS
US mined rock
Purchased Miski Mayo rock
Other purchased rock
- |
 Canadian Resource Taxes and Royalties
Slide 22
FY12 ACTUAL
In millions
Sales
$3,302
Combined Royalty & Surcharge Rate
4.0%
Royalty & Surcharge
132
Potash Segment GM before CRT
1,950
Add back Depreciation
234
Subtract Capex
1,171
Estimated Taxable Profit
1,012
Estimate Profit Tax: 15% and 20% of taxable profit
@ 15%
152
@ 20%
202
Total CRT (Royalty & Surcharge + Profit Tax)
@ 15%
284
@ 20%
335
Compare to actual Resource Tax & Royalties
328 |
 ROIC Reconciliation
Slide 23
($ in millions)
FY2011
FY2012
FY2012
FY2012
FY2012
Actual
Actual
Actual
Actual
Actual
Q4
Q1
Q2
Q3
Q4
Operating Profit
729.6
797.0
413.7
670.8
Taxes
205.1
230.7
87.0
188.6
Equity Earnings
1.8
0.9
4.2
6.4
NOPAT
526.3
567.2
330.9
488.6
NOPAT -
Trailing 4 Quarters
1,913.0
May-11
Aug-11
Nov-11
Feb-12
May-12
Invested
Capital:
Total assets
15,786.9
16,180.8
15,802.3
15,936.7
16,690.4
Accounts payable
(941.1)
(903.1)
(853.6)
(800.5)
(912.4)
Accrued liabilities
(843.6)
(723.0)
(635.1)
(657.9)
(899.9)
Deferred
income
taxes
-
current
(72.2)
(70.1)
(68.2)
(73.7)
(62.4)
Deferred
income
taxes
-
noncurrent
(580.1)
(579.7)
(589.4)
(611.2)
(787.9)
Other noncurrent liabilities
(855.1)
(841.1)
(785.1)
(869.8)
(975.4)
Total Invested Capital
12,494.8
13,063.8
12,870.9
12,923.6
13,052.4
Invested
Capital
-
5
Quarter
Average
11,290.9
11,885.2
12,381.2
12,649.9
12,881.1
ROIC (including goodwill)
14.9%
We have presented ROIC, which is a non-GAAP financial measure. Generally, non-GAAP financial
measures are supplemental numerical measures of a company's performance, financial
position or cash flows that either exclude or include amounts that are not normally excluded or included in the most
directly comparable measure calculated and presented in accordance with U.S. generally accepted
accounting principles ("GAAP"). ROIC is not a measure of financial
performance under GAAP. Because not all companies use identical calculations, our calculation of ROIC may not be comparable to
other similarly titled measures presented by other companies. In evaluating this measure, investors
should consider that our methodology in calculating such measures may differ from that
used by other companies. We consider ROIC to be a meaningful indicator of how effectively a company is investing its
capital and deploying its assets.”
1 |