Attached files
| file | filename |
|---|---|
| 8-K - 8-K - EQUITY LIFESTYLE PROPERTIES INC | d381488d8k.htm |
| EX-99.1 - EX-99.1 - EQUITY LIFESTYLE PROPERTIES INC | d381488dex991.htm |
Exhibit 99.2
Overview
2
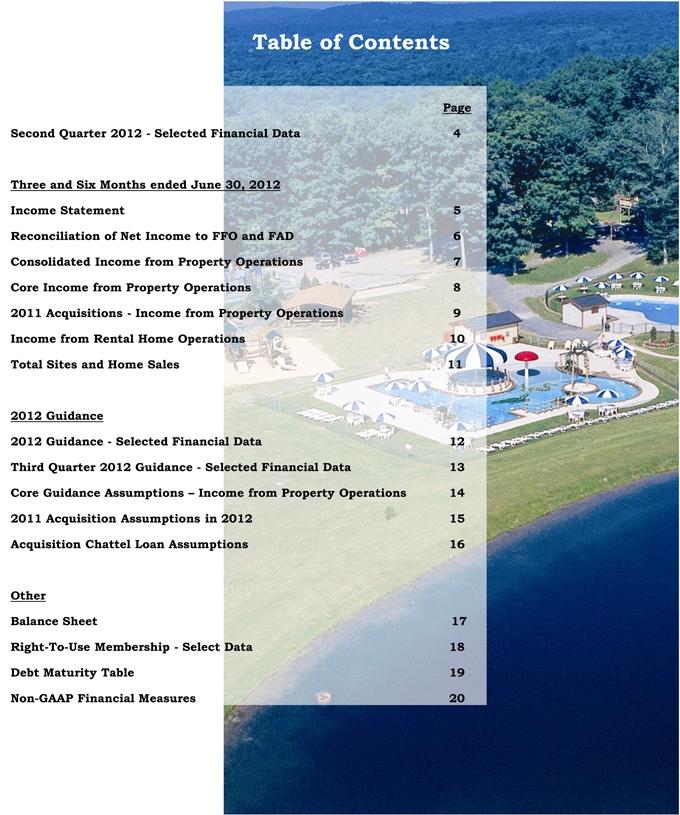
Table of Contents
Page Second Quarter 2012—Selected Financial Data 4 Three and Six Months ended June 30, 2012 Income Statement 5
Reconciliation of Net Income to FFO and FAD 6 Consolidated Income from Property Operations 7 Core Income from Property Operations 8 2011 Acquisitions—Income from Property Operations 9 Income from Rental Home Operations 10 Total Sites and Home Sales 11 2012 Guidance 2012 Guidance—Selected Financial Data 12 Third Quarter 2012 Guidance—Selected Financial Data 13 Core Guidance Assumptions – Income from Property Operations 14 2011 Acquisition Assumptions in 2012 15 Acquisition Chattel Loan Assumptions 16 Other Balance Sheet 17 Right-To-Use Membership—Select Data 18 Debt Maturity Table 19 Non-GAAP Financial Measures 20
3
Second Quarter 2012—Selected Financial Data
(In $US millions, except per share data, unaudited)
| Three Months Ended June 30, 2012 |
||||
| Income from property operations—2012 Core (1) |
$ | 70.1 | ||
| Income from property operations—2011 Acquisitions (2) |
25.2 | |||
| Property management and general and administrative |
(16.4 | ) | ||
| Other income and expenses |
3.8 | |||
| Financing costs and other |
(34.9 | ) | ||
|
|
|
|||
| Funds from operations (FFO) (3) (4) |
47.8 | |||
| Depreciation on real estate |
(24.7 | ) | ||
| Depreciation on rental homes (4) |
(1.5 | ) | ||
| Amortization of in-place leases |
(18.4 | ) | ||
| Depreciation on unconsolidated joint ventures |
(0.3 | ) | ||
| Deferral of right-to-use contract sales revenue and commission, net |
(0.6 | ) | ||
| Income allocated to OP units |
(0.2 | ) | ||
|
|
|
|||
| Net income available to common shares |
$ | 2.1 | ||
|
|
|
|||
| Net income per common share—fully diluted (5) |
$ | 0.05 | ||
| FFO per share—fully diluted |
$ | 1.05 | ||
| Weighted average shares outstanding—fully diluted |
45.4 | |||
| 1) | See page 8 for 2012 Core income from property operations detail. |
| 2) | See page 9 for income from property operations detail for 2011 Acquisition Properties. |
| 3) | See page 20 for definition of FFO. |
| 4) | Second quarter 2012 FFO adjusted to include a deduction for depreciation expense on rental homes would have been $46.3 million, or $1.02 per fully diluted share. |
| 5) | Net income per fully diluted common share is calculated before Income allocated to OP Units. |
4
Income Statement
(In $US thousands, except per share data, unaudited)
| Three Months Ended | Six Months Ended | |||||||||||||||
| June 30, 2012 | 6/30/2011 (1) | June 30, 2012 | 6/30/2011 (1) | |||||||||||||
| Revenues: |
||||||||||||||||
| Community base rental income |
$ | 103,197 | $ | 66,408 | $ | 206,151 | $ | 132,591 | ||||||||
| Rental home income |
3,358 | 1,521 | 6,401 | 2,951 | ||||||||||||
| Resort base rental income |
30,408 | 29,251 | 67,987 | 65,719 | ||||||||||||
| Right-to-use annual payments |
12,221 | 12,563 | 23,972 | 24,575 | ||||||||||||
| Right-to-use contracts current period, gross |
2,942 | 4,857 | 5,186 | 8,710 | ||||||||||||
| Right-to-use contracts, deferred, net of prior period amortization |
(1,285 | ) | (3,414 | ) | (1,891 | ) | (5,910 | ) | ||||||||
| Utility and other income |
17,582 | 12,484 | 33,985 | 25,546 | ||||||||||||
| Gross revenues from home sales |
1,960 | 1,288 | 4,020 | 2,645 | ||||||||||||
| Brokered resale revenue and ancillary services revenues, net |
489 | 571 | 2,235 | 2,107 | ||||||||||||
| Interest income |
2,388 | 1,012 | 5,018 | 2,051 | ||||||||||||
| Income from other investments, net |
1,567 | 1,149 | 3,055 | 1,848 | ||||||||||||
|
|
|
|
|
|
|
|
|
|||||||||
| Total revenues |
174,827 | 127,690 | 356,119 | 262,833 | ||||||||||||
| Expenses: |
||||||||||||||||
| Property operating and maintenance |
58,327 | 47,655 | 112,769 | 91,966 | ||||||||||||
| Rental home operating and maintenance |
1,541 | 838 | 3,146 | 1,667 | ||||||||||||
| Real estate taxes |
11,952 | 8,161 | 24,474 | 16,218 | ||||||||||||
| Sales and marketing, gross |
2,633 | 3,083 | 4,276 | 5,339 | ||||||||||||
| Sales and marketing, deferred commissions, net |
(655 | ) | (1,347 | ) | (897 | ) | (2,347 | ) | ||||||||
| Property management |
9,427 | 8,193 | 19,178 | 16,656 | ||||||||||||
| Depreciation on real estate |
26,227 | 18,223 | 52,326 | 36,309 | ||||||||||||
| Amortization of in-place leases |
18,401 | 0 | 36,766 | 0 | ||||||||||||
| Cost of home sales |
2,602 | 1,049 | 4,818 | 2,468 | ||||||||||||
| Home selling expenses |
403 | 406 | 736 | 883 | ||||||||||||
| General and administrative |
6,957 | 6,011 | 13,189 | 11,658 | ||||||||||||
| Acquisition costs |
0 | 2,117 | 0 | 2,117 | ||||||||||||
| Rent control initiatives and other |
367 | 730 | 846 | 1,091 | ||||||||||||
| Interest and related amortization |
30,838 | 21,458 | 61,794 | 42,847 | ||||||||||||
|
|
|
|
|
|
|
|
|
|||||||||
| Total expenses |
169,020 | 116,577 | 333,421 | 226,872 | ||||||||||||
|
|
|
|
|
|
|
|
|
|||||||||
| Income before equity in income of unconsolidated joint ventures |
5,807 | 11,113 | 22,698 | 35,961 | ||||||||||||
|
|
|
|
|
|
|
|
|
|||||||||
| Equity in income of unconsolidated joint ventures |
492 | 541 | 1,255 | 1,325 | ||||||||||||
|
|
|
|
|
|
|
|
|
|||||||||
| Consolidated net income |
6,299 | 11,654 | 23,953 | 37,286 | ||||||||||||
| Income allocated to non-controlling interest-Common OP Units |
(197 | ) | (789 | ) | (1,388 | ) | (3,410 | ) | ||||||||
| Income allocated to non-controlling interest-Perpetual Preferred OP Units |
0 | 0 | 0 | (2,801 | ) | |||||||||||
| Series A Redeemable Perpetual Preferred Stock Dividends |
(4,038 | ) | (4,038 | ) | (8,069 | ) | (5,288 | ) | ||||||||
|
|
|
|
|
|
|
|
|
|||||||||
| Net income available for Common Shares |
$ | 2,064 | $ | 6,827 | $ | 14,496 | $ | 25,787 | ||||||||
|
|
|
|
|
|
|
|
|
|||||||||
| Net income per Common Share—Basic |
$ | 0.05 | $ | 0.21 | $ | 0.35 | $ | 0.81 | ||||||||
| Net income per Common Share—Fully Diluted |
$ | 0.05 | $ | 0.20 | $ | 0.35 | $ | 0.80 | ||||||||
| Average Common Shares—Basic |
41,131 | 32,629 | 41,110 | 31,817 | ||||||||||||
| Average Common Shares and OP Units—Basic |
45,087 | 36,942 | 45,078 | 36,140 | ||||||||||||
| Average Common Shares and OP Units—Fully Diluted |
45,390 | 37,262 | 45,387 | 36,441 | ||||||||||||
| 1) | Certain 2011 amounts have been reclassified to conform to the 2012 presentation. This reclassification had no material effect on the statement of operations. |
5
Reconciliation of Net Income to FFO and FAD
(In $US thousands, except per share data, unaudited)
| Three Months Ended | Six Months Ended | |||||||||||||||
| June 30, 2012 | June 30, 2011 | June 30, 2012 | June 30, 2011 | |||||||||||||
| Computation of funds from operations: |
||||||||||||||||
| Net income available for Common Shares |
$ | 2,064 | $ | 6,827 | $ | 14,496 | $ | 25,787 | ||||||||
| Income allocated to common OP Units |
197 | 789 | 1,388 | 3,410 | ||||||||||||
| Right-to-use contract upfront payments, deferred, net (1) |
1,285 | 3,414 | 1,891 | 5,910 | ||||||||||||
| Right-to-use contract commissions, deferred, net (2) |
(655 | ) | (1,347 | ) | (897 | ) | (2,347 | ) | ||||||||
| Depreciation on real estate assets |
24,744 | 17,285 | 49,442 | 34,512 | ||||||||||||
| Depreciation on rental homes (3) |
1,483 | 938 | 2,884 | 1,797 | ||||||||||||
| Amortization of in-place leases |
18,401 | 0 | 36,766 | 0 | ||||||||||||
| Depreciation on unconsolidated joint ventures |
288 | 307 | 583 | 614 | ||||||||||||
|
|
|
|
|
|
|
|
|
|||||||||
| Funds from operations (FFO) (4) (5) |
$ | 47,807 | $ | 28,213 | $ | 106,553 | $ | 69,683 | ||||||||
|
|
|
|
|
|
|
|
|
|||||||||
| Non-revenue producing improvements to real estate |
(7,531 | ) | (5,165 | ) | (12,349 | ) | (7,995 | ) | ||||||||
|
|
|
|
|
|
|
|
|
|||||||||
| Funds available for distribution (FAD) (4) |
$ | 40,276 | $ | 23,048 | $ | 94,204 | $ | 61,688 | ||||||||
|
|
|
|
|
|
|
|
|
|||||||||
| FFO per Common Share—Basic |
$ | 1.06 | $ | 0.76 | $ | 2.36 | $ | 1.93 | ||||||||
| FFO per Common Share—Fully Diluted |
$ | 1.05 | $ | 0.76 | $ | 2.35 | $ | 1.91 | ||||||||
| FAD per Common Share—Basic |
$ | 0.89 | $ | 0.62 | $ | 2.09 | $ | 1.71 | ||||||||
| FAD per Common Share—Fully Diluted |
$ | 0.89 | $ | 0.62 | $ | 2.08 | $ | 1.69 | ||||||||
| 1) | The Company is required by GAAP to defer recognition of the non-refundable upfront payments from the entry of right-to-use contracts over the estimated customer life. The customer life is currently estimated to range from one to 31 years and is based upon historical attrition rates provided to the Company by Privileged Access. The amount shown represents the deferral of a substantial portion of current period contracts sales, offset by amortization of prior period sales. |
| 2) | The Company is required by GAAP to defer recognition of the commission paid related to the entry of right-to-use contracts. The deferred commissions will be amortized on the same method as the related non-refundable upfront payments from the entry of right-to-use contracts. The amount shown represents the deferral of a substantial portion of current period contract commissions, offset by the amortization of prior period commissions. |
| 3) | For the three and six months ended June 30, 2011, the Company determined FFO and FAD excluding rental home depreciation expense. To conform with the 2012 presentation of FFO and FAD, rental home depreciation expense was added back to previously reported FFO and FAD for the three and six months ended June 30, 2011. |
| 4) | See page 20 for definition of FFO and FAD. |
| 5) | FFO adjusted to include a deduction for depreciation expense on rental homes would have been $46.3 million or $1.02 per fully diluted share and $27.3 million or $0.73 per fully diluted share for the three months ending June 30, 2012 and 2011, respectively, and $103.7 million or $2.28 per fully diluted share and $67.9 million or $1.86 per fully diluted share for the six months ending June 30, 2012 and 2011, respectively. |
6
Consolidated Income from Property Operations (1)
(In $US millions, except home site and occupancy figures)
| Three Months Ended | Six Months Ended | |||||||||||||||
| June 30, 2012 | June 30, 2011 | June 30, 2012 | June 30, 2011 | |||||||||||||
| Community base rental income (2) |
$ | 103.2 | $ | 66.4 | $ | 206.2 | $ | 132.6 | ||||||||
| Rental home income |
3.4 | 1.5 | 6.4 | 3.0 | ||||||||||||
| Resort base rental income (3) |
30.4 | 29.3 | 68.0 | 65.7 | ||||||||||||
| Right-to-use annual payments |
12.2 | 12.6 | 24.0 | 24.6 | ||||||||||||
| Right-to-use contracts current period, gross |
2.9 | 4.9 | 5.2 | 8.7 | ||||||||||||
| Utility and other income |
17.6 | 12.4 | 33.9 | 25.5 | ||||||||||||
|
|
|
|
|
|
|
|
|
|||||||||
| Property operating revenues |
169.7 | 127.1 | 343.7 | 260.1 | ||||||||||||
| Property operating, maintenance, and real estate taxes |
70.3 | 55.9 | 137.3 | 108.2 | ||||||||||||
| Rental home operating and maintenance |
1.5 | 0.8 | 3.1 | 1.7 | ||||||||||||
| Sales and marketing, gross |
2.6 | 3.1 | 4.3 | 5.3 | ||||||||||||
|
|
|
|
|
|
|
|
|
|||||||||
| Property operating expenses |
74.4 | 59.8 | 144.7 | 115.2 | ||||||||||||
|
|
|
|
|
|
|
|
|
|||||||||
| Income from property operations |
$ | 95.3 | $ | 67.3 | $ | 199.0 | $ | 144.9 | ||||||||
|
|
|
|
|
|
|
|
|
|||||||||
| Manufactured home site figures and occupancy averages: |
||||||||||||||||
| Total sites |
74,119 | 44,235 | 74,098 | 44,235 | ||||||||||||
| Occupied sites |
66,118 | 40,052 | 66,070 | 40,029 | ||||||||||||
| Occupancy % |
89.2 | % | 90.5 | % | 89.2 | % | 90.5 | % | ||||||||
| Monthly base rent per site |
$ | 520 | $ | 553 | $ | 520 | $ | 552 | ||||||||
| Core total sites |
44,103 | 44,107 | 44,103 | 44,107 | ||||||||||||
| Core occupied sites |
40,272 | 40,042 | 40,262 | 40,018 | ||||||||||||
| Core occupancy % |
91.3 | % | 90.8 | % | 91.3 | % | 90.7 | % | ||||||||
| Core monthly base rent per site |
$ | 566 | $ | 553 | $ | 565 | $ | 552 | ||||||||
| Resort base rental income: |
||||||||||||||||
| Annual |
$ | 21.5 | $ | 20.7 | $ | 42.8 | $ | 41.0 | ||||||||
| Seasonal |
2.7 | 2.6 | 14.3 | 14.2 | ||||||||||||
| Transient |
6.2 | 6.0 | 10.9 | 10.5 | ||||||||||||
|
|
|
|
|
|
|
|
|
|||||||||
| Total resort base rental income |
$ | 30.4 | $ | 29.3 | $ | 68.0 | $ | 65.7 | ||||||||
|
|
|
|
|
|
|
|
|
|||||||||
| 1) | See page 5 for a complete Income Statement. The line items that the Company includes in property operating revenues and property operating expenses are also individually included in our Income Statement. Excludes property management expenses and the GAAP deferral of right-to-use contract upfront payments and related commissions, net. |
| 2) | See manufactured home site figures and occupancy averages table above. |
| 3) | See resort base rental income table above. |
7
Core Income from Property Operations (1)
(In $US millions, except home site and occupancy figures)
| Three Months Ended | % | Six Months Ended | % | |||||||||||||||||||||
| June 30, 2012 |
June 30, 2011 |
Change (2) | June 30, 2012 |
June 30, 2011 |
Change (2) | |||||||||||||||||||
| Community base rental income (3) |
$ | 68.4 | $ | 66.4 | 3.0 | % | $ | 136.6 | $ | 132.6 | 3.0 | % | ||||||||||||
| Rental home income |
2.0 | 1.5 | 28.5 | % | 3.8 | 3.0 | 29.6 | % | ||||||||||||||||
| Resort base rental income (4) |
30.3 | 29.3 | 3.6 | % | 67.7 | 65.7 | 3.0 | % | ||||||||||||||||
| Right-to-use annual payments |
12.2 | 12.6 | -2.7 | % | 24.0 | 24.6 | -2.5 | % | ||||||||||||||||
| Right-to-use contracts current period, gross |
2.9 | 4.9 | -39.4 | % | 5.2 | 8.7 | -40.5 | % | ||||||||||||||||
| Utility and other income (5) |
14.5 | 12.4 | 16.3 | % | 27.5 | 25.5 | 8.0 | % | ||||||||||||||||
|
|
|
|
|
|
|
|
|
|||||||||||||||||
| Property operating revenues (6) |
130.3 | 127.1 | 2.5 | % | 264.8 | 260.1 | 1.8 | % | ||||||||||||||||
| Property operating, maintenance, and real estate taxes |
56.7 | 55.9 | 1.7 | % | 110.0 | 108.2 | 1.8 | % | ||||||||||||||||
| Rental home operating and maintenance |
0.9 | 0.8 | 4.2 | % | 1.9 | 1.7 | 12.5 | % | ||||||||||||||||
| Sales and marketing, gross |
2.6 | 3.1 | -14.7 | % | 4.3 | 5.3 | -20.0 | % | ||||||||||||||||
|
|
|
|
|
|
|
|
|
|
|
|||||||||||||||
| Property operating expenses (6) |
60.2 | 59.8 | 0.9 | % | 116.2 | 115.2 | 0.9 | % | ||||||||||||||||
|
|
|
|
|
|
|
|
|
|
|
|||||||||||||||
| Income from property operations (6) |
$ | 70.1 | $ | 67.3 | 4.0 | % | $ | 148.6 | $ | 144.9 | 2.5 | % | ||||||||||||
|
|
|
|
|
|
|
|
|
|
|
|||||||||||||||
| Occupied sites as of (7): |
40,305 | 40,103 | ||||||||||||||||||||||
| Core manufactured home site figures and occupancy averages: |
|
|||||||||||||||||||||||
| Total Sites |
44,103 | 44,107 | 44,103 | 44,107 | ||||||||||||||||||||
| Occupied Sites |
40,272 | 40,042 | 40,262 | 40,018 | ||||||||||||||||||||
| Occupancy Percentage |
91.3 | % | 90.8 | % | 91.3 | % | 90.7 | % | ||||||||||||||||
| Monthly Base Rent Per Site |
$ | 566 | $ | 553 | $ | 565 | $ | 552 | ||||||||||||||||
| Resort base rental income: |
||||||||||||||||||||||||
| Annual |
$ | 21.4 | $ | 20.7 | 3.7 | % | $ | 42.6 | $ | 41.0 | 3.9 | % | ||||||||||||
| Seasonal |
2.7 | 2.6 | 3.6 | % | 14.2 | 14.2 | 0.1 | % | ||||||||||||||||
| Transient |
6.2 | 6.0 | 3.2 | % | 10.9 | 10.5 | 3.4 | % | ||||||||||||||||
|
|
|
|
|
|
|
|
|
|||||||||||||||||
| Total resort base rental income |
$ | 30.3 | $ | 29.3 | 3.6 | % | $ | 67.7 | $ | 65.7 | 3.0 | % | ||||||||||||
|
|
|
|
|
|
|
|
|
|||||||||||||||||
| 1) | 2012 Core properties include properties we expect to own and operate during all of 2011 and 2012. Excludes property management expenses and the GAAP deferral of right-to-use contract upfront payments and related commissions, net. |
| 2) | Calculations prepared using unrounded numbers. |
| 3) | See core manufactured home site figures and occupancy averages table above. |
| 4) | See resort base rental income table above. |
| 5) | During the three and six months ended June 30, 2012, the Company recognized approximately $2.1 million of cable service prepayments due to the bankruptcy of a third-party cable service provider at certain of the properties. |
| 6) | Growth rate excluding right-to-use contracts-current period gross sales and marketing expenses and cable service prepayments is 2.5%, 1.7%, and 3.2% for property operating revenues, property operating expenses, and income from property operations, respectively for the three months ended June 30, 2012 and 2.5%, 2.0%, and 2.8%, respectively, for the six months ended June 30, 2012. |
| 7) | Occupied sites have increased by 47 from 40,258 at December 31, 2011. |
8
2011 Acquisitions—Income from Property Operations (1)
(In $US millions, except occupancy figures)
| Three Months Ended |
Six Months Ended | |||||||
| June 30, 2012 | June 30, 2012 | |||||||
| Community base rental income |
$ | 34.8 | $ | 69.6 | ||||
| Rental home income |
1.4 | 2.6 | ||||||
| Resort base rental income |
0.1 | 0.3 | ||||||
| Utility income and other property income |
3.1 | 6.3 | ||||||
|
|
|
|
|
|||||
| Property operating revenues |
39.4 | 78.8 | ||||||
| Property operating, maintenance, and real estate taxes |
13.5 | 27.1 | ||||||
| Rental home operating and maintenance |
0.7 | 1.3 | ||||||
|
|
|
|
|
|||||
| Property operating expenses |
14.2 | 28.4 | ||||||
|
|
|
|
|
|||||
| Income from property operations |
$ | 25.2 | $ | 50.4 | ||||
|
|
|
|
|
|||||
| Occupied sites |
25,873 | |||||||
| Total Acquisition Portfolio |
Michigan only |
Total less Michigan |
||||||||||
| Average Occupancy for the Three Months Ended June 30, 2012 |
||||||||||||
| Total sites |
30,016 | 5,874 | 24,142 | |||||||||
| Occupied sites |
25,846 | 4,046 | 21,800 | |||||||||
| Occupancy percentage |
86.1 | % | 68.9 | % | 90.3 | % | ||||||
| Monthly base rent per occupied site |
$ | 449 | $ | 452 | $ | 448 | ||||||
| Average Occupancy for the Six Months Ended June 30, 2012 (2) |
||||||||||||
| Total sites |
29,995 | 5,874 | 24,121 | |||||||||
| Occupied sites |
25,808 | 4,015 | 21,793 | |||||||||
| Occupancy percentage |
86.0 | % | 68.4 | % | 90.3 | % | ||||||
| Monthly base rent per occupied site |
$ | 449 | $ | 455 | $ | 448 | ||||||
| 1) | Represents actual performance of Acquisition Properties acquired by the Company during the last six months of 2011. Excludes property management expenses. |
| 2) | Occupancy as of June 30, 2012 was 25,873, an increase of 120 sites from 25,753 at December 31, 2011. |
9
Income from Rental Home Operations (1)
(In $US millions, except occupied rentals, unaudited)
| Three Months Ended | Six Months Ended | |||||||||||||||
| June 30, 2012 | June 30, 2011 | June 30, 2012 | June 30, 2011 | |||||||||||||
| Manufactured homes: |
||||||||||||||||
| New home |
$ | 4.4 | $ | 2.9 | $ | 8.4 | $ | 5.5 | ||||||||
| Used home |
7.9 | 3.7 | 14.6 | 7.3 | ||||||||||||
|
|
|
|
|
|
|
|
|
|||||||||
| Rental operations revenues (1) |
12.3 | 6.6 | 23.0 | 12.8 | ||||||||||||
| Rental operations expense |
(1.5 | ) | (0.8 | ) | (3.1 | ) | (1.7 | ) | ||||||||
|
|
|
|
|
|
|
|
|
|||||||||
| Income from rental operations, before depreciation |
10.8 | 5.8 | 19.9 | 11.1 | ||||||||||||
| Depreciation on rental homes |
(1.5 | ) | (0.9 | ) | (2.9 | ) | (1.8 | ) | ||||||||
|
|
|
|
|
|
|
|
|
|||||||||
| Income from rental operations, after depreciation |
$ | 9.3 | $ | 4.9 | $ | 17.0 | $ | 9.3 | ||||||||
|
|
|
|
|
|
|
|
|
|||||||||
| Occupied rentals: |
||||||||||||||||
| New |
||||||||||||||||
| Core |
1,483 | 1,063 | ||||||||||||||
| Acquisitions |
101 | 0 | ||||||||||||||
| Used |
||||||||||||||||
| Core |
2,013 | 1,812 | ||||||||||||||
| Acquisitions |
1,471 | 0 | ||||||||||||||
| As of | ||||||||||||||||
| June 30, 2012 | June 30, 2011 | |||||||||||||||
| Cost basis in rental homes (2): |
Gross | Net of Depreciation |
Gross | Net of Depreciation |
||||||||||||
| New |
||||||||||||||||
| Core |
$ | 89.5 | $ | 81.6 | $ | 72.0 | $ | 66.7 | ||||||||
| Acquisitions |
3.6 | 3.5 | 0.0 | 0.0 | ||||||||||||
| Used |
||||||||||||||||
| Core |
31.8 | 27.4 | 27.6 | 24.7 | ||||||||||||
| Acquisitions |
34.8 | 33.7 | 0.0 | 0.0 | ||||||||||||
|
|
|
|
|
|
|
|
|
|||||||||
| Total rental homes |
$ | 159.7 | $ | 146.2 | $ | 99.6 | $ | 91.4 | ||||||||
|
|
|
|
|
|
|
|
|
|||||||||
| 1) | For the three months ended June 30, 2012 and June 30, 2011, approximately $8.9 million and $5.1 million, respectively, are included in Community base rental income in the Income from Property Operations table on page 7. For the six months ended June 30, 2012 and June 30, 2011, approximately $16.6 million and $9.8 million, respectively, are included in Community base rental income in the Income from Property Operations table on page 7. The remainder of the rental operations revenue is included in the caption “Rental home income” in the Income from Property Operations table on page 7. |
| 2) | Includes both occupied and unoccupied rental homes. |
10
Total Sites and Home Sales
(Dollar amounts in $US thousands, unaudited)
Summary of Total Sites as of June 30, 2012
| Sites | ||||
| Community sites |
74,100 | |||
| Resort sites: |
||||
| Annuals |
21,000 | |||
| Seasonal |
9,000 | |||
| Transient |
9,600 | |||
| Membership (1) |
24,300 | |||
| Joint Ventures (2) |
3,100 | |||
|
|
|
|||
| Total |
141,100 | |||
|
|
|
|||
Home Sales —Select Data
| Three Months Ended | Six Months Ended | |||||||||||||||
| June 30, 2012 | June 30, 2011 | June 30, 2012 | June 30, 2011 | |||||||||||||
| New Home Sales Volume |
4 | 6 | 17 | 27 | ||||||||||||
| New Home Sales Gross Revenues |
$ | 193 | $ | 338 | $ | 897 | $ | 1,149 | ||||||||
| Used Home Sales Volume (3) |
377 | 210 | 691 | 363 | ||||||||||||
| Used Home Sales Gross Revenues |
$ | 1,767 | $ | 950 | $ | 3,123 | $ | 1,496 | ||||||||
| Brokered Home Resales Volume |
257 | 167 | 520 | 372 | ||||||||||||
| Brokered Home Resale Revenues, net |
$ | 332 | $ | 214 | $ | 661 | $ | 467 | ||||||||
| 1) | Sites primarily utilized by approximately 96,000 members. Includes approximately 4,000 sites rented on an annual basis. |
| 2) | Joint venture income is included in Equity in income from unconsolidated joint ventures. |
| 3) | The three and the six months ended June 30, 2011, includes one third party dealer sale. |
11
2012 Guidance—Selected Financial Data (1)
The Company’s guidance acknowledges the existence of volatile economic conditions, which may impact our current guidance assumptions. Factors impacting 2012 guidance include, but are not limited to the following: (i) the mix of site usage within the portfolio; (ii) yield management on our short-term resort sites; (iii) scheduled or implemented rate increases on community and resort sites; (iv) scheduled or implemented rate increases of annual payments under right-to-use contracts; (v) occupancy changes; (vi) our ability to retain and attract customers renewing or entering right-to-use contracts; (vii) performance of the chattel loans purchased by us in connection with the Acquisition; and (viii) our ability to integrate and operate the Acquisition Properties in accordance with our estimates.
(In $US millions, except per share data, unaudited)
| Year Ended December 31, 2012 |
||||
| Income from property operations—2012 Core (2) |
$ | 292.6 | ||
| Income from property operations—2011 Acquisition (3) |
101.3 | |||
| Property management and general and administrative |
(65.1 | ) | ||
| Other income and expenses (4) |
18.1 | |||
| Financing costs and other |
(140.7 | ) | ||
|
|
|
|||
| Funds from operations (FFO) (5) |
206.2 | |||
| Depreciation on real estate and other |
(100.1 | ) | ||
| Depreciation on rental homes |
(6.1 | ) | ||
| Amortization of in-place leases |
(45.1 | ) | ||
| Deferral of right-to-use contract sales revenue and commission, net |
(3.1 | ) | ||
| Income allocated to OP units |
(4.5 | ) | ||
|
|
|
|||
| Net income available to common shares |
$ | 47.3 | ||
|
|
|
|||
| Net income per common share—fully diluted (6) |
$ | 1.04 - $1.24 | ||
| FFO per share—fully diluted |
$ | 4.44 - $4.64 | ||
| Weighted average shares outstanding—fully diluted |
45.4 | |||
| 1) | Each line item represents the mid-point of a range of possible outcomes and reflects management’s estimate of the most likely outcome. Actual FFO, FFO per share, Net Income and Net Income per share could vary materially from amounts presented above if any of our assumptions are incorrect. |
| 2) | See page 14 for 2012 Core guidance assumptions. Amount represents Core income from property operations from the 2012 Core Properties in 2011 of $285.7 million multiplied by an estimated growth rate of 2.4%. |
| 3) | See page 15 for 2011 Acquisition assumptions. |
| 4) | See page 16 for Acquisition Chattel Loan Assumptions. |
| 5) | See page 20 for definition of FFO. |
| 6) | Net income per fully diluted common share is calculated before Income allocated to OP Units. |
12
Third Quarter 2012 Guidance—Selected Financial Data (1)
The Company’s guidance acknowledges the existence of volatile economic conditions, which may impact our current guidance assumptions. Factors impacting 2012 guidance include, but are not limited to the following: (i) the mix of site usage within the portfolio; (ii) yield management on our short-term resort sites; (iii) scheduled or implemented rate increases on community and resort sites; (iv) scheduled or implemented rate increases of annual payments under right-to-use contracts; (v) occupancy changes; (vi) our ability to retain and attract customers renewing or entering right-to-use contracts; (vii) performance of the chattel loans purchased by us in connection with the Acquisition; and (viii) our ability to integrate and operate the Acquisition Properties in accordance with our estimates.
(In $US millions, except per share data, unaudited)
| Three Months Ended | ||||
| September 30, 2012 | ||||
| Income from property operations—2012 Core (2) |
$ | 72.9 | ||
| Income from property operations—2011 Acquisition (3) |
25.3 | |||
| Property management and general and administrative |
(16.4 | ) | ||
| Other income and expenses (4) |
5.8 | |||
| Financing costs and other |
(35.4 | ) | ||
|
|
|
|||
| Funds from operations (FFO) (5) |
52.2 | |||
| Depreciation on real estate and other |
(25.1 | ) | ||
| Depreciation on rental homes |
(1.6 | ) | ||
| Amortization of in-place leases |
(7.5 | ) | ||
| Deferral of right-to-use contract sales revenue and commission, net |
(1.1 | ) | ||
| Income allocated to OP units |
(1.5 | ) | ||
|
|
|
|||
| Net income available to common shares |
$ | 15.4 | ||
|
|
|
|||
| Net income per common share—fully diluted (6) |
$ $ |
0.32 - 0.42 |
| |
| FFO per share—fully diluted |
$ $ |
1.10- 1.20 |
| |
| Weighted average shares outstanding—fully diluted |
45.4 | |||
| 1) | Each line item represents the mid-point of a range of possible outcomes and reflects management’s best estimate of the most likely outcome. Actual FFO, FFO per share, Net Income and Net Income per share could vary materially from amounts presented above if any of our assumptions are incorrect. |
| 2) | See page 14 for Core guidance assumptions. Amount represents Core Income from property operations for the 2012 Core Properties in 2011 of $71.2 million for the three months ended September 30, 2011 multiplied by an estimated growth rate of 2.4%. |
| 3) | See page 15 for 2011 Acquisition assumptions. |
| 4) | See page 16 for Acquisition Chattel Loan Assumptions. |
| 5) | See page 20 for definition of FFO. |
| 6) | Net income per fully diluted common share is calculated before Income allocated to OP Units. |
13
Core Guidance Assumptions—Income from Property Operations (1)
(In $US millions, unaudited)
| Year
Ended December 31, 2011 |
2012 Growth Factors (2) |
Quarter Ended September 30, 2011 |
Third
Quarter 2012 Growth Factors (2) |
|||||||||||||
| Community base rental income |
$ | 266.6 | 2.9 | % | $ | 66.8 | 2.9 | % | ||||||||
| Rental home income |
6.3 | 22.6 | % | 1.6 | 17.6 | % | ||||||||||
| Resort base rental income (3) |
130.4 | 2.0 | % | 36.1 | -0.5 | % | ||||||||||
| Right-to-use annual payments |
49.1 | -1.9 | % | 12.4 | -1.7 | % | ||||||||||
| Right-to-use contracts current period, gross |
17.9 | -24.3 | % | 4.4 | -4.5 | % | ||||||||||
| Utility and other income |
49.6 | 4.8 | % | 12.9 | 1.9 | % | ||||||||||
|
|
|
|
|
|||||||||||||
| Property operating revenues (4) |
519.9 | 1.7 | % | 134.2 | 1.4 | % | ||||||||||
| Property operating, maintenance, and real estate taxes |
(219.1 | ) | 1.3 | % | (59.1 | ) | -0.3 | % | ||||||||
| Rental home operating and maintenance |
(3.9 | ) | 0.6 | % | (0.9 | ) | 14.7 | % | ||||||||
| Sales and marketing, gross |
(11.2 | ) | -8.7 | % | (3.0 | ) | 4.8 | % | ||||||||
|
|
|
|
|
|||||||||||||
| Property operating expenses (4) |
(234.2 | ) | 0.8 | % | (63.0 | ) | 0.2 | % | ||||||||
|
|
|
|
|
|||||||||||||
| Income from property operations (4) |
$ | 285.7 | 2.4 | % | $ | 71.2 | 2.4 | % | ||||||||
|
|
|
|
|
|||||||||||||
| Resort base rental income: |
||||||||||||||||
| Annual |
83.3 | 4.0 | % | 21.0 | 4.2 | % | ||||||||||
| Seasonal |
20.7 | -0.2 | % | 2.5 | -1.8 | % | ||||||||||
| Transient |
26.4 | -2.8 | % | 12.6 | -8.3 | % | ||||||||||
|
|
|
|
|
|||||||||||||
| Total resort base rental income |
$ | 130.4 | 2.0 | % | $ | 36.1 | -0.5 | % | ||||||||
|
|
|
|
|
|||||||||||||
| 1) | 2012 Core properties include properties we expect to own and operate during all of 2011 and 2012. Excludes property management expenses and the GAAP deferral of right to use contract upfront payments and related commissions, net. |
| 2) | Management’s estimate of the growth of property operations in the 2012 Core Properties compared to actual 2011 performance. Represents our estimate of the mid-point of a range of possible outcomes. Calculations prepared using unrounded numbers. |
| 3) | See resort base rental income table above. |
| 4) | Growth rate excluding right-to-use contracts-current period gross sales and marketing expenses and cable service prepayments is 2.5%, 1.7%, and 3.2% for property operating revenues, property operating expenses, and income from property operations, respectively for the three months ended June 30, 2012 and 2.5%, 2.0%, and 2.8%, respectively, for the six months ended June 30, 2012. |
14
2011 Acquisition Assumptions in 2012 (1)
(In $US millions, unaudited)
| Year
Ended December 31, 2012 |
Three Months
Ended September 30, 2012 |
|||||||
| Community base rental income |
$ | 139.4 | $ | 34.9 | ||||
| Rental home income |
5.9 | 1.6 | ||||||
| Resort base rental income |
0.5 | 0.1 | ||||||
| Utility income and other property income |
12.8 | 3.2 | ||||||
|
|
|
|
|
|||||
| Property operating revenues |
158.6 | 39.8 | ||||||
| Property operating, maintenance and real estate taxes |
(54.3 | ) | (13.7 | ) | ||||
| Rental home operating and maintenance |
(3.0 | ) | (0.8 | ) | ||||
|
|
|
|
|
|||||
| Property operating expenses |
(57.3 | ) | (14.5 | ) | ||||
|
|
|
|
|
|||||
| Income from property operations |
$ | 101.3 | $ | 25.3 | ||||
|
|
|
|
|
|||||
| 1) | Each line item represents our estimate of the mid-point of a possible range of outcomes for the Acquisition Properties. |
15
Acquisition Chattel Loan Assumptions
(2012 Guidance; in $US millions, unaudited)
Other Income and Expense guidance includes estimated interest income of approximately $5.1 million for the year ended December 31, 2012 from Notes Receivable acquired from the seller and secured by manufactured homes in connection with the purchase of 75 Acquisition Properties during 2011. As of June 30, 2012, the company’s carrying value of the Notes Receivable was approximately $29.0 million. The Company’s initial carrying value was based on a third party valuation utilizing 2011 market transactions and is adjusted based on actual performance in the loan pool. Factors used in determining the initial carrying value included delinquency status, market interest rates and recovery assumptions. The following tables provide a summary of the Notes Receivable and certain assumptions about future performance, including interest income guidance for 2012. An increase in the estimate of expected cash flows would generally result in additional interest income to be recognized over the remaining life of the underlying pool of loans. A decrease in the estimate of expected cash flows could result in an impairment loss to the carrying value of the loans. There can be no assurance that the Notes Receivable will perform in accordance with these assumptions.
(2012 Guidance; in $US millions, unaudited)
| Contractual cash flows to maturity beginning 1/1/2012 |
$ | 211 | ||
| Expected cash flows to maturity beginning 1/1/2012 |
98 | |||
| Face value of loans at acquisition |
113 | |||
| Carrying value of loans at acquisition |
42 | |||
| Expected interest income to maturity beginning 1/1/2012 |
56 |
| 2012
Guidance Assumptions |
Actual through June 30, 2012 |
|||||||
| Default rate |
10 | % | 23 | % | ||||
| Recoveries as percentage of defaults |
25 | % | 35 | % | ||||
| Yield |
17 | % | 17 | % | ||||
| Average carrying amount of loans |
$ | 29.2 | $ | 32.3 | ||||
| Contractual principal pay downs |
4.4 | 2.5 | ||||||
| Contractual interest income |
6.8 | 3.3 | ||||||
| Expected cash flows applied to principal |
5.9 | 3.0 | ||||||
| Expected cash flows applied to interest income |
5.1 | 2.8 | ||||||
16
Balance Sheet
(In $US thousands, unaudited)
| Selected Balance Sheet Data | June 30, 2012 | December 31, 2011 | ||||||
| Net investment in real estate |
$ | 3,207,639 | $ | 3,265,447 | ||||
| Cash |
134,967 | 70,460 | ||||||
| Total assets |
3,498,650 | 3,496,101 | ||||||
| Mortgage notes payable |
2,088,450 | 2,084,683 | ||||||
| Term loan |
200,000 | 200,000 | ||||||
| Unsecured lines of credit (1) |
— | — | ||||||
| Total liabilities |
2,519,588 | 2,496,821 | ||||||
| 8.034% Series A Cumulative Redeemable Perpetual Preferred Stock |
200,000 | 200,000 | ||||||
| Total common equity |
779,062 | 799,280 | ||||||
| 1) | As of June 30, 2012, the Company had an unsecured line of credit with a borrowing capacity of $380.0 million which accrued interest at a rate of LIBOR plus 1.65% to 2.50% per annum and contained a 0.30% to 0.40% facility fee. The unsecured line of credit matures on September 18, 2015 and has an eight-month extension option. |
17
Right-To-Use Membership—Select Data
(In $US thousands, except member count, number of Zone Park Passes, number of annuals, and number of upgrades, unaudited)
| Year Ended December 31 | ||||||||||||||||
| 2009 | 2010 | 2011 | 2012 (1) | |||||||||||||
| Member Count (2) |
105,850 | 102,726 | 99,567 | 96,100 | ||||||||||||
| Right-to-use annual payments |
$ | 50,765 | $ | 49,831 | $ | 49,122 | $ | 48,200 | ||||||||
| Number of Zone Park Passes (ZPP’s) (3) |
0 | 4,487 | 7,404 | 9,000 | ||||||||||||
| Number of annuals (4) |
2,484 | 3,062 | 3,555 | 4,100 | ||||||||||||
| Resort base rental income from annuals |
$ | 5,950 | $ | 6,712 | $ | 8,069 | $ | 9,500 | ||||||||
| Number of upgrades (5) |
3,379 | 3,659 | 3,930 | 3,100 | ||||||||||||
| Upgrade contract initiations (6) |
$ | 15,372 | $ | 17,430 | $ | 17,663 | $ | 13,700 | ||||||||
| Resort base rental income from seasonals/transients |
$ | 10,121 | $ | 10,967 | $ | 10,852 | $ | 10,400 | ||||||||
| Utility and other income |
$ | 1,883 | $ | 2,059 | $ | 2,444 | $ | 2,300 | ||||||||
| 1) | Guidance estimate for the year ended December 31, 2012. |
| 2) | Members have entered into right-to-use contracts with the Company which entitle them to use certain properties on a continuous basis for up to 21 days. |
| 3) | Zone Park Passes (ZPP’s) allow access to up to four zones of the United States and require annual payments. |
| 4) | Members that renew their right-to-use contracts annually and pay an annual rate for the right to use a specific site. |
| 5) | Existing customers that have upgraded agreements are eligible for longer stays, can make earlier reservations, may receive discounts on rental units, and may have access to additional Properties. Upgrades require a non-refundable upfront payment. |
| 6) | Sales revenues associated with contract upgrades, included in the line item Right-to-use contracts current period, gross, on the Company’s Income Statement on page 5. |
18
Debt Maturity Table (1)
(In $US millions, unaudited)
| Year |
Amount | |||
| 2012 |
$ | 34 | ||
| 2013 |
116 | |||
| 2014 |
134 | |||
| 2015 |
597 | |||
| 2016 |
230 | |||
| 2017 |
92 | |||
| 2018 |
207 | |||
| 2019 |
216 | |||
| 2020 |
139 | |||
| 2021+ |
295 | |||
|
|
|
|||
| $ | 2,060 | |||
| 1) | Represents the Company’s mortgage notes payable excluding $28 million net note premiums, and the Company’s $200 million term loan as of June 30, 2012. |
19
Non–GAAP Financial Measures
Funds from Operations (“FFO”)—a non-GAAP financial measure. The Company believes that FFO, as defined by the Board of Governors of the National Association of Real Estate Investment Trusts (“NAREIT”), is generally an appropriate measure of performance for an equity REIT. While FFO is a relevant and widely used measure of operating performance for equity REITs, it does not represent cash flow from operations or net income as defined by GAAP, and it should not be considered as an alternative to these indicators in evaluating liquidity or operating performance.
The Company defines FFO as net income, computed in accordance with GAAP, excluding gains or actual or estimated losses from sales of properties, plus real estate related depreciation and amortization, and after adjustments for unconsolidated partnerships and joint ventures. Adjustments for unconsolidated partnerships and joint ventures are calculated to reflect FFO on the same basis. The Company receives up-front non-refundable payments from the entry of right-to-use contracts. In accordance with GAAP, the upfront non-refundable payments and related commissions are deferred and amortized over the estimated customer life. Although the NAREIT definition of FFO does not address the treatment of nonrefundable right-to-use payments, the Company believes that it is appropriate to adjust for the impact of the deferral activity in its calculation of FFO. The Company believes that FFO is helpful to investors as one of several measures of the performance of an equity REIT. The Company further believes that by excluding the effect of depreciation, amortization and gains or actual or estimated losses from sales of real estate, all of which are based on historical costs and which may be of limited relevance in evaluating current performance, FFO can facilitate comparisons of operating performance between periods and among other equity REITs. The Company believes that the adjustment to FFO for the net revenue deferral of upfront non-refundable payments and expense deferral of right-to-use contract commissions also facilitates the comparison to other equity REITs. Funds available for distribution (“FAD”) is a non-GAAP financial measure. FAD is defined as FFO less non-revenue producing capital expenditures. Investors should review FFO and FAD, along with GAAP net income and cash flow from operating activities, investing activities and financing activities, when evaluating an equity REIT’s operating performance. The Company computes FFO in accordance with its interpretation of standards established by NAREIT, which may not be comparable to FFO reported by other REITs that do not define the term in accordance with the current NAREIT definition or that interpret the current NAREIT definition differently than the Company does. FFO and FAD do not represent cash generated from operating activities in accordance with GAAP, nor do they represent cash available to pay distributions and should not be considered as an alternative to net income, determined in accordance with GAAP, as an indication of the Company’s financial performance, or to cash flow from operating activities, determined in accordance with GAAP, as a measure of its liquidity, nor is it indicative of funds available to fund the Company’s cash needs, including its ability to make cash distributions.
20