Attached files
| file | filename |
|---|---|
| 8-K - FORM 8-K - DARDEN RESTAURANTS INC | dri-july2012release.htm |
| EX-2.1 - AGREEMENT AND PLAN OF MERGER - DARDEN RESTAURANTS INC | exhibit21agreement.htm |
| EX-99.2 - NEWS RELEASE - DARDEN RESTAURANTS INC | driexhibit991-july2012rele.htm |

Darden and Yard House Exhibit 99.1
® Forward-Looking Statement During the course of this conference call, Darden Restaurants’ officers and employees may make forward-looking statements concerning the Company’s expectations, goals or objectives. Forward-looking statements regarding our expected earnings per share and U.S. same-restaurant sales for the quarter and fiscal year, new restaurant growth and all other statements that are not historical facts, including without limitation statements concerning our future economic performance, plans or objectives, are made under the Safe Harbor provisions of the Private Securities Litigation Reform Act of 1995. Any forward-looking statements speak only as of the date on which such statements are made, and we undertake no obligation to update such statements to reflect events or circumstances arising after such date. We wish to caution investors not to place undue reliance on any such forward-looking statements. By their nature, forward-looking statements involve risks and uncertainties that could cause actual results to materially differ from those anticipated in the statements. The most significant of these uncertainties are described in Darden's Form 10-K, Form 10-Q and Form 8-K reports (including all amendments to those reports). These risks and uncertainties include the successful completion of the proposed transaction in a timely manner, the ability to successfully integrate the new operations into our business following completion of the proposed transaction, food safety and food-borne illness concerns, litigation, unfavorable publicity, federal, state and local regulation of our business including health care reform, labor and insurance costs, technology failures, failure to execute a business continuity plan following a disaster, health concerns including virus outbreaks, the intensely competitive nature of the restaurant industry, factors impacting our ability to drive sales growth, the impact of the indebtedness we incurred in the RARE acquisition, our plans to expand our newer brands like Bahama Breeze and Seasons 52, our ability to successfully integrate Eddie V's restaurant operations, a lack of suitable new restaurant locations, higher- than-anticipated costs to open, close or remodel restaurants, increased advertising and marketing costs, a failure to develop and recruit effective leaders, the price and availability of key food products and utilities, shortages or interruptions in the delivery of food and other products, volatility in the market value of derivatives, general macroeconomic factors including unemployment and interest rates, severe weather conditions, disruptions in the financial markets, risks of doing business with franchisees and vendors in foreign markets, failure to protect our service marks or other intellectual property, a possible impairment in the carrying value of our goodwill or other intangible assets, a failure of our internal controls over financial reporting, or changes in accounting standards, and other factors and uncertainties discussed from time to time in reports filed by Darden with the Securities and Exchange Commission.

® Transaction Summary Completed a definitive merger agreement for Darden to acquire Yard House for a total purchase price of $585 million – Acquired on a debt-free basis – Includes $30 million of net tax benefits anticipated to be realized by Darden over the next two years Represents transaction multiples on the purchase price net of tax benefits of: – 1.5x Fiscal 2013 Sales of $368 million1 – 12.5x Fiscal 2013 EBITDA of $44 million1 Expected synergies of $6 million to $10 million in Fiscal 2014 and $15 million to $20 million in Fiscal 2015 Dilutive to Darden’s diluted net earnings per share in fiscal 2013 by three to five cents, which includes seven to ten cents of acquisition costs Accretive to Darden’s diluted net earnings per share in fiscal 2014 by 10 to 12 cents even with acquisition costs of two to three cents Transaction expected to close early in Darden’s second fiscal quarter 1 Reflects annualized Yard House numbers for Darden’s fiscal year ending May 2013. Based on net transaction price of $555 million, which reflects $30 million of anticipated tax benefits.
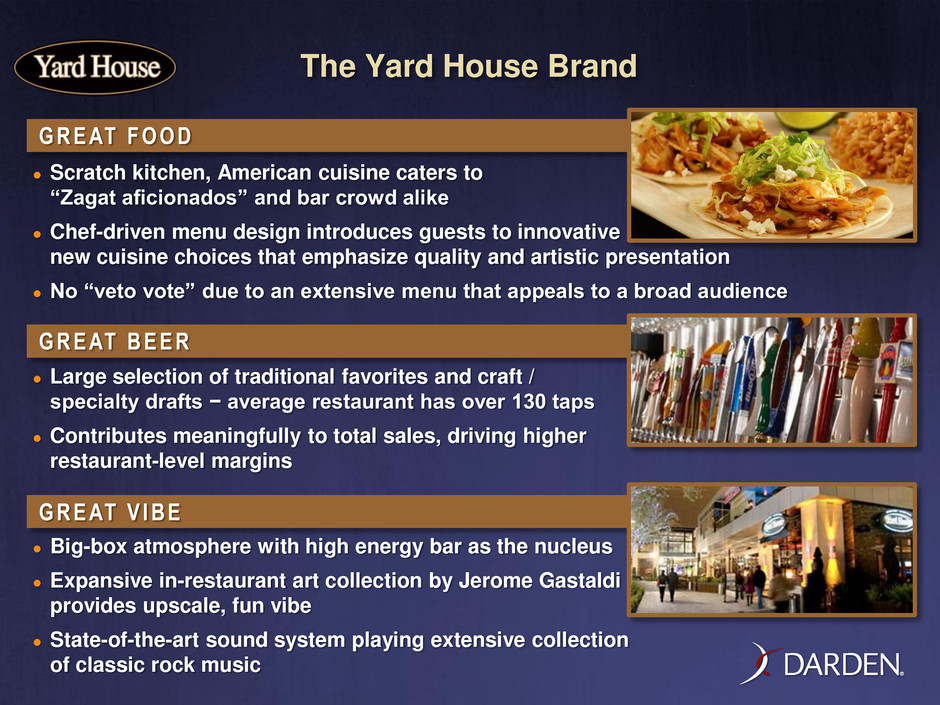
® The Yard House Brand Scratch kitchen, American cuisine caters to “Zagat aficionados” and bar crowd alike Chef-driven menu design introduces guests to innovative new cuisine choices that emphasize quality and artistic presentation No “veto vote” due to an extensive menu that appeals to a broad audience Large selection of traditional favorites and craft / specialty drafts − average restaurant has over 130 taps Contributes meaningfully to total sales, driving higher restaurant-level margins Big-box atmosphere with high energy bar as the nucleus Expansive in-restaurant art collection by Jerome Gastaldi provides upscale, fun vibe State-of-the-art sound system playing extensive collection of classic rock music G R E AT F O O D G R E AT B E E R G R E AT V I B E

® $183 $213 $262 2009 2010 2011 $27 $31 $39 2009 2010 2011 Strong and Consistent Performance Strong performance through economic downturn – Sales CAGR of 19.7% from 2009-2011 – EBITDA CAGR of 21.1% from 2009-2011 Continued operating strength through Q2 2012 – Revenue increased 27% Significant "white space" opportunity with ultimate potential for at least 150 to 200 restaurants nationally – Currently 39 units across 13 states – Opened 14 new units from 2009-2011 – Pipeline: 3 under construction, 5 signed leases and 4 additional LOIs Adj. EBITDA1 ($mm) 1 EBITDA adjusted for pre-opening expense, small wares expense, stock compensation and management fees. Sales ($mm) HISTORY OF STRONG PERFORMANCE WITH OPPORTUNITY FOR GROWTH
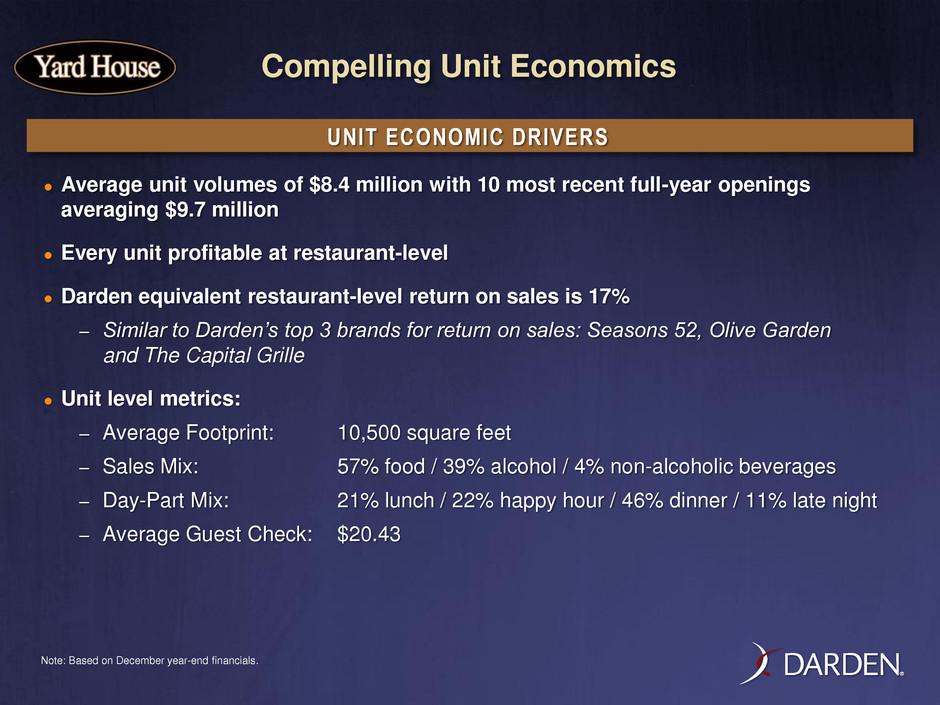
® Compelling Unit Economics Average unit volumes of $8.4 million with 10 most recent full-year openings averaging $9.7 million Every unit profitable at restaurant-level Darden equivalent restaurant-level return on sales is 17% – Similar to Darden’s top 3 brands for return on sales: Seasons 52, Olive Garden and The Capital Grille Unit level metrics: – Average Footprint: 10,500 square feet – Sales Mix: 57% food / 39% alcohol / 4% non-alcoholic beverages – Day-Part Mix: 21% lunch / 22% happy hour / 46% dinner / 11% late night – Average Guest Check: $20.43 Note: Based on December year-end financials. UNIT ECONOMIC DRIVERS
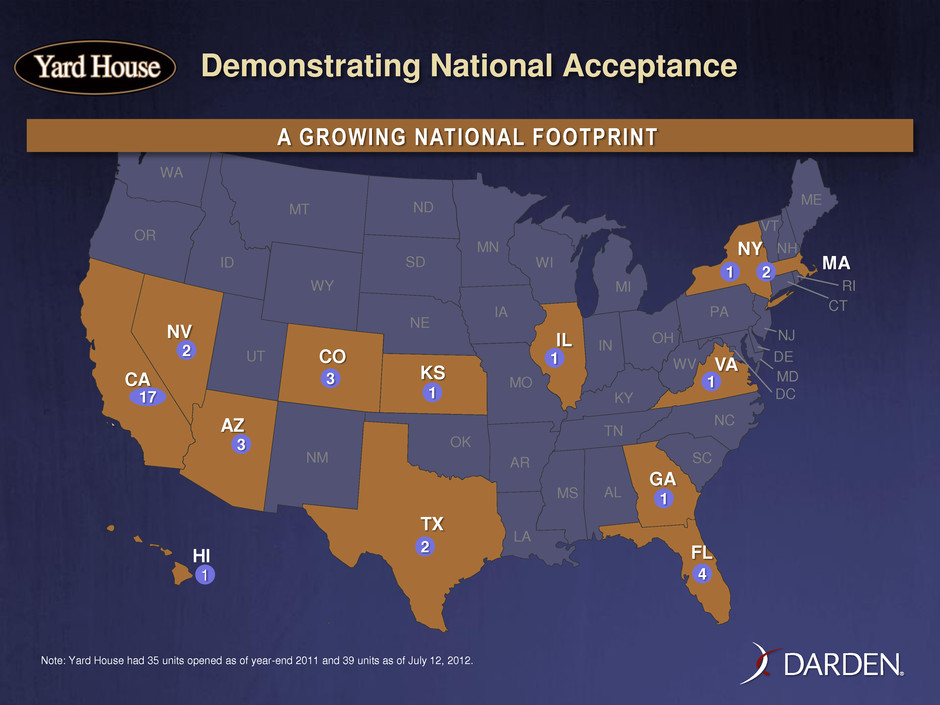
® Demonstrating National Acceptance HI FL NM DE MD TX OK KS NE SD ND MT WY CO UT ID AZ NV WA CA OR KY ME NY PA VT NH MA RI CT WV IN IL NC TN SC AL MS AR LA MO IA MN WI NJ GA DC VA OH MI 2 3 17 2 3 1 1 1 4 1 2 1 1 Note: Yard House had 35 units opened as of year-end 2011 and 39 units as of July 12, 2012. A GROWING NATIONAL FOOTPRINT

® Why Yard House Is a Good Fit for Darden Complements Darden’s brand portfolio with a unique concept that consumers crave – A highly respected brand with complementary customer demographics to our large brands – Provides greater exposure to both younger and financially resilient customers Strong unit growth potential will drive accretion to our sales and earnings growth rates Following initial year costs, will be accretive to our diluted net earnings per share growth due to: – Attractive unit-level economics – Strong unit growth – Acquisition cost synergies – Operating leverage benefits of added scale Management teams and cultures mesh well TRANSACTION RATIONALE
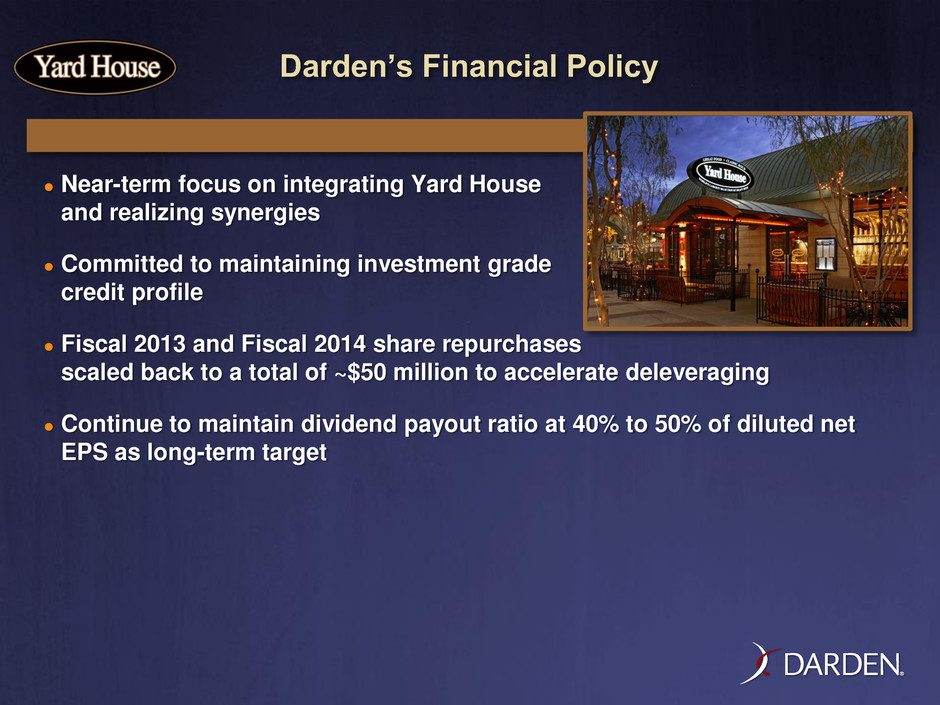
® Darden’s Financial Policy Near-term focus on integrating Yard House and realizing synergies Committed to maintaining investment grade credit profile Fiscal 2013 and Fiscal 2014 share repurchases scaled back to a total of ~$50 million to accelerate deleveraging Continue to maintain dividend payout ratio at 40% to 50% of diluted net EPS as long-term target

Fiscal 2013 Outlook

® Fiscal 2013 Financial Outlook Total Sales Growth +9% to +10% - Same-Restaurant Sales +1% to +2% - New Restaurants +5% - Yard House Acquisition +3% Diluted Net EPS Growth +5% to +9% - Impact from Yard House Earnings +$0.04 to +$0.05 - One-Time Acquisition Costs -$0.07 to -$0.10 Total Transaction Impact to EPS -$0.03 to -$0.05 Plus Additional Impact: - Reduction in Share Repurchase -$0.04 to -$0.06 Total Impact to EPS -$0.07 to -$0.11
® Yard House Impact in Fiscal 2014 and Fiscal 2015 • Even after effects of one-time acquisition and integration costs, the acquisition is expected to be accretive in Fiscal 2014 and Fiscal 2015 – Accretion of $0.10 to $0.12 in Fiscal 2014 (including $0.02 to $0.03 of acquisition costs) – Accretion of $0.18 to $0.20 in Fiscal 2015

Our Compelling Opportunity: To Create a Company That’s More Valuable… and Valued
® Reconciliation of Non-GAAP Financial Measures In addition to disclosing financial results calculated in accordance with U.S. generally accepted accounting principles ("GAAP"), this presentation contains non-GAAP financial measures. The non-GAAP financial measures should not be considered a substitute for, or superior to, financial measures calculated in accordance with GAAP, however, they are provided as management believes they are helpful in evaluating the proposed transaction. The non-GAAP financial measures may be calculated differently from, and therefore may not be comparable to, similarly titled measures used by other companies.
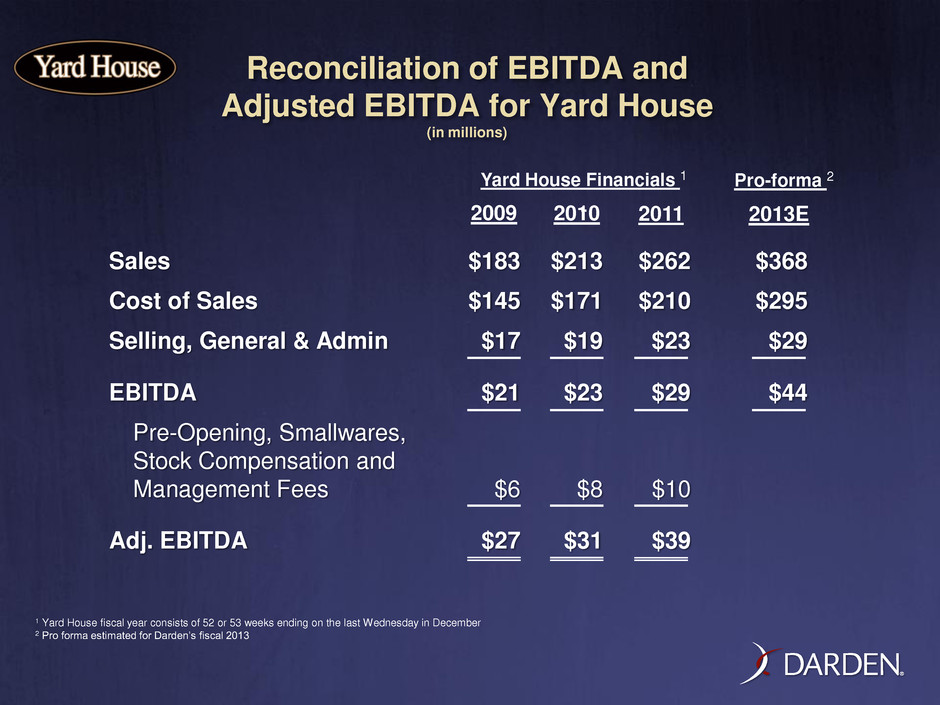
® Reconciliation of EBITDA and Adjusted EBITDA for Yard House (in millions) Sales $183 $213 $262 $368 Cost of Sales $145 $171 $210 $295 Selling, General & Admin $17 $19 $23 $29 EBITDA $21 $23 $29 $44 Pre-Opening, Smallwares, Stock Compensation and Management Fees $6 $8 $10 Adj. EBITDA $27 $31 $39 2009 2010 2011 2013E Yard House Financials 1 Pro-forma 2 1 Yard House fiscal year consists of 52 or 53 weeks ending on the last Wednesday in December 2 Pro forma estimated for Darden’s fiscal 2013
