Attached files
| file | filename |
|---|---|
| EX-31.2 - CERTIFICATION PURSUANT TO SECTION 302 - CHC Helicopter S.A. | d375764dex312.htm |
| EX-12.1 - COMPUTATION OF RATIO OF EARNINGS TO FIXED CHARGES - CHC Helicopter S.A. | d375764dex121.htm |
| EX-18.1 - LETTER OF INDEPENDENT REGISTERED PUBLIC ACCOUNTING FIRM - CHC Helicopter S.A. | d375764dex181.htm |
| EX-32.1 - CERTIFICATION PURSUANT TO 18 U.S.C. SECTION 1350 - CHC Helicopter S.A. | d375764dex321.htm |
| EX-31.1 - CERTIFICATION PURSUANT TO SECTION 302 - CHC Helicopter S.A. | d375764dex311.htm |
| EX-32.2 - CERTIFICATION PURSUANT TO 18 U.S.C. SECTION 1350 - CHC Helicopter S.A. | d375764dex322.htm |
| EX-21.1 - SCHEDULE OF SUBSIDIARIES - CHC Helicopter S.A. | d375764dex211.htm |
| EX-10.36 - EMPLOYMENT AGREEMENT - CHC Helicopter S.A. | d375764dex1036.htm |
Table of Contents
UNITED STATES
SECURITIES AND EXCHANGE COMMISSION
Washington, DC 20549
FORM 10-K
| x | ANNUAL REPORT PURSUANT TO SECTION 13 OR 15(d) OF THE SECURITIES EXCHANGE ACT OF 1934 |
FOR THE FISCAL YEAR ENDED APRIL 30, 2012
OR
| ¨ | TRANSITION REPORT PURSUANT TO SECTION 13 OR 15(d) OF THE SECURITIES EXCHANGE ACT OF 1934 |
For the transition period from to
Commission file number: 333-179072
CHC Helicopter S.A.
(Exact Name of Registrant as Specified in Its Charter)
| Luxembourg | N/A | |
| (State or Other Jurisdiction of Incorporation or Organization) |
(I.R.S. Employer Identification No.) |
4740 Agar Drive
Richmond, BC V7B 1A3, Canada
(Address of Principal Executive Offices, Zip code)
(604) 276-7500
(Registrant’s telephone number, including area code)
Securities registered pursuant to Section 12(b) of the Act: None.
Securities registered pursuant to Section 12(g) of the Act: None.
Indicate by check mark if the Registrant is a well-known seasoned issuer, as defined in Rule 405 of the Securities Act. Yes ¨ No x
Indicate by check mark if the Registrant is not required to file reports pursuant to Section 13 or Section 15(d) of the Act. Yes ¨ No x
Indicate by check mark whether the registrant: (1) has filed all reports required to be filed by Section 13 or 15(d) of the Securities Exchange Act of 1934 during the preceding 12 months (or for such shorter period that the registrant was required to file such reports), and (2) has been subject to such filing requirements for the past 90 days. Yes ¨ No x
Indicate by check mark whether the registrant has submitted electronically and posted on its corporate Web site, if any, every Interactive Data File required to be submitted and posted pursuant to Rule 405 of Regulation S-T during the preceding 12 months (or for such shorter period that the registrant was required to submit and post such files). Yes x No ¨
Indicate by check mark if disclosure of delinquent filers pursuant to Item 405 of Regulation S-K is not contained herein, and will not be contained, to the best of the registrant’s knowledge, in definitive proxy or information statements incorporated by reference in Part III of this Form 10-K or any amendment to this Form 10-K. x
Indicate by check mark whether the Registrant is a large accelerated filer, an accelerated filer, a non-accelerated filer, or a smaller reporting company. See the definitions of “large accelerated filer”, “accelerated filer” and “smaller reporting company” in Rule 12b-2 of the Exchange Act. (Check one):
| Large accelerated filer | ¨ | Accelerated filer | ¨ | |||
| Non-accelerated filer | x (Do not check if a smaller reporting company) | Smaller reporting company | ¨ | |||
Indicate by check mark whether the registrant is a shell company (as defined in Exchange Act Rule 12b-2). Yes ¨ No x
The aggregate market value of the voting and non-voting common equity held by non-affiliates as of the last business day of the registrant’s most recently completed second fiscal quarter was $0, as there was no public market for the registrant’s common stock as of October 31, 2011. As of June 30, 2012, there were 1,870,561,417 Class A Shares, 8,512,986 Class B Shares, 318,000 Special Shares and one Class C Share of stock outstanding.
DOCUMENT INCORPORATED BY REFERENCE.
None.
Table of Contents
ANNUAL REPORT ON FORM 10-K
FOR THE FISCAL YEAR ENDED
April 30, 2012
TABLE OF CONTENTS
| Page Number | ||||||
| PART I | ||||||
| Cautionary Note Regarding Forward-Looking Statements and Other Industry and Market Data |
ii | |||||
| Item 1. | 1 | |||||
| Item 1A. | 10 | |||||
| Item 1B. | 19 | |||||
| Item 2. | 19 | |||||
| Item 3. | 19 | |||||
| Item 4. | 20 | |||||
| PART II | ||||||
| Item 5. | 20 | |||||
| Item 6. | 21 | |||||
| Item 7. | Management’s discussion and analysis of financial condition and results of operations |
24 | ||||
| Item 7A. | 46 | |||||
| Item 8. | 47 | |||||
| Item 9. | Changes in and disagreements with accountants on accounting and financial disclosure |
48 | ||||
| Item 9A. | 48 | |||||
| Item 9B. | 48 | |||||
| PART III | ||||||
| Item 10. | 48 | |||||
| Item 11. | 52 | |||||
| Item 12. | Security ownership of certain beneficial owners and management and related stockholder matters |
73 | ||||
| Item 13. | Certain relationships and related transactions, and director independence |
75 | ||||
| Item 14. | 76 | |||||
| PART IV | ||||||
| Item 15. | 77 | |||||
| SIGNATURES | ||||||
| 78 | ||||||
i
Table of Contents
CAUTIONARY NOTE REGARDING FORWARD-LOOKING STATEMENTS AND OTHER INDUSTRY AND
MARKET DATA
This Annual Report on Form 10-K and the documents incorporated herein by reference contain forward-looking statements, within the meaning of Section 21E of the Securities Exchange Act of 1934, as amended, and Section 27A of the Securities Act of 1933, as amended, about our future expectations, plans or prospects and our business. All statements contained in this Annual Report on Form 10-K, other than statements of historical fact, regarding our strategy, future operations, financial position, estimated revenues and losses, projected costs, prospects, plans and objectives of management, are forward-looking statements. When used in this Annual Report on Form 10-K, the words “could,” “believe,” “anticipate,” “intend,” “estimate,” “expect,” “project” and similar expressions are intended to identify forward-looking statements, although not all forward-looking statements contain such identifying words. Although these forward-looking statements are based on our current expectations and assumptions about future events and are based on currently available information as to the outcome and timing of future events, actual results may differ materially from those stated in or implied by these forward-looking statements. Such factors include, but are not limited to, the following:
| • | Competition in the markets we serve; |
| • | loss of any of our large, long-term support contracts; |
| • | failure to maintain standards of acceptable safety performance; |
| • | political, economic and regulatory uncertainty; |
| • | problems with our non-wholly owned entities; |
| • | exposure to credit risks; |
| • | assimilation of acquisitions and the impact of any future material acquisitions; |
| • | inability to fund our working capital requirements; |
| • | unanticipated costs or cost increases; |
| • | risks inherent in the operation of helicopters; |
| • | reduced activity in the oil and gas industry; |
| • | inability to obtain or maintain necessary aircraft, aircraft parts, insurance or lease financing; |
| • | exchange rate fluctuations; |
| • | loss of key personnel; |
| • | labor problems; |
| • | global financial market instability; |
| • | insufficient assets in our defined benefit pension plan; |
| • | allocation of risk between our customers and us; |
| • | inability to dispose of our older aircraft and parts; |
| • | inability to service our debt obligations or comply with our obligations under our operating leases; |
| • | compliance risks associated with international activities; |
| • | application of tax laws in various jurisdictions; |
| • | inability to upgrade our technology; |
| • | reduction or cancellation of services for government agencies; |
| • | our sponsor may have interests that conflict with ours; |
| • | risk related to our operations under local law; and |
| • | inability to maintain government issued licenses. |
Actual results may differ materially from those discussed in these forward-looking statements due to a number of factors, including the risks set forth in the section entitled “Risk Factors” in Part I, Item 1A of this Annual Report on Form 10-K and elsewhere in this filing. Although we believe that the expectations reflected in the forward-looking statements are reasonable, we cannot guarantee future results, levels of activity, performance or achievements. Moreover, neither we nor any other person assumes responsibility for the accuracy and completeness of these forward-looking statements. We are under no duty to update any of the forward-looking statements after the date of this Annual Report on Form 10-K to conform our prior statements to actual results.
The market data and other statistical information (such as the size of certain markets and our position and the position of our competitors within these markets, oil and gas production and market information) used throughout this Annual Report on Form 10-K are based on independent industry publications, government publications, reports by market research firms or
ii
Table of Contents
other published independent sources. Some market data and statistical information are also based on our good faith estimates, which are derived from our review of internal surveys, as well as the independent sources listed above. This information may prove to be inaccurate because of the method by which we obtain some of the data for our estimates or because this information cannot always be verified with complete certainty due to the limits on the availability and reliability of raw data, the voluntary nature of the data gathering process and other limitations and uncertainties. As a result, although we believe these sources are reliable, we have not independently verified the information and cannot guarantee its accuracy and completeness. The industry in which we operate is subject to a high degree of uncertainty and risk due to a variety of factors, including those described in the section entitled “Risk Factors” in Part I, Item 1A of this Annual Report on Form 10-K.
BASIS OF PRESENTATION
The audited consolidated financial statements of the top-most parent guarantor, 6922767 Holding S.à r.l. (the “Successor”, the “Company”, “we”, “us” or “our”), consist of the Successor’s consolidated balance sheets as of April 30, 2012 and 2011 and the Successor’s consolidated statements of operations, changes in shareholder’s equity and cash flows for the years ended April 30, 2012, 2011, and 2010.
6922767 Holding S.à r.l. was incorporated on February 20, 2008 under the laws of Luxembourg and is a private limited liability company (Société à responsabilité limitée) (S.à r.l.) whose sole purpose was to acquire CHC Helicopter Corporation (the “Predecessor”). The Company completed its acquisition of the Predecessor on September 16, 2008 and has included the results of operations and cash flows of the entity formerly known as CHC Helicopter Corporation from September 16, 2008 to April 30, 2009 in its audited consolidated financial statements for the fiscal year ended April 30, 2009, which are not included in this Annual Report on Form 10-K. The Company’s results of operations also include organizational expenses and losses related to the acquisition as it was not previously operating in the helicopter transportation services industry from May 1, 2008 up to the date of the acquisition. The acquisition of CHC Helicopter Corporation was accounted for using the purchase method of accounting. The application of the purchase method of accounting requires the allocation of the acquisition purchase price to the tangible and intangible assets acquired and liabilities assumed based on their respective fair values as of the date of the acquisition. As a result, the assets and liabilities acquired from the Predecessor on the date of acquisition are recorded at fair values and these became the Successor’s cost basis. Accordingly, the Predecessor period from May 1, 2008 to September 15, 2008 and the Successor period from May 1, 2008 to April 30, 2009 have a different basis of accounting.
The Predecessor adopted the U.S. dollar as its reporting currency on May 1, 2008. As such, historical figures previously reported in Canadian dollars have been translated into U.S. dollars using the current rate method. Under this method, the statement of operations and cash flow statement items have been translated into U.S. dollars using the rates in effect at the date of the transactions. Assets and liabilities have been translated using the exchange rate in effect at the balance sheet date. The Predecessor applied this method retrospectively to all activity that commenced May 1, 2004. Equity balances which arose prior to May 1, 2004 have been translated to the reporting currency at the exchange rate in effect on May 1, 2004.
TRADEMARKS
CHC Helicopter and the CHC Helicopter logo are trademarks of CHC Helicopter S.A. All other trademarks and service marks appearing in this Annual Report on Form 10-K are the property of their respective holders. All rights reserved. The absence of a trademark or service mark or logo from this Annual Report on Form 10-K does not constitute a waiver of trademark or other intellectual property rights of CHC Helicopter S.A, its affiliates and/or licensors.
GLOSSARY
| Embedded equity | Embedded equity represents the amount by which the estimated market value of a leased aircraft exceeds the leased aircraft purchase option price at September 16, 2008, the acquisition date. Embedded equity is assessed on an ongoing basis for impairment. Impairment, if any, is recognized in the consolidated statements of operations. | |
| EMS | Emergency medical services. | |
| Fixed wing | An airplane. | |
iii
Table of Contents
| Heavy helicopter | A category of twin-engine helicopters that requires two pilots, can accommodate 19 to 26 passengers and can operate under instrument flight rules, which allow daytime and nighttime flying in a variety of weather conditions. The greater passenger capacity, larger cabin, longer range, and ability to operate in adverse weather conditions make heavy aircraft more suitable than single engine aircraft for offshore support. Heavy helicopters are generally utilized to support the oil and gas sector, construction and forestry industries and SAR and EMS customer requirements. | |
| IFR | Instrument flight rules, which allow for daytime and nighttime flying in a variety of weather conditions. | |
| Long-term contracts | Contracts of three years or longer in duration. | |
| Medium helicopter | A category of twin-engine helicopters that generally requires two pilots, can accommodate nine to 15 passengers and can operate under instrument flight rules, which allow daytime and nighttime flying in a variety of weather conditions. The greater passenger capacity, longer range, and ability to operate in adverse weather conditions make medium aircraft more suitable than single engine aircraft for offshore support. Medium helicopters are generally utilized to support the oil and gas sector, construction and forestry industries and SAR and EMS customer bases in certain jurisdictions. Medium helicopters can also be used to support the utility and mining sectors, where transporting a smaller number of passengers or carrying light loads over shorter distances is required. | |
| Medium term contracts | Contracts of greater than one year and less than three years in duration. | |
| MRO | Maintenance, repair and overhaul. | |
| New technology | When used herein to classify our aircraft, a category of higher value, recently produced, more sophisticated and more comfortable aircraft, including Eurocopter’s EC225, EC135, EC145 and EC155; Agusta’s AW139; and Sikorsky’ S76C+, S76C++ and S92A. | |
| Old technology | When used herein to classify our aircraft, all aircraft other than new technology aircraft, including Eurocopter’s AS365 and Super Puma; Sikorsky’s 76A, 76B, 76C and S61N; and Bell’s 412, 212 and 214. | |
| OEM | Original equipment manufacturer. | |
| PBH | Power-by-the-hour. A program where an aircraft operator pays a fee per flight hour to an MRO provider as compensation for repair and overhaul components required in order for the aircraft to maintain an airworthy condition. | |
| SAR | Search and rescue. | |
| VFR | Visual flight rules, which require daylight and good weather conditions. | |
iv
Table of Contents
| Item 1. | Business |
Overview
Our Company
We are a world-leading commercial operator of medium and heavy helicopters, providing mission-critical services to the offshore oil and gas industry, as well as SAR and EMS to government agencies and commercial operators through our Helicopter Services segment. We believe the helicopter services we provide to our oil and gas customers are critical for the continued production of hydrocarbons from existing offshore oil and gas platforms and the exploration and development of new oil fields, while our SAR and EMS services help save lives. In addition, our MRO segment, Heli-One is a world leading independent commercial provider of helicopter support services with offerings that include MRO services, integrated logistics support, helicopter parts sales and distribution, and complete outsourcing of maintenance for helicopter operators. Heli-One services our own flight operations and third-party customers around the world.
We have been providing helicopter services through our subsidiaries and predecessor companies, for more than 60 years and currently operate in approximately 30 countries, covering every major offshore oil and gas producing region of the world except the Gulf of Mexico. Our major operations are in Norway, the United Kingdom, Ireland, the Netherlands, Australia, Brazil, Canada, Europe and Africa. As of April 30, 2012, we operated 252 aircraft, comprising 113 heavy helicopters, 137 medium helicopters, and two fixed-wing aircraft. For the fiscal years ended April 30, 2012 and April 30, 2011, helicopter transportation services for the oil and gas industry accounted for approximately 79% and 78% of our total revenue, respectively, SAR and EMS activities accounted for approximately 9% and 10% of our total revenue, respectively, while MRO and other helicopter support services represented approximately 12% and 12% of our total revenue, respectively. For the fiscal years ended April 30, 2012, April 30, 2011 and April 30, 2010, the Company earned revenues of $1,692.5 million, $1,445.5 million and $1,313.6 million and incurred net losses of $95.0 million, $65.3 million and $76.5 million, respectively.
The following map shows our aircraft distribution as of April 30, 2012:
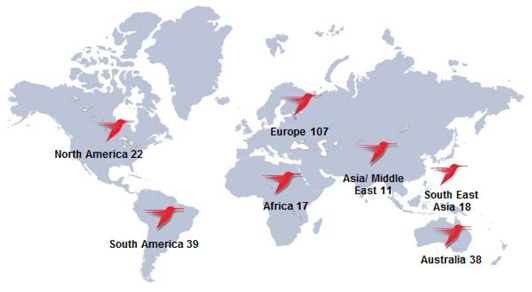
| Note 1: | Aircraft in Europe and North America include aircraft in post-delivery modification, those used for base maintenance and aircraft held for sale. |
Helicopter Services
Our Helicopter Services segment consists of flying operations in the Eastern North Sea, the Western North Sea, the Americas, the Australasia region and the Africa-Euro Asia region serving customers primarily in the offshore oil and gas industry and SAR and EMS. The Eastern North Sea is comprised mainly of Norway while the Western North Sea includes the United Kingdom, Ireland, the Netherlands and Denmark. The Americas is comprised of Brazil and North and South American countries. The Australasia region includes Australia and Southeast Asian countries and the Africa-Euro Asia region includes Nigeria, Kazakhstan, Turkey, Mozambique, Tanzania and other African and European countries.
1
Table of Contents
We are one of two global helicopter service providers to the offshore oil and gas industry. We provide transportation services to and from production platforms, drilling rigs and other offshore installations and facilities.
| • | Our helicopter services business in the oil and gas industry is largely characterized by medium to long-term contracts (i.e., two to eight years in duration, with an average of four years). |
| • | The majority of our customers are large national and multinational companies. |
| • | We believe our services are critical to customers as helicopter transportation is a cost-effective, viable means to transport crews from land to offshore oil and gas platforms. Our fuel costs are passed through to our customers. |
| • | Maintaining a strong safety record is a primary concern for our customers, and as of April 30, 2012, our five year rolling average was 0.23 accidents per 100,000 flight hours. The accident rate is calculated using the number of accidents, as defined by the International Civil Aviation Organization, divided by the number of hours flown in the same period and then multiplied by 100,000. |
We particularly target opportunities for long-term contracts that require sophisticated, medium and heavy helicopters, operated by highly trained personnel with state-of-the-art safety management systems and a world-class operating track record. We are a market leader in most of the regions we serve, with a well-established reputation for safety, customer service and aircraft reliability. We are a major operator in the North Sea, one of the world’s largest oil producing regions. We operate the largest fleet of heavy helicopters in Brazil to service our customers in the oil and gas sector, a market that is shifting to heavy helicopter technology as pre-salt fields in ultra deepwater environments have been further developed, and we service the industry in Africa, Europe, Australia and Southeast Asia. For the fiscal years ended April 30, 2012 and April 30, 2011, revenues generated by helicopter transportation services for the oil and gas industry accounted for approximately 79% and 78% of our total revenues, respectively.
Our oil and gas production customers generally provide our helicopter services business with a less cyclical revenue stream, while oil and gas exploration and development activities are more cyclical in nature. Offshore production platforms generally run at full capacity, irrespective of commodity prices, until the economic end-life of the respective field. These production platforms generally have expected lives of twenty years or more, depending on the size and characteristics of the field.
We are one of the world’s leading commercial providers of SAR and EMS services through our Helicopter Services segment. We have long-term contracts with government agencies and commercial operators in the United Kingdom, Ireland, Norway and Australia. Our SAR and EMS contracts average eight years in duration. Contracts are generally entered into directly with state and federal governments.
| • | Our SAR business utilizes state-of-the-art aircraft specifically configured and equipped with emergency medical and rescue equipment. Our crews are multi-disciplinary professionals with extensive training for the high level of expertise required for maritime search and rescue, thus ensuring maximum safety during the operations conducted. |
| • | Our EMS business provides for the transport of medical personnel and equipment directly to the scene of an accident, and the rapid transport of victims to and between hospitals. |
| • | We expect increased demand for SAR and EMS helicopter services as governments increasingly outsource these services. |
| • | Revenue streams from SAR and EMS services are not driven by general economic conditions or short-term hydrocarbon prices. For the fiscal years ended April 30, 2012 and April 30, 2011, revenues generated by SAR and EMS services accounted for approximately 9% and 10% of our total revenues, respectively. |
Maintenance, Repair and Overhaul
Our MRO segment, Heli-One, is a world-leading independent commercial provider of helicopter support and MRO services. Our comprehensive range of capabilities and broad geographic footprint allow us to offer a full suite of aftermarket services, including engine, airframe and component MRO, logistics support, parts sales and distribution, and high-value engineering and design. We provide these services individually or as part of multi-year complete maintenance outsourcing. We operate independent licensed commercial engine and major component MRO facilities for the Eurocopter SuperPuma and Eurocopter EC225 helicopters. Additionally, we service a wide variety of other helicopter types, including the Eurocopter Dauphin, Sikorsky S61N, Sikorsky S76 series, Sikorsky S92A, Agusta AW139, Bell 212 and Bell 412. We provide sophisticated avionics integration services to the armed forces of European nations, and we partner with helicopter manufacturers around the world to provide MRO services to their direct customers.
2
Table of Contents
We believe that Heli-One enhances our business model in several respects:
| • | Third party demand for MRO services by each of the government, military and civil sectors provides us with a diverse stream of revenue. |
| • | Air worthiness regulations, which are established by civil aviation authorities and manufacturers, require that every dynamic component of a helicopter be replaced or overhauled on a regularly scheduled basis, resulting in steady demand for our MRO services. |
| • | Our in-house repair and overhaul capabilities provide operational control and flexibility over the maintenance of our fleet, lowering operating cost and providing a competitive advantage. |
Our Customers
Our customer base includes a broad range of blue-chip oil and gas companies, government agencies and commercial operators. Key customers include Statoil (year ended April 30, 2012 – 16% of revenues) and Petrobras (year ended April 30, 2012 – 11% of revenues).
Our Industry
Regulated Industry With a Focus on Safety. We operate within extensive and complex regulatory requirements. A strong record for safety, respected brand name and ongoing investment are instrumental in attracting pilots, maintenance engineers and personnel with the requisite levels of training, technical qualifications, and certifications. Helicopter operators are required to undergo licensing processes in every country in which they do business. In many countries, operators also need local partners or representatives to meet national aviation requirements.
Limited Aircraft Supply. Helicopters are generally classified as light (four to eight passengers), medium (nine to 15 passengers) and heavy (19 to 26 passengers). Medium and heavy helicopters are primarily used for crew change transportation services on oil and gas production and exploration rigs in the regions of the world where we operate because they can fly in a wide variety of operating conditions, over longer distances at faster speeds, and with larger payloads than light helicopters. Lead times for delivery of new heavy helicopters are long, currently about one year and have historically been as long as two years. We believe long lead times for heavy helicopter delivery and trends toward increasing deepwater oil and gas activity should create attractive market conditions for us since we operate the largest fleet of heavy helicopters in the world. These circumstances were enhanced by our commitments to purchase and incorporate an additional 22 Eurocopter EC225 and 10 Agusta Westland AW139 heavy helicopters into our operations over the next several years, with options to acquire additional aircraft.
Helicopter Values and Resale Market. The secondary market for helicopters has historically been larger than the annual new production market. Secondary market values are widely published with several independent firms providing valuations and performing annual appraisals. Unlike fixed wing aircraft, heavy and medium helicopters typically maintain
3
Table of Contents
their value, or depreciate modestly over the long-term. This is because the regulatory requirements to periodically replace, overhaul and upgrade major components, such as engines, gear boxes, transmissions and other rotable parts, preserve the aircraft in near-new condition throughout the repair and overhaul cycle. Resale values for certain types of aircraft with older technology have declined recently as a result of general economic conditions; however, we expect valuations to improve once the economy stabilizes. The resale market includes customers in many non-hydrocarbon industries, including SAR, EMS, construction, forestry, mining, police, military and recreation.
Technological Advancements. Technology improvements have allowed oil and gas companies to expand exploration and production into deeper waters. This translates into longer trips, more flying hours and the need for larger helicopters with the newest technology for improved range and passenger capacity. A large number of these deepwater installations are planned over the next five years and we expect the demand for new offshore helicopters to increase.
Competitive Strengths
| • | Global Footprint. We currently operate helicopter transportation services in approximately 30 countries. In addition, we have our own internal MRO operations, Heli-One, which services aircraft in most of the countries in which we maintain flying operations. Our broad geographic coverage enables us to respond quickly to customer needs and new business opportunities, while adhering to international safety standards, local market regulations and customs. Additionally, as multinational oil and gas companies seek helicopter operators that can provide one standard of service in many locations around the world, our geographic coverage allows us to effectively compete for many of these contracts. We have a record of obtaining the required licenses and permits to operate in new jurisdictions, including, where necessary, through local alliances. |
| • | Safety Record. In more than 60 years of operation, we believe we have developed sophisticated safety and training programs and practices and are proud of our safety record. We have implemented a single safety management system worldwide and continue to meet or exceed the stringent safety and performance audits conducted by our customers. We also host a highly regarded annual international safety summit, which is a manifestation of our single-minded commitment to safe operations. The summit is attended by our customers, manufacturers, competitors and regulators. |
| • | Strong Long-Term Relationships with Leading Companies and Organizations. We have multi-year relationships with major oil and gas companies and with SAR and EMS customers around the world, especially in Norway, Ireland, the United Kingdom and Australia, where many have been our customers continuously for more than two decades. We believe these long-term customer relationships are enabled, in large part, because of our focus on and accomplishments in safety and flight training, our crews’ experience, and service quality that consistently meets or exceeds customer standards. In addition to helicopter transportation, certain customers rely on us for ancillary services, including our computerized logistics systems that enhance crew scheduling and passenger handling services, which further strengthen relationships and often generate additional revenue. |
| • | Large, Modern and Diversified Fleet of Helicopters. We are a world-leading commercial operator of medium and heavy helicopters. Our large fleet allows us to meet the diverse operational requirements of our customers and minimize disruptions in service. To meet customer-specific requirements and ensure that we and our customers are not overly reliant on any one aircraft type or manufacturer, we most commonly operate Sikorsky S92A and Eurocopter EC225 heavy aircraft and Sikorsky S76 series and Agusta AW139 medium aircraft. Our fleet includes some of the most advanced civilian aircraft in the world. We have modernized our fleet significantly over the last five years and continue to invest in modernizing our fleet as evidenced through our continued commitment to purchase EC225s and AW139s. The total committed capital requirement as of April 30, 2012 is approximately $558.0 million for aircraft with delivery dates between fiscal 2013 and 2017. |
| • | Retention of Asset Value in Our Owned Fleet. A significant portion of a helicopter’s value resides in its major components, including engines, gearboxes, transmissions and rotable parts. Because these components are replaced or upgraded on a regular basis, older models of helicopters remain capable of meeting many of the same performance standards as newer aircraft. |
| • | In-House Repair and Overhaul Business. Our MRO segment, Heli-One diversifies our revenue streams, reduces our costs and positions us as a full-service, high-quality helicopter operator. We are a market leader in MRO and operate independent licensed commercial-engine and major-component MRO facilities for the Eurocopter Super Puma and Eurocopter EC225 helicopters. We also have the capability to support several other helicopter types including the Eurocopter Dauphin, Sikorsky S61N, Sikorsky S76 series, Sikorsky S92A, Agusta AW139, Bell 212 and Bell 412. This allows us to control the quality and cost of our helicopter maintenance, repair and refurbishment. |
Our Business Strategy
Our goal is to enhance our leadership position in and create superior value by consistently and efficiently providing safe, reliable value-added services to our customers while maximizing return on assets, earnings and cash flow. In our pursuit of this goal, we intend to focus on the following key initiatives:
| • | Strengthening Our Competitive Position in Existing Markets. We intend to improve our ability to win new contracts, renew existing contracts, strengthen our existing customer relationships and enhance our competitive position by increasing our focus on customer needs and reducing costs, while maintaining high standards for safety and reliability. We believe our global footprint, safety record and diversified fleet of large and medium helicopters ideally position us to serve increased demand from existing customers and new customers. |
4
Table of Contents
| • | Expanding Our Helicopter Transportation Operations. We intend to capitalize on our broad geographic coverage, long-term customer relationships and our fleet capabilities to fulfill new opportunities in developing oil and gas regions. Some of these geographic regions, including Brazil, Australia, Europe and Southeast Asia, where we currently have infrastructure and operations, are expected to be the fastest growing markets for offshore helicopter transportation services. We are exploring expansion into military transportation services. |
| • | Growing the MRO Business. We plan to expand our Heli-One revenue by further penetrating markets for overhaul of major components and engines and by pursuing new opportunities in heavy- and medium-aircraft maintenance, as well as military helicopter support. |
| • | Growth Through Acquisition. We may evaluate acquisition opportunities for both our flying and MRO businesses to further strengthen our position in existing markets and establish ourselves in new ones. |
| • | Focusing on Long-Term Contracts. We are prioritizing long-term contracts with our major customers to maximize the stability of our revenue. |
Revenue by End Market
| (in thousands of U.S. dollars) | For the year ended April 30, | |||||||||||||||||||||||
| 2012 | 2011 | 2010 | ||||||||||||||||||||||
| Industry Sector |
||||||||||||||||||||||||
| Oil and Gas |
$ | 1,330,163 | 79 | % | $ | 1,129,749 | 78 | % | $ | 1,042,980 | 79 | % | ||||||||||||
| Repair and Overhaul |
166,479 | 10 | % | 129,222 | 9 | % | 112,470 | 9 | % | |||||||||||||||
| EMS/SAR |
158,505 | 9 | % | 151,101 | 10 | % | 138,012 | 11 | % | |||||||||||||||
| Other |
37,392 | 2 | % | 35,388 | 3 | % | 20,104 | 1 | % | |||||||||||||||
|
|
|
|
|
|
|
|
|
|
|
|
|
|||||||||||||
| Total |
$ | 1,692,539 | 100 | % | $ | 1,445,460 | 100 | % | $ | 1,313,566 | 100 | % | ||||||||||||
|
|
|
|
|
|
|
|
|
|
|
|
|
|||||||||||||
Revenue by Geography
| (in thousands of U.S. dollars) |
For the year ended April 30, | |||||||||||||||||||||||
| 2012 | 2011 | 2010 | ||||||||||||||||||||||
| Canada |
$ | 13,914 | 1 | % | $ | 12,671 | 1 | % | $ | 16,386 | 1 | % | ||||||||||||
| United Kingdom |
262,592 | 16 | % | 243,921 | 17 | % | 251,627 | 19 | % | |||||||||||||||
| Norway |
531,452 | 31 | % | 452,578 | 31 | % | 405,258 | 31 | % | |||||||||||||||
| Africa |
60,503 | 4 | % | 56,361 | 4 | % | 54,776 | 4 | % | |||||||||||||||
| Australia |
213,970 | 13 | % | 137,639 | 10 | % | 126,992 | 10 | % | |||||||||||||||
| Denmark |
29,538 | 2 | % | 29,108 | 2 | % | 29,535 | 2 | % | |||||||||||||||
| The Netherlands |
94,663 | 6 | % | 95,835 | 7 | % | 119,234 | 9 | % | |||||||||||||||
| Brazil |
210,347 | 12 | % | 163,928 | 11 | % | 105,856 | 8 | % | |||||||||||||||
| Asia |
93,782 | 6 | % | 107,305 | 7 | % | 93,671 | 7 | % | |||||||||||||||
| Other European Countries |
139,955 | 8 | % | 112,188 | 8 | % | 49,539 | 4 | % | |||||||||||||||
| Other Countries |
41,823 | 1 | % | 33,926 | 2 | % | 60,692 | 5 | % | |||||||||||||||
|
|
|
|
|
|
|
|
|
|
|
|
|
|||||||||||||
| Consolidated total |
$ | 1,692,539 | 100 | % | $ | 1,445,460 | 100 | % | $ | 1,313,566 | 100 | % | ||||||||||||
|
|
|
|
|
|
|
|
|
|
|
|
|
|||||||||||||
5
Table of Contents
THE BUSINESS
Helicopter Flying Operations
Medium and heavy helicopters are generally used to support the oil and gas sector, as well as SAR and EMS. Where appropriate, specialized equipment is installed to support SAR and EMS services.
Contracts with oil and gas customers are typically two to eight years in duration, with an average of four years. Such contracts are ordinarily awarded following competitive bidding processes among pre-qualified operators.
A substantial number of our long-term contracts, defined as three years or longer, contain provisions permitting early termination by the customer without penalty. At the expiration of a contract, customers typically solicit new bids for the next contract period. Contracts are usually awarded based on a number of factors, including price, long-term relationships, safety record of the helicopter service provider and quality of customer service. An incumbent operator commonly has a competitive advantage because of its relationship with the customer, knowledge of site characteristics, investment in infrastructure and demonstrated ability to meet service-level requirements and provide the necessary aircraft and services. Also, customers often want to avoid start-up costs associated with switching to another operator.
Our contracts generally require that fuel be provided by the customer or be charged directly to the customer based on actual fuel costs. As a result, we have no significant exposure to changes in fuel prices. For the year ended April 30, 2012, substantially all of our fuel costs were passed through to our clients.
Flying Operations Competition
CHC is one of two global helicopter service providers to the offshore oil and gas industry; other competitors are smaller, regional operators. The Company has a significant market position in all global offshore oil and gas markets, with the exception of the Gulf of Mexico. Oil and gas companies operating in the Gulf of Mexico utilize primarily light and medium helicopters under short term contracts and, as a result, the economics of providing services in the Gulf of Mexico would be less profitable for CHC than those in other regions of the world.
The Company is well positioned to capitalize on future growth opportunities. As oil and gas wells are depleted, oil companies are developing deep water reserves further offshore. The Company’s global presence, long-term customer relationships and modern fleet of aircraft position it to participate in new oil and gas developments in most offshore oil and gas regions.
Repair and Overhaul
All aircraft airframes, engines and components are required by manufacturer and government regulations to be serviced and overhauled based on flight hours, cycles or the actual condition of parts. The repair and overhaul process includes disassembling, cleaning, inspecting, repairing and reassembling engines, components and accessories, and testing complete engines and components. Operators typically consider the complexity and cost of tasks when choosing whether to perform them in-house or outsource the work to a third-party. MRO companies such as Heli-One are required to obtain licenses from government regulatory bodies and, in many cases, from aircraft manufacturers. Companies active in this industry include manufacturers of helicopters, components and accessories; manufacturer-authorized repair and overhaul operators; and small workshops typically not authorized by the manufacturers. The low cost of transporting components relative to the total cost of repair and overhaul services has resulted in development of a worldwide MRO market.
Our MRO segment, Heli-One, specializes in heavy structural repair, maintenance, overhaul and testing of helicopters and helicopter components in North America and Norway. Our comprehensive capabilities span aircraft including Sikorsky S61N, S76 series and S92A; Bell 212 and 412; Agusta AW139, 119 and 109; Eurocopter Super Puma, AS332, EC225, AS350, AS355, AS365 and BK117. Our engine expertise spans models including Pratt & Whitney PT6; Turbomeca Arriel 1 and 2; Makila; Artouste; Turmo; and GE CT58 and T58.
6
Table of Contents
Heli-One’s main MRO competitors are helicopter manufacturers, which are also our main parts suppliers. Factors that affect competition within the repair and overhaul market include price, quality, safety record and customer service. To minimize issues related to availability and pricing of the parts we need to perform MRO work, Heli-One generally has long-term supply arrangements with the helicopter manufactures and works closely with them on items such as modifications and approvals of parts and components. In addition, we have certain negotiation leverage with the manufacturers on parts, since we are one of the major customers of these manufacturers for new aircraft.
We also provide customers with integrated logistics support, including 24-hour service for all scheduled and unscheduled MRO for engines, dynamic components, repairable components and consumable parts. We also support special mission equipment. Heli-One offers next-day delivery in most locations on a wide range of helicopter parts from all major manufacturers through a global distribution network that includes a global warehouse in the Netherlands. We believe our global buying power gives us competitive pricing on all major components. We believe we provide quality, competitively priced support services to civilian and military helicopter operators worldwide. In addition, we have extensive expertise in all areas of engineering and design for conversion upgrades and refurbishments, including avionics.
Seasonality
Our operations are not subject to seasonality.
PROPERTY AND EQUIPMENT
As of April 30, 2012, the Company’s fleet was comprised of the following aircraft:
| Aircraft Type |
Total | Owned | Leased | |||||||||
| Medium |
||||||||||||
| Sikorsky S76C+ |
22 | 11 | 11 | |||||||||
| Sikorsky S76C++ |
23 | 3 | 20 | |||||||||
| Sikorsky S76A/B/C |
29 | 26 | 3 | |||||||||
| Eurocopter EC135/145/155 |
6 | 1 | 5 | |||||||||
| Eurocopter AS365 Series |
14 | 6 | 8 | |||||||||
| Bell 412 |
13 | 7 | 6 | |||||||||
| Bell 212/214 |
1 | 1 | — | |||||||||
| Agusta AW139 |
29 | 3 | 26 | |||||||||
|
|
|
|
|
|
|
|||||||
| 137 | 58 | 79 | ||||||||||
| Heavy |
||||||||||||
| Eurocopter Super Puma series (i) |
45 | 18 | 27 | |||||||||
| Eurocopter EC225 |
29 | 2 | 27 | |||||||||
| Sikorsky S92A (i) |
33 | 2 | 31 | |||||||||
| Sikorsky S61N |
6 | 6 | — | |||||||||
|
|
|
|
|
|
|
|||||||
| 113 | 28 | 85 | ||||||||||
| Total Helicopters |
250 | 86 | 164 | |||||||||
| Fixed Wing |
2 | 2 | — | |||||||||
|
|
|
|
|
|
|
|||||||
| Total Aircraft |
252 | 88 | 164 | |||||||||
|
|
|
|
|
|
|
|||||||
| (i) | Below is a summary of aircraft under capital lease, which are classified above as owned aircraft: |
| Eurocopter Super Puma Series |
1 | |||
| Sikorsky S92A |
1 |
7
Table of Contents
Lease Obligations
We had entered into aircraft operating leases for 164 aircraft included in our fleet as of April 30, 2012. At April 30, 2012, the total minimum lease payments under aircraft operating leases with expiry dates ranging from fiscal 2013 to fiscal 2022 totaled $1,186.5 million. At our option, we have the right to purchase the majority of aircraft at agreed amounts that are not considered bargain purchase options. Substantially all of the costs to perform inspections, major repairs and overhauls of major components on such leased aircraft are at our expense. We may perform this work through Heli-One or have the work performed by an external MRO service provider. We have also provided guarantees to certain lessors in connection with these aircraft leases. See “Future Cash Requirements—Contractual Obligations and Off-Balance Sheet Arrangements.”
In addition to payment under aircraft operating leases, we had operating lease commitments as of April 30, 2012 for buildings, land and other equipment with minimum lease payments of $90.9 million and expiry dates ranging from fiscal 2013 to fiscal 2099.
For additional details see “Future Cash Requirements—Contractual Obligations and Off-Balance Sheet Arrangements” and see Notes 25, 26 and 28 to the audited annual consolidated financial statements for the year ended April 30, 2012 included elsewhere in this Annual Report on Form 10-K.
Commitments to Acquire New Aircraft
As of April 30, 2012, we had ordered and advanced deposits to purchase 23 aircraft, with expected delivery dates from fiscal 2013 to fiscal 2017. We have committed total capital of approximately $558.0 million for these new aircraft, which will be purchased outright or financed through additional leases on the delivery date. We expect that most of these aircraft will be used internally to support continued growth.
On June 12, 2012, we committed to acquire 10 AW139 helicopters from AgustaWestland to be delivered between October 2012 and September 2014, with options to acquire an additional 16 AW139 helicopters. On June 13, 2012, we exercised our option to acquire two additional EC225s from Eurocopter in addition to the twenty helicopters we committed to acquire in fiscal 2012.
Safety and Insurance
Operation of helicopters involves some degree of risk. Hazards, such as aircraft accidents, collisions and fire, are inherent in providing helicopter services. We maintain a flight safety organization that is responsible for ensuring compliance with safety standards within our organization and the requisite proficiency among flight crews. Our safety organization is responsible for training flight crews, conducting regular safety audits and seminars for all flight personnel, and generally ensuring safe operating techniques and standards consistent with government regulations and customer requirements. In addition, aviation regulatory bodies and customers conduct safety audits to ensure that our standards meet their requirements.
We maintain comprehensive aviation hull and liability insurance coverage in amounts and on terms that reflect prudent helicopter operations. This includes engine and spare-parts coverage. The hull policies insure against the physical loss of or damage to our helicopters. In addition we purchase hull war coverage for losses due to terrorism, hijacking, war, expropriation, confiscation and nationalization. We self retain the risk of the loss of use or loss of profit from our operations, which is mitigated by the possible use of other aircraft given our fleet size.
In addition, we procure property all risks insurance, automobile liability and general liability insurance and the customary corporate insurances.
Facilities
We currently operate in approximately 30 countries worldwide, using facilities that include hangars, supply and service centers, engineering support facilities and offices. In Norway, the United Kingdom, the Netherlands and Australia, we generally own the hangars we use in our helicopter operations, which are located primarily on leased airport land. We typically lease supply and service centers, engineering support facilities and offices from third parties.
The principal properties from which we now conduct our operations are:
| Location |
Operations |
Buildings (Sq. Feet) |
Owned or Leased | |||||||||||
| Land | Buildings | |||||||||||||
| Richmond, British Columbia, Canada |
Corporate Headquarters | 80,000 | Leased | Owned | ||||||||||
| Delta, British Columbia, Canada |
Headquarters for MRO Segment | 240,000 | Leased | Leased | ||||||||||
| Aberdeen, Scotland |
CHC Scotia Limited; Helicopter Services | 42,000 | Leased | Leased | ||||||||||
| CHC Scotia Limited; Terminal Building | 25,000 | Leased | Owned | |||||||||||
| Stavanger, Norway |
CHC Norway AS; Helicopter Services | 199,000 | Leased | Owned | ||||||||||
| Heli-One Norway AS Headquarters; MRO Segment | 179,000 | Leased | Owned | |||||||||||
| Fort Collins, Colorado |
Heli-One American Support, LLC | 80,000 | Leased | Leased | ||||||||||
| Hoofddorp, The Netherlands |
CHC Netherlands BV; Heli-One (Netherlands) BV | 39,000 | Leased | Leased | ||||||||||
| Bergen, Norway |
CHC Norway AS | 66,000 | Leased | Owned | ||||||||||
| Den Helder, The Netherlands |
CHC Helicopter Netherlands BV; Helicopter Services | 56,000 | Owned | Owned | ||||||||||
| Perth, Australia |
CHC Australia Headquarters | 7,400 | Leased | Leased | ||||||||||
| Fort Worth, Texas |
CHC Operations Centre | 26,926 | Leased | Leased | ||||||||||
8
Table of Contents
AVIATION REGULATIONS
Most of the countries in which we conduct flying operations have laws that require us to hold either or both of an operating license and an air operator certificate. Most of these countries also have materiality requirements for issuance of operating licenses and/or air operator certificates that require the holder of such license or certificate to be a qualified national of such country. Companies holding such licenses and certificates must typically be both majority owned and effectively controlled, or controlled in fact, by citizens of the issuing state.
The European Union and the European Economic Area
We operate in the EU and the EEA through our 49.9% ownership in EEA Helicopter Operations B.V. (“EHOB”). EHOB’s five wholly-owned operating subsidiaries operate in four member states of the EU (the UK, the Netherlands, Denmark and Ireland) and Norway, a member state of the EEA. Each of Norway and the member states of the EU must comply with EU Directive 1008/2008 and common rules for the operation of aircraft. Among other things, this directive restricts the issuance of operating licenses to carry passengers for remuneration to those companies that are majority owned and effectively controlled by nationals of a member state of the EU or the EEA. We believe that EHOB, and therefore each of EHOB’s wholly-owned subsidiaries, are both majority owned and effectively controlled by nationals of a member state of the EU.
Canada
Our helicopter operations in Canada are conducted through CHC Helicopters Canada Inc., a company wherein we hold a minority interest. That company’s flying operations are regulated by Transport Canada and are conducted under that company’s air operator’s certificate (AOC). Our ability to conduct our helicopter operating business in Canada is dependent on our ability to maintain our relationship with CHC Helicopters Canada Inc. Our helicopter operations in certain other countries are conducted pursuant to an AOC issued by the Minister of Transport (Canada) under the provisions of the Aeronautics Act (Canada) for which our wholly owned subsidiary holds an exemption until 2015. If we are unable to extend the ministerial exemption pursuant to which this certificate is issued, we will need to obtain licenses and certificates issued by the countries in which we conduct such operations or reach an agreement with CHC Helicopters Canada Inc. and/or customers in such countries to transfer the operations there to CHC Helicopters Canada Inc. We cannot guarantee that we will be able to either extend the ministerial exemption, obtain local licenses and certificates or transfer such operations to CHC Helicopters Canada Inc., either at all or on acceptable terms.
Australia
Civil aviation in Australia is governed by the Civil Aviation Act, 1988, and regulations made thereunder. To operate an aircraft in Australia, it must be registered with the Australian Civil Aviation Safety Authority and a Certificate of Airworthiness must be obtained, be valid and in effect. The operation of an aircraft for a commercial purpose into, out of, or within Australian territory can only be undertaken as authorized by an Air Operators’ Certificate. Our ability to offer our helicopter transportation services in Australia is dependent on maintaining this certificate. Australia does not have a requirement for ownership or control by Australian nationals.
Other Countries
Our operations in other foreign jurisdictions are regulated to various degrees by the governments of such jurisdictions and must be conducted in compliance with those regulations and, where applicable, in accordance with our air service licenses and air operator certificates. These regulations may require us to obtain a license to operate in that country, may favor local companies or require operating permits that can only be obtained by locally registered companies and may impose other nationality requirements. In such cases, we partner with local persons, but there is no assurance regarding which foreign governmental regulations may be applicable in the future to our helicopter operations and whether we would be able to comply with them.
9
Table of Contents
The revocation of any of the licenses discussed above or the termination of any of the relationships with local parties discussed above could have a material adverse effect on our business, financial condition and results of operations.
ENVIRONMENTAL MATTERS
We are subject to extensive laws, rules, regulations and ordinances in the various jurisdictions in which we operate relating to pollution and protection of the environment and to human health and safety, including those related to noise, emissions to the air, releases or discharges to soil or water, the use, storage and disposal of petroleum and other regulated materials, and the remediation of contaminated sites. Our operations, including aircraft maintenance and aircraft fueling, involve the use, handling, storage and disposal of materials that may be classified as hazardous to human health and safety and to the environment. Non-compliance with these regulations may result in significant fines or penalties or limitations on our operations. Many of the countries in which we operate have laws that may impose liability for the investigation and cleanup of releases of regulated materials and the remediation of related environmental damage without regard to negligence or fault. These laws may also expose us to liability for the conduct of, or conditions caused by, others, such as historic spills of regulated materials at our facilities, for acts that were in compliance with all applicable environmental laws at the time such acts were performed, and for contamination at third-party sites where substances were sent for off-site treatment or disposal. Additionally, any failure by us to comply with applicable environmental, health and safety or planning laws and regulations may result in governmental authorities or other third parties taking action against our business that could adversely impact our operations and financial condition. We believe we are in substantial compliance with applicable environmental laws and that ensuring compliance has not, to date, had a material adverse effect upon our financial position. We cannot, however, predict the likelihood of change to these laws or in their enforcement nor the impact that any such change, or any discovery of previously unknown conditions, may have on our costs and financial position. Please see Item 1A Risk Factors – “We are subject to extensive environmental, health and safety laws, rules and regulations, which may have an adverse impact on our business” below.
EMPLOYEES
As of April 30, 2012, we had approximately 4,350 full-time employees. We hire independent contractors on an as needed basis. We believe that our employee relationships are satisfactory.
Certain of our employees in the UK, Ireland, the Netherlands, Norway, Brazil, Canada and Australia (collectively, approximately 65% of our employees) are represented under collective bargaining or union agreements. Any disputes over the terms of these agreements or our potential inability to negotiate acceptable contracts with the unions that represent our employees could result in strikes, work stoppages or other slowdowns by the affected workers. Periodically, certain groups of our employees who are not covered under a collective bargaining agreement consider entering into such an agreement.
If our unionized workers engage in a strike, work stoppage or other slowdown, other employees elect to become unionized, existing labor agreements are renegotiated, or future labor agreements contain terms that are unfavorable to us, we could experience a disruption of our operations or higher ongoing labor costs, which could adversely affect our business, financial condition and results of operations.
AVAILABLE INFORMATION
We are required to file annual, quarterly and current reports and other information with the SEC. You may read and copy any documents filed by us with the SEC at the SEC’s Public Reference Room at 100 F. Street, N.E., Washington, D.C. 20549. You may obtain information on the operation of the Public Reference Room by calling the SEC at 1-800-SEC-0330. Our filings with the SEC are also available to the public from commercial document retrieval services and at the SEC’s website at http://www.sec.gov.
We also make available on our website at www.chc.ca all of the documents that we file with the SEC, free of charge, as soon as reasonably practicable after we electronically file such material with the SEC. Information contained on our website is not incorporated by reference into this Form 10-K.
| Item 1A. | Risk factors |
The risks described below could have a material adverse impact on our financial position, results of operations, liquidity and cash flows. Although it is not possible to predict or identify all such risks and uncertainties, they may include, but are not limited to, the factors discussed below. Our business operations could also be affected by additional factors that are not presently known to us or that we currently consider not to be material to our operations. You should not consider this list to be a complete statement of all risks and uncertainties.
10
Table of Contents
Our indebtedness and lease obligations could adversely affect our business and liquidity position.
We have a substantial amount of financial debt and lease obligations. If we fail to meet our payment or covenant obligations or otherwise default under the agreements governing indebtedness or lease obligations, the lenders under those agreements will have the right to accelerate the indebtedness or terminate the leases and exercise other rights and remedies against us. These rights and remedies include the rights to repossess and foreclose upon the assets that serve as collateral, initiate judicial foreclosure against us, petition a court to appoint a receiver for us, and initiate involuntary bankruptcy proceedings against us. If lenders or lessors exercise their rights and remedies, our assets may not be sufficient to repay outstanding indebtedness and lease obligations, and we may not have sufficient liquidity after payment of indebtedness and lease obligations to continue our business operations. In some instances, the Company may enter into discussions with the lessor for a covenant reset, amendment or waiver if we anticipate to fail or fail to meet our covenant obligations.
Subsequent to April 30, 2012, a lessor that had been engaged in discussions with the Company approved a financial covenant reset to October 31, 2013. As part of previous negotiations in 2011 with this lessor, the Company also made a commitment to further reduce its total lease portfolio by $64.4 million.
Failure to comply with covenants contained in certain of our lease agreements could limit our ability to maintain our leased helicopter fleet and adversely affect our business.
The terms of certain of our helicopter lease agreements contain covenants that impose operating and financial limitations on us. Such lease agreements limit, among other things, our ability to utilize aircraft in certain jurisdictions and/or sublease the aircraft, and may contain restrictions upon a change of control. A breach of lease covenants could result in an obligation to repay amounts outstanding under the lease. If such an event occurs, we may not be able to pay all amounts due under the leases or refinance such leases on terms satisfactory to us or at all, which could have a material adverse effect on our business, financial condition and results of operations.
Our business requires substantial capital expenditures, lease and working capital financing. Continued deterioration of economic conditions and the current global financial and credit crisis could adversely impact our business and financial condition and we may be unable to obtain needed capital or financing on satisfactory terms or at all. In addition, financial market instability could leave our creditors unable to meet their obligations to us.
Our business requires significant capital expenditure including significant ongoing investment to purchase or lease new aircraft, refinance existing leases and maintain our existing fleet. To the extent that we do not generate sufficient cash from our operations, we will need to raise additional funds through operating lease financing or other debt financing to execute our growth strategy and make the capital expenditures required to successfully operate our business.
Continued concerns about the systemic impact of a potential long-term and wide-spread recession, increased energy costs, the availability and cost of credit, diminished business and consumer confidence and increased unemployment have contributed to increased market volatility and diminished expectations for western and emerging economies, including the jurisdictions in which we operate. In particular, the cost of raising money in the credit markets has increased substantially as many lenders and institutional investors, concerned about the stability of the financial markets generally and about the solvency of counterparties, have increased interest rates, enacted tighter lending standards and reduced and, in some cases, ceased to provide funding, to borrowers.
Such factors may restrict our ability to access capital and bank markets or avail of lease or other financings at a time when we would like to, or need to, which could have an impact on our growth plans or on our flexibility to react to changing economic and business conditions. In addition, our credit facilities and helicopter leases have maintenance covenants which may need to be renegotiated from time to time, and the financial market instability could have an impact on the lenders or lessors willingness to renegotiate these covenants on reasonable terms or at all.
Many of the markets in which we operate are highly competitive, which may result in a loss of market share or a decrease in revenue or profit margins.
Many of the markets in which we operate are highly competitive, which may result in a loss of market share or a decrease in revenue or profit margins. Contracting for helicopter services is usually done through a competitive bidding process among those having the necessary equipment and resources. Factors that affect competition in our industry include price, reliability, safety, professional reputation, availability, equipment and quality of service. We compete against a number of helicopter operators, including the other major global commercial helicopter operator, and other local and regional operators. There can be no assurance that our competitors will not be successful in capturing a share of our present or potential customer base. In addition, many oil and gas companies and government agencies to which we provide services have the financial ability to perform their own helicopter flying operations in-house should they elect to do so.
11
Table of Contents
Our main competitors within the repair and overhaul business are the OEMs of helicopters and helicopter components. As such, our main competitors in this industry are also our main parts suppliers and MRO license providers. A conflict with the OEMs could result in our inability to obtain parts and licenses in a timely manner in required quantities and at competitive prices.
We rely on a limited number of large offshore helicopter support contracts for a limited number of customers. If any of these are terminated early or not renewed, our revenues could decline.
We rely on a limited number of large offshore helicopter support contracts. For the fiscal year ended April 30, 2012, revenue from Statoil ASA totaling $262.7 million and Petrobas totaling $187.8 million was greater than 10% of the Company’s total revenues. Many of our contracts contain clauses that allow for early termination by the customer for convenience, which could have a material adverse effect on our business, financial condition and results of operation.
Failure to maintain standards of acceptable safety performance may have an adverse impact on our ability to attract and retain customers and could adversely impact our reputation, operations and financial performance.
Our customers consider safety and reliability as the two primary attributes when selecting a provider of helicopter transportation services. If we fail to maintain standards of safety and reliability that are satisfactory to our customers, our ability to retain current customers and attract new customers may be adversely affected. Moreover, helicopter crashes or similar disasters of another helicopter operator could impact customer confidence and lead to a reduction in customer contracts, particularly if such helicopter crash or disaster were due to a safety fault in a type of helicopter used in our fleet. In addition, the loss of aircraft as a result of accidents could cause significant adverse publicity and the interruption of air services to our customers, which could adversely impact our reputation, operations and financial results. Our aircraft have been involved in accidents in the past, some of which have included loss of life and property damage. We may experience similar accidents in the future.
Our operations are subject to extensive regulations which may increase our costs and adversely affect us.
The helicopter industry is regulated by various laws and regulations in the jurisdictions in which we operate. The scope of such regulation includes infrastructure and operational issues relating to helicopters, maintenance, spare parts and route flying rights as well as safety and security requirements. We cannot fully anticipate all future changes that might be made to laws and regulations to which we are subject and the possible impact of all such changes.
Our ability to conduct our business is dependent on our ability to maintain authorizations, licenses and certificates, which in many jurisdictions require us to subcontract with third parties to obtain required aircraft operating leases. We are routinely audited to ensure compliance with all flight operation and aircraft maintenance requirements. There can be no assurance that we will pass all audits. Our failure to pass such audits or any breach of regulations applicable to us could result in fines, adverse publicity or grounding of our aircraft, all of which could have a material adverse effect on our business, results of operations and financial condition, especially if a regulatory breach led to a helicopter crash or accident. Changes in laws or regulations could have a material adverse impact on our cost of operations or revenues from operations.
If we are unable to maintain required government-issued licenses for our operations, we will be unable to conduct helicopter operations in the applicable jurisdiction, as outlined below.
Europe
Approximately 25% of our revenue for the fiscal year ended April 30, 2012 originated from helicopter flying services provided by subsidiaries of EEA Helicopter Operations B.V. (“EHOB”), a Dutch Company 49.9% owned by us. These subsidiaries operate in the UK, Denmark, the Netherlands and Ireland (member states of the European Union (“EU”)), and Norway (member state of the European Economic Area (“EEA”)). To operate helicopters in the EU and EEA, an operator must be licensed by the applicable national Civil Aviation Authority. Under applicable European law, an operator must be “effectively controlled” and “majority owned” by nationals of member states of the EU or the EEA to maintain its license. We believe that the majority shareholder in EHOB is an EU national and therefore these subsidiaries are currently “majority owned” and “effectively controlled” within the meaning of European Union and European Economic Area licensing requirements. Any change in the national status of the majority shareholder could affect the licenses of these subsidiaries.
Canada
Our helicopter operations in Canada are conducted through CHC Helicopters Canada Inc., a company wherein we hold a minority interest. That company’s flying operations are regulated by Transport Canada and are conducted under that company’s air operator’s certificate (AOC). Our ability to conduct our helicopter operating business in Canada is dependent on our ability to maintain our relationship with CHC Helicopters Canada Inc. Our helicopter operations in certain other countries are conducted pursuant to an AOC issued by the Minister of Transport (Canada) under the provisions of the Aeronautics Act (Canada) for which our wholly owned subsidiary holds an exemption until 2015. If we are unable to extend the ministerial exemption pursuant to which this certificate is issued, we will need to obtain licenses and certificates issued by the countries in which we conduct such operations or reach an agreement with CHC Helicopters Canada Inc. and/or customers in such countries to transfer the operations there to CHC Helicopters Canada Inc. We cannot guarantee that we will be able to either extend the ministerial exemption, obtain local licenses and certificates or transfer such operations to CHC Helicopters Canada Inc., either at all or on acceptable terms.
12
Table of Contents
Australia
Civil aviation in Australia is governed by the Civil Aviation Act, 1988, and regulations made thereunder. To operate an aircraft in Australia, it must be registered with the Australian Civil Aviation Safety Authority and a Certificate of Airworthiness must be obtained, be valid and in effect. The operation of an aircraft for a commercial purpose into, out of, or within Australian territory can only be undertaken as authorized by an Air Operators’ Certificate. Our ability to offer our helicopter transportation services in Australia is dependent on maintaining this certificate.
Other Countries
Our operations in other foreign jurisdictions are regulated to various degrees by the governments of such jurisdictions and must be conducted in compliance with those regulations and, where applicable, in accordance with our air service licenses and air operator certificates. These regulations may require us to obtain a license to operate in that country, may favor local companies or require operating permits that can only be obtained by locally registered companies and may impose other nationality requirements. In such cases, we partner with local persons, but there is no assurance regarding which foreign governmental regulations may be applicable in the future to our helicopter operations and whether we would be able to comply with them.
The revocation of any of the licenses discussed above or the termination of any of the relationships with local parties discussed above could have a material adverse effect on our business, financial condition and results of operations.
Our operations may suffer due to political and economic uncertainty.
Risks associated with some of our operations include political, social and economic instability, war and civil disturbances or other events that may limit or disrupt markets, expropriation without fair compensation, requirements to award contracts, concessions or licenses to nationals, international exchange restrictions and currency fluctuations, changing political conditions and monetary policies of foreign governments. Any of these events could materially adversely affect our ability to provide services to our international customers. Certain of our helicopter leases and loan agreements impose limitations on our ability, including requiring the prior approval of the lessor or the lender, to locate particular helicopters in certain countries. We cannot provide assurance that these limitations will not affect our ability to allocate resources in the future.
We derive significant revenue from non-wholly owned entities, which, if we develop problems with our non-wholly entities, could adversely affect our financial condition and results of operations.
Aviation regulatory requirements often require us to operate through non-wholly owned entities with local shareholders. We depend to some extent upon good relations with our local shareholders to ensure profitable operations. In the event shareholder disputes arise, these could negatively impact our revenues and profit sharing from these entities.
We are exposed to credit risks.
We are exposed to credit risk on our financial investments due to the ability of our counterparties to fulfill their obligations to us. We manage credit risk by entering into arrangements with established counterparties and through the establishment of credit policies and limits, which are applied in the selection of counterparties.
Credit risk on financial instruments arises from the potential for counterparties to default on their contractual obligations and is limited to those contracts where we would incur a loss in replacing the instrument. We limit our credit risk by dealing only with counterparties that possess investment grade credit ratings and monitor our concentration risk with counterparties on an ongoing basis. The carrying amount of financial assets represents the maximum credit exposure for financial assets.
Credit risk arises on our trade receivables from the unexpected loss in cash and earnings when a customer cannot meet its obligation to us or the value of security provided declines. To mitigate trade credit risk, we have developed credit policies that include the review, approval and monitoring of new customers, annual credit evaluations and credit limits. We do not believe that we are subject to significant concentrations of credit risk as trade receivables consists primarily of amounts due from multinational companies operating in the oil and gas industry and are geographically diverse. There can be no assurances that our risk mitigation strategies will be effective and that credit risk will not adversely affect our results of operations and financial position.
Assimilating any future material acquisitions into our corporate structure may strain our resources and have an adverse impact on our business.
The assimilation of any future material acquisitions we may make will require substantial time, effort, attention and dedication of management resources and may distract management from ordinary operations. The transition process could create a number of potential challenges and adverse consequences, including the possible unexpected loss of key employees, customers or suppliers, a possible loss of revenues or an increase in operating or other costs. Inefficiencies and difficulties may arise because of unfamiliarity with new assets and the business associated with them, new geographic areas and new
13
Table of Contents
regulatory systems. These types of challenges and uncertainties could have a material adverse effect on the business, financial condition and results of operations. We may not be able to effectively manage the combined operations and assets or realize any of the anticipated benefits of future material acquisitions.
Our fixed operating expenses and long-term contracts with customers could adversely affect our business under certain circumstances.
Our profitability is directly related to demand for our helicopter services. Because of the significant expenses related to aircraft financing, crew wage and benefits, lease costs, insurance and maintenance programs, a substantial portion of our operating expenses are fixed and must be paid even when certain aircraft are not actively servicing customers and thereby generating income. A decrease in our revenues could therefore result in a disproportionate decrease in our earnings, as a substantial portion of our operating expenses would remain unchanged.
Our long-term customer contracts contain pre-determined price escalation terms and conditions. Although supplier costs and other cost increases are passed through to our customers through rate increases, where possible, these escalations may not be sufficient to enable us to fully recoup increased costs. In addition, because many of our contracts are long-term in nature, cost increases may not be adjusted in our contract rates until the contracts are up for renewal. There can be no assurance that we will be able to accurately estimate costs or recover increased costs by passing these costs on to our customers. In the event that we are unable to do so, the profitability of our customer contracts and our business, financial condition and results of operations could be materially and adversely affected.
Operation of helicopters involves a degree of inherent risk and we are exposed to the risk of losses from safety incidents.
Hazards, such as aircraft accidents, adverse weather conditions, collisions and fire are inherent in furnishing helicopter services and can cause personal injury and loss of life, severe damage to and destruction of property and equipment and suspension of operations. We attempt to protect ourselves against potential losses through our safety management system and insurance coverage. However, our insurance coverage is subject to deductibles and maximum coverage amounts, and we do not carry insurance against all types of losses. We cannot ensure that our existing insurance coverage will be sufficient to protect against all losses, that we will be able to maintain our existing insurance coverage in the future or that the premiums will not increase substantially. Our safety management system may not be effective. In addition, terrorist activity, risk of war, accidents or other events could increase our insurance premiums. Our inability to renew our aviation insurance coverage or the loss, expropriation or confiscation of, or severe damage to, a large number of our helicopters could adversely affect our operations and possibly our financial condition. Furthermore, we are not insured for loss of profit or loss of use of our helicopters. The loss of, or limited availability of, our liability insurance coverage, inadequate coverage from our liability insurance or substantial increases in future premiums could have a material adverse effect on our business, financial condition and results of operation.
Our operations are largely dependent upon the level of activity in the oil and gas industry.
To varying degrees these activity levels are affected by long-term trends in oil and gas prices. Historically, the prices for oil and gas have been volatile and subject to wide fluctuations in response to changes in the supply of and demand for oil and gas, market uncertainty and a variety of additional factors beyond our control. We cannot predict future oil and gas price movements. Any prolonged reduction in oil and gas prices could depress the level of helicopter activity in support of exploration and, to a lesser extent, production activity and, therefore have a material adverse effect on our business, financial condition and results of operations. For the fiscal year ended April 30, 2012, revenue generated by helicopter transportation services for the oil and gas industry was approximately 79% of our total revenues.
We are highly dependent upon the level of activity in the North Sea, which is a mature exploration and production region.
For the fiscal year ended April 30, 2012, approximately 45% of our gross revenue was derived from helicopter services provided to customers operating in the North Sea. The North Sea is a mature exploration and production region that has undergone substantial seismic survey and exploration activity for many years. Because a large number of oil and gas properties in this region have already been drilled, additional prospects of sufficient size and quality could be more difficult to identify. Generally, the production from these drilled oil and gas properties is declining. In the future, production may decline to the point that such properties are no longer economical to operate, in which case, our services with respect to such properties will no longer be needed. Oil and gas companies may not identify sufficient additional drilling sites to replace those that become depleted. If activity in oil and gas exploration, development and production in the North Sea materially declines, our business, financial condition and results of operations could be materially and adversely affected. We cannot predict the levels of activity in this or any other geographic area.
If oil and gas companies undertake cost reduction methods, there may be an adverse effect on our business.
Companies in the oil and gas production and exploration sector continually seek to implement measures aimed at reducing costs, including helicopter support operations. For example, oil and gas companies in some circumstances have reduced manning levels on both old and new installations by using new technology to permit unmanned installations and may
14
Table of Contents
increase the lengths of offshore shifts which will reduce the frequency of transportation of employees. The implementation of such measures could reduce the demand for helicopter transportation services and have a material adverse effect on our business, financial condition and results of operations.
If we are unable to acquire the necessary aircraft, we may not be able to take advantage of growth opportunities.
If we are unable to acquire the necessary aircraft, we may not be able to take advantage of growth opportunities. Helicopter manufacturers have limited availability of aircraft, particularly heavy helicopters, and we have limited alternative sources of new aircraft. Currently, lead times of up to one year are necessary to obtain heavy helicopters. We contract with a small number of manufacturers for most of our aircraft expansion and replacement needs. If any of these manufacturers faced production delays due to, for example, natural disasters, labor strikes or unavailability of skilled labor, we may experience a significant delay in the delivery of previously ordered aircraft. During these periods, we may not be able to obtain orders for additional aircraft with acceptable pricing, delivery dates or other terms. Delivery delays or our inability to obtain acceptable aircraft orders would adversely affect our revenue and profitability and could jeopardize our ability to meet the demands of our customers and execute our growth strategy. Although we have been able to acquire sufficient aircraft to date, a lack of available aircraft or the failure of our suppliers to deliver the aircraft we have ordered on a timely basis could limit our ability to take advantage of growth opportunities or jeopardize our ability to meet the demands of our customers. Additionally, lack of availability of new aircraft could result in an increase in prices for certain types of used helicopters.
We depend on a limited number of third party suppliers for aircraft parts and subcontract services.
We rely on a few key vendors for the supply of parts and subcontract services required to maintain our aircraft. Due to high demand, these vendors may experience backlogs in their manufacturing schedules and some parts may be in limited supply from time to time, which could have an adverse impact upon our ability to maintain and repair our aircraft.
We currently obtain a substantial portion of our helicopter spare parts and components from helicopter manufacturers and maintain supply arrangements with other key suppliers. To the extent that these suppliers also supply parts for aircraft used by the U.S. military, parts delivery for our aircraft may be delayed during periods in which there are high levels of military operations. Our inability to perform timely maintenance and repairs can result in our aircraft being underutilized which could have an adverse impact on our operating results. Furthermore, our operations in remote locations, where delivery of these components and parts could take a significant period of time, may also impact our ability to maintain and repair our aircraft. While every effort is made to mitigate such impact, this may pose a risk to our operating results. We do not have an alternative source of supply for parts and components supplied by the main helicopter manufacturers including Sikorsky, Eurocopter and Agusta. Failure or significant delay by these vendors in providing necessary parts could, in the absence of alternative sources of supply, have a material adverse effect on our business, including the withholding of payments by customers in certain cases. Due to our dependence on helicopter manufacturers for helicopter parts and components, we may also be subject to adverse impacts from unusually high price increases that are greater than overall inflationary trends. Cost increases may not result in an increase in our contract rates. An unusually high increase in the price of parts or components that cannot be fully passed on to our customers could have a material adverse effect on our business, results of operations and financial condition.
We are exposed to foreign currency risks.
Our consolidated financial statements are presented in U.S. dollars. However, a significant portion of revenue and operating expenses are denominated in currencies consisting primarily of Pound Sterling, Norwegian Kroner, Canadian Dollars, Australian Dollars and the Euro. The functional currencies of many of our subsidiaries are in non-U.S. currencies. There can be no assurances that our foreign currency risk management strategies will be effective and that foreign currency fluctuations will not adversely affect our results of operations and financial position. See Item 7A “Quantitative and qualitative disclosures about market risk” included elsewhere in this Annual Report on Form 10-K.
The loss of key personnel could affect our growth and future success.
Loss of the services of key management personnel at our corporate and regional headquarters without being able to attract personnel of equal ability could have a material adverse effect upon us.
Our ability to attract and retain qualified pilots, mechanics, technicians and other highly-trained personnel is an important factor in determining our future success. The market for these experienced and highly trained personnel is competitive and may become more competitive. Accordingly, we cannot be assured that we will be successful in our efforts to attract and retain such personnel in the future. A limited supply of qualified applicants may contribute to wage increases that increase the related costs to us. Our failure to attract and retain qualified personnel could have a material adverse effect on our business, financial condition and results of operations.
15
Table of Contents
Labor problems could adversely affect us.
Certain of our employees in the UK, Ireland, the Netherlands, Norway, Brazil, Canada and Australia (collectively, approximately 65% of our employees) are represented under collective bargaining or union agreements. Any disputes over the terms of these agreements or our potential inability to negotiate acceptable contracts with the unions that represent our employees could result in strikes, work stoppages or other slowdowns by the affected workers. Periodically, certain groups of our employees who are not covered under a collective bargaining agreement consider entering into such an agreement.
If our unionized workers engage in a strike, work stoppage or other slowdown, other employees elect to become unionized, existing labor agreements are renegotiated, or future labor agreements contain terms that are unfavorable to us, we could experience a disruption of our operations or higher ongoing labor costs, which could adversely affect our business, financial condition and results of operations.
If the assets in our defined benefit pension plans are not sufficient to meet the plans’ obligations, we may be required to make substantial cash contributions and our liquidity may be adversely affected.
We sponsor funded and unfunded defined benefit pension plans for our employees principally in Canada, the UK, the Netherlands and Norway. As of April 30, 2012, there was a $88.3 million funding deficit related to our various defined benefit pension plans which require ongoing funding by us.
Our estimate of liabilities and expenses for pensions incorporates significant assumptions, including the interest rate used to discount future liabilities and expected long-term rates of return on plan assets. Our pension contributions and expenses, results of operations, liquidity or shareholders’ equity in a particular period could be materially adversely affected by market returns that are less than the plans’ expected long-term rates of return, a decline in the rate used to discount future liabilities and changes in the currency exchange rates. If the assets of our pension plans do not achieve expected investment returns for a fiscal year, such deficiency may result in increases in pension expense. Changing economic conditions, poor pension investment returns or other factors may require us to make substantial cash contributions to the pension plans in the future, preventing the use of such cash for other purposes and adversely affecting our liquidity.
Our customers may seek to shift risk to us.
We give to and receive from our customers indemnities relating to damages caused or sustained by us in connection with our operations. Our customers’ changing views on risk allocation may cause us to accept greater risk to win new business or may result in us losing business if we are not prepared to take such risks.
We rely on the secondary used aircraft market to dispose of our older aircraft and parts due to our on-going fleet modernization efforts.
We are dependent upon the secondary used aircraft and parts market to dispose of older models of aircraft as part of our ongoing fleet modernization efforts and any spare aircraft capacity associated with the termination or non-renewal of existing contracts. If we are unable to dispose of our older aircraft and parts due to a lack of demand in the secondary market, our aircraft and part carrying costs may increase above requirements for our current operations, or we may accept lower selling prices, resulting in losses on disposition. A failure to dispose of aircraft and parts in the secondary market could impair our ability to operate our fleet efficiently and service existing contracts or win new mandates and could have a material adverse effect on our financial condition and results of operations.
We are subject to extensive environmental, health and safety laws, rules and regulations, which may have an adverse impact on our business.
We are subject to extensive laws, rules, regulations and ordinances in the various jurisdictions in which we operate relating to pollution and protection of the environment and to human health and safety, including those relating to discharge of noise, emissions to the air, releases or discharges to soil or water, the use, storage and disposal of petroleum and other regulated materials and the remediation of contaminated sites.
Our operations, including aircraft maintenance and aircraft fueling, involve the use, handling, storage and disposal of materials that may be classified as hazardous to human health and safety and to the environment. Laws protecting the environment have become more stringent in recent years and may, in certain circumstances, impose liability for the investigation and cleanup of releases of regulated materials and related environmental damage without regard to negligence or fault. These laws also may expose us to liability for the conduct of, or conditions caused by, others such as historic spills of regulated materials at our facilities, for acts that were in compliance with all applicable laws at the time such acts were performed, and for contamination at third-party sites where substances were sent for off-site treatment or disposal. Additionally, any failure by us to comply with applicable environmental, health and safety or planning laws and regulations may result in governmental authorities or other third parties taking action against our business that could adversely impact our operations and financial condition, including the:
| • | issuance of administrative, civil and criminal penalties; |
| • | denial or revocation of permits or other authorizations; |
| • | imposition of limitations on our operations; and |
| • | performance of site investigatory, remedial or other corrective actions. |
16
Table of Contents
We cannot predict the likelihood of change to any of these laws or in their enforcement nor the impact that any such change, or any discovery of previously unknown conditions, may have on our costs and financial position.
Our business in countries with a history of corruption and transactions with foreign governments increases the compliance risks associated with our international activities.
Our international operations could expose us to trade and economic sanctions or other restrictions imposed by the United States or other governments or organizations. The U.S. Department of Justice (“DOJ”), and other federal agencies and authorities have a broad range of civil and criminal penalties they may seek to impose against corporations and individuals for violations of trading sanctions laws, the Foreign Corrupt Practices Act (“FCPA”) and other federal statutes. Under trading sanctions laws, the government may seek to impose modifications to business practices, including cessation of business activities in sanctioned countries, and modifications to compliance programs, which may increase compliance costs, and may subject us to fines, penalties and other sanctions. If any of the risks described above materialize, it could adversely impact our operating results and financial condition.
These laws also prohibit improper payments or offers of payments to foreign governments and their officials and political parties for the purpose of obtaining or retaining business. We have operations, deal with government entities and have contracts in countries known to experience corruption. Our activities in these countries create the risk of unauthorized payments or offers of payments by one of our employees, consultants, sales agents or associates that could be in violation of various laws including the FCPA, even though these parties are not always subject to our control. Our existing safeguards and procedures may prove to be less than fully effective, and our employees, consultants, sales agents or associates may engage in conduct for which we may be held responsible. Violations of the FCPA may result in severe criminal or civil sanctions, and we may be subject to other liabilities, which could negatively affect our business, operating results and financial condition.
In addition, from time to time, the Company and its subsidiaries are subject to investigation by various government agencies in the jurisdictions in which we operate. In 2006, we voluntarily disclosed to the U.S. Office of Foreign Asset Control (“OFAC”) that our subsidiary formerly operating as Schreiner Airways may have violated applicable U.S. laws and regulations by re-exporting to Iran, Sudan, and Libya certain helicopters, related parts, map data, operation and maintenance manuals, and aircraft parts for third-party customers. OFAC’s investigation is ongoing and the Company continues to fully cooperate. Should the U.S. government determine that these activities violated applicable laws and regulations, we or our subsidiaries could be subject to civil or criminal penalties, including fines and/or suspension of the privilege to engage in trading activities involving goods, software and technology subject to the U.S. jurisdiction. At April 30, 2012, it is not possible to determine the outcome of this matter, or the significance, if any, to our business, financial condition and result of operations.
Our customers are primarily in the oil and gas industry and, as a result, changes in the economic and industry conditions may expose us to additional credit risk.
The majority of our customers are engaged in oil and gas production and exploration. For the fiscal year ended April 30, 2012, revenue generated by helicopter transportation services from oil and gas customers represented approximately 79% of our total revenues. This concentration may impact the overall exposure to credit risk because changes in economic and industry conditions that adversely affect the oil and gas industry could affect the majority of our customers. We generally do not require letters of credit or other collateral to support our trade receivables. Accordingly, a sudden or protracted downturn in the economic conditions of the oil and gas industry could adversely impact our ability to collect our receivables and thus, impact our financial condition.
We are subject to many different forms of taxation in various jurisdictions throughout the world, which may lead to disagreements with tax authorities regarding the application of tax law.
We are subject to many different forms of taxation including, but not limited to, income tax, withholding tax, commodity tax and social security and other payroll-related taxes. Tax law and administration is extremely complex and often requires us to make subjective determinations. The tax authorities in the various jurisdictions where we carry on business may not agree with the determinations that are made by us with respect to the application of tax law. Such disagreements could result in lengthy legal disputes and, ultimately, in the payment of substantial funds to the government authorities of the jurisdictions where we carry on business or provide goods or services, which could have a material effect on our results of operations.
Our estimate of tax related assets, liabilities, recoveries and expenses incorporates significant assumptions. These assumptions include, but are not limited to, the tax laws in various jurisdictions, the effect of tax treaties between jurisdictions, taxable income projections, and the benefits of various restructuring plans. To the extent that such assumptions differ from actual results, we may have to record additional income tax expenses and liabilities.
17
Table of Contents
Failure to develop or implement new technology and disruption to our systems could affect the results of our operations.
Many of the aircraft we operate are characterized by changing technology, introductions and enhancements of models of aircraft and services and shifting customer demands, including technology preferences. Our future growth and financial performance will depend in part upon our ability to develop, market and integrate new services and to accommodate the latest technological advances and customer preferences. In addition, the introduction of new technologies or services which compete with our services may result in our revenues decreasing over time. If we are unable to upgrade our operations with the latest technological advances in a timely manner, or at all, our business, financial condition and results of operations could suffer. Any disruption to computer, communication systems or other technical equipment used by us and our fleet could significantly impair our ability to operate our business efficiently and could have a material adverse effect on our financial condition and results of operations.
Reductions in spending on helicopter services by government agencies could lead to modifications of SAR and EMS contract terms or delays in receiving payments which could adversely impact our business, financial condition and results of operations.
We receive significant revenue from government agencies in Ireland, the UK and Australia. Any reductions in the budgets of government agencies for spending on helicopter services, implementations of cost savings measures by government agencies, imposed modifications of contract terms or delays in collecting receivables owed to us by our government agency customers could have an adverse effect on our business, results of operations and financial condition.
In addition, there are inherent risks in contracting with government agencies. Applicable laws and regulations in the countries in which we operate may enable our government agency customers to (i) terminate contracts for convenience, (ii) reduce, modify or cancel contracts or subcontracts if requirements or budgetary constraints change, or (iii) terminate contracts or adjust their terms.
We are controlled by our sponsor, which may have interests that conflict with ours.
We are controlled by First Reserve, which can determine the outcome of matters to be decided by our shareholders. Circumstances may occur in which the interests of First Reserve could be in conflict with our interests. For example, First Reserve is in the business of making investments in companies and may from time to time in the future acquire interests in businesses that directly or indirectly compete with certain portions of our business or are suppliers or customers of ours. Further, if First Reserve pursues such acquisitions or makes further investments in our industry, those acquisitions and investment opportunities may not be available to us. So long as First Reserve continues to directly or indirectly own a significant amount of our equity, even if such amount is less than 50%, it will continue to be able to influence our decisions.
If our Norwegian operating subsidiaries incur substantial losses, they may be subject to liquidation under Norwegian law.
The corporate laws under which our Norwegian subsidiaries operate differ from Canadian and U.S. laws in a number of areas, including with respect to corporate liquidation. Under Norwegian law, if the losses of any of the Norwegian subsidiaries reduce that subsidiary’s equity to an amount assumed to be less than 50% of its share capital or the equity of the subsidiary is assumed inadequate compared to the risks and the size of the subsidiary’s business, the directors of the subsidiary would be obligated by law to convene a general shareholders’ meeting to resolve to balance the amount of such equity and share capital by either:
| • | increasing the equity in an amount sufficient to achieve such balance and to ensure that the equity of the subsidiary becomes adequate compared to the risks and the size of the subsidiary’s business; or |
| • | reducing the share capital to pay off losses in an amount sufficient to achieve such balance. |
To the extent reductions in the share capital of the Norwegian subsidiaries are substantial and if no appropriate resolutions are made, they could ultimately result in liquidation, which could have a material adverse effect on our business, financial condition and results of operations.
Our MRO business, Heli-One, could suffer if licenses issued by the OEMs are not renewed or we cannot obtain additional licenses.
Our MRO business, Heli-One, receives a significant portion of its third party revenue from activities that require licenses from the OEMs. To grow the Heli-One business we may require additional licenses, which we cannot guarantee we will be able to obtain from the OEMs or obtain on acceptable terms. Furthermore, our MRO business could decline if existing licenses are revoked or cannot be renewed upon the expiry of existing terms.
18
Table of Contents
| Item 1B. | Unresolved staff comments |
None.
| Item 2. | Properties |
We currently operate in approximately 30 countries worldwide, using facilities that include hangars, supply and service centers, engineering support facilities and offices. In Norway, the United Kingdom, the Netherlands and Australia, we generally own the hangars we use in our helicopter operations, which are located primarily on leased airport land. We typically lease supply and service centers, engineering support facilities and offices from third parties.
The principal properties from which we now conduct our operations are:
| Location |
Operations |
Buildings (Sq. Feet) |
Owned or Leased | |||||||||||
| Land | Buildings | |||||||||||||
| Richmond, British Columbia, Canada |
Corporate Headquarters |
80,000 | Leased | Owned | ||||||||||
| Delta, British Columbia, Canada |
Headquarters for MRO Segment |
240,000 | Leased | Leased | ||||||||||
| Aberdeen, Scotland |
CHC Scotia Limited; Helicopter Services |
42,000 | Leased | Leased | ||||||||||
| CHC Scotia Limited; Terminal Building |
25,000 | Leased | Owned | |||||||||||
| Stavanger, Norway |
CHC Norway AS; Helicopter Services |
199,000 | Leased | Owned | ||||||||||
| Heli-One Norway AS Headquarters; MRO Segment |
179,000 | Leased | Owned | |||||||||||
| Fort Collins, Colorado |
Heli-One American Support, LLC |
80,000 | Leased | Leased | ||||||||||
| Hoofddorp, The Netherlands |
CHC Netherlands BV; Heli-One (Netherlands) BV |
39,000 | Leased | Leased | ||||||||||
| Bergen, Norway |
CHC Norway AS |
66,000 | Leased | Owned | ||||||||||
| Den Helder, The Netherlands |
CHC Helicopter Netherlands BV; Helicopter Services |
56,000 | Owned | Owned | ||||||||||
| Perth, Australia |
CHC Australia Headquarters |
7,400 | Leased | Leased | ||||||||||
| Fort Worth, Texas |
CHC Operations Centre |
26,926 | Leased | Leased | ||||||||||
| Item 3. | Legal proceedings |
The Company and its subsidiaries are, from time to time, named as defendants in lawsuits arising in the ordinary course of our business. The Company maintains adequate insurance coverage to respond to most claims. The Company cannot predict the outcome of any such lawsuits with certainty, but management does not expect the outcome of pending or threatened legal matters to have a material adverse impact on our financial condition.
In addition, from time to time, the Company and its subsidiaries are subject to investigation by various government agencies in the jurisdictions in which we operate. In 2006, we voluntarily disclosed to the U.S. Office of Foreign Asset Control (“OFAC”) that our subsidiary formerly operating as Schreiner Airways may have violated applicable U.S. laws and regulations by re-exporting to Iran, Sudan, and Libya certain helicopters, related parts, map data, operation and maintenance manuals, and aircraft parts for third-party customers. OFAC’s investigation is ongoing and the Company continues to fully cooperate. Should the U.S. government determine that these activities violated applicable laws and regulations, we or our subsidiaries could be subject to civil or criminal penalties, including fines and/or suspension of the privilege to engage in trading activities involving goods, software and technology subject to the U.S. jurisdiction. At April 30, 2012, it is not possible to determine the outcome of this matter, or the significance, if any, to our business, financial condition and result of operations.
Brazilian customs authorities seized one of the Company’s helicopters (valued at approximately $10.0 million) as a result of allegations that the Company violated Brazilian customs law by failing to ensure its customs agent and the customs agent’s third party shipping company followed approved routing of the helicopter during transport. The Company secured release of the helicopter and is disputing through administrative court action any claim for penalties associated with the seizure and the alleged violation. The Company has preserved its rights by filing a civil action against its customs agent for any losses that may result. At April 30, 2012, it is not possible to determine the outcome of this matter, or the significance, if any, to our business, financial condition and result of operations.
19
Table of Contents
Our Brazilian subsidiary is disputing a claim from the Brazilian tax authorities regarding eligibility for certain tax benefits that our subsidiary claimed in the past in connection with the importation of aircraft parts. The tax authorities are seeking to assess up to $20 million in additional taxes plus interest and penalties. We believe that, based on our interpretation of tax legislation and well established aviation industry practice, we are in compliance with all applicable tax legislation. On December 19, 2011, a First Level Administrative Panel decision reduced the assessment to $0.3 million. We are appealing the remaining assessment. We will continue to defend this claim vigorously. At April 30, 2012, it is not possible to determine the outcome of this matter, or the significance, if any, to our business, financial condition and result of operations.
Our Brazilian subsidiary is also disputing claims from the Brazilian tax authorities that it was not entitled to certain credits in 2004 and 2007. The tax authorities are seeking up to $3.8 million in additional taxes plus interest and penalties. We believe that based on our interpretation of tax legislation and well established aviation industry practice we are in compliance with all applicable tax legislation and plan to defend this claim vigorously. At April 30, 2012, it is not possible to determine the outcome of this matter, or the significance, if any, to our business, financial condition and result of operations.
We received an inquiry from the Nigerian government regarding the tax treatment of certain of its former joint venture partner’s operations in Nigeria. We are cooperating with the government of Nigeria. At April 30, 2012, it is not possible to determine the outcome of this matter, or the significance, if any, to our business, financial condition and result of operations.
In the United Kingdom, the Ministry for Transport is investigating potential wrongdoing involving two ex-employees in conjunction with the SAR-H bid award processes. This arose after we self-reported potential improprieties by these individuals upon our discovery of such potential improprieties in 2010. The SAR-H bid process was subsequently cancelled. We will continue to cooperate in all aspects of the investigation. At April 30, 2012, it is not possible to determine the outcome of this matter, or the significance, if any, to our business, financial condition and result of operations.
| Item 4. | Mine Safety Disclosures |
None.
| Item 5. | Market for registrant’s common equity, related stockholder matters and issuer purchases of equity securities |
Market Information and Holders
The Company is a privately held company and there is no established public trading market for its equity. The Company is a wholly-owned subsidiary of CHC Helicopter Holding S.à r.l. Please see Item 12 “Security ownership of certain beneficial owners and management and related stockholder matters” below.
Dividend Policy
During fiscal years 2012, 2011 and 2010, no dividends were paid to our sole stockholder.
Equity Compensation Plan Information
The following table sets forth, as of April 30, 2012, the number of shares of 6922767 Holding S.à r.l. (our indirect parent entity) capital stock that may be issued upon the exercise of outstanding options issued under equity compensation plans, the weighted average exercise price of those options and the number of shares of 6922767 Holding S.à r.l. capital stock remaining available for future issuance under equity compensation plans:
| Plan Category |
Number of securities to be (a) (#) |
Weighted-average exercise (b) ($) |
Number of securities (c) |
|||||||||
| Equity compensation plans approved by security holders |
116,258,676 | 0.6515 | 21,651,644 | |||||||||
| Equity compensation plans not approved by security holders |
— | — | — | |||||||||
| Total |
116,258,676 | 0.6515 | 21,651,644 | |||||||||
20
Table of Contents
Recent Sales of Unregistered Securities
On October 14, 2011, November 2, 2011 and February 9, 2012, 6922767 Holding (Cayman) Inc. (our indirect parent entity) issued Ordinary A shares in the amount of 72,289,157, 24,096,386 and 24,096,386 on each respective date to Horizon Alpha Limited for total cash consideration of $100.0 million.
| Item 6. | Selected financial data |
The selected financial data set forth below should be read in conjunction with the Company’s consolidated financial statements and related notes and Item 7 “Management’s discussion and analysis of financial condition and results of operations” included elsewhere in this Annual Report on Form 10-K.
The following table sets forth summary historical consolidated financial data of the Predecessor and the Successor for the periods indicated. See “Basis of Presentation” above. 6922767 Holding S.à r.l., the Successor, was incorporated on February 20, 2008 under the laws of Luxembourg and is a private limited liability company (Société à responsabilité limitée) (S.à r.l.) whose sole purpose was to acquire CHC Helicopter Corporation, the Predecessor. The Company completed its acquisition of the Predecessor on September 16, 2008 and has included the results of operations of the entity formerly known as CHC Helicopter Corporation from September 16, 2008 to April 30, 2009 in its audited consolidated financial statements for the fiscal 2009 year. In addition to the operating results of the entity formerly known as CHC Helicopter Corporation, the Company’s results of operations also include organizational expenses and losses from May 1, 2008 up to the date of the acquisition. The acquisition of CHC Helicopter Corporation was accounted for using the purchase method of accounting and the application of the purchase method of accounting requires the allocation of the acquisition purchase price to the tangible and intangible assets acquired and liabilities assumed based on their respective fair values as of the date of the acquisition. Accordingly, the Predecessor period from May 1, 2008 to September 15, 2008 and the Successor period from May 1, 2008 to April 30, 2009 have a different basis of accounting. The comparability of the financial information presented below for the Predecessor and Successor periods has been impacted by the application of the acquisition accounting.
The selected Successor’s consolidated statements of operations for the years ended April 30, 2012, 2011 and 2010 and the Successor’s balance sheet data as of April 30, 2012 and 2011 have been derived from the audited financial statements included elsewhere in this Annual Report on Form 10-K. The selected Successor’s consolidated statement of operations for the year ended April 30, 2009 and the selected balance sheet data as of April 30, 2010 and 2009 are derived from the audited financial statements, which are not included in this Annual Report on Form 10-K. The selected Predecessor’s consolidated statement of operations for the period from May 1, 2008 to September 15, 2008 and for the year ended April 30, 2008 and the selected Predecessor’s balance sheet data as of April 30, 2008 are derived from the audited financial statements, which are not included in this Annual Report on Form 10-K. Our historical operating results are not necessarily indicative of future operating results.
21
Table of Contents
| Successor | Predecessor | |||||||||||||||||||||||
| For the year ended April 30, | (i) | For
the (i) |
For the (i) |
|||||||||||||||||||||
| (in thousands of U.S. dollars) | 2012 | 2011 | 2010 | 2009 | 2008 | 2008 | ||||||||||||||||||
|
|
|
|
|
|
|
|
|
|
|
|
|
|||||||||||||
| Operating data: |
||||||||||||||||||||||||
| Revenue |
$ | 1,692,539 | $ | 1,445,460 | $ | 1,313,566 | $ | 761,895 | $ | 510,090 | $ | 1,252,956 | ||||||||||||
| Direct Costs |
(1,381,900 | ) | (1,211,680 | ) | (1,029,882 | ) | (612,428 | ) | (446,823 | ) | (1,056,715 | ) | ||||||||||||
| Earnings (loss) from equity accounted investees |
2,844 | 2,159 | 1,436 | 1,118 | 311 | (327 | ) | |||||||||||||||||
| General and administration costs |
(69,590 | ) | (65,391 | ) | (61,157 | ) | (26,910 | ) | (12,479 | ) | (34,512 | ) | ||||||||||||
| Amortization |
(112,967 | ) | (99,625 | ) | (77,738 | ) | (51,978 | ) | (46,816 | ) | (77,438 | ) | ||||||||||||
| Restructuring costs |
(22,511 | ) | (4,751 | ) | (4,855 | ) | (5,568 | ) | (15 | ) | — | |||||||||||||
| Recovery (impairment) of receivables and funded residual value guarantees |
272 | (1,919 | ) | (13,266 | ) | (19,900 | ) | (38,300 | ) | — | ||||||||||||||
| Impairment of intangible assets |
(4,218 | ) | (20,608 | ) | (53,903 | ) | (25,000 | ) | — | — | ||||||||||||||
| Impairment of property and equipment |
— | — | (36,240 | ) | — | — | — | |||||||||||||||||
| Impairment of assets held for sale |
(13,469 | ) | (5,239 | ) | (26,585 | ) | (4,900 | ) | (13,300 | ) | (7,400 | ) | ||||||||||||
| Gain (loss) on disposal of assets |
8,169 | 7,193 | (2,686 | ) | 1,346 | 545 | (724 | ) | ||||||||||||||||
| Goodwill impairment charge |
— | — | — | (639,187 | ) | — | — | |||||||||||||||||
|
|
|
|
|
|
|
|
|
|
|
|
|
|||||||||||||
| Operating Income (loss) |
99,169 | 45,599 | 8,690 | (621,512 | ) | (46,787 | ) | 75,840 | ||||||||||||||||
| Financing charges |
(129,845 | ) | (140,582 | ) | (74,459 | ) | (91,822 | ) | (14,027 | ) | (72,465 | ) | ||||||||||||
|
|
|
|
|
|
|
|
|
|
|
|
|
|||||||||||||
| Earnings (loss) from continuing operations before income tax |
(30,676 | ) | (94,983 | ) | (65,769 | ) | (713,334 | ) | (60,814 | ) | 3,375 | |||||||||||||
| Income tax recovery (provision) |
(48,217 | ) | 32,916 | (9,297 | ) | 9,204 | 3,521 | (5,175 | ) | |||||||||||||||
|
|
|
|
|
|
|
|
|
|
|
|
|
|||||||||||||
| Loss from continuing operations |
(78,893 | ) | (62,067 | ) | (75,066 | ) | (704,130 | ) | (57,293 | ) | (1,800 | ) | ||||||||||||
| Earnings (loss) from discontinued operations, net of tax |
(16,107 | ) | (3,202 | ) | (1,436 | ) | (380 | ) | 114 | 16,004 | ||||||||||||||
|
|
|
|
|
|
|
|
|
|
|
|
|
|||||||||||||
| Net earnings (loss) |
$ | (95,000 | ) | $ | (65,269 | ) | $ | (76,502 | ) | $ | (704,510 | ) | $ | (57,179 | ) | $ | 14,204 | |||||||
|
|
|
|
|
|
|
|
|
|
|
|
|
|||||||||||||
| Net earnings (loss) attributable to the Company |
$ | (107,422 | ) | $ | (70,338 | ) | $ | (70,607 | ) | $ | (691,222 | ) | $ | (57,179 | ) | $ | 14,204 | |||||||
| Net earnings (loss) attributable to Non-controlling interest |
12,422 | 5,069 | (5,895 | ) | (13,288 | ) | — | — | ||||||||||||||||
|
|
|
|
|
|
|
|
|
|
|
|
|
|||||||||||||
| Net earnings (loss) |
$ | (95,000 | ) | $ | (65,269 | ) | $ | (76,502 | ) | $ | (704,510 | ) | $ | (57,179 | ) | $ | 14,204 | |||||||
| Other financial data: |
||||||||||||||||||||||||
| Ratio of earnings to fixed charges (ii) |
(1 | ) | (2 | ) | (3 | ) | (4 | ) | (5 | ) | (6 | ) | ||||||||||||
|
|
|
|
|
|
|
|
|
|
|
|
|
|||||||||||||
| Successor | Predecessor | |||||||||||||||||||||||
| As at April 30, | As at September 15, |
As at April 30, |
||||||||||||||||||||||
| (in thousands of U.S. dollars) | 2012 | 2011 | 2010 | 2009 (i) |
2008 (i) |
2008 (i) |
||||||||||||||||||
| Balance sheet data: |
||||||||||||||||||||||||
| Cash and cash equivalents |
$ | 55,547 | $ | 68,921 | $ | 174,690 | $ | 199,267 | 71,733 | |||||||||||||||
| Total assets |
2,715,982 | 2,788,155 | 2,587,769 | 2,572,789 | 2,364,010 | |||||||||||||||||||
| Total long-term debt and capital lease obligations (iii) |
1,287,080 | 1,291,486 | 1,071,159 | 1,075,970 | 945,205 | |||||||||||||||||||
| Total liabilities |
2,053,515 | 2,040,792 | 1,920,293 | 1,816,772 | 1,918,531 | |||||||||||||||||||
| Capital stock |
1,607,101 | 1,547,101 | 1,546,955 | 19 | 179,803 | |||||||||||||||||||
| Shareholder’s equity |
$ | 660,792 | 744,276 | 692,503 | 756,017 | 445,479 | ||||||||||||||||||
22
Table of Contents
| (i) | See “Basis of Presentation” above for a further discussion of the Predecessor and Successor periods. |
| (ii) | Earnings (loss) represent (a) pre-tax income (loss) from continuing operations before adjustment for earnings (loss) from equity accounted investees; (b) fixed charges; (c) amortization of capitalized interest; and (d) distributed income of equity accounted investees; less (e) interest capitalized. Fixed charges represent (a) interest expensed and capitalized, (b) amortized discounts and capitalized expenses related to indebtedness, and (c) an estimate of the interest within rental expense. |
(1) Earnings were insufficient to cover fixed charges by $35.5 million for the year ended April 30, 2012.
(2) Earnings were insufficient to cover fixed charges by $97.1 million for the year ended April 30, 2011.
(3) Earnings were insufficient to cover fixed charges by $65.9 million for the year ended April 30, 2010.
(4) Earnings were insufficient to cover fixed charges by $714.5 million for the year ended April 30, 2009.
(5) Earnings were insufficient to cover fixed charges by $61.1 million for the period from May 1, 2008 to September 15, 2008.
(6) Earnings were insufficient to cover fixed charges by $4.6 million for the year ended April 30, 2008.
| (iii) | Total long-term debt and capital lease obligations is presented net of the discount on the senior secured notes and excludes a facility secured by accounts receivables. As of April 30, 2012, the facility secured by accounts receivables had a balance of $45.6 million (April 30, 2011—$21.6 million). |
23
Table of Contents
| Item 7. | Management’s discussion and analysis of financial condition and results of operations |
This management’s discussion and analysis of financial condition and results of operations (“MD&A”) is intended to provide an understanding of our results of operations, financial condition and where appropriate, factors that may affect future performance. The following discussion of our results of operations and financial condition should be read in conjunction with the “Selected Historical Consolidated Financial Data” and our audited consolidated financial statements and related notes thereto included elsewhere in this Annual Report on Form 10-K. The following discussions include forward-looking statements that involve certain risks and uncertainties, including those identified under “Item 1A. Risk Factors” elsewhere in this Annual Report on Form 10-K. Our actual results could differ materially from those discussed in these forward-looking statements. See “Cautionary Note Regarding Forward-Looking Statements and Other Industry and Market Data” elsewhere in this Annual Report on Form 10-K.
This MD&A also contains non-GAAP financial measures, segment earnings before interest, taxes, depreciation, amortization and aircraft lease rent and associated costs (“segment EBITDAR (adjusted)”) and Adjusted earnings before interest, taxes, depreciation and amortization (“Adjusted EBITDA”) that are not required by, or presented in accordance with GAAP. These non-GAAP measures are not performance measures under GAAP and should not be considered as alternatives to net earnings (loss) or any other performance or liquidity measures derived in accordance with GAAP. In addition, these measures may not be comparable to similarly titled measures of other companies.
We have chosen to include segment EBITDAR (adjusted) as we consider this measure to be a significant indicator of our financial performance and use this measure to assist us in allocating available capital resources. Segment EBITDAR (adjusted), which is defined as earnings before interest, taxes, depreciation, amortization and aircraft lease and associated costs or total segment revenue plus earnings from equity accounted investees less direct costs excluding aircraft lease and associated costs and general and administration expenses. Segment EBITDAR (adjusted) also excludes restructuring costs, recovery (impairment) of receivables and funded residual value guarantees, impairment of intangible assets, impairment of property and equipment, impairment of assets held for sale, gain (loss) on disposal of assets and goodwill impairment if any. These items are significant components to understanding and assessing financial performance and liquidity. For additional information about the Company’s segment revenue and segment EBITDAR (adjusted), including a reconciliation of these measures to its consolidated financial statements, see Note 27 of the audited annual consolidated financial statements for the fiscal year ended April 30, 2012 included elsewhere in this Annual Report on Form 10-K.
We have also chosen to include Adjusted EBITDA as it provides useful information to investors as a measure to calculate certain financial covenants related to our revolving credit facility and certain covenants in the indenture. Adjusted EBITDA has limitations and should not be considered as discretionary cash available to us to reinvest in the growth of our business or a measure of cash that will be available to meet our obligations.
Overview of Business
We are a world leading commercial operator of medium and heavy helicopters, providing mission-critical services to the offshore oil and gas industry and SAR and EMS to government agencies. We believe the services we provide to the oil and gas industry are critical for the continued production of hydrocarbons from existing offshore oil and gas platforms and the exploration and development of new oil fields, while our SAR and EMS are crucial for saving lives. In addition, our MRO segment, Heli-One is a world leading commercial provider of helicopter support services, with offerings that include MRO, integrated logistics support, and the complete outsourcing of all maintenance activities for helicopter operators. Heli-One services our own flight operations as well as third party customers around the world.
Through our subsidiaries and Predecessor companies, we have been providing helicopter services for over 60 years, covering most major offshore oil and gas producing regions of the world. Our major operations are in Norway, the United Kingdom, Ireland, the Netherlands, Australia, Brazil, Canada, and Africa. The Company earns the majority of its revenue from helicopter transportation services for the oil and gas industry, SAR and EMS activities and MRO services.
This MD&A provides certain financial and related information about our segments and also about our products and services, the geographic areas in which we operate and our major customers. Our objective is to provide information about the different types of business activities in which we engage and the different economic environments in which we operate in order to help users of our consolidated financial statements (i) better understand our performance, (ii) better assess our prospects for future net cash flows and (iii) make more informed judgments about us as a whole.
Segments
We operate under two operating segments and have a corporate and other segment comprised primarily of general and administration costs and the costs related to managing the fleet of aircraft.
24
Table of Contents
The two operating segments are as follows:
Helicopter Services:
| • | Helicopter Services consists of flying operations in the Eastern North Sea, Western North Sea, the Americas, the Australasia region and the Africa-Euro Asia region serving the offshore oil and gas, SAR, EMS and other industries. The Eastern North Sea is comprised mainly of Norway while the Western North Sea includes the United Kingdom, Ireland, the Netherlands and Denmark. The Americas is comprised of Brazil and North and South American countries. The Australasia region includes Australia and Southeast Asian countries and the Africa-Euro Asia region includes Nigeria, Kazakhstan, Turkey, Mozambique, Tanzania and other African and European countries. |
MRO:
| • | The MRO segment includes helicopter repair and overhaul facilities in Norway, Canada, Australia and the United States, providing helicopter repair and overhaul services for our fleet and for a growing external customer base in Europe, Asia and North America. |
Market Outlook
Oil and gas production customers are the principle source of our revenue, while exploration and development customers provide a lesser portion of our revenue. The production business is typically less cyclical than the exploration and development business because the production platforms remain in place over the long-term and are relatively unaffected by economic cycles, as the marginal cost of lifting a barrel of oil once the platform is in position is low. Our customers typically base their capital expenditure budgets on their long-term commodity price expectations and not exclusively on the current spot price. In 2009 and 2010, the credit, equity and commodity markets experienced significant volatility, causing many of our oil and gas company customers to reduce capital spending plans and defer projects.
Our MRO business is subject to economic cycles. Although aircraft maintenance is mandatory, during difficult economic times, such as those experienced since 2008, many of our customers cut maintenance expenditures by reducing flying hours and deferring certain expenditures.
In 2011 and 2012 to date, we have seen growing confidence amongst our customers, which has led to increased spending and recovery in our fiscal 2012 financial performance. We are cautiously optimistic this recovery will continue. We are continuing to see growth in the offshore production as new technology has allowed oil and gas companies to continue exploration and drilling farther offshore. To remain competitive and to service existing and new contracts in this industry, older aircraft in the fleet must be replaced with new aircraft technology to meet customers’ changing demands. The industry is constrained by the pace at which it renews its fleet due to the limited supply of new technology aircraft and the secondary market for aircraft resales. To address these constraints, we have continued to focus on the reduction of our idle aircraft and have continued efforts to secure commitments to obtain new technology aircraft to support our future growth.
During the year, we entered into a commitment to acquire 20 Eurocopter EC225s, new technology aircraft. Subsequent to year end, we entered into a commitment to purchase 10 AugustaWestland AW139s with options for an additional 16 aircraft and exercised an option to acquire an additional two Eurocopter EC225s for a total commitment of 22 Eurocopter EC225s. The delivery of these aircraft will begin in fiscal 2013 and will continue through to fiscal 2017. These aircraft will be purchased outright or financed through leases. In addition to the limited supply of new aircraft, the secondary market for the sale of aircraft is improving, providing an additional source of capital for new aircraft purchases and lease buyouts.
Australia, Brazil and certain countries in the Africa-Euro Asia region continue to be important growth areas for us due to an increase in oil and gas activity. As the part of the broad transformation initiatives, we have reviewed key processes and systems used at the bases to further create efficiencies.
Heli-One, our MRO operation is continuing to grow its third party business with additional contract wins in Mexico, Brazil and Thailand. To further support the growth of the MRO business and expand our global footprint, we have opened an additional MRO facility in Poland and will be expanding to Brazil in fiscal 2013. The MRO operation is also reviewing its global inventory management processes and implementing a number of lean process techniques to continue to drive efficiencies in the workshops.
We conduct our business in various foreign jurisdictions, and as such, our cash flows and earnings are subject to fluctuations and related risks from changes in foreign currency exchange rates. Throughout fiscal year 2012, our primary foreign currency exposures were related to the Canadian dollar, the Euro, the British pound sterling, Norwegian Kroner and the Australian dollar. For details on this exposure and the related impact on our results of operations, see Item 7A “Quantitative and qualitative disclosures about market risk” included elsewhere in this Annual Report on Form 10-K.
25
Table of Contents
To further support our profit growth, we are continuing with our broad transformation program. The program includes transformative thinking and technology to achieve cost efficiencies through the global standardization of processes and restructuring of the organization to allow us to continue to reshape our earnings and cash flows. Together, these qualities allow us to maximize our value proposition to our customers – allowing them to go further, do more, and come home safely. The transformation program looks at all major aspects of our operations and includes a number of work streams, each including a multitude of initiatives:
| 1. | Overhead transformation – redesign the organization structure of all indirect functions and improve and streamline global processes for support; |
| 2. | Base transformations – reengineer the entire operations at all 60 bases to share operational best practices around the world; |
| 3. | Optimizing contract profitability – attempting to capture full revenue and profit from every flying contract globally; |
| 4. | MRO productivity improvement – dramatically increase MRO efficiency and reduce cost and inventory levels through lean processes and other techniques; |
| 5. | Overhauling the business management systems – launch a global key leading performance indicator dashboard to provide headlights on business performance; and |
| 6. | Overall project management – deploy central project management and analytical resources to assist business teams on various work streams. |
For the fiscal year ended April 30, 2012, in connection with our transformation program, we incurred consulting fees and severance and termination costs totaling $22.5 million.
The transformation program is progressing in accordance with our plan as we continue to consolidate, standardize and enhance our capabilities, tools, processes and systems. As of April 30, 2012, we had achieved milestones including the standardization of key performance indicators, detailed reviews of operations in key bases in the Western North Sea and Australia and the opening of our centralized Helicopter Services operations center in Fort Worth, Texas. We are proceeding with our plans to implement global systems to enhance operations such as pilot and line maintenance scheduling, install a global MRO software system, and the roll-out of standardized base operating procedures. In addition to these work streams, we will continue our review of contract profitability to optimize operating results.
Fleet
As of April 30, 2012, our fleet was comprised of the following aircraft:
| Aircraft Type |
Total | Owned | Leased | |||||||||
| Medium |
||||||||||||
| Sikorsky S76C+ |
22 | 11 | 11 | |||||||||
| Sikorsky S76C++ |
23 | 3 | 20 | |||||||||
| Sikorsky S76A/B/C |
29 | 26 | 3 | |||||||||
| Eurocopter EC135/145/155 |
6 | 1 | 5 | |||||||||
| Eurocopter AS365 Series |
14 | 6 | 8 | |||||||||
| Bell 412 |
13 | 7 | 6 | |||||||||
| Bell 212/214 |
1 | 1 | — | |||||||||
| Agusta AW139 |
29 | 3 | 26 | |||||||||
|
|
|
|
|
|
|
|||||||
| 137 | 58 | 79 | ||||||||||
| Heavy |
||||||||||||
| Eurocopter Super Puma series (i) |
45 | 18 | 27 | |||||||||
| Eurocopter EC225 |
29 | 2 | 27 | |||||||||
| Sikorsky S92A (i) |
33 | 2 | 31 | |||||||||
| Sikorsky S61N |
6 | 6 | — | |||||||||
|
|
|
|
|
|
|
|||||||
| 113 | 28 | 85 | ||||||||||
| Total Helicopters |
250 | 86 | 164 | |||||||||
| Fixed Wing |
2 | 2 | — | |||||||||
|
|
|
|
|
|
|
|||||||
| Total Aircraft |
252 | 88 | 164 | |||||||||
|
|
|
|
|
|
|
|||||||
| (i) | Below is a summary of aircraft under capital lease, which are classified above as owned aircraft: |
| Eurocopter Super Puma Series |
1 | |||
| Sikorsky S92A |
1 |
26
Table of Contents
RESULTS OF OPERATIONS
The Fiscal Year Ended April 30, 2012 Compared to the Fiscal Year Ended April 30, 2011
| Consolidated Results Summary For the fiscal year ended April 30, (in thousands of U.S. dollars) |
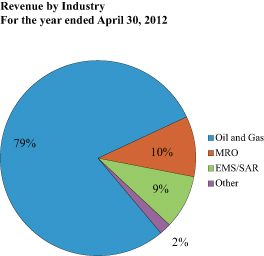
| |||||||||||||||||
| 2012 | 2011 | Favorable (Unfavorable) | ||||||||||||||||
| $ Change | % Change | |||||||||||||||||
| Helicopter Services (i) |
$ | 1,520,223 | $ | 1,311,983 | $ | 208,240 | 15.9 | % | ||||||||||
| MRO |
166,479 | 129,222 | 37,257 | 28.8 | % | |||||||||||||
| Corporate and other |
5,837 | 4,255 | 1,582 | 37.2 | % | |||||||||||||
|
|
|
|
|
|
|
|
|
|||||||||||
| Total revenue |
1,692,539 | 1,445,460 | 247,079 | 17.1 | % | |||||||||||||
|
|
|
|
|
|
|
|
|
|||||||||||
| Direct costs (ii) |
(1,205,215 | ) | (1,046,852 | ) | (158,363 | ) | -15.1 | % | ||||||||||
| Aircraft lease and associated costs |
(176,685 | ) | (164,828 | ) | (11,857 | ) | -7.2 | % | ||||||||||
|
|
|
|
|
|
|
|
|
|||||||||||
| Total direct costs |
$ | (1,381,900 | ) | $ | (1,211,680 | ) | $ | (170,220 | ) | -14.0 | % | |||||||
|
|
|
|
|
|
|
|
|
|||||||||||
| Flying hours (unaudited) |
172,145 | 163,884 | 8,261 | 5.0 | % | |||||||||||||
| # of aircraft (unaudited) |
252 | 263 | (11 | ) | -4.2 | % | ||||||||||||
| (i) | Includes revenue from the customer reimbursement of fuel costs of $91.1 million for the fiscal year ended April 30, 2012 and $66.7 million for the fiscal year ended April 30, 2011. |
| (ii) | Includes $92.5 million in fuel costs for the fiscal year ended April 30, 2012 and $67.3 million for the fiscal year ended April 30, 2011. |
Consolidated Results of Operations
Revenue
Revenue increased by $247.1 million to $1,692.5 million compared to fiscal 2011. Helicopter Services revenue increased by $208.2 million, due primarily to new flying contracts with increased flying hours in the Americas and Australasia and a significant increase in ad hoc flying hours in the Eastern and Western North Sea. Africa-Euro Asia’s revenues have also increased due to new flying contracts in fiscal 2012. The Americas contributed an additional $65.2 million in revenues, due primarily to new contracts for two new heavy helicopters in Brazil, partially offset by the expiry of some short-term contracts. In addition, there was a new short-term contract for two heavy helicopters in the Falkland Islands that began flying in July 2011. Australasia contributed an additional $59.7 million due primarily to a new contract that began in April 2011 in Australia, as all aircraft were deployed under the contract combined with an increase in the flight hours under this contract. As this contract also earns revenues based on the number of hours flown, the increase in flying hours generated greater revenues in fiscal 2012. The revenue increases in Australia were partially offset by a decrease in Southeast Asia from lost contracts and reduced flying hours. The Western North Sea contributed additional revenues of $34.2 million, due primarily to an increase in oil and gas activity in Scotland, England and the Netherlands that allowed aircraft from lost contracts to be redeployed to ad hoc flying contracts resulting in a significant increase in flying hours in fiscal 2012. The Eastern North Sea contributed an additional $34.8 million, due primarily to an increase in oil and gas activity in Norway resulting in higher ad hoc flying hours. This increase was offset by the release of an off-market contract credit in fiscal 2011 for $13.5 million when the customer advised they would not be exercising a renewal option. The off-market credits were recognized on the date of acquisition and were originally valued under the assumption that the customer would exercise all optional contract renewals. The Africa-Euro Asia region’s revenue increased by $13.2 million, due primarily to Kazakhstan, Mozambique and Tanzania, as increased oil and gas activities in these areas generated new contracts with existing customers partially offset by Nigeria. Nigeria’s revenue decreased as we exited our relationship with our previous partners, resulting in a decrease to flying hours and the redeployment of aircraft to other regions. We are currently in discussions with a potential new partner in order to recommence our flying operations in Nigeria.
27
Table of Contents
MRO revenue increased by $37.3 million, due primarily to an increase in non-PBH revenues, which included an increase in airframes, engine and component work. The increase in airframe, engine and component work was primarily attributable to a newly reorganized sales team, which generated new contracts.
Direct Costs
| For the fiscal year ended April 30, (in thousands of U.S. dollars) |
||||||||||||||||
| 2012 | 2011 | Favorable (Unfavorable) | ||||||||||||||
| $ Change | % Change | |||||||||||||||
| Crew costs |
$ | (409,212 | ) | $ | (358,184 | ) | $ | (51,028 | ) | -14.2 | % | |||||
| Base operations and other costs |
(379,804 | ) | (294,187 | ) | (85,617 | ) | -29.1 | % | ||||||||
| Maintenance |
(258,506 | ) | (240,584 | ) | (17,922 | ) | -7.4 | % | ||||||||
| Support costs |
(157,693 | ) | (153,897 | ) | (3,796 | ) | -2.5 | % | ||||||||
|
|
|
|
|
|
|
|
|
|||||||||
| $ | (1,205,215 | ) | $ | (1,046,852 | ) | $ | (158,363 | ) | -15.1 | % | ||||||
Direct costs increased by $158.4 million to $1,205.2 million compared to fiscal 2011. The increase in direct costs was due primarily to an increase in crew, base operations and other costs and maintenance costs to support the growth in the flying operations and MRO.
Crew costs increased by $51.0 million to $409.2 million compared to fiscal 2011. The increase was due to the hiring of additional crew for new and existing contracts in Australia, Brazil and the Falkland Islands of $39.8 million along with $6.5 million in associated training costs. In Brazil, there was an increase of $4.7 million in salary costs for existing employees from wage increases awarded as the result of tight labor markets.
Base operations and other costs increased by $85.6 million to $379.8 million compared to fiscal 2011. Base operations and other costs also included fuel costs re-chargeable to our customers, insurance and travel. New contracts and an increase in ad hoc flying hours in Brazil, Australia, Mozambique, Tanzania, and the North Sea resulted in a cost increase of $27.3 million due to the set up costs for new bases, increased fuel costs from new aircraft and higher flying hours, accommodation costs for additional base and crew employees, and training for new base employees. Existing contracts increased base operations and other costs by $43.6 million as higher flying hours generated higher fuel costs, landing costs and base costs. In fiscal 2011, the base operations and other costs included a $10.2 million write-off of bid costs previously capitalized and the legal and consulting fees incurred in connection with the planned procurement of the UK SARH contract.
Maintenance costs increased by $17.9 million to $258.5 million compared to fiscal 2011. MRO expenses increased due primarily to higher third party activity from airframe maintenance, engine and component work attributed to a newly reorganized sales team, which has focused its efforts in these areas. MRO expenses to support the internal fleet have also increased compared to fiscal 2011 due to an increase in flying hours from new and existing contracts.
Aircraft Lease and Associated Costs
Aircraft leasing costs increased by $11.9 million to $176.7 million, due primarily to new technology aircraft additions that have higher lease costs partially offset by a number of aircraft that were converted to capital leases during fiscal 2012. We are continuing to acquire expensive new technology aircraft to meet our customers’ needs as they continue exploration and development into deeper waters. We anticipate we will continue to finance aircraft through operating leases and may make strategic decisions as required to purchase certain aircraft outright. The purchase of aircraft allows for greater jurisdictional flexibility as some lease agreements restrict the movement of aircraft to certain countries.
General and Administration Costs
General and administration costs included in the results of the Corporate and other segment increased by $4.2 million to $69.6 million compared to fiscal 2011. The increase is due primarily to information technology costs, personnel support costs and insurance costs, partially offset by a decrease in consulting and legal costs. Information technology costs increased, due primarily to costs incurred to support the new global systems implemented in connection with our broad transformation initiatives. Personnel support costs are higher than fiscal 2011 as vacant positions in the senior leadership team were filled and there was an increase in the short term incentive compensation due to improved performance during the year. Insurance expense increased due to higher reported claims for self-insured benefits in fiscal 2011. This was partially offset by a decrease in consulting and legal fees, as we incurred costs in fiscal 2011 for strategic projects and activities that we did not incur in 2012.
28
Table of Contents
Amortization
Amortization expense increased by $13.3 million to $113.0 million compared to fiscal 2011, due primarily to an increase in rotables to service the new technology aircraft. Of the current year amortization expense, $66.6 million related to MRO, $7.6 million related to Helicopter Services and the remainder related to the Corporate and other segment.
Restructuring Costs
Restructuring costs increased by $17.8 million to $22.5 million compared to fiscal 2011, due primarily to consulting costs and severance costs incurred as part of the transformation program to achieve long-term cost efficiencies through the implementation of new systems and processes allowing for global standardization. Of the current year restructuring costs, $17.8 million related to the Corporate and other segment, $4.5 million related to the Helicopter Services segment, and $0.2 million related to the MRO segment.
Impairment of Assets Held For Sale
Impairment of assets held for sale increased by $8.2 million to $13.5 million compared to fiscal 2011. The increase in impairment was due primarily to older technology aircraft that are being sold to increase the mix of new aircraft technology and a building classified as held for sale. In the current year, there were more aircraft impaired compared to fiscal 2011. Of the impairment of assets held for sale for the current year, $12.5 million related to the Corporate and other segment and the remainder related to the Helicopter Services segment.
Interest on Long-Term Debt
Interest on long-term debt increased by $25.1 million to $116.6 million compared to fiscal 2011 due primarily to the recognition of a full year of interest on the senior secured notes and an increase in capital lease interest expense from the refinancing of the operating leases.
Foreign Exchange Gains (Losses)
Foreign exchange gains have decreased by $16.1 million to $1.8 million compared to fiscal 2011 from the revaluation of net liability positions denominated in U.S. dollars in entities with Norwegian Kroner and Euro functional currencies.
Other Financing Charges
Other financing charges decreased by $52.0 million to $15.1 million compared to fiscal 2011. The decrease in the financing charges resulted from costs incurred in the prior year related to the long-term debt refinancing totaling $62.4 million that did not reoccur in the current year, partially offset by an increase in the net loss on derivative financial instruments of $10.9 million. As part of the refinancing of our long-term debt, we wrote-off the unamortized transaction costs related to the previous credit facility, settled the interest rate swap and incurred fees related to the short-term amendment of the previous credit facility. Net loss on derivative financial instruments increased due to the unfavorable movements in the foreign exchange rates as compared to fiscal 2011.
29
Table of Contents
Income Tax Recovery (Expense)
Income tax recovery decreased by $81.1 million to an income tax expense of $48.2 million compared to fiscal 2011. The effective tax rate for fiscal 2012 is 157.2% compared to 34.7% in fiscal 2011. The below table provides a breakdown of the items which caused the change in tax recovery between the current year and the prior year:
| Increase/(decrease) in tax recovery |
Effective tax rate |
|||||||
| Income tax recovery at April 30, 2011 |
$ | 32,916 | (34.7 | )% | ||||
| Change in tax recovery calculated at statutory rate |
(18,386 | ) | ||||||
| Rate differences in various jurisdictions |
(27,408 | ) | ||||||
| Non-deductible items |
28,642 | |||||||
| Functional currency adjustments |
(27,536 | ) | ||||||
| Valuation allowance |
(36,410 | ) | ||||||
| Other |
(34 | ) | ||||||
|
|
|
|
|
|||||
| Income tax expense at April 30, 2012 |
$ | (48,217 | ) | 157.2 | % | |||
|
|
|
|
|
|||||
The decrease in the income tax recovery as compared to fiscal 2011 was due primarily to an increase in the valuation allowance taken against deferred tax assets in certain jurisdictions, a decrease in rate differences in various jurisdictions, a decrease in non-deductible items and the impact of functional currency adjustments.
During the year, an adjustment was made to the opening balance of certain deferred tax assets due to a change in judgment about the realizability of these tax assets in future years that contributed to a net increase in the valuation allowance of $55.6 million. This was primarily in relation to deferred tax assets in Canada, Norway and the UK. This was offset by the reversal of certain valuation allowances in Brazil and Luxembourg. Brazil contributed to the decrease in the valuation allowance as a settlement was reached with the tax authorities that permitted interest and penalties related to certain non-income tax related liabilities to be settled using income tax losses of $20.0 million. A full valuation allowance was previously recognized against these income tax losses. In addition, we were able to reverse valuation allowances of $2.6 million representing $8.8 million of tax loss carry forwards as a result of a tax planning initiative related to Luxembourg. Also offsetting the increase was the impact of the capitalization of intercompany interest explained further below, for a net increase to the valuation allowance of $36.4 million.
Rate differences in various jurisdictions has decreased by $27.4 million as a lower proportion of our taxable profits were earned in low tax rate jurisdictions in the current year as compared to the prior year. Rate differences in various jurisdictions were impacted by an interest bearing inter- company loan that was capitalized towards the end of fiscal 2011, resulting in a reduction of interest expense in Luxembourg and interest income in Switzerland. As income in Switzerland is taxed at a comparatively low tax rate, this contributed to the decrease in rate differences in various jurisdictions. The capitalization of the loan also reduced the amount of deductible and non-deductible interest in Luxembourg and reduced the overall tax losses in this jurisdiction. As a valuation allowance was taken against deferred tax assets related to income tax losses in Luxembourg this transaction also contributed to a reduction in the valuation allowances that were taken when compared to the prior year. The capitalization of the inter-company loan also contributed to the $28.6 million decrease in non-deductible items. The income tax recovery decreased by $27.5 million due to foreign currency losses related to tax balances denominated in Norwegian Kroner, Euro and Canadian dollars in entities with a U.S. dollar functional currency.
Non-Controlling Interest
Net earnings allocated to non-controlling interest increased by $7.4 million to $12.4 million, due primarily to an increase in net earnings in EEA Helicopters Operations B.V. (“EHOB”).
Segmented Results of Operations
During fiscal 2012, the segmented results of operations were reclassified to reflect the revenues earned by the MRO segment on helicopter parts and supplies provided to Helicopter Services for use at the bases. These expenses are included as direct costs for Helicopter Services. The prior year comparatives have been reclassified to conform to the current year presentation.
30
Table of Contents
Helicopter Services
| For the fiscal year ended April 30, (In thousands of U.S. dollars) |
||||||||||||||||
| Favorable (Unfavorable) | ||||||||||||||||
| 2012 | 2011 | $ Change | % Change | |||||||||||||
| Third party revenue |
$ | 1,520,223 | $ | 1,311,983 | $ | 208,240 | 15.9 | % | ||||||||
| Internal revenue |
7,550 | 7,508 | 42 | 0.6 | % | |||||||||||
|
|
|
|
|
|
|
|
|
|||||||||
| Total revenue |
1,527,773 | 1,319,491 | 208,282 | 15.8 | % | |||||||||||
| Direct costs |
(1,117,216 | ) | (951,268 | ) | (165,948 | ) | -17.4 | % | ||||||||
| Earnings from equity accounted investees |
2,844 | 2,159 | 685 | 31.7 | % | |||||||||||
|
|
|
|
|
|
|
|
|
|||||||||
| Segment EBITDAR (adjusted) |
$ | 413,401 | $ | 370,382 | $ | 43,019 | 11.6 | % | ||||||||
| Segment EBITDAR (adjusted) Margin |
27.1 | % | 28.1 | % | -1.0 | % | -3.6 | % | ||||||||
| Flight Hours (unaudited) |
172,145 | 163,884 | 8,261 | 5.0 | % | |||||||||||
| # of Aircraft (unaudited) |
252 | 263 | (11 | ) | -4.2 | % | ||||||||||
| Aircraft lease and associated costs |
$ | (176,685 | ) | $ | (164,828 | ) | $ | (11,857 | ) | -7.2 | % | |||||
Helicopter Services segment EBITDAR (adjusted) has increased by $43.0 million to $413.4 million compared to fiscal 2011. The increase in segment EBITDAR (adjusted) is due primarily to the Western and Eastern North Sea, Australasia, and the Americas partially offset by the Africa-Euro Asia region. The North Sea contributed an additional $28.2 million due primarily to an increase in oil and gas activities in Scotland, England and Norway, where the availability of aircraft resulted in a significant increase in ad hoc flying hours. Australasia’s increase in segment EBITDAR (adjusted) of $13.3 million is due primarily to the margins from a new contract that began in April 2011 in Australia as all aircraft have been deployed in the current year combined with an increase in flying hours during the current year and other contract wins. In the prior year, Australia’s segment EBITDAR (adjusted) was lower as costs continued to be incurred on a lost customer contract. The segment EBITDAR (adjusted) increase in Australia is offset by Southeast Asia, where costs continued to be incurred on existing contracts with a reduction in flying hours and lost contracts. America’s segment EBITDAR (adjusted) increased by $5.7 million due primarily to new contracts in Brazil and margins from a new short-term contract in the Falkland Islands. The additional revenue earned in Brazil was offset by higher crew, base and support staff costs from a tight labor market, and aircraft availability issues from the supply of parts. The company continues to review its parts management and supply chain processes to support the growth in the region. The Africa-Euro Asia region had a net decrease in segment EBITDAR (adjusted) of $2.5 million, due primarily to Nigeria, offset by an increase in Mozambique, Kazakhstan, Tanzania, and Romania. Segment EBITDAR (adjusted) increased in Mozambique, Kazakhstan, Tanzania, and Romania as there was an increase oil and gas activities that generated new contracts. Segment EBITDAR (adjusted) has decreased in Nigeria as the Company exited its relationship with its previous partners thereby resulting in a decrease in flying hours and the redeployment of aircraft to other regions. We have engaged in discussions with a potential new partner in order to recommence our flying operations in Nigeria.
Aircraft leasing costs increased by $11.9 million to $176.7 million, due primarily to new technology aircraft additions that have higher lease costs partially offset by a number of aircraft that were converted to capital leases during fiscal 2012. We are continuing to acquire expensive new technology aircraft to meet our customers’ needs as they continue exploration and development into deeper waters. We anticipate we will continue to finance aircraft through operating leases and may make strategic decisions as required to purchase certain aircraft outright. The purchase of aircraft allows for greater jurisdictional flexibility as some lease agreements restrict the movement of aircraft to certain countries.
31
Table of Contents
MRO
| For the fiscal year ended April 30, (in thousands in U.S. dollars) |
||||||||||||||||
| Favorable (unfavorable) | ||||||||||||||||
| 2012 | 2011 | $ Change | % Change | |||||||||||||
| Third party revenue |
$ | 166,479 | $ | 129,222 | $ | 37,257 | 28.8 | % | ||||||||
| Internal Revenue |
275,920 | 238,397 | 37,523 | 15.7 | % | |||||||||||
|
|
|
|
|
|
|
|
|
|||||||||
| Total Revenue |
442,399 | 367,619 | 74,780 | 20.3 | % | |||||||||||
| Direct costs |
(353,485 | ) | (324,057 | ) | (29,428 | ) | -9.1 | % | ||||||||
|
|
|
|
|
|
|
|
|
|||||||||
| Segment EBITDAR (adjusted) |
$ | 88,914 | $ | 43,562 | $ | 45,352 | 104.1 | % | ||||||||
| Segment EBITDAR (adjusted) Margin |
20.1 | % | 11.8 | % | 8.3 | % | 70.3 | % | ||||||||
MRO generates the majority of its revenue by supporting the internal flying operations and is continuing to expand its services to third parties, which represent 37.6% of the total revenues. Segment EBITDAR (adjusted) increased by $45.4 million to $88.9 million compared to fiscal 2011. In fiscal 2011, the decrease in internal revenues from lower flying hours combined with the increase in labor and materials to service the higher level of unscheduled maintenance events on the internal fleet resulted in a decrease to the segment EBITDAR (adjusted), which did not reoccur in the current year. In fiscal 2012, there has been an increase in internal revenues to support the growth in Helicopter Services and a decrease in the level of unscheduled maintenance events on the internal fleet. The higher revenues in fiscal 2012 have contributed approximately $16.8 million in additional segment EBITDAR (adjusted). The higher margins earned on these revenues resulted in a positive impact on the segment EBITDAR (adjusted) margin of 3.1%. Lower costs in the current year combined with the termination of a third party PBH contract in April 2011 that earned negative margins from a high level of unscheduled maintenance events have contributed an additional $22.0 million in segment EBITDAR (adjusted) with a positive impact on the segment EBITDAR (adjusted) margin of 4.1%. Segment EBITDAR (adjusted) also increased by $4.0 million with a positive impact on the segment EBITDAR (adjusted) margin of 0.7% as costs incurred in the prior year related to inventory write-offs and consulting costs for strategic projects did not reoccur in the current year. In the current year, cost savings from the implementation of supply chain sourcing initiatives as part of the broad transformation program and vacant support positions that were not filled earlier in the year contributed an additional $2.5 million to segment EBITDAR (adjusted). These cost savings resulted in a positive impact to the segment EBITDAR (adjusted) margin of 0.4%. The MRO business is expected to continue to reduce costs and inventory levels through the implementation of lean process techniques to drive greater efficiencies in the workshops as part of the broad transformation program.
The Fiscal Year Ended April 30, 2011 Compared to the Fiscal Year Ended April 30, 2010
Consolidated Results of Operations
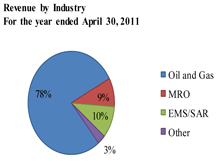
|
For the year ended April 30, (in thousands of U.S. dollars) |
|||||||||||||||||
| Favorable (Unfavorable) | ||||||||||||||||||
| 2011 | 2010 | $ Change | % Change | |||||||||||||||
| Helicopter services (i) | $ | 1,311,983 | $ | 1,186,898 | $ | 125,085 | 10.5 | % | ||||||||||
| MRO | 129,222 | 112,470 | 16,752 | 14.9 | % | |||||||||||||
| Corporate and other | 4,255 | 14,198 | (9,943 | ) | -70.0 | % | ||||||||||||
|
|
|
|
|
|
|
|
|
|||||||||||
| Total revenue | 1,445,460 | 1,313,566 | 131,894 | 10.0 | % | |||||||||||||
|
|
|
|
|
|
|
|
|
|||||||||||
| Direct costs (ii) | (1,046,852 | ) | (884,810 | ) | (162,042 | ) | -18.3 | % | ||||||||||
| Aircraft lease and associated costs |
(164,828 | ) | (145,072 | ) | (19,756 | ) | -13.6 | % | ||||||||||
|
|
|
|
|
|
|
|
|
|||||||||||
| Total direct costs | $ | (1,211,680 | ) | $ | (1,029,882 | ) | $ | (181,798 | ) | -17.7 | % | |||||||
|
|
|
|
|
|
|
|
|
|||||||||||
| Flying hours (unaudited) | 163,884 | 174,909 | (11,025 | ) | -6.3 | % | ||||||||||||
| # of aircraft (unaudited) | 263 | 278 | (15 | ) | -5.4 | % | ||||||||||||
| (i) | Includes revenue from the customer reimbursement of fuel costs of $66.7 million for the year ended April 30, 2011 and $54.3 million for the year ended April 30, 2010. |
32
Table of Contents
| (ii) | Includes $67.3 million in fuel costs for the year ended April 30, 2011 and $55.2 million for the year ended April 30, 2010. |
Revenue increased by $131.9 million to $1,445.5 million compared to fiscal 2010 due primarily to an increase in Helicopter Services of $125.1 million and MRO of $16.8 million, offset by a $10.0 million decrease in third party leasing revenues within Corporate and other. Helicopter Services’ revenue increased due primarily to new flying contracts in the Americas, the Eastern North Sea, Africa-Euro Asia and Australasia, offset by a decrease in the Western North Sea. The America’s contributed additional revenues of $54.5 million from the full year impact of a long-term contract in Brazil for nine new technology heavy aircraft. The Eastern North Sea contributed additional revenues of $47.3 million due to the full year impact of a long-term contract in Norway for twelve new technology heavy aircraft. Included in the Eastern North Sea revenues was the release of an off-market contract credit for $13.5 million which was realized in 2011 when the customer advised they would not be exercising a renewal option. The off-market credits were recognized on the date of acquisition and were originally valued under the assumption that the customer would exercise all optional contract renewals. Australasia’s revenues increased by $14.8 million due primarily to new oil and gas contracts and the start of a new long-term contract in April 2011. The increased revenues from these contracts were offset by the loss of a customer contract. Africa Euro-Asia’s revenues increased by $15.0 million due to increased oil and gas activity in Kazakhstan, Turkey and Tanzania that generated new contracts offset by a decrease in Nigeria. Nigeria’s revenue decreased by $17.0 million as the Company exited its relationship with its previous partners resulting in a decrease in flying hours and the redeployment of aircraft to other regions. Nigeria’s revenues also decreased as there was uncertainty in the collectability of the receivables that resulted in recognition of revenues on a cash basis beginning April 2010. The Western North Sea’s decrease in revenues of $6.6 million relates to lost contracts. MRO revenue has increased by $16.8 million due primarily to an increase in PBH contracts offset by a decrease in airframe revenues as there was less activity. Corporate and other, which earns incidental revenue leasing idle aircraft, has decreased due to the loss of a third party contract that has not been replaced. This resulted in the number of helicopters leased to third parties declining from twelve aircraft to six aircraft in 2011 and revenues declining accordingly.
Direct Costs
| For the year ended April 30, (in thousands of U.S. dollars) |
||||||||||||||||
| Favorable (Unfavorable) | ||||||||||||||||
| 2011 | 2010 | $ Change | % Change | |||||||||||||
| Crew costs |
$ | (358,184 | ) | $ | (321,434 | ) | $ | (36,750 | ) | -11.4 | % | |||||
| Base operations and other costs |
(294,187 | ) | (210,577 | ) | (83,610 | ) | -39.7 | % | ||||||||
| Maintenance |
(240,584 | ) | (206,566 | ) | (34,018 | ) | -16.5 | % | ||||||||
| Support costs |
(153,897 | ) | (146,233 | ) | (7,664 | ) | -5.2 | % | ||||||||
|
|
|
|
|
|
|
|
|
|||||||||
| $ | (1,046,852 | ) | $ | (884,810 | ) | $ | (162,042 | ) | -18.3 | % | ||||||
Direct costs increased by $162.0 million to $1,046.9 million compared to the prior year. The increase in direct costs is due primarily to an increase in crew costs, base operations and other costs and maintenance to support the growth in the flying operations and MRO.
Crew costs increased by $36.8 million to $358.2 million compared to fiscal 2010, due primarily to the hiring of additional crew for new and existing contracts in Brazil, Australia, Kazakhstan and Norway along with associated training costs of $21.5 million. Similarly, there were salary increases for existing crew. These increases in crew costs were partially offset by a restructuring of the UK operations, resulting in a decrease to crew costs of $7.6 million. Additional increases were due primarily to wage increases in other countries and numerous other smaller variances.
Base operations and other costs increased by $83.6 million to $294.2 million compared to fiscal 2010. Base operations and other costs also included costs re-chargeable to our customers, insurance and travel. New contracts in Brazil, Australia and Kazakhstan resulted in a cost increase of $13.2 million due to the set up costs for new bases, increased fuel for the new aircraft, accommodation costs for new base and crew employees and new base employees. Existing contracts increased $42.5 million due to an increase in fuel costs, landing costs and base costs as a result of additional flying hours and increases in the pricing of the service or commodity. In fiscal 2011, the base operations and other costs included a $10.2 million write-off of bid costs previously capitalized and the legal and consulting fees incurred in connection with the planned procurement of the UK SARH contract. Additional increases were due primarily to wage increases for base employees, fuel price increases and numerous other smaller variances.
Maintenance increased by $34.0 million to $240.6 million compared to fiscal 2010. MRO expenses increased due primarily to a higher level of scheduled maintenance events on the Company’s internal fleet during fiscal 2011 and combined with a higher level of unscheduled maintenance activity on third party PBH contracts.
33
Table of Contents
Aircraft Lease and Associated Costs
Aircraft leasing costs increased by $19.8 million to $164.8 million due primarily to fleet additions, the majority of which were in new technology aircraft with higher lease costs.
Earnings from Equity Accounted Investees
Earnings from equity accounted investees included in the Helicopter Services segment increased by $0.7 million to $2.2 million due primarily to an increase in earnings from Thai Aviation Services and Luchthaven Den Helder C.V.
General and Administration Costs
General and administration costs included in the Corporate and other segment increased by $4.2 million to $65.4 million compared to fiscal 2010, due primarily to an increase in consulting and legal fees.
Amortization
Amortization expense increased by $21.9 million to $99.6 million compared to fiscal 2010, due primarily to an increase in property and equipment balances. Of the fiscal 2011 amortization expense, $5.4 million related to the Helicopter Services segment, $56.2 million related to the MRO segment and $38.0 million related to the Corporate and other segment.
Restructuring Expense
In fiscal 2010, severance and termination costs related to restructuring activities in Helicopter Services and MRO were incurred, whereas in fiscal 2011, the restructuring was due to the relocation of the Australian office from Adelaide to Perth. The majority of the restructuring costs incurred during fiscal 2011 were related to severance and termination costs. Of the fiscal 2011 restructuring expense, $3.2 million related to the Helicopter Services segment, $1.4 million related to the MRO segment and the remainder with the Corporate and other segment.
Impairment of Receivables and Funded Residual Value Guarantees
Impairment of receivables and funded residual value guarantees decreased by $11.3 million to $1.9 million, due primarily to a decrease in the impairment of receivables of $9.5 million related to ACN and Heli-Van, which was recognized in fiscal 2010. The impairment of the receivables and funded residual value guarantees in fiscal 2011 related to the Corporate and other segment.
Impairment of Intangible Assets
Impairment of embedded equity, an intangible asset included in the Corporate and other segment, decreased by $33.3 million to $20.6 million compared to fiscal 2010, as aircraft values on older technology aircraft declined at a lower rate in fiscal 2011.
Impairment of Assets Held For Sale
Impairment of assets held for sale decreased by $21.3 million to $5.2 million compared to fiscal 2010. Impairment of assets held for sale related to older technology aircraft that were being sold to increase the mix of new aircraft technology. The impairment decreased as there were nine aircraft impaired compared to 26 aircraft in fiscal 2010, and the carrying value of aircraft in fiscal 2011 was lower than fiscal 2010 as an impairment loss was recognized at the end of fiscal 2010 on old technology aircraft. Of the fiscal 2011 impairment of the assets held for sale, $0.5 million related to the MRO segment and the remainder related to the Corporate and other segment.
Interest on Long-Term Debt
Interest on long-term debt increased by $21.9 million to $91.5 million compared to fiscal 2010 due primarily to the higher interest rate on the senior secured notes as compared to the senior credit facility.
Other Financing Charges
Other financing charges increased by $45.6 million to $67.0 million compared to fiscal 2010. The increase is due to the long-term debt refinancing which included a $62.4 million write-off of deferred financing fees on the senior credit facility and settlement of the interest rate swap offset by an increase in mark to market gains on the fair value of derivative instruments of $18.5 million.
Income Tax Recovery (Expense)
Income tax recovery increased by $42.2 million to $32.9 million compared to fiscal 2010. The effective tax rate for fiscal 2011 is 34.7%, as compared to 14.1% for fiscal 2010.
The decrease in the income tax expense as compared to the prior year is due primarily to a decrease in non-deductible items and functional currency adjustments, offset by an increase in rate differences in various jurisdictions and an increase in valuation allowances. The decrease in non-deductible items have reduced income tax expense by $30.1 million in fiscal 2011
34
Table of Contents
compared to fiscal 2010 due primarily to an increase in the proportion of interest recorded in Norway that was considered deductible in fiscal 2011. The foreign currency adjustments have decreased income tax expense by $45.6 million in fiscal 2011 as compared to fiscal 2010 due to functional currency adjustments related to tax balances denominated in Euros, Canadian dollars and the Brazilian Real in entities with a U.S. dollar functional currency. These decreases to the income tax expense were offset by increases to income tax expense from rate differences in various jurisdictions and an increase in the valuation allowance. Rate differences in various jurisdictions increased income tax expense by $12.2 million as a lower proportion of the Company’s taxable profits were earned in jurisdictions that have low tax rates in fiscal 2011. The increase in the valuation allowance of $19.2 million in fiscal 2011 compared to fiscal 2010 results primarily from the higher level of losses made in fiscal 2011 and in particular further valuation allowances which were taken against losses in Luxembourg.
Non-Controlling Interest
Net earnings allocated to non-controlling interest increased by $11.0 million to $5.1 million due primarily to an increase in net earnings in EHOB.
Segmented Results of Operations
During fiscal 2012, the segmented results of operations were reclassified to reflect the revenues earned by the MRO segment on helicopter parts and supplies provided to Helicopter Services for use at the bases. These expenses are included as direct costs for Helicopter Services. The prior year comparatives have been reclassified to conform to the current year presentation.
Helicopter Services
| For the year ended April 30, (in thousands of U.S. dollars) |
||||||||||||||||
| Favorable (Unfavorable) | ||||||||||||||||
| 2011 | 2010 | $ Change | % Change | |||||||||||||
| Third party revenue |
$ | 1,311,983 | $ | 1,186,898 | $ | 125,085 | 10.5 | % | ||||||||
| Internal revenue |
7,508 | 8,462 | (954 | ) | -11.3 | % | ||||||||||
|
|
|
|
|
|
|
|
|
|||||||||
| Total revenue |
1,319,491 | 1,195,360 | 124,131 | 10.4 | % | |||||||||||
| Direct Costs |
(951,268 | ) | (834,351 | ) | (116,917 | ) | -14.0 | % | ||||||||
| Earnings from equity accounted investees |
2,159 | 1,436 | 723 | 50.3 | % | |||||||||||
|
|
|
|
|
|
|
|
|
|||||||||
| Segment EBITDAR (adjusted) |
$ | 370,382 | $ | 362,445 | $ | 7,937 | 2.2 | % | ||||||||
|
|
|
|
|
|
|
|
|
|||||||||
| Segment EBITDAR (adjusted) margin |
28.1 | % | 30.3 | % | -2.2 | % | -7.3 | % | ||||||||
| Flying hours (unaudited) |
163,884 | 174,909 | (11,025 | ) | -6.3 | % | ||||||||||
| # of aircraft (unaudited) |
263 | 278 | (15 | ) | -5.4 | % | ||||||||||
| Aircraft lease and associated costs |
$ | (164,828 | ) | $ | (145,072 | ) | $ | (19,756 | ) | -13.6 | % | |||||
Helicopter Services segment EBITDAR (adjusted) increased by $7.9 million to $370.4 million compared to fiscal 2010. Segment EBITDAR (adjusted) for the Eastern North Sea increased by $23.4 million, due primarily to the margins from
35
Table of Contents
a contract in Norway for twelve heavy aircraft that were recognized for a full year in fiscal 2011 and a $13.5 million increase in revenues for the release of an off-market contract credit, which was realized in 2011 when the customer advised they would not be exercising a renewal option. The off-market credits were recognized on the date of acquisition and were originally valued under the assumption that the customer would exercise all optional contract renewals. The Americas contributed an additional $2.6 million in segment EBITDAR (adjusted) due primarily to the margins from a new long-term contract in Brazil for nine heavy aircraft for the full year as the aircraft deployment was staggered. These increases in segment EBITDAR (adjusted) were offset by decreases in segment EBITDAR (adjusted) from the Australasia region of $18.3 million as costs continued to be incurred in Australia following a lost customer contract.
Aircraft leasing costs increased by $19.8 million to $164.8 million, due primarily to fleet additions, the majority of which were in new technology aircraft with higher lease costs.
MRO
| For the year ended April 30, (in thousands of U.S. dollars) |
||||||||||||||||
| Favorable (Unfavorable) | ||||||||||||||||
| 2011 | 2010 | $ Change | % Change | |||||||||||||
| Third party revenue |
$ | 129,222 | $ | 112,470 | $ | 16,752 | 14.9 | % | ||||||||
| Internal revenue |
238,397 | 263,085 | (24,688 | ) | -9.4 | % | ||||||||||
|
|
|
|
|
|
|
|
|
|||||||||
| Total revenue |
367,619 | 375,555 | (7,936 | ) | -2.1 | % | ||||||||||
| Direct Costs |
(324,057 | ) | (312,431 | ) | (11,626 | ) | -3.7 | % | ||||||||
|
|
|
|
|
|
|
|
|
|||||||||
| Segment EBITDAR (adjusted) |
$ | 43,562 | $ | 63,124 | $ | (19,562 | ) | -31.0 | % | |||||||
|
|
|
|
|
|
|
|
|
|||||||||
| Segment EBITDAR (adjusted) margin |
11.8 | % | 16.8 | % | -5.0 | % | -29.8 | % | ||||||||
Segment EBITDAR (adjusted) for MRO decreased by $19.6 million to $43.6 million compared to fiscal 2010. Segment EBITDAR (adjusted) decreased in fiscal 2011 by $14.5 million due primarily to the negative margins from a third party PBH contract, which did not exist in the prior year, combined with the increase in labor and material costs from unscheduled maintenance events on the Company’s internal fleet. This resulting decrease in segment EBITDAR (adjusted) negatively impacted the segment EBITDAR (adjusted) margins by 4.0%. Segment EBITDAR (adjusted) also decreased by $4.0 million with a negative impact of 1.1% on the segment EBITDAR (adjusted) margin as costs incurred in fiscal 2011 related to inventory write-offs and consulting costs for strategic projects did not occur in fiscal 2010. The increase in direct costs have negatively impacted the segment EBITDAR (adjusted) margin in fiscal 2011 as there was insufficient incremental revenue to offset these costs.
FINANCIAL CONDITION AND SOURCES OF LIQUIDITY
Analysis of Historical Cash Flows
| For the year ended | ||||||||||||
| (in thousands of U.S. dollars) |
April 30, 2012 | April 30, 2011 | April 30, 2010 | |||||||||
| Cash provided by operating activities |
$ | 15,601 | $ | 42,290 | $ | 74,300 | ||||||
| Cash provided by (used in) financing activities |
207,215 | (3,005 | ) | 22,736 | ||||||||
| Cash used in investing activities |
(217,673 | ) | (160,755 | ) | (116,001 | ) | ||||||
| Effect of exchange rate changes on cash and cash equivalents |
(18,517 | ) | 15,431 | 853 | ||||||||
|
|
|
|
|
|
|
|||||||
| Change in cash and cash equivalents during the period |
$ | (13,374 | ) | $ | (106,039 | ) | $ | (18,112 | ) | |||
36
Table of Contents
For the Fiscal Years Ended April 30, 2012 and April 30, 2011
Cash Flows Provided By Operating Activities
Cash flows provided by operating activities decreased by $26.7 million to $15.6 million compared to fiscal 2011, despite the improvements in the operational results of Helicopter Services and MRO. The improvements in operational results provided an additional $44.1 million in operating cash flows, which was more than offset by an increase in cash interest of $23.4 million, an increase in the pension contributions of $14.4 million, an increase in fees paid to finance leased aircraft of $4.4 million and unfavorable movements in working capital of $22.6 million. Cash interest increased due primarily to the higher interest rate on the senior secured notes as compared to the previous credit facilities. The increase in pension contributions was due primarily to the pension asset redemption of $7.5 million that occurred in the prior year and an increase in pension contributions. The Norwegian plan contributions increased $3.7 million due to the timing of the funding and increase in the pension obligation while the UK plan funded an additional $1.5 million in contributions. The unfavorable working capital movements are due to an increase in current receivables that have been invoiced, but are not due based on the customers’ payment terms. The increase in receivables was partially offset by an increase in accounts payable due to the timing of supplier payments at quarter end as part of cash management and liquidity initiatives. The increase in receivables aged less than 30 days was due primarily to the operational improvements in helicopter services and the MRO business, where the increased oil and gas activities and new sales teams have increased receivable balances with existing and new customers in the current year. During the period, the Company was focused on reducing the cash used in operations through initiatives in the transformation program, including a reduction of overhead costs. These initiatives were designed to create greater profitability from operations, decrease the cash conversion cycle and reduce the overhead costs required to support current and future operations.
The Company has experienced declining cash flow from operating activities, and no assurance can be given that efforts to stem this decline, including efforts to achieve greater cost efficiencies through its broad transformation program, will be effective. The business may not generate sufficient net cash from operating activities and future borrowings may not be available in amounts sufficient to enable the Company to service its debt or to fund its other liquidity needs. It is currently expected that the net cash from operating activities will, together with the Company’s ability to access financing through the revolving line of credit, other financing markets, new operating leases and proceeds from the sale of aircraft and other assets be sufficient to meet the on-going cash flow requirements, if the Company is unable to meet its debt obligations or fund other liquidity needs, alternative financing plans may need to be undertaken, such as refinancing or restructuring debt, selling assets, reducing or delaying capital investments or raising additional capital. See “Risk Factors—Our indebtedness and lease obligations could adversely affect our business and liquidity position” above and “Liquidity and Sources of Liquidity” below.
Cash Flows Used In Financing Activities
Cash flows provided by financing activities increased by $210.2 million to $207.2 million compared to fiscal 2011, due primarily to an increase in the proceeds from the issuance of share capital of $100.0 million and the securitization of accounts receivables of $52.5 million from the inclusion of two additional entities in the program and a $32.1 million increase in the revolving credit facility net of repayments of long-term debt and capital leases. In addition, cash flows provided by financing have increased as there were costs incurred in the prior year related to the refinancing of the senior credit facilities of $25.6 million that did not reoccur in the current year. The refinancing costs included the write-off of unamortized transaction costs of $41.7 million and an increase in transaction fees for the senior secured notes of $45.7 million offset by the net proceeds from the long-term debt refinancing of $61.8 million.
37
Table of Contents
Cash Flows Used In Investing Activities
Cash flows used in investing activities increased by $56.9 million to $217.7 million compared to fiscal 2011, due primarily to an increase in property and equipment additions of $147.8 million, an increase in aircraft deposits net of lease inception refunds of $19.1 million and an increase in restricted cash of $17.9 million, offset by an increase in the proceeds from the disposal of property and equipment of $126.7 million. The increase in property and equipment results from the acquisition of new technology aircraft of $130.0 million combined with an increase in rotables of $14.1 million to support the new technology aircraft. Included in the aircraft additions is $97.0 million related to the buy-out of aircraft under operating leases as agreed during the 2011 lease covenant reset. During these negotiations in 2011, there were three lessors who took the opportunity as part of the covenant reset to exit the helicopter leasing market, requiring the Company to purchase these aircraft off lease in fiscal 2012. Management’s continued strategy is to primarily finance aircraft through leases and may make strategic decisions to continue to own certain of these aircraft outright for jurisdictional flexibility. Aircraft deposits increased as the Company advanced deposits for the purchase of the new technology aircraft. Restricted cash has increased as there was a delay in the payment for sold receivables as part of the accounts receivable securitization program. Proceeds on the disposal of aircraft increased due primarily to an increase in aircraft that were refinanced under sale and leaseback as part of the lease refinancing.
For the Fiscal Years Ended April 30, 2011 and April 30, 2010
Cash Flows Provided By Operating Activities
Net cash provided by operating activities decreased by $32.0 million to $42.3 million, due primarily to an increase in cash interest paid of $23.3 million and unfavorable working capital movements of $12.7 million, offset by a decrease in pension contributions of $3.8 million. The increase in cash interest paid was due to the refinancing of the Company’s senior credit facilities in October 2010 at a higher interest rate. The unfavorable working capital movements resulted in a decline in operating cash and were primarily the result of an increase in accounts receivable as the result of an increase in the receivables aged greater than 30 days due to certain new contracts in 2011 being slower in payment than existing contracts and due to increases in activity on certain existing contracts with customers that generally take more than 30 days to pay. This was partially offset by an increase in accounts payable due to delays in the timing of supplier payments around year end as the result of cash and liquidity management initiatives.
Cash Flows Used In Financing Activities
Cash flows used in financing activities increased $25.7 million to $3.0 million compared to the prior year due primarily to the decrease in cash flows from the securitization of accounts receivables, net of collections of $68.5 million, offset by a decrease in the redemption of ordinary shares of $20.0 million and an increase in the net proceeds from long-term debt. In October 2010, the Company refinanced its long-term debt by repaying the $1.02 billion senior credit facilities with the cash proceeds generated from the issuance of senior secured notes (“notes”) of $1.08 billion and entered into a new revolving credit facility agreement. As part of the long-term debt refinancing, the Company settled the interest rate swap related to the senior credit facilities for $45.7 million and paid $42.7 million in transaction costs to complete the issuance of the senior secured notes and the new revolving credit facility. The transaction costs are being amortized over the respective terms of the long-term debt obligations and resulted in a net cash outflow for financing activities in fiscal 2011.
Cash Flows Used In Investing Activities
Cash flows used in investing activities increased by $44.8 million to $160.8 million compared to the prior year due primarily to an increase in property and equipment additions of $66.1 million offset by a decrease in aircraft deposits net of lease inception refunds of $14.4 million and restricted cash of $8.6 million. Property and equipment additions increased as a greater number of higher cost new technology aircraft were purchased in the current year along with associated rotables to support the new technology aircraft. Aircraft deposits net of lease inceptions decreased as fewer deposits to purchase aircraft were made during the current year.
Liquidity and Sources of Liquidity
At April 30, 2012, our liquidity totaled $275.0 million, which was comprised of cash and cash equivalents of $56.0 million, unused capacity in the revolver of $165.0 million, net of letters of credit of $85.0 million and undrawn overdraft facilities of $54.0 million. During fiscal 2012, we entered into agreements with two new lenders to increase commitments under the existing revolving credit facility by $45.0 million up to $375.0 million. Our cash requirements include our normal operations as well as our debt and other contractual obligations as discussed under the caption “Future Cash Requirements” below. The senior secured notes have not materially increased overall indebtedness, but cash requirements have increased by approximately $40.0 million on an annual basis due to the higher interest payment obligations on the notes and the revolving credit facility. The ability to satisfy long-term debt obligations, including repayment of principal and interest will depend on future performance, which is subject to general economic conditions and other factors, some of which are beyond our control. We expect our earnings and cash flow to vary significantly from year to year due to the cyclical nature of the industry. As a result, the amount of debt that can be managed in some periods may not be appropriate in other periods. In addition, future cash flows may be insufficient to meet debt obligations and commitments, including the notes, and revolving credit facility. Any insufficiency could negatively impact the business. In addition, the indenture governing the notes allows us to incur additional indebtedness. The incurrence of additional indebtedness could negatively affect the repayment of principal and interest on the debt, including the notes. We may face delays in obtaining cash from our subsidiaries in certain jurisdictions to fund future cash requirements due to central banking legislation or other regulations in these jurisdictions. These restrictions have not and are not expected to have an impact on our ability to meet our obligations. We believe that our existing and
38
Table of Contents
future cash flows, as well as our ability to access financing through the revolving line of credit, other financing markets, new operating leases and proceeds from the sale of aircraft and other assets are sufficient to meet our on-going cash flow requirements. Similarly, we expect that our transformation program will generate new initiatives to create greater liquidity. However, our earnings have been insufficient to cover our fixed charges since 2008. If cash flow from operations is insufficient to satisfy the debt obligations, alternative financing plans may need to be undertaken, such as refinancing or restructuring the debt, selling assets, reducing or delaying capital investments or raising additional capital. Any alternative financing plans that may be undertaken by us, if necessary, may not be sufficient to meet our debt obligations. Our inability to generate sufficient cash flow to satisfy our debt obligations, including obligations under the notes, or to obtain alternative financing, could materially and adversely affect the business, financial condition, results of operations and prospects. See Item 1A “Risk Factors – Our indebtedness and lease obligations could adversely affect our business and liquidity position”.
Sources of Liquidity
During fiscal year 2011, we refinanced our capital structure to provide improved liquidity and operating flexibility through the issuance of $1.1 billion senior secured notes and a new $330.0 million revolving credit facility, which was increased to $375.0 million during fiscal 2012. At April 30, 2012, the availability on the revolving credit facility is $165.0, net of $85.0 million in outstanding letters of credit. The $1.1 billion aggregate principal amount of senior secured notes issued at 98.399% of par value, bear interest at 9.25%, with semi-annual interest payments on April 15 and October 15, and mature on October 15, 2020. The net proceeds of $1.08 billion from the issuance of the senior secured notes due 2020 were used to repay the outstanding balance on the senior credit facilities of $1.02 billion and settle the related interest rate swap for $45.7 million. The new revolving credit facility is held with a syndicate of financial institutions for a term of five years and bears interest at the alternate base rate, LIBOR, Canadian Prime Rate or EURIBOR, plus an applicable margin that ranges from 2.75% to 4.50%.
The revolving credit facility is secured on a super senior first priority basis and ranks equally with the note holders except for payments upon enforcement and insolvency, where the revolving credit facility will rank before the note holders. The notes and revolving credit facility are guaranteed on a first-priority lien basis by most of our subsidiaries through a general secured obligation. For information about the financial positions and results of operations of our non-guarantor subsidiaries, see Note 29 of our audited annual consolidated financial statements for the year ended April 30, 2012 included elsewhere in this Annual Report on Form 10-K.
During fiscal 2012, we received from our ultimate parent an additional equity injection of $100.0 million in share capital for growth. To assist with future growth opportunities, a key initiative of the transformation program is to create greater liquidity through the implementation of new cost control measures, the review of overall contract profitability and improved profit growth. During fiscal 2012, we also increased our liquidity by increasing the number of entities in the accounts receivable securitization program. Two new entities were added to the program, which in turn improved the cash advance rate thereby providing us with cash sooner to fund ongoing operations and growth. We also completed the sale and leaseback of our Canada MRO facility, Boundary Bay. A more detailed review of other sources of liquidity is currently underway to optimize the procurement of capital expenditures and inventory.
Future Cash Requirements
Contractual Obligations and Off-Balance Sheet Arrangements
The following table summarizes the contractual obligations and other commercial commitments on an undiscounted basis as of April 30, 2012 and the period that the contractual obligation or commitment is expected to be settled in cash.
| (in thousands of U.S. dollars) |
Total | Less than 1 year |
1-3 years | 4-5 years | More than 5 years |
|||||||||||||||
| Payables and accruals |
$ | 363,064 | $ | 363,064 | $ | — | $ | — | $ | — | ||||||||||
| Current facility secured by accounts receivable |
45,566 | 45,566 | — | — | — | |||||||||||||||
| Long-term debt and capital lease obligations (i) |
1,302,972 | 14,336 | 22,145 | 128,867 | 1,137,624 | |||||||||||||||
| Interest on long-term debt (ii) |
925,331 | 110,606 | 221,912 | 211,845 | 380,968 | |||||||||||||||
| Operating leases (iii) |
1,277,352 | 217,464 | 362,495 | 280,191 | 417,202 | |||||||||||||||
| New aircraft commitments |
558,000 | 118,600 | 160,000 | 279,400 | — | |||||||||||||||
| Other derivative financial instruments |
20,254 | 4,565 | 12,371 | 3,243 | 75 | |||||||||||||||
|
|
|
|
|
|
|
|
|
|
|
|||||||||||
| Total contractual obligations |
$ | 4,492,539 | $ | 874,201 | $ | 778,923 | $ | 903,546 | $ | 1,935,869 | ||||||||||
|
|
|
|
|
|
|
|
|
|
|
|||||||||||
| (i) | This excludes the unamortized discount on the senior secured notes of $15.9 million. |
| (ii) | Interest on variable rate debt was estimated based on applicable forward rates as of April 30, 2012. |
39
Table of Contents
| (iii) | See “Operating Lease Commitments” for a discussion of our efforts to obtain a long-term covenant reset and the size of our remaining operating lease portfolio. |
Operating Lease Commitments
The Company entered into aircraft operating leases with 18 lessors in respect of 164 aircraft included in the Company’s fleet as of April 30, 2012. As of April 30, 2012, these leases had expiry dates ranging from fiscal 2013 to 2022. The Company has the option to purchase the majority of the aircraft for agreed amounts that do not constitute bargain purchase options, but has no commitment to do so. With respect to such leased aircraft, substantially all of the costs of major inspections of airframes and the costs to perform inspections, major repairs and overhauls of major components are at the Company’s expense. The Company either performs this work internally through its own repair and overhaul facilities or has the work performed by an external repair and overhaul service provider.
At April 30, 2012, the Company had commitments with respect to operating leases for aircraft, buildings, land and equipment. Within the next twelve months, the Company does not expect to buy out a material number of expiring leases, as there are nine aircraft leases expiring in the next twelve months totaling $74.8 million. The Company has the option to refinance aircraft leases, purchase the aircraft or return the aircraft under the agreement terms.
The terms of certain of the Company’s helicopter lease agreements impose operating and financial limitations on the Company. Such agreements limit the extent to which the Company may, among other things, incur indebtedness and fixed charges relative to its level of consolidated adjusted earnings before interest, taxes, depreciation and amortization.
Generally, in the event of a covenant breach, a lessor has the option to terminate the lease and require the return of the aircraft, with the repayment of any arrears of lease payments plus the present value of all future lease payments and certain other amounts, which could be material to the Company’s financial position. The aircraft would then be sold and the surplus, if any, returned to the Company. Alternatively, the Company could exercise its option to purchase the aircraft.
Subsequent to April 30, 2012, a lessor that had been engaged in discussions with the Company approved a financial covenant reset to October 31, 2013. As part of previous negotiations in 2011 with this lessor, the Company also made a commitment to further reduce its total operating lease portfolio by $64.4 million.
Capital Commitments
As of April 30, 2012, the Company has committed to purchase 23 new aircraft. The total required additional expenditures related to these purchase commitments is approximately $558.0 million. These aircraft are expected to be delivered in fiscal 2013 ($118.6 million), 2014 ($160.0 million), 2015 to 2017 ($279.4 million) and will be deployed in the Company’s Helicopter Services segment.
On June 12, 2012, the Company committed to acquire 10 AW139 helicopters from AgustaWestland to be delivered between October 2012 and September 2014. In addition, the Company has options to acquire 16 additional AW139 helicopters. On June 13, 2012, the Company also exercised its option to acquire two additional EC225s from Eurocopter in addition to the twenty helicopters the Company committed to acquire in fiscal 2012.
Variable Interest Entities
The Company has variable interest in entities that are not consolidated, as we are not the primary beneficiary, which provide operating lease financing to us and an entity that provides flying services to third party customers. At April 30, 2012, the Company had operating leases for 33 aircraft with variable interest entities that were not consolidated. See Note 4 of the audited annual consolidated financial statements as of April 30, 2012 included elsewhere in this Annual Report on Form 10-K.
Guarantees
The Company has provided limited guarantees to third parties under some of its operating leases relating to a portion of the residual aircraft values at the termination of the leases. The leases have terms expiring between fiscal 2013 and 2022. At April 30, 2012, the Company’s exposure under the asset value guarantees including guarantees in the form of funded residual value guarantees, rebateable advance rentals and deferred payments is approximately $223.0 million.
Contingencies
The Company has exposure for certain legal matters as disclosed in Note 26 to the annual consolidated financial statements for the year ended April 30, 2012 included elsewhere in this Annual Report on Form 10-K. There have been no material changes in the exposures to contingencies.
40
Table of Contents
Covenants and Adjusted EBITDA
The Company’s notes, revolving credit facility, other long-term debt obligations and certain helicopter lease agreements impose operating and financial limitations on the Company through covenants, which among other things, limit the ability to incur additional indebtedness, create liens, sell or sublease assets, engage in mergers or acquisitions and make dividend and other payments.
Adjusted EBITDA is calculated by adding to or subtracting from net earnings (loss) certain of the adjustment items permitted in calculating covenant compliance under the indenture governing the notes. We describe these adjustments to net earnings (loss) in the table below. Adjusted EBITDA is a supplemental measure of our ability to service indebtedness that is not required by, or presented in accordance with, U.S. GAAP. Adjusted EBITDA is not a measurement of our financial performance under U.S. GAAP and should not be considered as an alternative to net earnings (loss) or other performance measures derived in accordance with U.S. GAAP, or as an alternative to cash flow from operating activities as a measure of our liquidity. In addition, Adjusted EBITDA as presented herein may not be comparable to similarly titled measures of other companies. Management believes that the presentation of Adjusted EBITDA included in this Annual Report on Form 10-K provides useful information to investors regarding our results of operations because it assists in analyzing and benchmarking the performance of our business. We will also use Adjusted EBITDA as a measure to calculate certain financial covenants related to our revolving credit facility and the notes indenture. Under the revolving credit facility agreement, the Company must maintain a minimum ratio of 2.5 to 1 of first priority net debt as defined in the revolving credit facility agreement to Adjusted EBITDA. If the financial covenant is not maintained, repayment of the revolving credit facility can be accelerated. Under the revolving credit facility agreement and notes indentures, the Company must meet certain Adjusted EBITDA ratios to incur additional indebtedness above the permitted indebtedness as defined in the revolving credit facility agreement and notes indenture. To incur additional indebtedness which is not otherwise permitted, the Company must have an Adjusted EBITDA to fixed charges ratio as defined in the revolving credit facility agreement and notes indenture that is equal to or greater than 2.0 to 1.0. However, if the indebtedness is secured by a lien then the Company must also have a total secured indebtedness, net of cash, to Adjusted EBITDA ratio as defined in the revolving credit facility agreement and notes indenture that is less than or equal to 5.0 to 1.0.
Adjusted EBITDA has limitations as an analytical tool, and you should not consider such measure either in isolation or as a substitute for net earnings (loss), cash flow or other methods of analyzing our results as reported under U.S. GAAP. Some of these limitations are:
| • | Adjusted EBITDA does not reflect changes in, or cash requirements for, our working capital needs; |
| • | Adjusted EBITDA does not reflect the cash requirements necessary to service principal payments, on our indebtedness; |
| • | Adjusted EBITDA does not reflect the cash requirements to pay our taxes; |
| • | Although depreciation and amortization are non-cash charges, the assets being depreciated and amortized will often have to be replaced in the future and Adjusted EBITDA does not reflect any cash requirements for such replacements; and |
| • | Adjusted EBITDA is not adjusted for all cash and non-cash income or expense items that are reflected in our statements of cash flow. |
Because of these limitations, Adjusted EBITDA should not be considered as discretionary cash available to us to reinvest in the growth of our business or as a measure of cash that will be available to us to meet our obligations.
Set forth below is a reconciliation of net loss to Adjusted EBITDA derived from the fiscal years ended April 30, 2012 and 2011. As of April 30, 2012, the Company was in compliance with all financial covenants contained in the agreements governing its outstanding indebtedness.
| For the year ended April 30, 2012 (unaudited) |
For the year ended April 30, 2011 (unaudited) |
|||||||
| (in thousands of U.S. dollars) | ||||||||
| Net loss |
$ | (95,000 | ) | $ | (65,269 | ) | ||
| Discontinued operations |
16,107 | 3,202 | ||||||
| Earnings from equity accounted investees, net of cash distributions received |
(1,710 | ) | (2,159 | ) | ||||
| Fixed charges (a) |
112,192 | 105,174 | ||||||
| Other financing charges |
17,653 | 35,408 | ||||||
| Income tax expense (recovery) |
48,217 | (32,916 | ) | |||||
| Amortization |
112,967 | 99,625 | ||||||
| Asset impairment charge (b) |
17,415 | 27,766 | ||||||
| Gain on disposal of assets |
(8,169 | ) | (7,193 | ) | ||||
| Restructuring costs |
12,269 | 13,026 | ||||||
| Business optimization costs |
19,315 | 9,596 | ||||||
| Stock-based compensation expense |
735 | 1,655 | ||||||
| Amortization of deferred charges (c) |
2,715 | 2,301 | ||||||
| Amortization of advanced aircraft rental payments |
4,999 | 2,947 | ||||||
| Unusual/non-recurring costs (d) |
— | 235 | ||||||
| Investment/acquisition/permitted disposal (e) |
139 | 20,914 | ||||||
| Pension adjustment (f) |
(1,118 | ) | 2,140 | |||||
| Pro-forma capital lease adjustment (g) |
— | 9,545 | ||||||
|
|
|
|
|
|||||
| Adjusted EBITDA (h) |
$ | 258,726 | $ | 225,997 | ||||
|
|
|
|
|
|||||
41
Table of Contents
| (a) | Fixed charges include interest expense, the interest component of payments associated with capital lease obligations, net of interest income, and pro-forma adjustments as per the Senior Secured Notes Trust Indenture. The amortization of debt issuance costs and financing fees are excluded from fixed charges. |
| (b) | Asset impairment charge includes impairment (recovery) of funded residual value guarantees, impairment of assets held for sale, and impairment of intangible assets. |
| (c) | Amortization of initial costs on leased aircraft. |
| (d) | Unusual or non-recurring costs that include professional fees. |
| (e) | Costs incurred related to potential investment, acquisitions, and divestures. |
| (f) | This is an adjustment to arrive at the current service cost of the pension. |
| (g) | This is a pro-forma adjustment as per the indenture governing the notes resulting from the capitalization of certain operating leases. |
| (h) | Adjusted EBITDA for the periods presented does not include the pro-forma effect of aircraft acquisitions or disposals. However, the new revolving credit facility and the indenture governing the notes offered herein permit us to calculate Adjusted EBITDA for purposes of the applicable covenants contained therein giving pro-forma effect to aircraft acquisitions, net of disposals. |
CRITICAL ACCOUNTING POLICIES AND ESTIMATES
The preparation of the financial statements requires management to make estimates and assumptions that affect the reported amounts of assets and liabilities and disclosure of contingent assets and liabilities at the dates of the financial statements and the reported amounts of revenue and expenses during the reporting periods. Areas where significant estimates and assumptions have been made include: classification of aircraft operating leases, consolidation of variable interest entities, property and equipment, goodwill, intangible and other long-lived asset impairment, pension benefits, contingent liabilities, income taxes and stock based compensation.
Classification of aircraft operating leases
In assessing the lease classification of an aircraft operating lease, management makes significant judgments and assumptions in determining the discount rate, fair value of the aircraft, estimated useful life and residual value. Changes in any of these assumptions at the lease inception or modification date could change the initial classification of the lease.
Consolidation of variable interest entities (“VIEs”)
The Company is required to consolidate a VIE if it is determined to be its primary beneficiary. Significant judgments are made in assessing whether the Company is the primary beneficiary, including determination of the activities that most significantly impact the VIE’s economic performance. This significant judgment is discussed further in Notes 2 and 4 to the Company’s audited annual consolidated financial statements for the year ended April 30, 2012 included elsewhere in this Annual Report on Form 10-K.
42
Table of Contents
Property and equipment
Flying assets are amortized to their estimated residual value over their estimated service lives using the straight-line method. The estimated service lives and associated residual values are based on management estimates including an analysis of future values of the aircraft and Company experience.
In addition, we review the carrying amounts of the property and equipment either on an annual basis or earlier when the asset is classified as held for sale or when events or circumstances indicate that the carrying amount of an asset may not be recoverable from the estimated future cash flows expected to result from its use and eventual disposition.
Long-lived assets that have been classified as held for sale are measured at the lower of their carrying amount or fair value less costs to sell and are not amortized once they are classified as held for sale. An impairment loss is recognized as the excess of the carrying amount over the fair value less costs to sell.
In the years ended April 30, 2012, April 30, 2011 and April 30, 2010, we have recognized impairment of $13.5 million, $5.2 million, and $26.6 million respectively on assets classified as held for sale.
Where events or circumstances indicate that the carrying amount of held for use assets may not be recoverable, the carrying value of the assets or asset groups is compared to the future projected undiscounted cash flows. We estimate the future projected undiscounted cash flows for aircraft at the aircraft type level as this is the lowest level which earns independent cash flows. The cash flows are based on management’s expectation of future revenues and expenses including costs to maintain the assets over their respective service lives. Revenues are derived from the contracts for each aircraft. Costs are based on the budgeted amounts for crew, aircraft lease costs, insurance, PBH, consignment inventory and any other cost directly related to the operation of the aircraft. An impairment loss is recognized as the excess of the carrying value over the fair value when an asset or asset group is not recoverable. Fair value is based on third party appraisals. Significant estimates and judgments are applied in determining these cash flows and fair values.
In the year ended April 30, 2010, we determined that the future projected undiscounted cash flows of several of our older technology aircraft did not support their carrying amounts due to reductions in their future projected undiscounted cash flows and market valuation and recognized impairment of $36.2 million. No impairment for long-lived assets held for use was recognized for the year ended April 30, 2011 as the future projected undiscounted cash flows of our older technology aircraft exceeded their carrying amounts by $366.9 million. For the year ended April 30, 2012, no impairment testing was performed as there were no indicators of impairment identified.
Goodwill and intangible asset impairment
Embedded Equity
Embedded equity in aircraft lease contracts was recognized on the acquisition of the Predecessor and represents the excess of the market price of the aircraft on the date of acquisition over the fixed lease buyout prices contained in certain aircraft operating leases.
We review the carrying amounts of the embedded equity in aircraft leases (intangible asset) on an ongoing basis to determine if the carrying amount is recoverable.
In testing the recoverability of embedded equity, the costs to buyout the lease is compared to the fair value of the aircraft. An impairment loss is recognized as the excess of the costs to buyout the lease over the fair value and is applied first to the embedded equity and then to the funded residual value guarantee. Fair value is based on third party appraisals.
In the years ended April 30, 2012, April 30, 2011 and April 30, 2010, we have recognized impairment of $4.2 million, $20.6 million and $53.9 million, respectively. The impairments are due to the fair value of the aircraft declining from when the embedded equity was first recognized at the time of the acquisition of the Predecessor.
Goodwill and Trade names and Trademarks
The recoverability of goodwill and indefinite life intangible assets is assessed on an annual basis or more frequently if events or circumstances indicate that the carrying value may not be recoverable. Goodwill is assessed for impairment at the reporting unit level by comparing the carrying value of the reporting units with their fair value.
The fair value of our reporting units is determined based on the present value of estimated future cash flows, discounted at a risk-adjusted rate. Management’s forecasts of future cash flows which incorporate anticipated future revenue growth and related expenses to support the growth and maintain its assets are used to calculate fair value. The discount rates used represent management’s estimate of the weighted average cost of capital for the reporting units considering the risks and uncertainty inherent in the cash flows of the reporting units and in our internally developed forecasts.
43
Table of Contents
During the year ended April 30, 2012, the Company changed its testing date from April 30 to February 1. The Company adopted this change in timing in order to ensure that the annual impairment test would be completed by the required filing date of the Company’s annual financial statements. At February 1, 2012, April 30 2011 and 2010, we performed our annual impairment test of goodwill. All of the Company’s goodwill is contained in the Helicopter Services reporting unit. No impairment has been recognized in the years ended April 30, 2012, April 30, 2011 and April 30, 2010 as the fair value of this reporting unit exceeded its carrying amount by $400.4 million, $77.2 million and $177.9 million respectively. In the event that the carrying value exceeded the fair value, we would have performed the second step in the two step impairment test to determine the amount of the impairment loss.
The fair value of our reporting units is most significantly affected by the discount rate used, the expected future cash flows and the long-term growth rate. The Company operates in a competitive environment and derives a significant portion of revenue from the offshore oil and gas industry. The ability to win new contracts, retain existing customers as well as the continued demand for flying services in the oil and gas market will affect the Company’s future cash flows and future growth. Relatively minor changes in future cash flows, growth rates and discount rates could significantly affect the estimate of reporting unit fair value and the amount of impairment loss recognized, if any.
If the discount rates used in the Company’s goodwill impairment test were to increase by 0.5% the fair value of the goodwill would have exceeded the carrying value by $265.0 million, $48.4 million and $73.7 million as of April 30, 2012, April 30, 2011 and April 30, 2010 respectively.
No impairment has been recognized in the years ended April 30, 2012, April 30, 2011 and April 30, 2010 for trademarks and trade names as the fair value exceeded the carrying value by $26.1 million, $3.7 million and $52.3 million respectively.
Pension benefits
The Company maintains both funded and unfunded defined benefit employee pension plans. Approximately 30% of the Company’s active employees are covered by defined benefit pension plans. As of April 30, 2012, the Company had an unfunded deficit of $88.3 million compared to $88.6 million at April 30, 2011. The pension expense for fiscal 2012 was $15.6 million, compared to $22.0 million for fiscal 2011. The overall asset mix was 21% equities, 58% fixed income and 21% money market as of April 30, 2012. This asset mix varies by each plan.
Measuring the Company’s obligations under the plans and related periodic pension expense involves significant estimates. Our pension benefit costs are accrued based on our review of annual analyses performed by our actuaries. These factors include assumptions about the rate at which the pension obligation is discounted, the expected long-term rate of return on plan assets, the rate of future compensation increases and mortality rates. Both the discount rate and expected rate of return on plan assets require estimates and projections by management and can fluctuate from period to period. The Company has determined the discount rate using market based data in consultation with its actuaries. The overall expected long-term rates of return on plan assets have been determined in part by assessing current and expected asset allocations as well as historical and expected returns on various categories of the assets. Such expected rates of return ignore short-term fluctuations. We believe these assumptions are appropriate based upon the mix of the investments and the long-term nature of the plans’ investments.
The weighted average discount rate of the various pension plans used to determine the pension benefit obligation was 4.40% as of April 30, 2012 compared to 5.35% as of April 30, 2011. The weighted average discount rate used to determine the pension expense is 4.98% as of April 30, 2012 compared to 4.97% at April 30, 2011.
The calculation of the estimate of the expected long-term rate of return on assets and additional discussion regarding pension and other postretirement plans is described in Note 20—Employee pension plans to our audited consolidated financial statements included elsewhere in this Annual Report on Form 10-K. The weighted average expected long-term rate of return on assets associated with our pension benefits was 5.60% at April 30, 2012 and 6.11% at April 30, 2011. The expected return on assets is a long-term assumption whose accuracy can only be measured over a long period based on past experience.
The actuarial assumptions used to determine pension benefits may differ from actual results due to changing market and economic conditions, higher or lower withdrawal rates or longer or shorter life spans of participants. Differing estimates may have a material impact on the amount of pension expense recorded and on the carrying value of prepaid pension costs and accrued pension obligations.
Contingent liabilities
We are subject to a variety of claims, lawsuits and investigations in the ordinary course of business as discussed in Note 26 to the Company’s audited annual consolidated financial statements for the year ended April 30, 2012 included elsewhere in this Annual Report on Form 10-K. We determine whether an estimated loss from a contingency should be
44
Table of Contents
accrued by assessing whether a loss is deemed probable and can be reasonably estimated. Estimating liabilities and costs associated with these matters requires judgment and assessment based upon professional knowledge, experience of management and our internal and external legal counsel.
Income taxes
The Company is subject to taxes in numerous foreign jurisdictions. Income and other tax risks recognized in the Consolidated Financial Statements reflect management’s best estimate of the outcome based on the facts known at the balance sheet date in each individual country. These facts may include, but are not limited to, change in tax laws and interpretation thereof in the various jurisdictions where the Company operates. They may have an impact on the income tax as well as the resulting assets and liabilities. Any differences between tax estimates and final tax assessments are charged to the statement of operations in the period in which they are incurred.
In addition, the Company’s business and operations are complex and include a number of significant financings, acquisitions and dispositions. The determination of earnings, payroll and other taxes involves many factors including the interpretation of tax legislation in multiple jurisdictions in which the Company is subject to ongoing tax assessments. When applicable, the Company adjusts the previously recorded income tax expense, direct costs, interest and the associated assets and liabilities to reflect its change in estimates or assessments. These adjustments could materially change the Company’s results of operations.
The Company has assessed the realization of the deferred income tax asset (net of allowance) related to income tax losses as more likely than not that the asset will be realized. Judgment is required in determining whether the deferred tax assets will be realized in full or in part. At April 30, 2012, the Company had a valuation allowance of $227.8 million. The realization of the deferred tax asset was based on assumptions regarding the reversal of existing future tax liabilities and future earnings levels in the subsidiaries with accumulated losses, and an ability to implement tax planning measures. If, in the future, it is determined that it is more likely than not that all or part of the future tax asset will not be realized, a charge will be made to earnings in the period when such determination is made.
Stock based compensation
On December 30, 2011, the Company’s parent adopted a new equity compensation plan which permits the grant of time and performance options, performance options and restricted share units to eligible employees, directors or consultants of the Parent and its affiliates. The terms of the options are described in Note 19 of the Company’s annual audited consolidated financial statements for the fiscal year ended April 30, 2012 included elsewhere in this Annual Report on Form 10-K.
We estimate the grant date fair value of stock options using a Monte-Carlo simulation model. The key factors that will create value in these awards include: (1) the year of an Exit Event (either an initial public offering or subsequent public offering of the equity of the Company or the merger, consolidation, sale of interests or sale of assets of the Company), (2) the probability that an Exit Event will occur in a particular year, which is based on management’s assessment of when this is likely to occur, (3) the risk free interest rate, which is based on the U.S. Treasury yield curve in effect at the time of grant with maturities equal to the grant’s expected life and (4) the ultimate exit value of the Company, which is estimated using historical volatility and implied volatility data of ten peer companies’ stock price. If any of the assumptions used in the Monte Carlo simulation model changes significantly, stock-based compensation for future awards may differ materially compared with the awards granted previously.
We have determined that not being able to exercise the options until an Exit Event has occurred that results in the investors recovering their initial investment meets the definition of a performance condition. As of April 30, 2012, we have determined that it is not probable that the performance condition will occur and therefore, no stock compensation expense has been recognized to date.
Recent Accounting Pronouncements
See Note 2 in the audited annual consolidated financial statements for the fiscal year ended April 30, 2012 contained elsewhere in this Annual Report on Form 10-K for a discussion of recent accounting pronouncements.
45
Table of Contents
| Item 7A. | Quantitative and qualitative disclosures about market risk |
Interest Rate Risk
As of April 30, 2012 we have $1,260.1 million of debt outstanding excluding capital leases, $138.2 million of which carries a variable rate of interest. The fair value of our fixed rate long-term debt fluctuates with changes in interest rates and has been estimated based on quoted market prices.
The following table provides information about our interest rate sensitive financial instruments by expected maturity date as of April 30, 2012.
| (in thousands of U.S. dollars) (unaudited) |
2013 | 2014 | 2015 | 2016 | 2017 | thereafter | Fair value | |||||||||||||||||||||
| Long-term debt |
||||||||||||||||||||||||||||
| Fixed rate |
$ | 1,259 | 152 | 165 | 179 | 195 | $ | 1,135,878 | $ | 1,129,578 | ||||||||||||||||||
| Average interest rate |
2.5 | % | 6.93 | % | 6.93 | % | 6.93 | % | 6.93 | % | 9.18 | % | ||||||||||||||||
| Variable rate |
2,844 | 2,844 | 2,295 | 126,747 | 1,746 | 1,746 | 138,221 | |||||||||||||||||||||
| Average interest rate |
3.77 | % | 3.67 | % | 4.08 | % | 4.49 | % | 3.13 | % | 3.50 | % | ||||||||||||||||
Foreign Currency Risk
The Company is exposed to foreign exchange risk primarily from its subsidiaries which incur revenue and operating expenses in currencies other than U.S. dollars with the most significant being Pound Sterling, Norwegian Kroner, Canadian dollars, Australian dollars and Euros. The Company monitors these exposures through its rigorous cash forecasting process and regularly enters into foreign exchange forward contracts to manage its exposure to fluctuations in expected future cash flows from foreign operations and anticipated transactions in currencies other than the functional currency. In particular, the Company has entered into forward foreign exchange contracts to manage its exposure to anticipated payroll transaction costs incurred in Canadian dollars and aircraft purchase commitments incurred in Euros. In addition, the Company manages its exposure to foreign operations by attempting to match the contract currency for its flying services contracts with currency of the underlying costs of providing the services whenever possible.
The following tables provide information about our foreign exchange sensitive financial instruments, all of which are recorded in entities with U.S. functional currency, by expected maturity as of April 30, 2012:
| (in thousands of U.S. dollars) (unaudited) |
2013 | 2014 | 2015 | 2016 | 2017 | thereafter | Fair value | |||||||||||||||||||||
| Long-term debt denominated in foreign currencies: |
|
|||||||||||||||||||||||||||
| Variable rate (CAD) |
$ | 2,844 | $ | 2,844 | $ | 2,295 | $ | 1,746 | $ | 1,746 | $ | 1,746 | $ | 13,221 | ||||||||||||||
| Average interest rate |
2.54 | % | 2.25 | % | 2.77 | % | 2.95 | % | 3.13 | % | 3.50 | % | ||||||||||||||||
| Fixed rate (CAD) |
(3,364 | ) | 152 | 165 | 179 | 195 | 35,878 | 33,205 | ||||||||||||||||||||
| Average interest rate |
6.93 | % | 6.93 | % | 6.93 | % | 6.93 | % | 6.93 | % | 6.93 | % | ||||||||||||||||
| Forward contracts to sell U.S. dollars and buy foreign currencies: |
|
|||||||||||||||||||||||||||
| Notional amount |
CAD 114,580 | CAD 93,922 | CAD 42,000 | — | — | — | $ | 6,743 | ||||||||||||||||||||
| Average contract rate |
1.04 | 1.01 | 1.02 | — | — | — | ||||||||||||||||||||||
| Notional amount |
€ | 16,872 | — | — | — | — | — | (1,551) | ||||||||||||||||||||
| Average contract rate |
1.42 | — | — | — | — | — | ||||||||||||||||||||||
46
Table of Contents
The following tables provide information about our foreign exchange sensitive financial instruments, all of which are recorded in entities with Pound Sterling functional currency, by expected maturity as of April 30, 2012:
| (in thousands of U.S. dollars) (unaudited) |
2013 | 2014 | 2015 | 2016 | 2017 | thereafter | Fair value | |||||||||||||||||||||
| Long-term debt denominated in foreign currencies: |
||||||||||||||||||||||||||||
| Fixed rate (EUR) |
4,623 | — | — | — | — | — | 4,623 | |||||||||||||||||||||
| Average interest rate |
2.5 | % | — | — | — | — | — | |||||||||||||||||||||
Firmly committed sales contracts, forecasted payroll transactions and aircraft purchase commitments denominated in foreign currencies are not included in the above table. Trade accounts payable and receivable have been excluded because their carrying amounts approximate fair value.
Credit Risk
The Company is exposed to credit risk on its financial investments due to counterparties’ ability to fulfill their obligations to the Company. The Company manages credit risk by entering into arrangements with established counterparties and through the establishment of credit policies and limits, which are applied in the selection of counterparties.
Credit risk on financial instruments arises from the potential for counterparties to default on their contractual obligations and is limited to those contracts where the Company would incur a loss in replacing the instrument. The Company limits its credit risk by dealing only with counterparties that possess investment grade credit ratings and monitors its concentration risk with counterparties on an ongoing basis. The carrying amount of financial assets represents the maximum credit exposure for financial assets.
Credit risk arises on the Company’s trade receivables from the unexpected loss in cash and earnings when a customer cannot meet its obligation to the Company or the value of security provided declines. To mitigate trade credit risk, the Company has developed credit policies which include the review, approval and monitoring of new customers, annual credit evaluations and credit limits.
| Item 8. | Financial statements and supplementary data |
The financial statements required by this item may be found on pages F-1 through F-71 of this Annual Report on Form 10-K.
47
Table of Contents
Index to consolidated financial statements
| Page | ||||
| Audited annual consolidated financial statements |
||||
| F-2 | ||||
| Consolidated balance sheets as of April 30, 2011 and April 30, 2012 |
F-3 | |||
| F-4 | ||||
| F-5 | ||||
| Consolidated statements of shareholder’s equity for the fiscal years ended April 30, 2010, April 30, 2011 and April 30, 2012 | F-7 | |||
| F-8 | ||||
F-1
Table of Contents
Report of Independent Registered Public Accounting Firm
To the Board of Directors and Shareholder of 6922767 Holding S.à.r.l.
We have audited the accompanying consolidated balance sheets of 6922767 Holding S.à.r.l. (the “Company”) as of April 30, 2012 and 2011, and the related consolidated statements of operations, shareholder’s equity, and cash flows for each of the three years in the period ended April 30, 2012. These financial statements are the responsibility of the Company’s management. Our responsibility is to express an opinion on these financial statements based on our audits.
We conducted our audits in accordance with the standards of the Public Company Accounting Oversight Board (United States). Those standards require that we plan and perform the audit to obtain reasonable assurance about whether the financial statements are free of material misstatement. We were not engaged to perform an audit of the Company’s internal control over financial reporting. Our audits included consideration of internal control over financial reporting as a basis for designing audit procedures that are appropriate in the circumstances, but not for the purpose of expressing an opinion on the effectiveness of the Company’s internal control over financial reporting. Accordingly, we express no such opinion. An audit also includes examining, on a test basis, evidence supporting the amounts and disclosures in the financial statements, assessing the accounting principles used and significant estimates made by management, and evaluating the overall financial statement presentation. We believe that our audits provide a reasonable basis for our opinion.
In our opinion, the financial statements referred to above present fairly, in all material respects, the consolidated financial position of the Company at April 30, 2012 and 2011, and the consolidated results of its operations and its cash flows for each of the three years in the period ended April 30, 2012, in conformity with U.S. generally accepted accounting principles.
/s/ Ernst & Young LLP
Chartered Accountants
Vancouver, Canada
July 10, 2012
F-2
Table of Contents
Consolidated Balance Sheets
(Expressed in thousands of United States dollars)
April 30, 2012, with comparative information for 2011
| 2012 | 2011 | |||||||
| Assets |
||||||||
| Current assets: |
||||||||
| Cash and cash equivalents |
$ | 55,547 | $ | 68,921 | ||||
| Receivables, net of allowance for doubtful accounts of $2.6 million and $0.5 million, respectively (notes 4 and 12) |
266,115 | 222,565 | ||||||
| Income taxes receivable |
20,747 | 11,457 | ||||||
| Deferred income tax assets (note 17) |
8,542 | 7,596 | ||||||
| Inventories (note 11) |
90,013 | 102,224 | ||||||
| Prepaid expenses |
21,183 | 17,853 | ||||||
| Other assets (note 13) |
33,195 | 36,234 | ||||||
|
|
|
|
|
|||||
| 495,342 | 466,850 | |||||||
| Property and equipment, net (note 6) |
1,026,860 | 1,133,499 | ||||||
| Investments (note 10) |
24,226 | 23,548 | ||||||
| Intangible assets (note 8) |
217,890 | 243,184 | ||||||
| Goodwill (note 9) |
433,811 | 448,121 | ||||||
| Restricted cash |
25,994 | 13,219 | ||||||
| Other assets (note 13) |
363,103 | 319,053 | ||||||
| Deferred income tax assets (note 17) |
48,943 | 90,882 | ||||||
| Assets held for sale (note 7) |
79,813 | 49,799 | ||||||
|
|
|
|
|
|||||
| $ | 2,715,982 | $ | 2,788,155 | |||||
|
|
|
|
|
|||||
| Liabilities and Shareholder’s Equity |
||||||||
| Current liabilities: |
||||||||
| Payables and accruals |
$ | 363,064 | $ | 364,848 | ||||
| Deferred revenue |
23,737 | 24,183 | ||||||
| Income taxes payable |
43,581 | 29,132 | ||||||
| Deferred income tax liabilities (note 17) |
11,729 | 13,035 | ||||||
| Current facility secured by accounts receivable (note 4) |
45,566 | 21,571 | ||||||
| Other liabilities (note 14) |
23,648 | 32,306 | ||||||
| Current portion of long-term debt (note 15) |
17,701 | 106,642 | ||||||
|
|
|
|
|
|||||
| 529,026 | 591,717 | |||||||
| Long-term debt (note 15) |
1,269,379 | 1,184,844 | ||||||
| Liabilities held for sale (note 7) |
— | 1,608 | ||||||
| Deferred revenue |
43,517 | 37,799 | ||||||
| Other liabilities (note 14) |
191,521 | 188,654 | ||||||
| Deferred income tax liabilities (note 17) |
20,072 | 36,170 | ||||||
|
|
|
|
|
|||||
| Total liabilities |
2,053,515 | 2,040,792 | ||||||
| Redeemable non-controlling interests |
1,675 | 3,087 | ||||||
| Capital stock: Par value 1 Euro; |
||||||||
| Authorized and issued: |
||||||||
| 1,228,377,770 and 1,184,793,767, respectively (note 18) |
1,607,101 | 1,547,101 | ||||||
| Contributed surplus |
55,318 | 14,583 | ||||||
| Deficit |
(940,031 | ) | (832,609 | ) | ||||
| Accumulated other comprehensive earnings (loss) |
(61,596 | ) | 15,201 | |||||
|
|
|
|
|
|||||
| $ | 2,715,982 | $ | 2,788,155 | |||||
|
|
|
|
|
|||||
See accompanying notes to consolidated financial statements.
F-3
Table of Contents
Consolidated Statements of Operations
(Expressed in thousands of United States dollars)
| For the year ended | ||||||||||||
| April 30, 2012 |
April 30, 2011 |
April 30, 2010 |
||||||||||
| Revenue |
$ | 1,692,539 | $ | 1,445,460 | $ | 1,313,566 | ||||||
| Operating expenses: |
||||||||||||
| Direct costs |
(1,381,900 | ) | (1,211,680 | ) | (1,029,882 | ) | ||||||
| Earnings from equity accounted investees |
2,844 | 2,159 | 1,436 | |||||||||
| General and administration costs |
(69,590 | ) | (65,391 | ) | (61,157 | ) | ||||||
| Amortization (note 6) |
(112,967 | ) | (99,625 | ) | (77,738 | ) | ||||||
| Restructuring costs (note 5) |
(22,511 | ) | (4,751 | ) | (4,855 | ) | ||||||
| Recovery (impairment) of receivables and funded residual value guarantees |
272 | (1,919 | ) | (13,266 | ) | |||||||
| Impairment of intangible assets (note 8) |
(4,218 | ) | (20,608 | ) | (53,903 | ) | ||||||
| Impairment of property and equipment |
— | — | (36,240 | ) | ||||||||
| Impairment of assets held for sale (note 7) |
(13,469 | ) | (5,239 | ) | (26,585 | ) | ||||||
| Gain (loss) on disposal of assets |
8,169 | 7,193 | (2,686 | ) | ||||||||
|
|
|
|
|
|
|
|||||||
| (1,593,370 | ) | (1,399,861 | ) | (1,304,876 | ) | |||||||
|
|
|
|
|
|
|
|||||||
| Operating income |
99,169 | 45,599 | 8,690 | |||||||||
| Interest on long-term debt |
(116,578 | ) | (91,462 | ) | (69,520 | ) | ||||||
| Foreign exchange gain |
1,795 | 17,916 | 16,520 | |||||||||
| Other financing charges (note 16) |
(15,062 | ) | (67,036 | ) | (21,459 | ) | ||||||
|
|
|
|
|
|
|
|||||||
| Loss from continuing operations before income tax |
(30,676 | ) | (94,983 | ) | (65,769 | ) | ||||||
| Income tax recovery (expense) (note 17) |
(48,217 | ) | 32,916 | (9,297 | ) | |||||||
|
|
|
|
|
|
|
|||||||
| Loss from continuing operations |
(78,893 | ) | (62,067 | ) | (75,066 | ) | ||||||
| Loss from discontinued operations, net of tax (note 7) |
(16,107 | ) | (3,202 | ) | (1,436 | ) | ||||||
|
|
|
|
|
|
|
|||||||
| Loss for the year |
$ | (95,000 | ) | $ | (65,269 | ) | $ | (76,502 | ) | |||
|
|
|
|
|
|
|
|||||||
| Net earnings (loss) attributable to: |
||||||||||||
| Controlling interest |
$ | (107,422 | ) | $ | (70,338 | ) | $ | (70,607 | ) | |||
| Non-controlling interest |
12,422 | 5,069 | (5,895 | ) | ||||||||
|
|
|
|
|
|
|
|||||||
| Loss for the year |
$ | (95,000 | ) | $ | (65,269 | ) | $ | (76,502 | ) | |||
|
|
|
|
|
|
|
|||||||
See accompanying notes to consolidated financial statements.
F-4
Table of Contents
Consolidated Statements of Cash Flows
(Expressed in thousands of United States dollars)
| For the year ended | ||||||||||||
| April 30, 2012 |
April 30, 2011 |
April 30, 2010 |
||||||||||
| Cash provided by (used in): |
||||||||||||
| Operating activities: |
||||||||||||
| Loss for the year |
$ | (95,000 | ) | $ | (65,269 | ) | $ | (76,502 | ) | |||
| Loss from discontinued operations, net of tax |
(16,107 | ) | (3,202 | ) | (1,436 | ) | ||||||
|
|
|
|
|
|
|
|||||||
| Net loss from continuing operations |
(78,893 | ) | (62,067 | ) | (75,066 | ) | ||||||
| Adjustments to reconcile net loss to cash flows provided by (used in) operating activities: |
||||||||||||
| Amortization |
112,967 | 99,625 | 77,738 | |||||||||
| Loss (gain) on disposal of assets |
(8,169 | ) | (7,193 | ) | 2,686 | |||||||
| Impairment (recovery) of receivables and funded residual value guarantees |
(272 | ) | 1,919 | 13,266 | ||||||||
| Impairment of intangible assets |
4,218 | 20,608 | 53,903 | |||||||||
| Impairment of assets held for sale |
13,469 | 5,239 | 26,585 | |||||||||
| Impairment on property and equipment |
— | — | 36,240 | |||||||||
| Earnings from equity accounted investees |
(2,844 | ) | (2,159 | ) | (1,436 | ) | ||||||
| Deferred income taxes |
32,172 | (37,142 | ) | (35,334 | ) | |||||||
| Non-cash stock-based compensation expense |
735 | 1,655 | 4,017 | |||||||||
| Amortization of unfavorable contract credits |
(11,548 | ) | (22,868 | ) | (8,937 | ) | ||||||
| Amortization of lease related fixed interest rate obligations |
(3,265 | ) | (3,920 | ) | (7,191 | ) | ||||||
| Amortization of long-term debt and lease deferred financing costs |
8,813 | 7,795 | 7,392 | |||||||||
| Write-off of unamortized transaction costs on the senior facility agreement |
— | 47,140 | — | |||||||||
| Non-cash accrued interest income on funded residual value guarantees receivable |
(7,358 | ) | (6,923 | ) | (5,592 | ) | ||||||
| Mark to market loss on derivative instruments |
5,380 | 9,350 | 11,478 | |||||||||
| Non-cash defined benefit pension expense |
15,573 | 21,966 | 22,532 | |||||||||
| Defined benefit contributions and benefits paid |
(44,480 | ) | (30,117 | ) | (33,896 | ) | ||||||
| Unrealized loss (gain) on foreign currency exchange translation |
(1,965 | ) | 8,529 | 9,300 | ||||||||
| Increase to deferred lease financing costs |
(6,981 | ) | (2,621 | ) | (16,699 | ) | ||||||
| Other |
10,675 | 6,168 | (3,993 | ) | ||||||||
| Decrease in cash resulting from changes in operating assets and liabilities (note 22) |
(22,626 | ) | (12,694 | ) | (2,693 | ) | ||||||
|
|
|
|
|
|
|
|||||||
| Cash provided by operating activities |
15,601 | 42,290 | 74,300 | |||||||||
|
|
|
|
|
|
|
|||||||
F-5
Table of Contents
6922767 HOLDING S.à.r.l.
Consolidated Statements of Cash Flows (continued)
(Expressed in thousands of United States dollars)
| For the year ended | ||||||||||||
| April 30, 2012 |
April 30, 2011 |
April 30, 2010 |
||||||||||
| Financing activities: |
||||||||||||
| Redemption of capital stock |
$ | — | $ | — | $ | (20,000 | ) | |||||
| Sold interest in accounts receivable, net of collections |
27,203 | (25,309 | ) | 43,214 | ||||||||
| Proceeds from the senior secured notes |
— | 1,082,389 | — | |||||||||
| Repayment of the senior credit facility debt |
— | (1,020,550 | ) | — | ||||||||
| Redemption of senior subordinated notes |
— | (129 | ) | — | ||||||||
| Settlement of the interest rate swap and other breakage fees |
— | (45,711 | ) | — | ||||||||
| Long-term debt proceeds |
867,853 | 262,800 | 275,919 | |||||||||
| Long-term debt repayments |
(786,808 | ) | (213,920 | ) | (276,215 | ) | ||||||
| Senior secured notes, senior credit facility and revolver deferred financing costs |
(1,033 | ) | (42,721 | ) | (182 | ) | ||||||
| Proceeds from the issuance of capital stock |
100,000 | 146 | — | |||||||||
|
|
|
|
|
|
|
|||||||
| Cash (used in) provided by financing activities |
207,215 | (3,005 | ) | 22,736 | ||||||||
|
|
|
|
|
|
|
|||||||
| Investing activities: |
||||||||||||
| Property and equipment additions |
(376,624 | ) | (228,804 | ) | (162,737 | ) | ||||||
| Proceeds from disposal of property and equipment |
218,259 | 61,768 | 105,228 | |||||||||
| Proceeds from the sale of the flight training operations to CAE Inc. |
— | 29,779 | — | |||||||||
| Aircraft deposits net of lease inception refunds |
(47,307 | ) | (28,253 | ) | (42,606 | ) | ||||||
| Restricted cash |
(13,135 | ) | 4,755 | (3,861 | ) | |||||||
| Investments in subsidiaries, net of cash acquired |
— | — | (13,300 | ) | ||||||||
| Distributions from equity investments |
1,134 | — | 1,275 | |||||||||
|
|
|
|
|
|
|
|||||||
| Cash used in investing activities |
(217,673 | ) | (160,755 | ) | (116,001 | ) | ||||||
|
|
|
|
|
|
|
|||||||
| Cash (used in) provided by continuing operations |
5,143 | (121,470 | ) | (18,965 | ) | |||||||
| Cash flows provided by (used in) discontinued operations: |
||||||||||||
| Cash flows provided by (used in) operating activities |
2,240 | (1,032 | ) | (1 | ) | |||||||
| Cash flows provided by (used in) financing activities |
(2,240 | ) | 1,032 | 1 | ||||||||
|
|
|
|
|
|
|
|||||||
| Cash provided by (used in) discontinued operations |
— | — | — | |||||||||
| Effect of exchange rate changes on cash and cash equivalents |
(18,517 | ) | 15,431 | 853 | ||||||||
|
|
|
|
|
|
|
|||||||
| Change in cash and cash equivalents during the year |
(13,374 | ) | (106,039 | ) | (18,112 | ) | ||||||
| Cash and cash equivalents, beginning of year |
68,921 | 174,960 | 199,267 | |||||||||
| Less: cash and cash equivalents from deconsolidation of VIEs |
— | — | (6,195 | ) | ||||||||
|
|
|
|
|
|
|
|||||||
| Cash and cash equivalents, end of year |
$ | 55,547 | $ | 68,921 | $ | 174,960 | ||||||
|
|
|
|
|
|
|
|||||||
See accompanying notes to consolidated financial statements.
F-6
Table of Contents
6922767 HOLDING S.à.r.l.
Consolidated Statements of Shareholder’s Equity
(Expressed in thousands of United States dollars)
| Capital stock |
Convertible preferred equity certificates (“CPECs”) |
Contributed surplus |
Deficit | Accumulated other comprehensive earnings (loss) |
Total shareholder’s equity |
Total comprehensive earnings (loss) |
Redeemable non- controlling interests |
|||||||||||||||||||||||||
| April 30, 2009 |
$ | 19 | $ | 1,574,302 | $ | 8,911 | $ | (691,222 | ) | $ | (135,993 | ) | $ | 756,017 | $ | (840,503 | ) | $ | — | |||||||||||||
| Conversion of CPECs into capital stock |
1,546,489 | (1,546,489 | ) | — | — | — | — | — | — | |||||||||||||||||||||||
| Conversion of CPECs into capital stock |
20,000 | (20,000 | ) | — | — | — | — | — | — | |||||||||||||||||||||||
| Conversion of CPECs into capital stock |
7,813 | (7,813 | ) | — | — | — | — | — | — | |||||||||||||||||||||||
| Redemption of capital stock |
(27,366 | ) | — | — | (442 | ) | — | (27,808 | ) | — | — | |||||||||||||||||||||
| Net change in cash flow hedges, net of income tax of $0.1 million |
— | — | — | — | 2,977 | 2,977 | 2,977 | — | ||||||||||||||||||||||||
| Foreign currency translation |
— | — | — | — | 61,354 | 61,354 | 59,781 | (1,573 | ) | |||||||||||||||||||||||
| Stock compensation expense (note 19) |
— | — | 4,017 | — | — | 4,017 | — | — | ||||||||||||||||||||||||
| Defined benefit plan, net of income tax of $5.7 million |
— | — | — | — | (33,447 | ) | (33,447 | ) | (51,006 | ) | (17,559 | ) | ||||||||||||||||||||
| Net loss |
— | — | — | (70,607 | ) | — | (70,607 | ) | (76,502 | ) | (5,895 | ) | ||||||||||||||||||||
|
|
|
|
|
|
|
|
|
|
|
|
|
|
|
|
|
|||||||||||||||||
| April 30, 2010 |
1,546,955 | — | 12,928 | (762,271 | ) | (105,109 | ) | 692,503 | (64,750 | ) | (25,027 | ) | ||||||||||||||||||||
| Issuance of capital stock for cash |
146 | — | — | — | — | 146 | — | — | ||||||||||||||||||||||||
| Net change in cash flow hedges |
— | — | — | — | (571 | ) | (571 | ) | (571 | ) | — | |||||||||||||||||||||
| Foreign currency translation |
— | — | — | — | 90,714 | 90,714 | 90,507 | (207 | ) | |||||||||||||||||||||||
| Stock compensation expense (note 19) |
— | — | 1,655 | — | — | 1,655 | — | — | ||||||||||||||||||||||||
| Defined benefit plan, net of income tax of $18.6 million |
— | — | — | — | 30,167 | 30,167 | 53,419 | 23,252 | ||||||||||||||||||||||||
| Net earnings (loss) |
— | — | — | (70,338 | ) | — | (70,338 | ) | (65,269 | ) | 5,069 | |||||||||||||||||||||
|
|
|
|
|
|
|
|
|
|
|
|
|
|
|
|
|
|||||||||||||||||
| April 30, 2011 |
1,547,101 | — | 14,583 | (832,609 | ) | 15,201 | 744,276 | 78,086 | 3,087 | |||||||||||||||||||||||
| Issuance of capital stock for cash |
60,000 | — | 40,000 | — | — | 100,000 | — | — | ||||||||||||||||||||||||
| Net change in cash flow hedges |
— | — | — | — | (2,437 | ) | (2,437 | ) | (2,437 | ) | — | |||||||||||||||||||||
| Foreign currency translation |
— | — | — | — | (60,608 | ) | (60,608 | ) | (62,757 | ) | (2,149 | ) | ||||||||||||||||||||
| Stock compensation expense (note 19) |
— | — | 735 | — | — | 735 | — | — | ||||||||||||||||||||||||
| Defined benefit plan, net of income tax of $6.0 million |
— | — | — | — | (13,752 | ) | (13,752 | ) | (25,437 | ) | (11,685 | ) | ||||||||||||||||||||
| Net earnings (loss) |
— | — | — | (107,422 | ) | — | (107,422 | ) | (95,000 | ) | 12,422 | |||||||||||||||||||||
|
|
|
|
|
|
|
|
|
|
|
|
|
|
|
|
|
|||||||||||||||||
| April 30, 2012 |
$ | 1,607,101 | $ | — | $ | 55,318 | $ | (940,031 | ) | $ | (61,596 | ) | $ | 660,792 | $ | (185,631 | ) | $ | 1,675 | |||||||||||||
|
|
|
|
|
|
|
|
|
|
|
|
|
|
|
|
|
|||||||||||||||||
See accompanying notes to consolidated financial statements.
F-7
Table of Contents
Notes to Consolidated Financial Statements
(Tabular amounts expressed in thousands unless otherwise noted, except capital stock amounts)
| 1. | Operations: |
These consolidated financial statements include the results of 6922767 Holding S.à.r.l. and its subsidiaries (together the “Company”) for the three years ended April 30, 2012.
6922767 Holding S.à.r.l. was incorporated on February 20, 2008 under the laws of Luxembourg and is a private limited liability company (Société à responsabilité limitée) (S.à.r.l.) whose sole purpose was to form 6922767 Canada Inc. (the “Purchaser”), a wholly owned Canadian company to acquire CHC Helicopter Corporation (“CHC”), its Predecessor (“the Predecessor”).
Through the acquisition of the Predecessor, the Company has become a leading provider of helicopter transportation services to the global oil and gas industry with major units in Norway, the Netherlands, the United Kingdom, Africa, Australia, Canada and Brazil. The Company’s principal activities are: helicopter transportation services and maintenance, repair and overhaul (“MRO”).
| 2. | Significant accounting policies: |
| (a) | Basis of presentation: |
These consolidated financial statements have been prepared according to United States Generally Accepted Accounting Principles (“US GAAP”).
| (b) | Critical accounting estimates and assumptions: |
The preparation of these financial statements requires management to make estimates and assumptions that affect the reported amounts of assets and liabilities and disclosure of contingent assets and liabilities at the dates of the financial statements and the reported amounts of revenue and expenses during the reporting periods. Areas where significant estimates and assumptions have been made include: classification of aircraft operating leases, consolidation of variable interest entities, property and equipment, goodwill and intangible asset impairment, pension benefits, contingent liabilities, income taxes and stock based compensation.
Estimates and judgments are continually evaluated and are based on historical experience and other factors, including expectations of future events that are believed to be reasonable under the circumstances. As the estimation process is inherently uncertain, actual future outcomes could differ from present estimates and assumptions, potentially having material future effects on our financial statements. Any change would be accounted for in the period in which it occurs.
F-8
Table of Contents
6922767 HOLDING S.à.r.l.
Notes to Consolidated Financial Statements
(Tabular amounts expressed in thousands unless otherwise noted, except capital stock amounts)
| 2. | Significant accounting policies (continued): |
| (c) | Principles of consolidation: |
These consolidated financial statements include the accounts of 6922767 Holding S.à.r.l. and those entities that it has the ability to control through voting or other rights. Investments in entities in which the Company has a majority voting interest and entities that are Variable Interest Entities (“VIEs”) of which the Company is the primary beneficiary are consolidated. The equity method of accounting is applied for investments if the Company has the ability to exercise significant influence over an entity that (i) is not a variable interest entity or (ii) is a variable interest entity, but the Company is not deemed to be the primary beneficiary.
Amendments to Accounting for Variable Interest Entities
On May 1, 2010, the Company adopted an amendment to the accounting and disclosure requirements for the consolidation of VIEs. The new guidance made significant changes to the model for determining who should consolidate a VIE by specifically eliminating the quantitative approach to determining the primary beneficiary. The amendment requires the use of a qualitative approach to determine the primary beneficiary, based on the power to direct activities of the VIE that most significantly impact its economic performance. In addition, the new guidance removes the concept of a qualifying special-purpose entity. On adoption of the new VIE guidance, the Company concluded it is not the primary beneficiary of Thai Aviation Services Limited (“TAS”) and retroactively restated its financial statements to begin equity accounting for its investment beginning June 2009. See note 4 for additional information on the accounting for the investment in TAS.
| (d) | Functional and presentation currency: |
Items included in the financial statements of each consolidated entity are measured using the currency of the primary economic environment in which the entity operates (the “functional currency”). The consolidated financial statements are presented in US dollars, which is the functional currency of 6922767 Holding S.à.r.l. Significant subsidiaries have functional currencies of Pound Sterling (“£”), Norwegian Kroner (“NOK”), Australian dollars (“AUD”) and Euros (“€”).
| (i) | Transactions and balances: |
Foreign currency transactions are translated into the functional currency using the average rate in effect during the transaction reporting period. Foreign exchange gains and losses resulting from the settlement of such transactions and from the translation at year-end exchange rates of monetary assets and liabilities denominated in other than an entity’s functional currency are recognized in the statement of operations.
F-9
Table of Contents
6922767 HOLDING S.à.r.l.
Notes to Consolidated Financial Statements
(Tabular amounts expressed in thousands unless otherwise noted, except capital stock amounts)
| 2. | Significant accounting policies (continued): |
| (d) | Functional and presentation currency (continued): |
| (ii) | Consolidated companies: |
The results and financial position of all the consolidated entities (none of which has the currency of a hyper-inflationary economy) that have a functional currency different from the presentation currency are translated into the presentation currency as follows:
| • | assets and liabilities are translated at the closing rate at the date of each balance sheet; |
| • | income and expenses are translated at average exchange rates in effect during the reporting period; and |
| • | exchange gains or losses arising on consolidation are deferred in accumulated other comprehensive earnings until complete or substantially complete liquidation of the Company’s investment in the foreign subsidiary. |
The currencies which most influence these translations and the relevant exchange rates were:
| 2012 | 2011 | 2009 | ||||||||||
| Average rates: |
||||||||||||
| US $/£ |
1.592488 | 1.564049 | 1.601810 | |||||||||
| US $/CAD |
1.004218 | 0.987654 | 0.932749 | |||||||||
| US $/NOK |
0.177044 | 0.167802 | 0.167335 | |||||||||
| US $/AUD |
1.042780 | 0.954370 | 0.867456 | |||||||||
| US $/€ |
1.366640 | 1.330173 | 1.414793 | |||||||||
| Period end rates, April 30: |
||||||||||||
| US $/£ |
1.622622 | 1.663547 | 1.530645 | |||||||||
| US $/CAD |
1.011736 | 1.051414 | 0.988533 | |||||||||
| US $/NOK |
0.174524 | 0.189675 | 0.169435 | |||||||||
| US $/AUD |
1.041076 | 1.089160 | 0.930506 | |||||||||
| US $/€ |
1.322845 | 1.478393 | 1.330170 | |||||||||
F-10
Table of Contents
6922767 HOLDING S.à.r.l.
Notes to Consolidated Financial Statements
(Tabular amounts expressed in thousands unless otherwise noted, except capital stock amounts)
| 2. | Significant accounting policies (continued): |
| (e) | Revenue: |
The Company recognizes revenue when there is persuasive evidence of an arrangement; the services or products have been performed or delivered to the customer; the sales price is fixed or determinable; and collection is reasonably assured.
| (i) | Helicopter flying services: |
The majority of customer contracts earn revenues based on hourly flight rates, fixed monthly charges or a combination of both. Revenue related to flying services that are billed hourly is recognized as hours are flown. Fixed monthly charges are recognized monthly over the term of the contract. Certain contracts provide for mobilization revenue, which is the advance billing for the delivery of an aircraft to a specific location and the setup of the aircraft and personnel prior to commencement of flying services under the contract. Mobilization revenue does not qualify as a separate unit of accounting; accordingly, it is deferred and recognized as flying services are provided under the contract. Related direct and incremental mobilization costs are deferred and amortized over the term of the contract.
Costs that are reimbursed by the customer as stipulated within certain customer contracts (such as fuel, landing fees and other costs) are recognized as revenue when reimbursable costs are incurred by the Company and amounts become owing from the customer.
Customer contracts are for varying periods and may permit the customer to cancel the contract before the end of the term.
| (ii) | Maintenance and repair and overhaul: |
The Company enters into long-term Power by Hour (“PBH”) contracts with third-party customers to provide maintenance and repair and overhaul (“R&O”) services on customer owned engines and components. Under these contracts, customers pay the Company a fixed fee per hour flown and the Company provides R&O services for the customer’s engines and components over the specific term of the contract. These R&O contracts contain multiple deliverables that include predetermined major component overhauls at specific intervals based on hours flown and ongoing routine maintenance on major and non-major components. Each deliverable is treated as a separate unit of accounting as each deliverable has value to the customer on a stand-alone basis.
In October 2009, the Financial Accounting Standards Board (“FASB”) issued new guidance on multiple deliverables in revenue arrangements, which was adopted by the Company on May 1, 2011 for new revenue arrangements entered into or materially modified after this date. This update provides guidance on whether multiple deliverables exist, how the deliverables should be separated and how the consideration should be allocated to one or more units of accounting and establishes a selling price hierarchy for determining the selling price of a deliverable. The selling price used for each deliverable is based on: vendor-specific objective evidence, if available; third-party evidence if vendor-specific objective evidence is not available; or estimated selling price if neither vendor-specific or third-party evidence is available.
F-11
Table of Contents
6922767 HOLDING S.à.r.l.
Notes to Consolidated Financial Statements
(Tabular amounts expressed in thousands unless otherwise noted, except capital stock amounts)
| 2. | Significant accounting policies (continued): |
| (e) | Revenue (continued): |
| (ii) | Maintenance and repair and overhaul (continued): |
For contracts entered into or materially modified after May 1, 2011, the relative-selling-price method has been used to allocate the consideration to the two contract deliverables. Under this method, the selling price of the scheduled major overhaul has been determined based on the price charged for an overhaul when it is sold separately by the Company and the selling price for the ongoing routine maintenance has been determined using the best estimate of selling price. On the adoption of this standard, there was no significant impact on the financial position, cash flows or results of operations.
For contracts entered into before May 1, 2011, the residual method has been used to allocate the fair value of these deliverables because the Company does not have objective reliable evidence of the fair value of the ongoing routine maintenance. Under this method, the amount of consideration allocated to the delivered item equals the total consideration less the fair value of the undelivered item. Adoption of the new guidance required the Company to discontinue use of the residual value method for new or materially modified contracts.
Customers are usually invoiced in advance for R&O services performed under PBH contracts, with a portion of this revenue recognized on a monthly basis as hours are flown by the customer to reflect ongoing routine maintenance services provided. The balance is recognized as the scheduled major component overhauls are completed.
For other long-term maintenance contracts, revenue is recognized based on the completed contract method. Costs incurred for in progress contracts are classified as work in progress in the inventory line item of the consolidated balance sheets.
| (iii) | Other: |
Unfavorable contract credits, which were recognized as liabilities at the time of acquisition of the Predecessor, are amortized to net earnings (loss) as revenue over the term of the related contract, which ranges from 1 to 6 years.
| (f) | Accounts receivable: |
Trade and other receivables are stated at net realizable value. The Company maintains an allowance for doubtful accounts against its trade receivables for estimated losses that may arise if its customers are unable to make required payments. Management specifically analyzes the age of outstanding customer balances, historical bad debts, customer credit worthiness, payment history and other factors when making estimates of the uncollectibility of the Company’s receivables. When all or part of a trade receivable is known to be uncollectible, the trade receivable and related allowance are written off. Amounts subsequently recovered from trade receivables previously considered uncollectible and written off are recorded in net earnings (loss) as an expense recovery in the period that the cash is collected.
F-12
Table of Contents
6922767 HOLDING S.à.r.l.
Notes to Consolidated Financial Statements
(Tabular amounts expressed in thousands unless otherwise noted, except capital stock amounts)
| 2. | Significant accounting policies (continued): |
| (g) | Transfer of receivables: |
The Company sells pools of its trade receivables, or beneficial interests therein, to a single seller special purpose entity (“SPE”) to fund its operations. The transfer of receivables is accounted for as a sale when the criteria for sale accounting are met.
| (h) | Cash and cash equivalents: |
Cash and cash equivalents consist of cash on hand with banks and investments in money market instruments with maturities of less than 90 days that are readily convertible to known amounts of cash.
| (i) | Restricted cash: |
The Company has restricted cash that is retained to fund required claims reserves and deposits held as security for guarantees and bid bonds for its reinsurance subsidiary. In addition, cash that can only be used to support the securitization of transferred receivables has been classified as restricted.
| (j) | Inventories: |
Inventories comprised of consumable parts and supplies, are measured at the lower of the weighted average acquisition cost or market value, and are charged to direct costs when used in operations. The cost of acquisition is the price paid to the manufacturer or supplier including an allocation for freight charges. The Company records provisions to reduce inventory to the lower of cost or market value, to reflect changes in economic factors that impact inventory value or reflect present intentions for the use of slow moving and obsolete supplies inventory.
| (k) | Property and equipment: |
Property and equipment includes flying assets, facilities and equipment, which are initially recorded at cost, including capitalized interest, and are amortized over their estimated useful lives under the methods described below to their residual values.
Long-lived assets that have been classified as held for sale are measured at the lower of their carrying amount or fair value less costs to sell and are not amortized once they are classified as held for sale.
| (i) | Flying assets: |
Aircraft, major components and spares are recorded at cost and are amortized on a straight-line basis over their estimated service life of 15-25 years. The cost of major airframe inspections as required by the manufacturer and aviation regulatory authorities and modifications that are considered betterments and improvements for both owned and leased aircraft are capitalized. The major airframe inspections are amortized on a straight-line basis over the period to the estimated date of the next inspection. The modifications are amortized over the lower of the estimated useful life of the modification or the aircraft lease term.
Repairable assets are recorded at cost and are amortized on a pooled basis to their estimated residual value on a 20% declining balance basis. When components are retired or otherwise disposed of in the ordinary course of business, their original cost, net of salvage or sale proceeds, is charged to accumulated amortization.
F-13
Table of Contents
6922767 HOLDING S.à.r.l.
Notes to Consolidated Financial Statements
(Tabular amounts expressed in thousands unless otherwise noted, except capital stock amounts)
| 2. | Significant accounting policies (continued): |
| (k) | Property and equipment (continued): |
| (i) | Flying assets (continued): |
Maintenance and repairs for owned and leased major components, spares and repairable parts are charged to direct costs as incurred.
| (ii) | Facilities and equipment: |
Facilities are composed of hangars, heliports and other buildings housing base operations and administrative support. Equipment includes repair and overhaul, manufacturing and base equipment and vehicles. Such facilities and equipment are recorded at cost and are amortized to their estimated residual value on a straight-line basis at 5% and 20%, respectively. Leasehold improvements associated with leased facilities and equipment are capitalized and amortized on a straight-line basis over the shorter of their estimated useful life and respective lease term.
| (l) | Impairment of long-lived assets: |
Long-lived assets, comprised of property and equipment and intangibles subject to amortization, are assessed for impairment whenever events or circumstances indicate that their carrying value may not be recoverable. For the purpose of impairment testing, long-lived assets are grouped and tested for recoverability at the lowest level that generates independent cash flows from another asset group. In testing the recoverability of the assets, the carrying value of the assets or asset groups is compared to the future projected undiscounted cash flows. The cash flows are based on management’s expectations of future revenues and expenses including costs to maintain the assets over their respective service lives. An impairment loss is recognized as the excess of the carrying value over the fair value when an asset or asset group is not recoverable. Fair value is based on valuation techniques or third party appraisals. Significant estimates and judgments are applied in determining these cash flows and fair values.
The recoverability of goodwill and indefinite life intangible assets is assessed on an annual basis or more frequently if events or circumstances indicate that the carrying value may not be recoverable. During the year ended April 30, 2012, the date of the annual impairment test for goodwill and indefinite lived intangible assets was changed from April 30 to February 1. The Company adopted this change in timing in order to ensure that the annual impairment analysis would be completed by the required filing date of the Company’s annual financial statements. In addition, this change in timing will provide additional time to quantify the fair value of its reporting units and, if necessary, to determine the implied fair value of goodwill. The revised date also more closely aligns with our internal budgeting and forecasting process. In accordance with GAAP, the Company will perform interim impairment testing should circumstances requiring it arise. Management believes this accounting change is preferable and does not result in the delay, acceleration, or avoidance of an impairment charge. This change is not applied retrospectively as it is impracticable to do so because retrospective application would require the application of significant estimates and assumptions with the use of hindsight. Accordingly, the change will be applied prospectively.
Goodwill is assessed for impairment at the reporting unit level. The fair value of a reporting unit is compared with its carrying amount, including goodwill. Significant estimates are applied in determining fair value, which include the discount rate that is applied to management’s estimate of expected cash flows and assumptions about the future revenue, expenses and costs incurred to maintain the assets over their respective service lives.
F-14
Table of Contents
6922767 HOLDING S.à.r.l.
Notes to Consolidated Financial Statements
(Tabular amounts expressed in thousands unless otherwise noted, except capital stock amounts)
| 2. | Significant accounting policies (continued): |
| (l) | Impairment of long-lived assets (continued): |
If the carrying amount of a reporting unit exceeds its fair value, then implied fair value of the reporting unit’s goodwill is calculated. An impairment loss, if any, is recognized equal to the amount that the carrying value of the reporting unit’s goodwill exceeds its implied fair value.
| (m) | Leases: |
| (i) | Lease classification: |
When the Company assumes substantially all the risks and rewards of ownership in a lease it is classified as a capital lease. Upon initial recognition the leased asset is measured at an amount equal to the lower of its fair value and the present value of the minimum lease payments. Subsequent to initial recognition, the asset is accounted for in accordance with the accounting policy applicable to that asset. Minimum lease payments made under capital leases are apportioned between interest expense and the reduction of the outstanding liability. The interest expense is allocated to each period during the lease term to produce a constant periodic rate of interest on the remaining balance of the liability. Other leases are classified as operating leases and are not recognized in the Company’s consolidated balance sheets. Payments made under operating leases are recognized in direct costs on a straight-line basis over the term of the lease. Contingent lease payments are accounted for in the period when it becomes probable they will be incurred. Direct costs of arranging lease financing are deferred and amortized straight-line over the term of the lease.
| (ii) | Residual value guarantees: |
At the inception of an operating lease where the Company has guaranteed a portion of the aircraft residual values at the end of the lease term, a liability is recognized with a corresponding prepaid rent asset that represents the fair value of the guaranteed aircraft residual. The prepaid rent asset is amortized on a straight-line basis to net earnings (loss) over the lease term of the related asset and the liability is settled at the end of the lease term.
| (iii) | Embedded equity in lease contracts: |
The Company recognized intangible assets on the acquisition of the Predecessor, which represents the excess of the market prices on the date of acquisition to the fixed lease buyout prices under certain aircraft operating leases. The recoverability of these assets is dependent on aircraft values which are impacted by market conditions including demand for certain aircraft types and changes in technology arising from the introduction of newer, more efficient aircraft. Embedded equity is not amortized and the Company tests embedded equity for impairment on an ongoing basis. In the event that a purchase option is exercised, the embedded equity is added to the carrying value of the purchased asset. Embedded equity that is not realized at the end of an aircraft operating lease is recognized as an expense in the statement of operations.
F-15
Table of Contents
6922767 HOLDING S.à.r.l.
Notes to Consolidated Financial Statements
(Tabular amounts expressed in thousands unless otherwise noted, except capital stock amounts)
| 2. | Significant accounting policies (continued): |
| (m) | Leases (continued): |
| (iv) | Lessee involvement in assets under construction: |
Where the Company provides guarantees to lessors in respect of novated aircraft purchase contracts the Company is required to record assets under construction and corresponding obligations as prescribed by ASC 840 Leases. Once an aircraft is delivered under these agreements, a sale-leaseback transaction will occur as the Company enters into an operating lease with the lessor. Upon entering an operating lease, the assets under construction and corresponding liability are removed from the balance sheet.
| (n) | Income taxes: |
The Company follows the asset and liability method of accounting for income taxes. Under this method, deferred income tax assets and liabilities are determined based on temporary differences between the tax basis and accounting basis of the assets and liabilities measured using tax rates enacted at the balance sheet date. The Company generally believes that the positions taken on previously filed income tax returns are more likely than not to be sustained by the taxation authorities. The Company has recorded income tax and related interest liabilities where the Company believes its position may not be sustained or where the full income tax benefit will not be recognized. Interest and penalties are classified as other financing charges in the statement of operations.
The Company has assessed the realization of the deferred income tax asset (net of allowance) related to income tax losses as more likely than not. This determination was based on assumptions regarding the reversal of existing deferred tax liabilities and future earnings levels in the subsidiaries with accumulated losses, and an ability to implement tax planning measures. If, in the future, it is determined that it is more likely than not that all or part of the deferred tax asset will not be realized, a charge will be made to earnings in the period when such determination is made.
| (o) | Employee benefits: |
| (i) | Pension costs and obligations: |
The Company maintains defined contribution and defined benefit pension plans for substantially all of its employees. The cost of defined benefit plans are determined based on independent annual actuarial valuations performed using the projected benefit method prorated on services and management’s estimate of expected plan asset performance, salary escalation and various other factors including expected health care costs, mortality rates, terminations and retirement ages. The excess of unrecognized net actuarial gains and losses over 10% of the greater of the benefit obligation and the fair value of plan assets is amortized over the average remaining service life of the plan participants. When an event giving rise to a settlement and a curtailment occurs, the curtailment is accounted for prior to the settlement. The funded status of defined benefit pension plans and other post-retirement benefit plans is recognized on the balance sheet, with a corresponding adjustment to accumulated other comprehensive income, net of tax.
F-16
Table of Contents
6922767 HOLDING S.à.r.l.
Notes to Consolidated Financial Statements
(Tabular amounts expressed in thousands unless otherwise noted, except capital stock amounts)
| 2. | Significant accounting policies (continued): |
| (o) | Employee benefits (continued): |
| (i) | Pension costs and obligations (continued): |
Measuring the Company’s obligations under the plans and the related periodic pension expense involves significant estimates. These factors include assumptions about the rate at which the pension obligation is discounted, the expected long-term rate of return on plan assets, the rate of future compensation increases and mortality rates. Differing estimates may have a material impact on the amount of pension expense recorded and on the carrying value of prepaid pension costs and accrued pension obligations.
| (ii) | Stock-based compensation: |
Stock-based compensation is measured at the grant date based on the estimated fair value of the awards granted. The related cost is recognized net of an estimated forfeiture rate. The compensation cost is recognized only for those options where it is probable that performance criteria will be met in the future. For awards which only have service conditions, the compensation cost is recognized on a straight-line basis over the requisite service period for the entire award.
| (p) | Financial Instruments: |
| (i) | Transaction costs: |
Transaction costs related to long-term debt are capitalized and amortized over the expected life of the debt using the effective interest rate method. Transaction costs incurred in connection with securing revolving credit facilities are deferred and amortized on a straight-line basis over the terms of the related credit facilities to net earnings (loss). Deferred transaction costs are included in other assets in the consolidated balance sheets.
| (ii) | Fair value measurement: |
A three-level valuation hierarchy is used for fair value measurement. The hierarchy reflects the significance of the inputs used in making the fair value measurements, which is as follows:
Level 1 – quoted prices (unadjusted) in active markets for identical assets or liabilities.
Level 2 – inputs other than quoted prices included in Level 1 that are observable for the asset or liability.
Level 3 – inputs that are not based on observable market data.
| (iii) | Hedging and derivatives: |
The Company enters into derivative contracts including foreign exchange forward contracts and interest swaps to manage its foreign exchange and interest rate risk. Derivative contracts that are not formally designated as hedges and do not qualify for hedge accounting treatment are classified as held-for-trading and are recognized at fair value with the resulting gains and losses recognized in other financing charges within net earnings (loss).
F-17
Table of Contents
6922767 HOLDING S.à.r.l.
Notes to Consolidated Financial Statements
(Tabular amounts expressed in thousands unless otherwise noted, except capital stock amounts)
| 2. | Significant accounting policies (continued): |
| (p) | Financial Instruments (continued): |
| (iii) | Hedging and derivatives (continued): |
When a hedge is formally de-designated because it is discontinued or no longer meets the criteria for hedge accounting, any cumulative gain or loss recorded in other comprehensive earnings remains in other comprehensive earnings until the forecasted transaction is recorded. When a forecasted transaction is no longer expected to occur, the net cumulative gain or loss that was reported in other comprehensive earnings is immediately recorded in net earnings (loss). Any ineffective portion of a hedge is recognized immediately in net earnings (loss).
Certain of the Company’s customer contracts are denominated in a currency that is other than the functional currency of the parties to the contract. This gives rise to embedded derivatives which are accounted for as derivative financial instruments. These are measured at fair value with resulting gains and losses recorded in the statement of operations as an other financing charge.
| (q) | Comparative figures: |
Certain comparative figures have been reclassified to conform with the financial presentation adopted for the current year. Financing charges were reclassified to reflect the change in presentation whereby foreign exchange gain / (loss) and interest on long-term debt are shown separately on the face of the statement of operations rather than combined with other financing charges.
| (r) | Recent accounting pronouncements adopted in the year: |
Financial instruments:
On February 1, 2012, the Company adopted an accounting amendment for fair value measurements and related disclosures. This amendment provides guidance about how fair value should be applied where it already is required or permitted under US GAAP. Additional disclosure requirements in the update include: (1) for Level 3 fair value measurements, quantitative information about unobservable inputs used, a description of the valuation processes used by the entity, and a qualitative discussion about the sensitivity of the measurements to changes in the unobservable inputs; (2) for an entity's use of a nonfinancial asset that is different from the asset's highest and best use, the reason for the difference; (3) for financial instruments not measured at fair value but for which disclosure of fair value is required, the fair value hierarchy level in which the fair value measurements were determined; and (4) the disclosure of all transfers between Level 1 and Level 2 of the fair value hierarchy. The adoption of the amendment did not have a material impact on our consolidated financial statements.
F-18
Table of Contents
6922767 HOLDING S.à.r.l.
Notes to Consolidated Financial Statements
(Tabular amounts expressed in thousands unless otherwise noted, except capital stock amounts)
| 2. | Significant accounting policies (continued): |
| (s) | Recent accounting pronouncements not yet adopted: |
Presentation of comprehensive income in financial statements:
In June 2011, the FASB issued an accounting pronouncement that provides new guidance on the presentation of comprehensive income in financial statements. Entities are required to present total comprehensive income either in a single, continuous statement of comprehensive income or in two, separate, but consecutive, statements. Under the single-statement approach, entities must include the components of net income, a total for net income, the components of other comprehensive income and a total for comprehensive income. Under the two-statement approach, entities must report a statement of income and, immediately following, a statement of comprehensive income. Under either method, entities must display adjustments for items reclassified from other comprehensive income to net income in both net income and comprehensive income. The provisions for this pronouncement are effective for fiscal years, and interim periods within those years, beginning after December 15, 2011, with early adoption permitted. We will adopt this pronouncement for our fiscal year beginning May 1, 2012.
Multiemployer defined benefit plans:
In September 2011, the FASB provided additional guidance on disclosures surrounding multiemployer defined benefit plans including the level of Company participation in the plan, the financial health of the plan and the nature of commitments to the plan. This guidance will be effective for our fiscal year ending April 30, 2013. We are currently assessing the impact of this new guidance on our consolidated financial statements.
F-19
Table of Contents
6922767 HOLDING S.à.r.l.
Notes to Consolidated Financial Statements
(Tabular amounts expressed in thousands unless otherwise noted, except capital stock amounts)
| 3. | Sale of flight training operations: |
In the year ended April 30, 2011 the Company completed the sale of its flight training operations to CAE Inc. (“CAE”) for net proceeds of $29.8 million. Of the total sale proceeds, $17.7 million relates to the sale of four flight training simulators, software, and customer contracts. The remaining $12.1 million was considered an inducement to enter into a fifteen year Master Training Services Agreement (“MTSA”) with CAE for the provision of training services to the Company on CAE’s worldwide network of simulators, which now includes the assets purchased from the Company. A portion of the sale proceeds was considered an inducement as it is refundable on a pro-rata basis in the event that the Company cancels the contract early.
The inducement proceeds have been deferred and are recognized as a reduction in direct costs over the term of the MTSA as the amounts become non-refundable.
The MTSA commits the Company to annual minimum training purchases as follows:
| Minimum training service purchase commitment |
||||
| 2013 |
$ | 8,200 | ||
| 2014 |
9,700 | |||
| 2015 |
9,400 | |||
| 2016 |
9,300 | |||
| and thereafter |
21,000 | |||
|
|
|
|||
| $ | 57,600 | |||
|
|
|
|||
F-20
Table of Contents
6922767 HOLDING S.à.r.l.
Notes to Consolidated Financial Statements
(Tabular amounts expressed in thousands unless otherwise noted, except capital stock amounts)
| 4. | Variable interest entities: |
| (a) | VIEs of which the Company is the primary beneficiary: |
| (i) | Local ownership VIEs: |
Certain areas of operations are subject to local governmental regulations that may limit foreign ownership of aviation companies. Accordingly, operations in certain jurisdictions may require the establishment of local ownership entities that are considered to be VIEs. The nature of the Company’s involvement with consolidated local ownership entities is as follows:
EEA Helicopters Operations B.V. (“EHOB”)
EHOB is incorporated in the Netherlands and through its wholly-owned subsidiaries in Norway, Denmark, the Netherlands, the United Kingdom and Ireland provides helicopter flying services to customers in Europe.
The Company owns 49.9% of the common shares (9,896,085 Class B shares) of EHOB, with the remaining 50.1% of the common shares (9,935,750 Class A shares) held by a European investor. The Management Board of EHOB is comprised of one director nominated by the Class B shareholders and three directors nominated by the Class A shareholder.
The Company also owns 7,000,000 par value 1 Euro Profit Certificates in EHOB. Through its ownership of the Profit Certificates, the Company is entitled to a cumulative annual dividend equal to 30% of the issue price of each Profit Certificate (equivalent to a cumulative annual dividend of € 2.1 million) for the first 7 years after issuance and thereafter, a cumulative annual dividend equal to 5% of the issue price of each Profit Certificate (equivalent to a cumulative annual dividend of €0.35 million), subject to Board approval and the availability of cash and further subject to any and all restrictions applicable under Dutch law.
The Company also holds a call option over the Class A shareholder’s stock in EHOB and has granted a put option to the Class A shareholder which entitles the Class A shareholder to put its shares back to the Company. Both the put and call are exercisable in certain circumstances including: liquidation, events of default, and if the Company makes a public offering of its shares resulting in change in control. The Class A shareholder also holds a call option over the Company’s Class B shares which is exercisable only in the event of bankruptcy.
The Company has determined that the activities that most significantly impact the economic performance of EHOB are: servicing existing flying services contracts and entering into new contracts, safety and training, and maintenance of aircraft. Through agreement with EHOB, the Company has the right to enter directly into new flying services contracts and require that EHOB act as the subcontractor for provision of those services. EHOB’s fleet of aircraft is leased entirely from the Company and the lease agreements require that all aircraft maintenance be provided by the Company. The shareholders’ agreement requires EHOB to ensure safety standards meet minimums set by the Company.
As a result of consolidating EHOB, the Company has recorded a non-controlling interest relating to the 50.1% Class A shareholder’s interest in the net assets of EHOB. As at April 30, 2012, the redeemable non-controlling interest is $1.7 million (April 30, 2011 – $3.1 million). Because of the terms of the put and call arrangements with the European investor, the non-controlling interest is considered redeemable and is classified outside of equity.
F-21
Table of Contents
6922767 HOLDING S.à.r.l.
Notes to Consolidated Financial Statements
(Tabular amounts expressed in thousands unless otherwise noted, except capital stock amounts)
| 4. | Variable interest entities (continued): |
| (a) | VIEs of which the Company is the primary beneficiary (continued): |
| (i) | Local ownership VIEs (continued): |
BHH – Brazilian Helicopter Holdings S.A. (“BHH”)
BHH holds an investment in the common shares of its subsidiary, BHS – Brazilian Helicopter Services Taxi Aereo S.A. (“BHS”). BHS provides helicopter flying services to customers in Brazil.
The Company has a 60% interest in BHH, comprised of 100% of the non-voting preferred shares and 20% of the ordinary voting shares. The remaining equity interest comprised of 80% of the ordinary voting shares is held by a Brazilian investor, whose investment was financed by the Company and is therefore considered to be a related party.
The Company has entered into a put/call arrangement which gives it the right to purchase the BHH shares held by the Brazilian investor and the Brazilian investor the right to put its shares to the Company at any time and for any reason. The put/call price is the greater of the book value of the shares and the original capital contribution plus 2% per annum. The guaranteed return due to the Brazilian investor has been recorded as a redeemable non-controlling interest.
The Company has entered into a shareholders’ agreement with the Brazilian Investor, which requires unanimous shareholder consent for important business decisions.
CHC Helicopters Canada Inc (“CHC Canada”)
CHC Canada provides helicopter flying services to customers in Canada.
The Company owns 200,000 Class A Common Shares (25%) and 200,000 (100%) Class B Non-voting Preferred Shares of CHC Canada, with the remaining 600,000 (75%) of the Class A Common Shares held by a Canadian Investor who is a director of the Company’s ultimate parent and therefore a related party. The Board of CHC Canada is comprised of one director nominated by the Company and two directors nominated by the Canadian Investor.
The Company has entered in an arrangement which allows the Canadian Investor to put its shares back to it at any time for any reason. The Company has also entered into a call arrangement which allows it or the Canadian Investor to elect to purchase the other party’s shares. The calls are exercisable in certain circumstances including: liquidation, events of default, and if the Company makes a public offering of its shares resulting in change of control. The price on the put and the call arrangement is the higher of the book value of the shares and the original capital contribution plus 6% per annum. The guaranteed return due to the Canadian investor has been recorded as a redeemable non-controlling interest.
The Company has entered into a shareholder’s agreement with the Canadian Investor, which requires unanimous shareholder consent for CHC Canada to enter into any material contracts.
F-22
Table of Contents
6922767 HOLDING S.à.r.l.
Notes to Consolidated Financial Statements
(Tabular amounts expressed in thousands unless otherwise noted, except capital stock amounts)
| 4. | Variable interest entities (continued): |
| (a) | VIEs of which the Company is the primary beneficiary (continued): |
| (i) | Local ownership VIEs (continued): |
Other local ownership VIEs
The Company also has operations in several other countries that are conducted through entities with local ownership. The Company has consolidated these entities because the local owners do not have extensive knowledge of the aviation industry and defer to the Company in the overall management and operation of these entities.
Financial information of local ownership VIEs
All of the local ownership VIEs and their subsidiaries have the same purpose and are exposed to similar operational risks and are monitored on a similar basis by management. As such, the financial information reflected on the consolidated balance sheets and statements of operations for all local ownership VIEs has been presented in the aggregate below, including intercompany amounts with other consolidated entities:
| 2012 | 2011 | |||||||
| Cash |
$ | 30,372 | $ | 57,652 | ||||
| Accounts receivable |
86,623 | 40,256 | ||||||
| Other current assets |
28,423 | 38,116 | ||||||
| Goodwill |
72,269 | 72,619 | ||||||
| Other long-term assets |
84,127 | 44,727 | ||||||
|
|
|
|
|
|||||
| Total assets |
$ | 301,814 | $ | 253,370 | ||||
|
|
|
|
|
|||||
| Accounts payable |
$ | 231,191 | $ | 155,882 | ||||
| Other current liabilities |
40,455 | 50,170 | ||||||
| Pension liability |
55,365 | 49,024 | ||||||
| Other long-term liabilities |
58,183 | 48,972 | ||||||
|
|
|
|
|
|||||
| Total liabilities |
$ | 385,194 | $ | 304,048 | ||||
|
|
|
|
|
|||||
| Revenue |
$ | 993,959 | $ | 1,038,216 | ||||
| Net earnings (loss) |
(3,589 | ) | 5,650 | |||||
|
|
|
|
|
|||||
| (ii) | Accounts receivable securitization: |
The Company enters into trade receivables securitization transactions to raise financing, through the sale of pools of receivables, or beneficial interests therein, to a VIE, Finacity Receivables – CHC 2009, LLC (“Finacity”). Finacity only buys receivables, or beneficial interests therein, from the Company. These transactions with Finacity satisfy the requirements for sales accounting treatment. Finacity is financed directly by a multi-seller commercial paper conduit, Hannover Funding Company LLC (“Hannover”), which purchases undivided ownership interests in the receivables, or beneficial interests therein, acquired by Finacity from the Company.
F-23
Table of Contents
6922767 HOLDING S.à.r.l.
Notes to Consolidated Financial Statements
(Tabular amounts expressed in thousands unless otherwise noted, except capital stock amounts)
| 4. | Variable interest entities (continued): |
| (a) | VIEs of which the Company is the primary beneficiary (continued): |
| (ii) | Accounts receivable securitization (continued): |
The Company has determined that servicing decisions most significantly impact the economic performance of Finacity and as the Company has the power to make these decisions, it is the primary beneficiary of Finacity.
As a result of consolidation, intercompany receivables and payables between the Company and Finacity together with any gain/(loss) arising from the sales treatment of the securitization transactions have been eliminated. The securitized assets and associated liabilities are included in the consolidated financial statements. Cash and cash equivalent balances of Finacity are used only to support the securitizations of the receivables transferred, including the payment of related fees, costs and expenses. The receivables that have been included in securitizations are pledged as security for the benefit of Hannover and are only available for payment of the debt or other obligations arising in the securitization transactions until the associated debt or other obligations are satisfied. The asset backed debt has been issued directly by Finacity.
The following table shows the assets and the associated liabilities related to the Company’s secured debt arrangements that are included in the consolidated financial statements:
| 2012 | 2011 | |||||||
| Restricted cash |
$ | 14,882 | $ | 3,399 | ||||
| Transferred receivables |
66,177 | 25,274 | ||||||
| Current facility secured by accounts receivable |
45,566 | 21,571 | ||||||
| (iii) | Trinity Helicopters Limited: |
As at April 30, 2012 the Company leased two aircraft from Trinity Helicopters Limited (“Trinity”), an entity considered to be a VIE. Prior to December 2011, Trinity was funded by an unrelated lender who was considered to be the primary beneficiary. In conjunction with the Company’s lease covenant negotiations (Note 25), the Company agreed to purchase the aircraft off lease from the lender. Instead of outright purchasing the aircraft the Company loaned the lease termination sum to Trinity who used these funds to repay the financing from the unrelated lender and continued to lease the aircraft to the Company. The security interest in the aircraft was assigned to the Company.
The Company has been determined to be the primary beneficiary of the VIE and began consolidating this entity upon repayment of the previous lendor. Prior to consolidation of this entity, the aircraft leases were recorded as capital leases.
At the time of consolidation by the Company, Trinity owned aircraft with a book value of $13.2 million, which approximated fair value.
F-24
Table of Contents
6922767 HOLDING S.à.r.l.
Notes to Consolidated Financial Statements
(Tabular amounts expressed in thousands unless otherwise noted, except capital stock amounts)
| 4. | Variable interest entities (continued): |
| (b) | VIEs of which the Company is not the primary beneficiary: |
| (i) | Local ownership VIEs: |
Thai Aviation Services (“TAS”)
TAS provides helicopter flying services in Thailand. The Company has a 29.9% interest in the ordinary shares of TAS, with the remaining 70.1% owned by a group of Thai Investors who are considered to be related to each other. The Thai investors have the ability to call and the Company has the ability to put all shares owned by the Company to the Thai investors at fair value in the event of a dispute.
The Company has determined that the activities that most significantly impact the economic performance of TAS are: servicing existing flying services contracts and entering into new contracts, safety and training, maintenance of aircraft and other investment activities. The Thai investors have the ability to control the majority of these decisions through Board majority.
The following table summarizes the amounts recorded for TAS in the consolidated balance sheet:
| April 30, 2012 | April 30, 2011 | |||||||||||||||
| Carrying amounts |
Maximum exposure to loss |
Carrying amounts |
Maximum exposure to loss |
|||||||||||||
| Accounts receivable |
$ | 2,408 | $ | 2,408 | $ | 2,107 | $ | 2,107 | ||||||||
| Equity method investment |
15,548 | 15,548 | 14,250 | 14,250 | ||||||||||||
| (ii) | Leasing entities: |
Related party lessors:
During the year ended April 30, 2012 the Company had operating lease agreements for the lease of 25 aircraft (2011 – 14 aircraft) from individual related party entities considered to be VIEs. The total operating lease expense for these leases was $28.8 million for the year ended April 30, 2012 (2011 – $20.5 million), with $4.4 million outstanding in accrued liabilities at April 30, 2012 (2011 – $3.0 million).
The lessor VIEs are considered related parties because they are partially financed through equity contributions from entities that have also invested in the Company. The Company has determined that the activity that most significantly impacts the economic performance of the related party lessor VIEs is the remarketing of the aircraft at the end of the lease term. As the Company does not have the power to make remarketing decisions, the Company has determined that it is not the primary beneficiary of the lessor VIEs.
Other VIE lessors:
At April 30, 2012, the Company leased eight aircraft (2011 – ten aircraft) from two different entities considered to be VIEs. At April 30, 2012, all eight leases were considered to be operating leases (2011 – seven operating leases, three capital leases).
F-25
Table of Contents
6922767 HOLDING S.à.r.l.
Notes to Consolidated Financial Statements
(Tabular amounts expressed in thousands unless otherwise noted, except capital stock amounts)
| 4. | Variable interest entities (continued): |
| (b) | VIEs of which the Company is not the primary beneficiary: |
| (ii) | Leasing entities (continued): |
The Company has determined that the activity that most significantly impacts the economic performance of the lessor VIEs is the remarketing of the aircraft at the end of the lease term. As the Company does not have the power to make remarketing decisions, the Company has determined that it is not the primary beneficiary of the lessor VIEs.
The following table summarizes the amounts recorded in respect of the operating leases with VIE lessors:
| April 30, 2012 | April 30, 2011 | |||||||||||||||
| Carrying amounts |
Maximum exposure to loss |
Carrying amounts |
Maximum exposure to loss |
|||||||||||||
| Funded residual value guarantees and receivables (included in Other assets) |
$ | — | $ | — | $ | 2,386 | $ | 2,386 | ||||||||
| Embedded equity |
— | — | 1,752 | 1,752 | ||||||||||||
| Accrued liabilities |
— | n/a | 330 | n/a | ||||||||||||
The following table summarizes the amounts recorded in respect of the capital leases with VIE lessors:
| April 30, 2012 | April 30, 2011 | |||||||||||||||
| Carrying amounts |
Maximum exposure to loss |
Carrying amounts |
Maximum exposure to loss |
|||||||||||||
| Assets under capital lease |
$ | — | $ | — | $ | 20,776 | $ | 20,776 | ||||||||
| Capital lease obligation |
— | n/a | 15,515 | n/a | ||||||||||||
| 5. | Restructuring costs: |
The Company is undergoing a comprehensive review of its operations and organizational structure through its transformation project with the view of strengthening and standardizing processes globally and lowering overhead costs. In connection with the transformation project, the Company has incurred consulting fees and severance costs that have been expensed as incurred. At April 30, 2012, the restructuring liability is not significant.
F-26
Table of Contents
6922767 HOLDING S.à.r.l.
Notes to Consolidated Financial Statements
(Tabular amounts expressed in thousands unless otherwise noted, except capital stock amounts)
| 6. | Property and equipment: |
The cost and related accumulated amortization of the Company’s flying assets, facilities and equipment are as follows:
| Property and equipment | Total | |||||||||||||||
| Flying Assets | Equipment | Facilities | ||||||||||||||
| At April 30, 2012: |
||||||||||||||||
| Cost |
$ | 1,029,381 | $ | 81,802 | $ | 129,284 | $ | 1,240,467 | ||||||||
| Accumulated depreciation |
(156,345 | ) | (24,992 | ) | (32,270 | ) | (213,607 | ) | ||||||||
|
|
|
|
|
|
|
|
|
|||||||||
| Net book value |
$ | 873,036 | $ | 56,810 | $ | 97,014 | $ | 1,026,860 | ||||||||
|
|
|
|
|
|
|
|
|
|||||||||
| At April 30, 2011: |
||||||||||||||||
| Cost |
$ | 1,117,338 | $ | 65,657 | $ | 135,969 | $ | 1,318,964 | ||||||||
| Accumulated depreciation |
(142,024 | ) | (13,622 | ) | (29,819 | ) | (185,465 | ) | ||||||||
|
|
|
|
|
|
|
|
|
|||||||||
| Net book value |
$ | 975,314 | $ | 52,035 | $ | 106,150 | $ | 1,133,499 | ||||||||
|
|
|
|
|
|
|
|
|
|||||||||
Amortization of property and equipment totaled $113.0 million (2011 – $99.6 million, 2010 – $77.7 million).
The flying assets under capital lease included above are as follows:
| 2012 | 2011 | |||||||
| Flying assets under capital lease: |
||||||||
| Cost |
$ | 32,795 | $ | 149,653 | ||||
| Accumulated amortization |
(2,073 | ) | (1,745 | ) | ||||
|
|
|
|
|
|||||
| $ | 30,722 | $ | 147,908 | |||||
|
|
|
|
|
|||||
Amortization related to flying assets under capital lease was $2.5 million, for the year ended April 30, 2012 (2011 – $1.1 million, 2010 – $0.6 million).
F-27
Table of Contents
6922767 HOLDING S.à.r.l.
Notes to Consolidated Financial Statements
(Tabular amounts expressed in thousands unless otherwise noted, except capital stock amounts)
| 7. | Assets held for sale and discontinued operations: |
| (a) | Assets held for sale: |
The Company has classified certain assets as held for sale as the assets are ready for immediate sale and management expects these assets to be sold within one year.
| 2012 | 2011 | |||||||||||||||
| # Aircraft | # Aircraft | |||||||||||||||
| Aircraft held for sale: |
||||||||||||||||
| Book value, beginning of year |
12 | $ | 31,782 | 25 | $ | 46,973 | ||||||||||
| Classified as held for sale, net of impairment |
19 | 82,377 | 10 | 25,044 | ||||||||||||
| Sales |
(10 | ) | (21,147 | ) | (18 | ) | (22,692 | ) | ||||||||
| Reclassified as held for use |
(3 | ) | (12,740 | ) | (5 | ) | (19,121 | ) | ||||||||
| Foreign exchange |
(979 | ) | 1,578 | |||||||||||||
|
|
|
|
|
|
|
|
|
|||||||||
| Aircraft held for sale |
18 | 79,293 | 12 | 31,782 | ||||||||||||
| Buildings held for sale |
— | 520 | — | 3,407 | ||||||||||||
| Discontinued operations |
— | — | — | 14,610 | ||||||||||||
|
|
|
|
|
|||||||||||||
| Total assets held for sale |
$ | 79,813 | $ | 49,799 | ||||||||||||
|
|
|
|
|
|||||||||||||
The aircraft classified as held for sale are older technology aircraft that are being divested by the Company. The buildings classified as held for sale are the result of relocation of certain of the Company’s base operations. During the year ended April 30, 2012, there were three aircraft that were reclassified to assets held for use as management reviewed its fleet strategy and have decided to redeploy these aircraft to the flying operations.
During the year ended April 30, 2012, certain aircraft held for sale were written down to their fair value less costs to sell. This measurement is considered a level 2 measurement in the fair value hierarchy as the measurement is based on third party appraisals using market data.
| (b) | Discontinued operations: |
In fiscal 2011 the Company committed to a plan to sell its Composites business. In March 2012, the Composites business was disposed of to a third party for $750,000. There is no continuing involvement after the disposition. This has been classified as a discontinued operation in the statements of operations. As at April 30, 2011, the held for sale assets and liabilities are comprised of a building and equipment with net book value of $8.0 million and working capital of $6.6 million.
F-28
Table of Contents
6922767 HOLDING S.à.r.l.
Notes to Consolidated Financial Statements
(Tabular amounts expressed in thousands unless otherwise noted, except capital stock amounts)
| 7. | Assets held for sale and discontinued operations (continued): |
| (b) | Discontinued operations (continued) |
| For the year ended | ||||||||||||
| April 30, 2012 |
April 30, 2011 |
April 30, 2010 |
||||||||||
| Revenue |
$ | 6,063 | $ | 7,049 | $ | 7,820 | ||||||
| Direct costs |
(9,319 | ) | (9,696 | ) | (8,403 | ) | ||||||
| Amortization |
(16 | ) | (1,277 | ) | (1,726 | ) | ||||||
| Impairment of held for sale assets |
(12,608 | ) | — | — | ||||||||
| Loss on disposal |
(210 | ) | — | — | ||||||||
|
|
|
|
|
|
|
|||||||
| Operating loss |
(16,090 | ) | (3,924 | ) | (2,309 | ) | ||||||
| Financing income (charges) |
(17 | ) | (436 | ) | 325 | |||||||
| Income tax recovery |
— | 1,158 | 548 | |||||||||
|
|
|
|
|
|
|
|||||||
| Loss from discontinued operations |
$ | (16,107 | ) | $ | (3,202 | ) | $ | (1,436 | ) | |||
|
|
|
|
|
|
|
|||||||
| 8. | Intangible assets: |
| Definite life | Indefinite life | Total | ||||||||||||||
| Embedded equity in lease contracts |
Trade names and trademarks |
Safety manuals, AOCs and operating licenses |
||||||||||||||
| Cost: |
||||||||||||||||
| Balance, April 30, 2010 |
$ | 180,479 | $ | 179,900 | $ | 3,947 | $ | 364,326 | ||||||||
| Embedded equity in lease contracts realized |
(23,384 | ) | — | — | (23,384 | ) | ||||||||||
| Foreign exchange |
1,562 | — | 191 | 1,753 | ||||||||||||
|
|
|
|
|
|
|
|
|
|||||||||
| Balance, April 30, 2011 |
158,657 | 179,900 | 4,138 | 342,695 | ||||||||||||
| Embedded equity in lease contracts realized |
(19,840 | ) | — | — | (19,840 | ) | ||||||||||
| Foreign exchange |
(1,039 | ) | — | (197 | ) | (1,236 | ) | |||||||||
|
|
|
|
|
|
|
|
|
|||||||||
| April 30, 2012 |
$ | 137,778 | $ | 179,900 | $ | 3,941 | $ | 321,619 | ||||||||
|
|
|
|
|
|
|
|
|
|||||||||
| Impairment losses: |
||||||||||||||||
| Balance, April 30, 2010 |
(53,903 | ) | (25,000 | ) | — | (78,903 | ) | |||||||||
| Impairment loss |
(20,608 | ) | — | — | (20,608 | ) | ||||||||||
|
|
|
|
|
|
|
|
|
|||||||||
| Balance, April 30, 2011 |
(74,511 | ) | (25,000 | ) | — | (99,511 | ) | |||||||||
| Impairment loss |
(4,218 | ) | — | — | (4,218 | ) | ||||||||||
|
|
|
|
|
|
|
|
|
|||||||||
| April 30, 2012 |
$ | (78,729 | ) | $ | (25,000 | ) | $ | — | $ | (103,729 | ) | |||||
|
|
|
|
|
|
|
|
|
|||||||||
| Net book value: |
||||||||||||||||
| April 30, 2012 |
$ | 59,049 | $ | 154,900 | $ | 3,941 | $ | 217,890 | ||||||||
| April 30, 2011 |
84,146 | 154,900 | 4,138 | 243,184 | ||||||||||||
|
|
|
|
|
|
|
|
|
|||||||||
F-29
Table of Contents
6922767 HOLDING S.à.r.l.
Notes to Consolidated Financial Statements
(Tabular amounts expressed in thousands unless otherwise noted, except capital stock amounts)
| 8. | Intangible assets (continued): |
Due to a decline in aircraft values, the Company impaired a portion of its embedded equity in 2012 and 2011 to fair value. This measurement is considered a level 2 measurement in the fair value hierarchy as the measurement of embedded equity is based on aircraft values from third party appraisals using market data.
Embedded equity relates to the fair value of aircraft purchase options contained within leases on the date of our acquisition of the Predecessor. Embedded equity is not amortized, instead the embedded equity is added to the value of the purchased asset in the event that the lease purchase option is exercised.
| 9. | Goodwill: |
| Balance, April 30, 2010 |
$ | 425,514 | ||
| Foreign currency translation |
22,607 | |||
|
|
|
|||
| Balance, April 30, 2011 |
448,121 | |||
| Foreign currency translation |
(14,310 | ) | ||
|
|
|
|||
| Balance, April 30, 2012 |
$ | 433,811 | ||
|
|
|
|||
There is no active market for the Company’s reporting units. The fair value of all reporting units has been determined based on discounted cash flows using financial budgets approved by the Board of Directors covering a three-year period.
| 10. | Investments: |
| Percentage ownership |
2012 | 2011 | ||||||||||
| Equity accounted investments: |
||||||||||||
| TAS |
29.9 | % | $ | 15,548 | $ | 14,250 | ||||||
| Luchthaven Den Helder C.V. |
50 | % | 8,339 | 9,014 | ||||||||
| Helideck Certification Agency |
50 | % | 338 | 283 | ||||||||
|
|
|
|
|
|||||||||
| 24,225 | 23,547 | |||||||||||
| Other, at cost |
1 | 1 | ||||||||||
|
|
|
|
|
|||||||||
| Total |
$ | 24,226 | $ | 23,548 | ||||||||
|
|
|
|
|
|||||||||
There is no quoted market value available for the investments accounted under the equity method.
F-30
Table of Contents
6922767 HOLDING S.à.r.l.
Notes to Consolidated Financial Statements
(Tabular amounts expressed in thousands unless otherwise noted, except capital stock amounts)
| 11. | Inventories: |
| 2012 | 2011 | |||||||
| Work-in-progress for long-term maintenance contracts under completed contract accounting |
$ | 3,951 | $ | 5,989 | ||||
| Consumables |
96,588 | 105,713 | ||||||
| Provision for obsolescence |
(10,526 | ) | (9,478 | ) | ||||
|
|
|
|
|
|||||
| $ | 90,013 | $ | 102,224 | |||||
|
|
|
|
|
|||||
Direct costs includes $3.3 million write-down of inventory to the lower of cost or market value for the year ended April 30, 2012 (2011 – $4.8 million).
| 12. | Accounts receivable: |
The allowance for doubtful accounts continuity schedule is as follows:
| 2012 | 2011 | |||||||
| Balance, beginning of the year |
$ | (482 | ) | $ | (11,314 | ) | ||
| Additional recovery (allowances) |
(3,054 | ) | 1,981 | |||||
| Net write-offs and collections |
931 | 8,851 | ||||||
|
|
|
|
|
|||||
| Balance, end of the year |
$ | (2,605 | ) | $ | (482 | ) | ||
|
|
|
|
|
|||||
| 13. | Other assets: |
| 2012 | 2011 | |||||||
| Current: |
||||||||
| Aircraft operating lease funded residual value guarantees (a) |
$ | 7,004 | $ | 9,232 | ||||
| Foreign currency embedded derivatives and forward contracts |
6,524 | 9,389 | ||||||
| Deferred financing costs |
7,880 | 6,857 | ||||||
| Mobilization costs |
4,780 | 5,339 | ||||||
| Prepaid aircraft rentals |
4,958 | 3,870 | ||||||
| Residual value guarantee |
2,049 | 1,547 | ||||||
|
|
|
|
|
|||||
| $ | 33,195 | $ | 36,234 | |||||
|
|
|
|
|
|||||
| Non-current: |
||||||||
| Aircraft operating lease funded residual value guarantees (a) |
$ | 190,147 | $ | 164,339 | ||||
| Deferred financing costs |
50,698 | 52,176 | ||||||
| Prepaid aircraft rentals |
13,730 | 15,563 | ||||||
| Mobilization costs |
13,789 | 10,328 | ||||||
| Residual value guarantee |
11,632 | 9,358 | ||||||
| Foreign currency embedded derivatives and forward contracts |
1,695 | 8,765 | ||||||
| Accrued pension asset (note 20) |
19,449 | 15,326 | ||||||
| Pension guarantee assets (note 20) |
4,974 | 5,406 | ||||||
| Aircraft deposits |
44,557 | 37,268 | ||||||
| Security deposits |
10,027 | 512 | ||||||
| Other assets |
2,405 | 12 | ||||||
|
|
|
|
|
|||||
| $ | 363,103 | $ | 319,053 | |||||
|
|
|
|
|
|||||
F-31
Table of Contents
6922767 HOLDING S.à.r.l.
Notes to Consolidated Financial Statements
(Tabular amounts expressed in thousands unless otherwise noted, except capital stock amounts)
| 13. | Other assets (continued): |
| (a) | Aircraft operating lease funded residual value guarantees: |
The aircraft operating lease funded residual value guarantees includes amounts due from lessors on the financing of 112 aircraft under operating leases as at April 30, 2012 (2011 – 128 aircraft). Such guarantees bear interest at 0% to 10% (2011 – 0% to 10%) with principal and accrued interest due at maturity. These guarantees mature between fiscal 2013 and 2022. The Company believes that the aircraft will realize a value upon sale at the end of the lease terms sufficient to recover the carrying value of these guarantees, including accrued interest. In the event that aircraft values decline such that the Company does not believe funded residual value guarantees are recoverable, an impairment is recorded. During the year ended April 30, 2012, the Company recognized $7.4 million of interest income on these guarantees (2011 - $6.9 million, 2010 – $5.6 million) and $0.3 million of impairment recovery (2011 – $1.9 million, 2010 – $3.7 million of impairment losses).
| 14. | Other liabilities: |
| 2012 | 2011 | |||||||
| Current: |
||||||||
| Foreign currency embedded derivatives and foreign currency contracts |
$ | 11,089 | $ | 10,755 | ||||
| Unfavorable contract credits |
2,913 | 12,238 | ||||||
| Residual value guarantees |
83 | — | ||||||
| Lease aircraft return costs |
1,632 | 1,585 | ||||||
| Fixed interest rate obligations (a) |
2,900 | 3,167 | ||||||
| Contract inducement (note 3) |
801 | 824 | ||||||
| Deferred gains on sale-leasebacks of aircraft |
1,853 | 589 | ||||||
| Aircraft modifications |
2,377 | 3,148 | ||||||
|
|
|
|
|
|||||
| $ | 23,648 | $ | 32,306 | |||||
|
|
|
|
|
|||||
| Non-current: |
||||||||
| Accrued pension obligations (note 20) |
$ | 107,699 | $ | 103,877 | ||||
| Foreign currency embedded derivatives and foreign currency contracts |
17,384 | 24,807 | ||||||
| Unfavorable contract credits |
— | 3,060 | ||||||
| Residual value guarantees |
17,345 | 12,852 | ||||||
| Contract inducement (note 3) |
10,233 | 11,323 | ||||||
| Insurance claims accrual (b) |
13,646 | 10,417 | ||||||
| Fixed interest rate obligations (a) |
3,137 | 6,262 | ||||||
| Deferred gains on sale-leasebacks of aircraft |
14,475 | 4,683 | ||||||
| Deferred rent liabilities |
2,013 | 3,645 | ||||||
| Other |
5,589 | 7,728 | ||||||
|
|
|
|
|
|||||
| $ | 191,521 | $ | 188,654 | |||||
|
|
|
|
|
|||||
F-32
Table of Contents
6922767 HOLDING S.à.r.l.
Notes to Consolidated Financial Statements
(Tabular amounts expressed in thousands unless otherwise noted, except capital stock amounts)
| 14. | Other liabilities (continued): |
| (a) | Fixed interest rate obligations: |
As part of the acquisition of the Predecessor, the Company acquired certain operating leases where swap arrangements were entered into with lessors to fix the interest rate on these leases’ floating interest rates. These swap arrangements are a separately identifiable contractual right that were valued as part of the acquisition. These fixed interest rate obligations are being amortized over the related lease term as a charge to lease costs, recorded in direct costs in the statement of operations.
| (b) | Insurance claims accrual: |
The insurance claims accrual relates solely to the Company’s reinsurance subsidiary, CHC Reinsurance S.A. The amount represents accruals for losses that have been reported, but not yet paid and accruals for losses that have been incurred, but not yet reported. The reinsurance subsidiary reinsures certain employee benefits, death and disability benefits, loss of license insurance and coverage not available in the commercial insurance market for the operations of the Company.
| 15. | Debt obligations: |
| Principal Repayment terms |
Facility maturity dates |
2012 | 2011 | |||||||||||||
| Senior secured notes |
At maturity | October 2020 | $ | 1,084,109 | $ | 1,082,936 | ||||||||||
| Revolving credit facility: |
||||||||||||||||
| US LIBOR plus margin (i) |
At maturity | October 2015 | 125,000 | 70,000 | ||||||||||||
| Other term loans: |
||||||||||||||||
| Eurocopter Loan - 2.50% |
At maturity | June 2011 | — | 1,618 | ||||||||||||
| Eurocopter Loan - 2.50% |
On demand | — | 4,623 | — | ||||||||||||
| EDC US loan - 5.04% |
Semi-annually | November 2011 | — | 1,959 | ||||||||||||
| EDC-B.A. CDOR rate (6 month) plus margin (i) |
Semi-annually | June 2014 | 2,745 | 3,993 | ||||||||||||
| EDC-B.A. CDOR rate (6 month) plus margin (i) |
Semi-annually | April 2018 | 10,476 | 13,609 | ||||||||||||
| Capital lease obligations |
Quarterly | |
June 2012 - May 2014 |
|
26,922 | 117,371 | ||||||||||
| Boundary Bay Financing - 6.93% |
Monthly | April 2035 | 33,205 | — | ||||||||||||
|
|
|
|
|
|||||||||||||
| Total long-term debt |
1,287,080 | 1,291,486 | ||||||||||||||
| Less: current portion |
(17,701 | ) | (106,642 | ) | ||||||||||||
|
|
|
|
|
|||||||||||||
| Long-term |
$ | 1,269,379 | $ | 1,184,844 | ||||||||||||
|
|
|
|
|
|||||||||||||
| (i) | Margins range from 0.8% to 4.5% during the year ended April 30, 2012 (2011 – 0.8% to 3.75%) |
F-33
Table of Contents
6922767 HOLDING S.à.r.l.
Notes to Consolidated Financial Statements
(Tabular amounts expressed in thousands unless otherwise noted, except capital stock amounts)
| 15. | Debt obligations (continued): |
| (a) | Senior secured notes: |
On October 4, 2010, the Company completed the refinancing of its long-term debt obligations which included the issuance of $1,100.0 million in senior secured notes (the “notes”), a new revolving credit facility agreement, and the repayment of the senior credit facilities using the proceeds from the senior secured note issuance. As a result of the long-term debt refinancing, the Company wrote-off $47.1 million in deferred financing costs related to the senior credit facilities and incurred additional fees of $42.7 million, which are being amortized over the terms of the respective debt instruments.
The notes with an aggregate principal of $1,100.0 million, due October 15, 2020 were issued at 98.399% of par value and bear interest at 9.25% with semi-annual interest payments on April 15 and October 15. The notes have been recorded net of the discount and are being accreted to face value using the effective interest rate method.
The notes were issued by one of the Company’s subsidiaries and are guaranteed by the Company and most of its subsidiaries through a general secured obligation. The notes are secured on a first-priority lien basis by the collateral of each guarantor subject to the permitted liens under the indenture, are subordinated to the priority payment lien obligations including the revolving credit facility and senior to all unsecured indebtedness of each guarantor.
The notes have the following optional redemption features:
| • | Any time prior to October 15, 2013, the Company can redeem 35% of the aggregate principal amount of the notes at a redemption price of 109.25% of the principal plus accrued and unpaid interest provided that at least 50% of the aggregate principal of the notes remains outstanding and the redemption occurs within 180 days of the issuance date. |
| • | The Company can redeem the notes in whole or part, on or after October 15, 2015, at redemption prices that range from 100% to 104.625% of the principal, plus accrued and unpaid interest. |
| • | The Company can redeem up to 10% of the aggregate principal amount of the notes in any twelve month period following the issuance date up to October 15, 2015 at a redemption price of 103% of the principal plus accrued interest and unpaid interest. |
| • | The Company can redeem the notes in whole or in part at a price of 100% of the aggregate principal amount plus a premium equal to the greater of 1% of the principal amount or the excess of the present value at the redemption date over the principal amount of the notes. Under this option, the present value at the redemption is to be computed based on a redemption price of 104.625% on October 15, 2015 plus all required interest payments due on the notes through October 15, 2015 (excluding accrued but unpaid interest to the applicable redemption date). The applicable discount rate is equal to the treasury rate plus 50 basis points. |
F-34
Table of Contents
6922767 HOLDING S.à.r.l.
Notes to Consolidated Financial Statements
(Tabular amounts expressed in thousands unless otherwise noted, except capital stock amounts)
| 15. | Debt obligations (continued): |
| (a) | Senior secured notes (continued): |
Each holder of the notes has the right to require the Company to repurchase the notes at a purchase price of 101% of the principal amount plus accrued and unpaid interest upon the occurrence of certain events constituting a change in control of the Company.
The notes contain certain covenants limiting the incurrence of additional indebtedness and liens based on the ratio of consolidated adjusted earnings before interest, taxes, depreciation and amortization to fixed charges and total indebtedness as defined in the indenture and other restrictions including limitations on disposition of assets, the payment of dividends or redemption of equity interests and transactions with affiliates. As at April 30, 2012, the Company was in compliance with these covenants.
| (b) | Revolving credit facility: |
The revolving credit facility of $375.0 million is held with a syndicate of financial institutions and bears interest at the Alternate Base Rate, LIBOR, Canadian Prime Rate or EURIBOR plus an applicable margin that ranges from 2.75% to 4.50% based on the total leverage ratio calculated as of the most recent quarter. The revolving credit facility has a five year term. The availability on the revolving credit facility at April 30, 2012 is $165.0 million, net of $85.0 million outstanding letters of credit.
The revolving credit facility is secured on a super senior first priority basis and ranks equally with the senior secured notes except for payments upon enforcement and insolvency, where the revolving credit facility will rank before the note holders. The revolving credit facility is guaranteed by most of the Company’s subsidiaries through a general secured obligation. The revolving credit facility covenants include a requirement for the Company to maintain a first priority debt leverage ratio of 2.5:1, which is tested at the end of each financial quarter. At April 30, 2012 the Company was in compliance with all revolving credit facility covenants.
| (c) | Boundary Bay financing: |
On April 17, 2012, the Company sold its Boundary Bay facility (“the facility”) to a third party for $37.0 million and entered into a 23 year lease agreement to lease the building from the third party for $263,679 per month for the first five years with an increase of the lesser of 12% or CPI every five years. Under the lease agreement the Company has the option to purchase the property during the first 10 years of the lease for $46.4 million up to April 2017 and $47.9 million from May 2017 to April 2022. The Company also has an option to renew the lease agreement for an additional 10 years and a second option to renew the lease for a further five years.
As a result of the option to repurchase the facility, which indicates that the Company has continuing involvement, the disposal of the facility was accounted for as a financing and not a sale. ASC 360-20 specifies the accounting required for a seller’s sale and simultaneous leaseback involving real estate. As a financing, no gain on the sale of the facility was recognized in the Consolidated Statements of Operations.
As a financing, the facility remains on the Consolidated Balance Sheets and continues to be amortized. The related proceeds were recorded as a finance obligation with payments recorded to interest expense and the finance obligation based on the amortization of the obligation over the life of the lease agreement.
F-35
Table of Contents
6922767 HOLDING S.à.r.l.
Notes to Consolidated Financial Statements
(Tabular amounts expressed in thousands unless otherwise noted, except capital stock amounts)
| 15. | Debt obligations (continued): |
| (c) | Boundary Bay financing (continued): |
The transaction provided a vendor take back mortgage of $3.5 million to the purchaser. It bears interest at 8.55% and the interest is payable monthly. The mortgage is due and payable in April 2013. The finance obligation has been recorded net of the take back mortgage receivable.
| (d) | Debt denominated in foreign currencies: |
Total debt obligations, including capital leases, denominated in foreign currencies and the US dollar equivalent are as follows:
| 2012 | 2011 | |||||||||||||
| Debt in original currency |
US dollar equivalent |
Debt in original currency |
US dollar equivalent |
|||||||||||
| € | 3,495 | $ | 4,623 | € | 3,199 | $ | 4,730 | |||||||
| £ | — | — | £ | 7,111 | 11,830 | |||||||||
| CAD | 45,887 | 46,426 | CAD | 16,741 | 17,602 | |||||||||
|
|
|
|
|
|||||||||||
| $ | 51,049 | $ | 34,162 | |||||||||||
|
|
|
|
|
|||||||||||
| (e) | Repayment requirements: |
Repayment requirements related to the total debt obligations outstanding as of April 30, 2012 over the next five years and thereafter are as follows:
| Boundary Bay financing |
Capital lease obligations |
Other long-term debt (i) |
Total | |||||||||||||
| 2013 |
$ | (3,364 | ) | $ | 10,769 | $ | 7,467 | $ | 14,872 | |||||||
| 2014 |
152 | 1,051 | 2,844 | 4,047 | ||||||||||||
| 2015 |
165 | 16,188 | 2,295 | 18,648 | ||||||||||||
| 2016 |
179 | — | 126,747 | 126,926 | ||||||||||||
| 2017 |
195 | — | 1,746 | 1,941 | ||||||||||||
| and thereafter |
35,878 | — | 1,101,746 | 1,137,624 | ||||||||||||
|
|
|
|
|
|
|
|
|
|||||||||
| 33,205 | 28,008 | 1,242,845 | 1,304,058 | |||||||||||||
| Less interest |
— | (1,086 | ) | — | (1,086 | ) | ||||||||||
|
|
|
|
|
|
|
|
|
|||||||||
| Total |
$ | 33,205 | $ | 26,922 | $ | 1,242,845 | $ | 1,302,972 | ||||||||
|
|
|
|
|
|
|
|
|
|||||||||
| (i) | These amounts exclude the discount on the Senior secured notes of $15.9 million which is included in the carrying amount of debt at April 30, 2012. |
F-36
Table of Contents
6922767 HOLDING S.à.r.l.
Notes to Consolidated Financial Statements
(Tabular amounts expressed in thousands unless otherwise noted, except capital stock amounts)
| 16. | Other financing charges: |
| For the year ended | ||||||||||||
| April 30, 2012 |
April 30, 2011 |
April 30, 2010 |
||||||||||
| Write-off of unamortized transaction costs on the senior facility agreement |
$ | — | $ | 47,140 | $ | — | ||||||
| Amortization of deferred financing costs |
6,851 | 7,151 | 4,036 | |||||||||
| Loss on interest rate swap |
— | 8,656 | 1,182 | |||||||||
| Net loss (gain) on fair value of derivative financial instruments |
5,380 | (5,567 | ) | 12,935 | ||||||||
| Amortization of guaranteed residual values |
1,852 | 1,248 | 542 | |||||||||
| Interest expense |
8,542 | 6,672 | 10,616 | |||||||||
| Interest income |
(12,928 | ) | (10,802 | ) | (10,641 | ) | ||||||
| Other |
5,365 | 12,538 | 2,789 | |||||||||
|
|
|
|
|
|
|
|||||||
| $ | 15,062 | $ | 67,036 | $ | 21,459 | |||||||
|
|
|
|
|
|
|
|||||||
| 17. | Income taxes: |
The Company’s income tax recovery (expense) is comprised as follows:
| For the year ended | ||||||||||||
| April 30, 2012 |
April 30, 2011 |
April 30, 2010 |
||||||||||
| Current income tax recovery (expense): |
||||||||||||
| Luxembourg |
$ | (2,294 | ) | $ | (5,857 | ) | $ | (7,615 | ) | |||
| Foreign |
(13,751 | ) | 1,631 | (37,016 | ) | |||||||
|
|
|
|
|
|
|
|||||||
| (16,045 | ) | (4,226 | ) | (44,631 | ) | |||||||
| Deferred income tax recovery (expense): |
||||||||||||
| Related to origination and reversal of temporary differences from foreign jurisdictions |
23,452 | 56,355 | 35,358 | |||||||||
| Change in valuation allowance |
(55,624 | ) | (19,213 | ) | (24 | ) | ||||||
|
|
|
|
|
|
|
|||||||
| Income tax recovery (expense) |
$ | (48,217 | ) | $ | 32,916 | $ | (9,297 | ) | ||||
|
|
|
|
|
|
|
|||||||
During the year ended April 30, 2012, the change in valuation allowance includes an adjustment to the opening balance due to a change in judgment about the realizability of the related deferred tax assets in future years in addition to valuation allowance against current year losses.
The components of loss from continuing operations before income tax is comprised as follows:
| For the year ended | ||||||||||||
| April 30, 2012 |
April 30, 2011 |
April 30, 2010 |
||||||||||
| Luxembourg |
$ | (38,499 | ) | $ | 5,411 | $ | 61,930 | |||||
| Foreign |
7,823 | (100,394 | ) | (127,699 | ) | |||||||
|
|
|
|
|
|
|
|||||||
| $ | (30,676 | ) | $ | (94,983 | ) | $ | (65,769 | ) | ||||
|
|
|
|
|
|
|
|||||||
F-37
Table of Contents
6922767 HOLDING S.à.r.l.
Notes to Consolidated Financial Statements
(Tabular amounts expressed in thousands unless otherwise noted, except capital stock amounts)
| 17. | Income taxes (continued): |
As the Company operates in several tax jurisdictions, its income is subject to various rates of taxation. The income tax recovery (expense) differs from the amount that would have resulted from applying the Luxembourg statutory income tax rates to loss before taxes as follows:
| For the year ended | ||||||||||||
| April 30, 2012 |
April 30, 2011 |
April 30, 2010 |
||||||||||
| Loss from continuing operations before income tax |
$ | (30,676 | ) | $ | (94,983 | ) | $ | (65,769 | ) | |||
| Combined Luxemburg statutory income tax rate |
29 | % | 29 | % | 29 | % | ||||||
|
|
|
|
|
|
|
|||||||
| Income tax recovery calculated at statutory rate |
8,896 | 27,545 | 19,073 | |||||||||
| (Increase) decrease in income tax recovery (expense) resulting from: |
||||||||||||
| Rate differences in various jurisdictions |
33,522 | 60,930 | 73,116 | |||||||||
| Change in tax law |
(3,558 | ) | 493 | (1,283 | ) | |||||||
| Non-deductible items |
(29,365 | ) | (58,007 | ) | (88,132 | ) | ||||||
| Other foreign taxes |
(14,846 | ) | (7,740 | ) | (15,593 | ) | ||||||
| Non-deductible portion of capital losses (gains) |
991 | (373 | ) | 4,301 | ||||||||
| Non-taxable income |
10,292 | 1,442 | 3,781 | |||||||||
| Adjustments to prior years |
(3,399 | ) | (2,047 | ) | 7,781 | |||||||
| Functional currency adjustments |
4,627 | 32,163 | (13,468 | ) | ||||||||
| Valuation allowance |
(55,624 | ) | (19,213 | ) | (24 | ) | ||||||
| Other |
247 | (2,277 | ) | 1,151 | ||||||||
|
|
|
|
|
|
|
|||||||
| Income tax recovery (expense) |
$ | (48,217 | ) | $ | 32,916 | $ | (9,297 | ) | ||||
|
|
|
|
|
|
|
|||||||
F-38
Table of Contents
6922767 HOLDING S.à.r.l.
Notes to Consolidated Financial Statements
(Tabular amounts expressed in thousands unless otherwise noted, except capital stock amounts)
| 17. | Income taxes (continued): |
Deferred income taxes reflect the net tax effects of temporary differences between the carrying amounts of assets and liabilities for financial reporting purposes and the amounts used for income tax purposes. The tax effects of temporary differences that give rise to significant portions of deferred income tax assets and deferred income tax liabilities are presented below:
| 2012 | 2011 | |||||||
| Deferred income tax assets: |
||||||||
| Pension and other employee benefits |
$ | 18,573 | $ | 16,716 | ||||
| Losses carried forward |
356,697 | 295,652 | ||||||
| Deferred costs |
— | 1,146 | ||||||
| Current accounts payable and receivable |
9,139 | 6,093 | ||||||
| Intangible assets |
— | 3,140 | ||||||
|
|
|
|
|
|||||
| Total deferred income tax assets |
384,409 | 322,747 | ||||||
| Valuation allowance |
(227,838 | ) | (165,877 | ) | ||||
|
|
|
|
|
|||||
| Net deferred income tax assets |
$ | 156,571 | $ | 156,870 | ||||
|
|
|
|
|
|||||
| Deferred income tax liabilities: |
||||||||
| Intangible assets |
$ | (6,501 | ) | $ | — | |||
| Property, plant and equipment |
(56,144 | ) | (29,635 | ) | ||||
| Deferred capital gains and deferred revenue |
(54,508 | ) | (64,968 | ) | ||||
| Long-term debt |
(4,964 | ) | (11,917 | ) | ||||
| Deferred costs |
(5,897 | ) | — | |||||
| Other |
(2,873 | ) | (1,077 | ) | ||||
|
|
|
|
|
|||||
| Net deferred income taxes |
$ | 25,684 | $ | 49,273 | ||||
|
|
|
|
|
|||||
| Distributed as follows: |
||||||||
| Current deferred income tax assets |
$ | 8,542 | $ | 7,596 | ||||
| Current deferred income tax liabilities |
(11,729 | ) | (13,035 | ) | ||||
| Long-term deferred income tax assets |
48,943 | 90,882 | ||||||
| Long-term deferred income tax liabilities |
(20,072 | ) | (36,170 | ) | ||||
|
|
|
|
|
|||||
| $ | 25,684 | $ | 49,273 | |||||
|
|
|
|
|
|||||
As at April 30, 2012, the Company has non-capital loss carry forwards for Luxembourg and other foreign jurisdictions that are available to reduce taxable income in future years. These non-capital loss carry forwards expire as follows:
| 2013 | 2015 | 2017 and thereafter |
No expiry date |
Total | ||||||||||||||||
| Tax losses (i): |
||||||||||||||||||||
| Africa |
$ | — | $ | 10,913 | $ | 955 | $ | 12,458 | $ | 24,326 | ||||||||||
| Australia |
— | — | — | 46,669 | 46,669 | |||||||||||||||
| Brazil |
— | — | — | 88,279 | 88,279 | |||||||||||||||
| Canada |
— | — | 145,196 | — | 145,196 | |||||||||||||||
| Denmark |
— | — | — | 29,458 | 29,458 | |||||||||||||||
| Netherlands |
2,727 | — | 13,275 | — | 16,002 | |||||||||||||||
| Norway |
— | — | — | 457,479 | 457,479 | |||||||||||||||
| Ireland |
— | — | — | 16,986 | 16,986 | |||||||||||||||
| United Kingdom |
— | — | — | 98,237 | 98,237 | |||||||||||||||
| Luxembourg |
— | — | — | 251,825 | 251,825 | |||||||||||||||
| United States |
— | — | 19,072 | — | 19,072 | |||||||||||||||
| Other |
— | — | 25,371 | 200 | 25,571 | |||||||||||||||
|
|
|
|
|
|
|
|
|
|
|
|||||||||||
| $ | 2,727 | $ | 10,913 | $ | 203,869 | $ | 1,001,591 | $ | 1,219,100 | |||||||||||
|
|
|
|
|
|
|
|
|
|
|
|||||||||||
| (i) | Represents the gross amount of tax loss carry forwards translated at closing exchange rates at April 30, 2012. |
F-39
Table of Contents
6922767 HOLDING S.à.r.l.
Notes to Consolidated Financial Statements
(Tabular amounts expressed in thousands unless otherwise noted, except capital stock amounts)
| 17. | Income taxes (continued): |
The Company has also accumulated approximately $184.6 million in capital losses (April 30, 2011 -$184.8 million), which carry forward indefinitely. None of the capital losses are available to reduce future capital gains realized in Luxembourg, and $184.6 million are available to reduce future capital gains realized in other foreign jurisdictions (April 30, 2011 – $184.8 million).
As at April 30, 2012, the Company has provided a valuation allowance in respect of $494.6 million of the non-capital losses (April 30, 2011 – $430.6 million) (2012 – Luxembourg – $251.8 million, other jurisdictions – $242.8 million; 2011 – Luxembourg – $278.0 million, other jurisdictions – $152.6 million) and $184.6 million (April 30, 2011 – $184.8 million) of the capital losses in other foreign jurisdictions. The benefit anticipated from the utilization of the remaining non–capital and capital losses has been recorded as a deferred income tax asset.
Uncertain tax positions:
The following table summarizes activity of the total amounts of unrecognized tax benefits:
| For the year ended | ||||||||||||
| April 30, 2012 |
April 30, 2011 |
April 30, 2010 |
||||||||||
| Opening balance |
$ | 15,302 | $ | 16,448 | $ | 15,834 | ||||||
| Additions in the current year |
8,014 | 122 | 8,914 | |||||||||
| Reductions in current year |
(6,643 | ) | (2,181 | ) | (1,840 | ) | ||||||
| Reduction due to lapse of statutory limitations |
— | — | (9,848 | ) | ||||||||
| Foreign exchange |
(748 | ) | 913 | 3,388 | ||||||||
|
|
|
|
|
|
|
|||||||
| Total |
$ | 15,925 | $ | 15,302 | $ | 16,448 | ||||||
|
|
|
|
|
|
|
|||||||
The following table summarizes information regarding income tax related interest and penalties:
| For the year ended | ||||||||||||
| April 30, 2012 |
April 30, 2011 |
April 30, 2010 |
||||||||||
| Net reduction in interest and penalties |
$ | (227 | ) | $ | (628 | ) | $ | (1,029 | ) | |||
|
|
|
|
|
|
|
|||||||
The total amount of interest and penalties accrued on the balance sheet at April 30, 2012 was $2.9 million (2011 – $3.1 million).
General tax contingencies:
The Company is subject to taxes in different countries. Taxes and fiscal risks recognized in the Consolidated Financial Statements reflect the Company’s best estimate of the outcome based on the facts known at the balance sheet date in each individual country. These facts may include, but are not limited to, change in tax laws and interpretation thereof in the various jurisdictions where the Company operates. They may have an impact on the income tax as well as the resulting assets and liabilities. Any differences between tax estimates and final tax assessments are charged to the statement of operations in the period in which they are incurred.
F-40
Table of Contents
6922767 HOLDING S.à.r.l.
Notes to Consolidated Financial Statements
(Tabular amounts expressed in thousands unless otherwise noted, except capital stock amounts)
| 17. | Income taxes (continued): |
General tax contingencies (continued):
In addition, the Company’s business and operations are complex and include a number of significant financings, acquisitions and dispositions. The determination of earnings, payroll and other taxes involves many factors including the interpretation of tax legislation in multiple jurisdictions in which the Company is subject to ongoing tax assessments. When applicable, the Company adjusts the previously recorded income tax expense, direct costs, interest and the associated assets and liabilities to reflect its change in estimates or assessments. These adjustments could materially change the Company’s results of operations.
| 18. | Capital stock: |
As at April 30, 2012, the authorized capital stock of the Company is 1,228,377,770 with a par value of 1 Euro.
| Number of capital stock and CPECs issued | ||||||||
| Capital stock | CPECs | |||||||
| April 30, 2009 |
12,500 | 1,205,624,393 | ||||||
| Conversion of series A CPECs |
1,184,667,289 | (1,184,667,289 | ) | |||||
| Conversion of series B CPECs |
15,375,200 | (15,375,200 | ) | |||||
| Conversion of series C CPECs |
5,581,904 | (5,581,904 | ) | |||||
| Redemption of capital stock |
(20,957,104 | ) | — | |||||
|
|
|
|
|
|||||
| April 30, 2010 |
1,184,679,789 | — | ||||||
| Capital stock |
113,978 | — | ||||||
|
|
|
|
|
|||||
| April 30, 2011 |
1,184,793,767 | — | ||||||
| Capital stock |
43,584,003 | — | ||||||
|
|
|
|
|
|||||
| April 30, 2012 |
1,228,377,770 | — | ||||||
|
|
|
|
|
|||||
Each series of the CPECs had a par value of 1 euro, was convertible into one share of capital stock of the Company with mandatory redemption or conversion to capital stock at the option of the Company, 51 years from the date of issuance if not previously redeemed in whole, repurchased or converted. In the event of liquidation, the CPECs must be redeemed or converted to capital stock, at the discretion of the Company. The CPECs have a yield payable of 0% per annum. On May 12, 2009, all outstanding Series A, B and C CPECs were converted to capital stock.
In 2010, shares of capital stock were redeemed for total consideration of $27.8 million (comprised of cash and the extinguishment of a loan due from a shareholder of the Parent Company). The consideration in excess of the book value of the capital stock was recorded as a decrease to retained earnings.
On September 9, 2010, the Company issued 113,978 shares of capital stock for consideration of $0.1 million.
On October 13, 2011, the Company issued 43,584,000 shares of capital stock for consideration of $60.0 million. On November 11, 2011, the Company issued one share of capital stock for consideration of $20.0 million, which was allocated one Euro to the Capital stock of the Company and $20.0 million to contributed surplus. On February 13, 2012, the Company issued two shares of capital stock for consideration of $20.0 million, which was allocated two Euros to the Capital stock of the Company and $20.0 million to contributed surplus.
F-41
Table of Contents
6922767 HOLDING S.à.r.l.
Notes to Consolidated Financial Statements
(Tabular amounts expressed in thousands unless otherwise noted, except capital stock amounts)
| 19. | Stock Based Compensation: |
| (a) | 2011 Management Equity Plan (“2011 Plan”): |
On December 30, 2011, 6922767 Holding (Cayman) Inc., the parent of the Company (“the Parent”), adopted an equity compensation plan that permits it to grant time and performance options, performance options and/or restricted share units to certain eligible employees, directors or consultants of the Parent and its affiliates. As of April 30, 2012, a maximum of 137.1 million of the outstanding Ordinary B shares may be granted under the 2011 Plan.
The time and performance options vest in four equal annual installments of 25% beginning one year from the date of grant. All of the unvested time and performance options will vest immediately in the event the Ordinary A shareholders receive distributions equal to their initial investment or on a change of control. The time and performance options cannot be exercised until the occurrence of either, (1) an initial public offering or subsequent public offering of the equity of the Company or (2) the merger, consolidation, sale of interests or sale of assets of the Company (collectively an “Exit Event”) which results in an exit value being equal to or in excess of the initial investment by the Ordinary A shareholders in the Parent.
The term of stock options issued under the 2011 Plan may not exceed the earlier of an Exit Event or ten years from the date of grant. Under the 2011 Plan, the time and performance options and the performance options are granted at an exercise price that is not to be less than 100% of the fair value of an Ordinary B share of 6922767 Holding (Cayman) Inc. on the date of grant.
The performance options vest and are exercisable in up to three equal tranches based on the satisfaction of specified performance conditions. The first third of the options will vest on the occurrence of an Exit Event which results in an exit value being equal to or in excess of the initial investment by the Ordinary A shareholders. The second third of the options will vest on the occurrence of an Exit Event which results in an exit value being equal to or in excess of two times the initial investment by the Ordinary A shareholders. The remaining options will vest on the occurrence of an Exit Event which results in an exit value being equal to or in excess of two and a half times the initial investment by the Ordinary A shareholders.
Restricted Share Units (“RSUs”) vest on the date of grant as they are fully paid up on the grant date. The eligible employee receives Ordinary B shares of the Parent equal to the number of RSUs in exchange for the RSUs on the earlier to occur of (1) the fifth anniversary of the date of grant; and (2) the date of a change of control. The holders of RSUs are entitled to receive cash dividend equivalents based on the cash dividends paid on the Ordinary B shares during the period the RSUs are outstanding.
F-42
Table of Contents
6922767 HOLDING S.à.r.l.
Notes to Consolidated Financial Statements
(Tabular amounts expressed in thousands unless otherwise noted, except capital stock amounts)
| 19. | Stock Based Compensation (continued): |
| (a) | 2011 Management Equity Plan (“2011 Plan”) (continued): |
The following table summarizes the time and performance stock option activity under the 2011 Plan:
| Number of options |
Year ended April 30, 2012 | |||||||||||
| Weighted average exercise price |
Weighted remaining contractual life |
|||||||||||
| Outstanding, beginning of period |
— | $ | — | |||||||||
| Granted |
36,144,451 | 0.65 | ||||||||||
| Forfeited |
— | — | ||||||||||
| Exchanged options |
5,676,525 | 0.65 | ||||||||||
|
|
|
|
|
|
|
|||||||
| Outstanding, end of period |
41,820,976 | $ | 0.65 | 9.6 years | ||||||||
|
|
|
|
|
|
|
|||||||
| Exercisable, end of period |
— | |||||||||||
|
|
|
|||||||||||
The following table summarizes the performance stock option activity under the 2011 Plan:
| Number of options |
Year ended April 30, 2012 | |||||||||||
| Weighted average exercise price |
Weighted remaining contractual life |
|||||||||||
| Outstanding, beginning of period |
— | $ | — | |||||||||
| Granted |
74,267,700 | 0.65 | ||||||||||
| Forfeited |
— | — | ||||||||||
| Exchanged shares |
170,000 | 0.65 | ||||||||||
|
|
|
|
|
|
|
|||||||
| Outstanding, end of period |
74,437,700 | $ | 0.65 | 9.6 years | ||||||||
|
|
|
|
|
|
|
|||||||
| Exercisable, end of period |
— | |||||||||||
|
|
|
|||||||||||
For accounting purposes, time and performance stock options are considered to have a market condition (based on the exit value) and a performance condition (based on an Exit Event). The effect of the market condition has been reflected in the grant date fair value of the award.
The fair value of the 2011 stock options was estimated using a Monte-Carlo simulation model. The key factors that will create value in these awards include the year of an Exit Event, the probability that an Exit Event will occur in a particular year, the risk free interest rate and the ultimate exit value of the Company, which is estimated using historical volatility and implied volatility data of ten peer companies’ stock price. The following table indicates ranges of estimates and assumptions used in the calculation:
| Year of Exit Event |
2012 - 2019 | |||||
| Probability of Exit Event |
Base case | 50% in years 2014 to 2017 | ||||
| Accelerated exit | 25% in years 2013 to 2016 | |||||
| Delayed exit | 25% in years 2015 and 2018 | |||||
| Risk free rate |
0.03% - 2.01% | |||||
| Expected dividends |
nil | |||||
| Historical volatility |
43.59% - 51.88% |
F-43
Table of Contents
6922767 HOLDING S.à.r.l.
Notes to Consolidated Financial Statements
(Tabular amounts expressed in thousands unless otherwise noted, except capital stock amounts)
| 19. | Stock Based Compensation (continued): |
| (a) | 2011 Management Equity Plan (“2011 Plan”) (continued): |
The weighted average grant date fair value of the time and performance stock options granted during 2012 was $0.23 per share. No compensation expense has been recognized in relation to the time and performance options during the year ended April 30, 2012 as the performance criteria has not been met and it is not probable that the criteria will be met in the future. If the performance condition related to the Exit Event had occurred on April 30, 2012, we would have recorded $10.4 million of stock compensation expense on that date related to the time and performance options.
The weighted average grant date fair value of the performance options granted during 2012 was $0.21 per option. No compensation expense has been recognized in relation to the performance options during the year ended April 30, 2012 as the performance criteria have not been met and there is not yet enough certainty that the criteria would be met in the future. If the Exit Event had occurred on April 30, 2012 and had realized: (1) an exit value being equal to or in excess of the initial investment by the Ordinary A shareholders the Company would have recorded $5.6 million of stock compensation expense; (2) an Exit Event which results in an exit value being equal to or in excess of two times the initial investment by the Ordinary A shareholders the Company would have recorded $10.8 million of stock compensation expense; (3) an exit value equal to or exceeding two and a half times the initial investment by the Ordinary A shareholders, the Company would have recorded $15.2 million of stock compensation expense on that date related to the performance options.
| (b) | Share Incentive Plan (“2008 Plan”): |
On September 16, 2008 the Company introduced a Share Incentive Plan (“the 2008 Plan”) under which options and Special Share Awards can be granted to eligible employees of the Company.
Under the 2008 Plan, options may be granted to employees to purchase Ordinary B shares of the Parent. Each option provides the right to purchase one Ordinary B share. Each option expires at the earlier of the tenth anniversary of the effective date of such options or the occurrence of a Exit Event as defined in the Plan.
Under the Plan, employees may also be granted the right to subscribe to Special A shares of the Parent Company at a specified subscription price. Each Special A share issued may be redeemed in cash or in kind in connection with a future Exit Event. Special A shares vest when two performance criteria have been met: an Exit Event occurs and the value of the exit equals or exceeds 2 times the original investment on September 16, 2008. Special A shares can only be redeemed six months and one day after vesting. The total number of Special A shares allotted for future issuance under the Plan is 10,000,000.
On December 30, 2011, certain employees exchanged 3,784,350 unvested options and 1,892,175 of the options that vested on September 16, 2011 under the 2008 Plan for the same number of time and performance options under the 2011 Plan. The same employees exchanged 170,000 Special A shares for the same number of performance options under the 2011 Plan.
F-44
Table of Contents
6922767 HOLDING S.à.r.l.
Notes to Consolidated Financial Statements
(Tabular amounts expressed in thousands unless otherwise noted, except capital stock amounts)
| 19. | Stock Based Compensation (continued): |
| (b) | Share Incentive Plan (“2008 Plan”) (continued): |
The exchange of the options changed the exercise price from $1 to $0.6515, which resulted in an incremental cost of $0.4 million. No compensation expense has been recognized in relation to the incremental cost during the year ended April 30, 2012 as the performance criteria related to Exit Event has not been met and it is not probable that the criteria will be met in the future. As of April 30, 2012, $1.2 million remained to be recognized for the unvested 2008 options. The unrecognized compensation expense of $1.2 million will be recognized over the four-year vesting period as the options would have vested under the terms of the original options.
The following table summarizes the stock option activity under the 2008 Plan:
| April 30, 2012 | April 30, 2011 | |||||||||||||||||||||||
| Number of options |
Weighted average exercise price |
Weighted remaining contractual life |
Number of options |
Weighted average exercise price |
Weighted remaining contractual life |
|||||||||||||||||||
| Outstanding, beginning of year |
29,829,585 | $ | 1.00 | 38,956,549 | $ | 1.00 | ||||||||||||||||||
| Granted |
— | — | — | — | ||||||||||||||||||||
| Forfeited |
(1,780,871 | ) | 1.00 | (9,126,964 | ) | 1.00 | ||||||||||||||||||
| Exchanged options |
(5,676,525 | ) | 1.00 | — | 1.00 | |||||||||||||||||||
|
|
|
|
|
|
|
|
|
|
|
|
|
|||||||||||||
| Outstanding, end of year |
22,372,189 | $ | 1.00 | 6.4 years | 29,829,585 | $ | 1.00 | 7.4 years | ||||||||||||||||
|
|
|
|
|
|
|
|
|
|
|
|
|
|||||||||||||
| Exercisable, end of year |
20,702,623 | 19,533,926 | ||||||||||||||||||||||
|
|
|
|
|
|||||||||||||||||||||
There were no Special A shares granted during the year ended April 30, 2012 (2011 – nil), 36,000 Special A shares were forfeited (2011 – 172,000) and 170,000 Special A shares were exchanged for 170,000 performance options in the 2011 plan (2011 – nil). At April 30, 2012, there were 318,000 unvested Special A shares outstanding (2011 – 524,000).
No compensation expense has been recognized in relation to the Special A shares during the year ended April 30, 2012 (2011 – nil, 2010 – nil) as the two performance criteria have not been met and there is not yet enough certainty that the criteria would be met in the future. If the two performance criteria had been met on April 30, 2012, we would have recorded $2.4 million of stock compensation expense on that date related to the Special A shares.
During the year ended April 30, 2012, the Company recorded stock compensation expense of $0.8 million (2011 – $1.7 million, 2010 – $4.0 million) in the statement of operations.
F-45
Table of Contents
6922767 HOLDING S.à.r.l.
Notes to Consolidated Financial Statements
(Tabular amounts expressed in thousands unless otherwise noted, except capital stock amounts)
| 20. | Employee pension plans: |
| (a) | Defined contribution pension plans: |
The following table summarizes contributions to defined contribution plans:
| For the year ended | ||||||||||||
| April 30, 2012 |
April 30, 2011 |
April 30, 2010 |
||||||||||
| Company contributions |
$ | 14,197 | $ | 13,859 | $ | 11,512 | ||||||
| (b) | Defined benefit pension plans: |
The Company has funded and unfunded and flat-benefit and final-pay defined benefit pension plans in Canada, the UK, Norway and the Netherlands for approximately 30% of the Company’s active employees. Funded plans require the Company to make cash contributions to ensure there will be sufficient assets to discharge the plans’ benefit obligations as they become due. Unfunded plans do not require contributions to be paid into the plans as the Company pays the benefit obligations directly as they are due. Employer contributions expected to be paid to the defined benefit pension plans during the fiscal year ended April 30, 2013, required by funding regulations and law, are $41.3 million.
The plan assets and accrued benefit obligation are measured at fair value as at April 30, 2012. Actuarial valuations are obtained by the Company at least every three years. The most recent actuarial valuations of the defined benefit pension plans were conducted as at April 30, 2012 and the next actuarial valuations are required as at April 30, 2015.
At April 30, 2012, in accordance with changes to applicable United Kingdom statutes, pensions in deferment will be revalued annually based on the Consumer Prices Index, as opposed to the Retail Prices Index which was previously used. The impact on the projected benefit obligation was a gain that was recorded in accumulated other comprehensive earnings (loss) of $14.8 million and is included in the prior service cost.
In 2010, the Norwegian Parliament enacted a new multi-employer early retirement plan for the private sector in Norway, which was effective January 1, 2011. As a result of this legislation, the Company was partially released from its obligation under the Company’s prior early retirement plan (a single-employer defined benefit plan) and the Company recorded a curtailment gain of $1.2 million. The Company recognizes the contributions made to the new multi-employer plan as net pension expense, which includes both cash and the fair market value of non-cash contributions, and recognizes a liability for any unpaid contributions.
On September 1, 2009, the UK defined benefit plan was curtailed resulting in an elimination of the right of all members of the plan to earn defined benefits for future services. A curtailment loss of $3.7 million was recognized in net earnings (loss).
F-46
Table of Contents
6922767 HOLDING S.à.r.l.
Notes to Consolidated Financial Statements
(Tabular amounts expressed in thousands unless otherwise noted, except capital stock amounts)
| 20. | Employee pension plans (continued): |
| (b) | Defined benefit pension plans (continued): |
For the UK defined benefit pension plan the investment policy requires that the plan assets held be invested as follows:
| Category |
Maximum percentage | |
| UK equities |
22% to 28% | |
| Overseas equities |
22% to 28% | |
| Bonds |
24% to 45% | |
| Property |
4% to 18% | |
| Multi-strategy fund |
2% to 18% | |
The investment policy requires that the assets held in the Norwegian plans are to be diversified as shown below. The total equities, emerging markets bonds, high yield bonds, hedge funds and private equity funds can be a maximum 60% of total assets.
| Category |
Maximum percentage | |||
| Norwegian equities |
15 | % | ||
| International equities |
35 | % | ||
|
|
|
|||
| Total equities |
35 | % | ||
| Structured products |
10 | % | ||
| High yield bonds |
25 | % | ||
| Emerging markets bonds |
0 | % | ||
| Government bonds |
70 | % | ||
|
|
|
|||
| Total bonds |
100 | % | ||
| Money market |
100 | % | ||
| Property funds |
15 | % | ||
| Hedge funds |
0 | % | ||
| Private equity funds |
10 | % | ||
For the assets held in the plan in the Netherlands, 80% must be invested in fixed rate investments and the remaining 20% invested in shares with a maximum deviation of 5% upwards or downwards. The total of equities, high yield bonds, emerging markets bonds, hedge funds and private equity funds can be a maximum of 60% of total assets.
While the asset mix varies in each plan, overall the asset mix, as a percentage of total market value, of all the defined benefit plans at April 30, 2012 was 21% (2011 – 21%) equities, 58% (2011 – 45%) fixed income and 21% (2011 – 34%) money market.
For all defined benefit pension plans the overall expected long-term rates of return on plan assets have been determined in part by assessing current and expected asset allocations as well as historical and expected returns on various categories of the assets. Such expected rates of return ignore short-term fluctuations. For the UK plan it is expected that the rate of return on the plan assets will be between approximately 5.4% in excess of price inflation for equities, 5.1% in excess of price inflation for property and 1.4% in excess of inflation for bonds. For the plans in Norway and the Netherlands, the expected long-term rate of return is considered in reference to the longest stated bond rates in each country.
F-47
Table of Contents
6922767 HOLDING S.à.r.l.
Notes to Consolidated Financial Statements
(Tabular amounts expressed in thousands unless otherwise noted, except capital stock amounts)
| 20. | Employee pension plans (continued): |
| (b) | Defined benefit pension plans (continued): |
| 2012 | 2011 | |||||||
| Change in benefit obligations: |
||||||||
| Benefit obligations, beginning of year |
$ | 726,908 | $ | 700,822 | ||||
| Current service costs |
17,573 | 20,028 | ||||||
| Plan curtailment and settlement |
— | (9,263 | ) | |||||
| Interest cost |
35,344 | 33,842 | ||||||
| Plan amendments |
(14,766 | ) | 1,675 | |||||
| Actuarial loss (gain) |
41,719 | (63,469 | ) | |||||
| Benefits paid |
(27,526 | ) | (24,550 | ) | ||||
| Foreign currency translation |
(44,190 | ) | 67,823 | |||||
|
|
|
|
|
|||||
| Benefit obligations, end of year |
$ | 735,062 | $ | 726,908 | ||||
|
|
|
|
|
|||||
| Change in plan assets: |
||||||||
| Fair value of plan assets, beginning of year |
$ | 638,357 | $ | 536,541 | ||||
| Actual gain on plan assets |
30,205 | 35,316 | ||||||
| Employer contributions |
43,372 | 29,745 | ||||||
| Employee contributions |
2,911 | — | ||||||
| Benefits paid |
(25,983 | ) | (20,740 | ) | ||||
| Plan curtailment and settlement |
— | (4,698 | ) | |||||
| Foreign currency translation |
(42,050 | ) | 62,193 | |||||
|
|
|
|
|
|||||
| Fair value of plan assets, end of year |
$ | 646,812 | $ | 638,357 | ||||
|
|
|
|
|
|||||
| 2012 | 2011 | |||||||
| Accumulated benefit obligation |
$ | 702,696 | $ | 669,329 | ||||
|
|
|
|
|
|||||
| Projected benefit obligation |
$ | 735,062 | $ | 726,908 | ||||
| Fair value of plan assets |
646,812 | 638,357 | ||||||
|
|
|
|
|
|||||
| Funded status |
88,250 | 88,551 | ||||||
| Pension guarantee assets |
(4,974 | ) | (5,406 | ) | ||||
|
|
|
|
|
|||||
| Net recognized pension liability |
$ | 83,276 | $ | 83,145 | ||||
|
|
|
|
|
|||||
| 2012 | 2011 | |||||||
| Net recognized pension liability: |
||||||||
| Non-current asset - pension guarantee assets (note 13) |
$ | 4,974 | $ | 5,406 | ||||
| Non-current asset (note 13) |
19,449 | 15,326 | ||||||
| Non-current liability (note 14) |
(107,699 | ) | (103,877 | ) | ||||
F-48
Table of Contents
6922767 HOLDING S.à.r.l.
Notes to Consolidated Financial Statements
(Tabular amounts expressed in thousands unless otherwise noted, except capital stock amounts)
| 20. | Employee pension plans (continued): |
| (b) | Defined benefit pension plans (continued): |
| 2012 | 2011 | |||||||
| Amounts recorded in accumulated other comprehensive (earnings) loss: |
||||||||
| Unrecognized net actuarial and experience losses |
$ | 62,004 | $ | 15,432 | ||||
| Unrecognized prior service costs (credits) |
(12,980 | ) | 1,762 | |||||
|
|
|
|
|
|||||
| $ | 49,024 | $ | 17,194 | |||||
|
|
|
|
|
|||||
The significant weighted average actuarial assumptions adopted in measuring the defined benefit pension plan obligations and net benefit plan expense as at April 30, 2012 and 2011 are as follows:
| 2012 | 2011 | |||||||
| Discount rate |
4.40 | % | 5.35 | % | ||||
| Rate of compensation increase |
2.31 | % | 2.22 | % | ||||
| Discount rate for pension expense |
4.98 | % | 4.97 | % | ||||
| Expected long-term rate of return on plan assets |
5.60 | % | 6.11 | % | ||||
The net defined benefit pension plan expense is as follows:
| For the year ended | ||||||||||||
| April 30, 2012 |
April 30, 2011 |
April 30, 2010 |
||||||||||
| Current service cost |
$ | 17,573 | $ | 20,028 | $ | 19,080 | ||||||
| Interest cost |
35,344 | 33,842 | 32,841 | |||||||||
| Curtailment and settlement loss (gain) |
— | (1,757 | ) | 3,684 | ||||||||
| Expected return on plan assets |
(34,691 | ) | (30,258 | ) | (30,107 | ) | ||||||
| Amortization of net actuarial and experience losses |
507 | 1,703 | 58 | |||||||||
| Amortization of past service costs (credits) |
(249 | ) | 89 | — | ||||||||
| Employee contributions |
(2,911 | ) | (1,681 | ) | (3,024 | ) | ||||||
|
|
|
|
|
|
|
|||||||
| $ | 15,573 | $ | 21,966 | $ | 22,532 | |||||||
|
|
|
|
|
|
|
|||||||
F-49
Table of Contents
6922767 HOLDING S.à.r.l.
Notes to Consolidated Financial Statements
(Tabular amounts expressed in thousands unless otherwise noted, except capital stock amounts)
| 20. | Employee pension plans (continued): |
| (b) | Defined benefit pension plans (continued): |
The components of other comprehensive loss (earnings) relating to the plans consists of the following:
| For the year ended | ||||||||||||
| April 30, 2012 |
April 30, 2011 |
April 30, 2010 |
||||||||||
| Other comprehensive loss (earnings): |
||||||||||||
| Net loss (gain) |
$ | 46,452 | $ | (71,937 | ) | $ | 55,255 | |||||
| Net prior service cost (credit) |
(14,766 | ) | 1,675 | — | ||||||||
| Amortization of net actuarial loss (gain), past service costs and transition amounts |
(258 | ) | (1,792 | ) | (58 | ) | ||||||
| Settlements and curtailments |
— | (554 | ) | — | ||||||||
| Foreign exchange translation |
402 | 576 | 1,535 | |||||||||
|
|
|
|
|
|
|
|||||||
| $ | 31,830 | $ | (72,032 | ) | $ | 56,732 | ||||||
|
|
|
|
|
|
|
|||||||
As at April 30, 2012, the estimated amount that will be amortized from accumulated other comprehensive loss into net period benefit cost is $2.9 million.
| (c) | Pension plan assets and fair value measurement: |
| April 30, 2012 | ||||||||||||||||
| Quoted prices in active markets for identical assets (Level 1) |
Significant other observable inputs (Level 2) |
Significant unobservable inputs (Level 3) |
Total plan assets |
|||||||||||||
| Assets: |
||||||||||||||||
| Cash equivalents and other short-term investments |
$ | 27,339 | $ | — | $ | — | $ | 27,339 | ||||||||
| Equity investments |
134,207 | — | — | 134,207 | ||||||||||||
| Fixed income |
372,082 | — | — | 372,082 | ||||||||||||
| Money market and other |
81,470 | — | 31,714 | 113,184 | ||||||||||||
|
|
|
|
|
|
|
|
|
|||||||||
| $ | 615,098 | $ | — | $ | 31,714 | $ | 646,812 | |||||||||
|
|
|
|
|
|
|
|
|
|||||||||
F-50
Table of Contents
6922767 HOLDING S.à.r.l.
Notes to Consolidated Financial Statements
(Tabular amounts expressed in thousands unless otherwise noted, except capital stock amounts)
| 20. | Employee pension plans (continued): |
| (c) | Pension plan assets and fair value measurement (continued): |
| April 30, 2011 | ||||||||||||||||
| Quoted prices in active markets for identical assets (Level 1) |
Significant other observable inputs (Level 2) |
Significant unobservable inputs (Level 3) |
Total plan assets |
|||||||||||||
| Assets: |
||||||||||||||||
| Cash equivalents and other short-term investments |
$ | 22,008 | $ | — | $ | — | $ | 22,008 | ||||||||
| Equity investments |
141,071 | — | — | 141,071 | ||||||||||||
| Fixed income |
438,836 | — | — | 438,836 | ||||||||||||
| Money market and other |
8,654 | — | 27,788 | 36,442 | ||||||||||||
|
|
|
|
|
|
|
|
|
|||||||||
| $ | 610,569 | $ | — | $ | 27,788 | $ | 638,357 | |||||||||
|
|
|
|
|
|
|
|
|
|||||||||
The methods and assumptions used to estimate the fair value of the pension assets in level 1 are based on publicly available quoted market prices. The level 3 assets are valued using third party appraisals and changes in the level 3 assets are as follows:
| 2012 | 2011 | |||||||
| Opening |
$ | 27,788 | $ | 21,282 | ||||
| Actual return on assets |
3,037 | 2,143 | ||||||
| Purchases, sales and settlements, net |
3,054 | 4,419 | ||||||
| Foreign currency translation |
(2,165 | ) | (56 | ) | ||||
|
|
|
|
|
|||||
| $ | 31,714 | $ | 27,788 | |||||
|
|
|
|
|
|||||
| (d) | Benefit Payments: |
As at April 30, 2012, benefits expected to be paid under the defined benefit pension plans in each of the next five fiscal years and in aggregate for the fiscal years thereafter, are as follows:
| Pension benefits | ||||
| 2013 |
$ | 29,472 | ||
| 2014 |
31,112 | |||
| 2015 |
32,618 | |||
| 2016 |
34,471 | |||
| 2017 |
36,315 | |||
| Thereafter |
201,722 | |||
|
|
|
|||
| $ | 365,710 | |||
|
|
|
|||
F-51
Table of Contents
6922767 HOLDING S.à.r.l.
Notes to Consolidated Financial Statements
(Tabular amounts expressed in thousands unless otherwise noted, except capital stock amounts)
| 21. | Derivative financial instruments and fair value measurements: |
The Company is exposed to foreign exchange risk primarily from its subsidiaries which incur revenue and operating expenses in currencies other than their functional currency with the most significant being Pound Sterling, Norwegian Kroner, Canadian dollars, Australian dollars and Euros. The Company monitors these exposures through its cash forecasting process and regularly enters into foreign exchange forward contracts to manage its exposure to fluctuations in expected future cash flows from foreign operations and anticipated transactions in currencies other than the functional currency.
The Company entered into forward exchange contracts that qualified for hedge accounting treatment to manage its exposure to anticipated payroll transaction costs incurred in Canadian dollars and aircraft purchase commitments incurred in Euros. On February 1, 2010, the Company de-designated its hedging relationship for its payroll foreign exchange forward contracts and discontinued hedge accounting. The accumulation of previously recognized fair value gains and losses in accumulated other comprehensive earnings (loss) is reclassified to net earnings (loss) within direct costs as the forecasted transactions occur.
The Company’s outstanding foreign exchange forward contracts are as follows:
| Notional | Fair value | Maturity dates | ||||||||
| April 30, 2012: |
||||||||||
| Purchase contracts to sell US dollars and buy Canadian dollars |
CAD | 250,502 | $ | 6,743 | May 2012 to October 2014 | |||||
| Purchase contracts to sell US dollars and buy Euros |
€ | 16,872 | (1,551 | ) | September 2012 | |||||
| Notional | Fair value | Maturity dates | ||||||||
| April 30, 2011: |
||||||||||
| Purchase contracts to sell US dollars and buy Canadian dollars |
CAD | 216,207 | $ | 17,682 | May 2011 to December 2013 | |||||
| Purchase contracts to sell US dollars and buy Euros |
€ | 78,362 | 826 | June 2011 to April 2012 | ||||||
A loss in the amount of $12.8 million was recognized as an other financing charge related to non-hedging derivative forward exchange contracts in the statement of operations for the year ended April 30, 2012 (2011 – a gain of $24.5 million; 2010 – a gain of $12.4 million).
The Company enters into long-term revenue agreements, which provide for pricing denominated in currencies other than the functional currency of the parties to the contract. This pricing feature was determined to be an embedded derivative which has been bifurcated for valuation and accounting purposes. The embedded derivative contracts are measured at fair value and included in other assets or other liabilities.
A gain of $7.4 million due to the change in the fair value of embedded derivatives was recognized in the statement of operations as a part of other financing charges for the year ended April 30, 2012 (2011 – loss of $18.9 million, 2010 – loss of $25.3 million).
F-52
Table of Contents
6922767 HOLDING S.à.r.l.
Notes to Consolidated Financial Statements
(Tabular amounts expressed in thousands unless otherwise noted, except capital stock amounts)
| 21. | Derivative financial instruments and fair value measurements (continued): |
The following tables summarize the financial instruments measured at fair value on a recurring basis excluding cash and cash equivalents and restricted cash:
| April 30, 2012 | ||||||||||||||||
| Quoted prices in active markets for identical assets (Level 1) |
Significant other observable inputs (Level 2) |
Significant unobservable inputs (Level 3) |
Fair value | |||||||||||||
| Financial assets |
||||||||||||||||
| Other assets, current: |
||||||||||||||||
| Foreign currency forward contracts |
$ | — | $ | 6,036 | $ | — | $ | 6,036 | ||||||||
| Foreign currency embedded derivatives |
— | 488 | — | 488 | ||||||||||||
| Other assets, non-current: |
||||||||||||||||
| Foreign currency forward contracts |
— | 1,630 | — | 1,630 | ||||||||||||
| Foreign currency embedded derivatives |
— | 65 | — | 65 | ||||||||||||
|
|
|
|
|
|
|
|
|
|||||||||
| $ | — | $ | 8,219 | $ | — | $ | 8,219 | |||||||||
|
|
|
|
|
|
|
|
|
|||||||||
| Financial liabilities |
||||||||||||||||
| Other liabilities, current: |
||||||||||||||||
| Foreign currency forward contracts |
$ | — | $ | (1,747 | ) | $ | — | $ | (1,747 | ) | ||||||
| Foreign currency embedded derivatives |
— | (9,342 | ) | — | (9,342 | ) | ||||||||||
| Other liabilities, non-current: |
||||||||||||||||
| Foreign currency forward contracts |
— | (728 | ) | — | (728 | ) | ||||||||||
| Foreign currency embedded derivatives |
— | (16,656 | ) | — | (16,656 | ) | ||||||||||
|
|
|
|
|
|
|
|
|
|||||||||
| $ | — | $ | (28,473 | ) | $ | — | $ | (28,473 | ) | |||||||
|
|
|
|
|
|
|
|
|
|||||||||
| April 30, 2011 | ||||||||||||||||
| Quoted prices in active markets for identical assets (Level 1) |
Significant other observable inputs (Level 2) |
Significant unobservable inputs (Level 3) |
Fair value | |||||||||||||
| Financial assets |
||||||||||||||||
| Other assets, current: |
||||||||||||||||
| Foreign currency forward contracts |
$ | — | $ | 9,213 | $ | — | $ | 9,213 | ||||||||
| Foreign currency embedded derivatives |
— | 176 | — | 176 | ||||||||||||
| Other assets, non-current: |
||||||||||||||||
| Foreign currency forward contracts |
— | 8,762 | — | 8,762 | ||||||||||||
| Foreign currency embedded derivatives |
— | 3 | — | 3 | ||||||||||||
|
|
|
|
|
|
|
|
|
|||||||||
| $ | — | $ | 18,154 | $ | — | $ | 18,154 | |||||||||
|
|
|
|
|
|
|
|
|
|||||||||
| Financial liabilities |
||||||||||||||||
| Other liabilities, current: |
||||||||||||||||
| Foreign currency embedded derivatives |
$ | — | $ | (10,755 | ) | $ | — | $ | (10,755 | ) | ||||||
| Other liabilities, non-current: |
||||||||||||||||
| Foreign currency embedded derivatives |
— | (24,807 | ) | — | (24,807 | ) | ||||||||||
|
|
|
|
|
|
|
|
|
|||||||||
| $ | — | $ | (35,562 | ) | $ | — | $ | (35,562 | ) | |||||||
|
|
|
|
|
|
|
|
|
|||||||||
F-53
Table of Contents
6922767 HOLDING S.à.r.l.
Notes to Consolidated Financial Statements
(Tabular amounts expressed in thousands unless otherwise noted, except capital stock amounts)
| 21. | Derivative financial instruments and fair value measurements (continued): |
Inputs to the valuation methodology for Level 2 measurements include quoted prices for similar assets and liabilities in active markets, and inputs are observable for the asset or liability, either directly or indirectly, for substantially the full term of the financial instrument. The Company has no transfers between categories in the fair value hierarchy.
The carrying values of the Company’s other financial instruments, which are measured at other than fair value, approximate fair value due to the short terms to maturity, except for the senior secured notes, the fair value of which is as follows:
| April 30, 2012 | April 30, 2011 | |||||||||||||||
| Fair value | Carrying value | Fair value | Carrying value | |||||||||||||
| Senior secured notes |
$ | 1,091,750 | $ | 1,084,109 | $ | 1,071,125 | $ | 1,082,936 | ||||||||
The fair value of the senior secured notes is determined based on quoted market prices which is considered to be a level 2 measurement in the fair value hierarchy.
| 22. | Supplemental cash flow information: |
| For the year ended | ||||||||||||
| April 30, 2012 |
April 30, 2011 |
April 30, 2010 |
||||||||||
| Cash interest paid |
$ | 110,163 | $ | 132,453 | $ | 63,413 | ||||||
| Cash taxes paid |
15,584 | 21,986 | 21,205 | |||||||||
| Extinguishment of shareholder loan on redemption of capital stock |
— | — | 7,808 | |||||||||
| Assets acquired through non-cash capital leases |
48,529 | 126,415 | — | |||||||||
| Assets under construction related to aircraft purchase contracts novated to lessors |
— | — | 45,306 | |||||||||
Change in cash resulting from changes in operating assets and liabilities:
| For the year ended | ||||||||||||
| April 30, 2012 |
April 30, 2011 |
April 30, 2010 |
||||||||||
| Receivables |
$ | (38,397 | ) | $ | (37,614 | ) | $ | (14,971 | ) | |||
| Income taxes |
5,170 | (8,693 | ) | 25,341 | ||||||||
| Inventory |
5,007 | (8,021 | ) | 2,866 | ||||||||
| Prepaid expenses |
(4,335 | ) | 6,894 | (14,088 | ) | |||||||
| Payable and accruals |
12,407 | 26,071 | 1,208 | |||||||||
| Deferred revenue |
4,645 | 14,057 | (1,519 | ) | ||||||||
| Other assets and liabilities |
(7,123 | ) | (5,388 | ) | (1,530 | ) | ||||||
|
|
|
|
|
|
|
|||||||
| $ | (22,626 | ) | $ | (12,694 | ) | $ | (2,693 | ) | ||||
|
|
|
|
|
|
|
|||||||
F-54
Table of Contents
6922767 HOLDING S.à.r.l.
Notes to Consolidated Financial Statements
(Tabular amounts expressed in thousands unless otherwise noted, except capital stock amounts)
| 23. | Guarantees: |
The Company has provided limited guarantees to third parties under some of its operating leases relating to a portion of the residual aircraft values at the termination of the leases, which have terms expiring between fiscal 2013 and 2022. The Company’s exposure under the asset value guarantees including guarantees in the form of funded residual value guarantees, rebateable advance rentals and deferred payments is approximately $223.0 million as at April 30, 2012 (2011 – $198.4 million).
| 24. | Related party transactions: |
| (a) | Related party leasing transactions and balances: |
During the years ended April 30, 2012 and 2011, the Company engaged in leasing transactions with VIEs related to the Ultimate Parent Company (note 4).
| (b) | Balances with Ultimate Parent: |
At April 30, 2012, $2.0 million in payables and accruals is due to and $0.9 million in receivables is due from the Ultimate Parent.
| 25. | Commitments: |
The Company entered into aircraft operating leases with 18 lessors in respect of 164 aircraft included in the Company’s fleet at April 30, 2012 (2011 – 18 lessors in respect of 166 aircraft). As at April 30, 2012, these leases had expiry dates ranging from fiscal 2013 to 2022. The Company has the option to purchase the majority of the aircraft for agreed amounts that do not constitute bargain purchase options, but has no commitment to do so. With respect to such leased aircraft, substantially all of the costs of major inspections of airframes and the costs to perform inspections, major repairs and overhauls of major components are at the Company’s expense. The Company either performs this work internally through its own repair and overhaul facilities or has the work performed by an external repair and overhaul service provider.
At April 30, 2012, the Company had commitments with respect to operating leases for aircraft, buildings, land and equipment. The minimum lease rentals required under such leases are payable in the following amounts over the following fiscal years:
| Aircraft operating leases |
Building, land and equipment operating leases |
Total operating leases |
||||||||||
| 2013 |
$ | 209,352 | $ | 8,112 | $ | 217,464 | ||||||
| 2014 |
184,249 | 7,222 | 191,471 | |||||||||
| 2015 |
165,130 | 5,894 | 171,024 | |||||||||
| 2016 |
147,580 | 4,668 | 152,248 | |||||||||
| 2017 |
124,055 | 3,888 | 127,943 | |||||||||
| Thereafter |
356,090 | 61,112 | 417,202 | |||||||||
|
|
|
|
|
|
|
|||||||
| $ | 1,186,456 | $ | 90,896 | $ | 1,277,352 | |||||||
|
|
|
|
|
|
|
|||||||
During the year ended April 30, 2012, the Company incurred aircraft operating lease and related costs of $176.7 million (2011 – $164.8 million; 2010 – $145.1 million) and other operating lease costs of $9.3 million (2011 – $9.0 million, 2010 – $8.1 million).
F-55
Table of Contents
6922767 HOLDING S.à.r.l.
Notes to Consolidated Financial Statements
(Tabular amounts expressed in thousands unless otherwise noted, except capital stock amounts)
| 25. | Commitments (continued): |
As at April 30, 2012, the Company has committed to purchase 23 aircraft (2011 – 17 aircraft). The total required additional expenditures related to these purchase commitments is approximately $558.0 million. These aircraft are expected to be delivered in fiscal 2013 ($118.6 million), 2014 ($160.0 million), 2015 to 2017 ($279.4 million) and will be deployed in the Company’s Helicopter Services segment. The Company intends to enter into leases for these aircraft or purchase them outright upon delivery from the manufacturer.
The terms of certain of the Company’s helicopter lease agreements impose operating and financial limitations on the Company. Such agreements limit the extent to which the Company may, among other things, incur indebtedness and fixed charges relative to its level of consolidated adjusted earnings before interest, taxes, depreciation and amortization.
Generally, in the event of a covenant breach, a lessor has the option to terminate the lease and require the return of the aircraft, with the repayment of any arrears of lease payments plus the present value of all future lease payments and certain other amounts which could be material to the Company’s financial position. The aircraft would then be sold and the surplus, if any, returned to the Company. Alternatively the Company could exercise its option to purchase the aircraft. As at April 30, 2012 the Company was in compliance with all financial covenants.
Subsequent to April 30, 2012, a lessor that had been engaged in discussions with the Company approved a financial covenant reset to October 31, 2013. As part of previous negotiations in 2011 with this lessor, the Company also made a commitment to further reduce its total operating lease portfolio by $64.4 million.
| 26. | Contingencies: |
The Company and its subsidiaries are, from time to time, named as defendants in lawsuits arising in the ordinary course of our business. The Company maintains adequate insurance coverage to respond to most claims. The Company cannot predict the outcome of any such lawsuits with certainty, but management does not expect the outcome of pending or threatened legal matters to have a material adverse impact on our financial condition.
In addition, from time to time, the Company and its subsidiaries are subject to investigation by various government agencies in the jurisdictions in which we operate. In 2006, we voluntarily disclosed to OFAC that our subsidiary formerly operating as Schreiner Airways may have violated applicable U.S. laws and regulations by re-exporting to Iran, Sudan, and Libya certain helicopters, related parts, map data, operation and maintenance manuals, and aircraft parts for third-party customers. OFAC’s investigation is ongoing and the Company continues to fully cooperate. Should the U.S. government determine that these activities violated applicable laws and regulations, we or our subsidiaries could be subject to civil or criminal penalties, including fines and/or suspension of the privilege to engage in trading activities involving goods, software and technology subject to the U.S. jurisdiction. At April 30, 2012, it is not possible to determine the outcome of this matter, or the significance, if any, to our business, financial condition and result of operations.
F-56
Table of Contents
6922767 HOLDING S.à.r.l.
Notes to Consolidated Financial Statements
(Tabular amounts expressed in thousands unless otherwise noted, except capital stock amounts)
| 26. | Contingencies (continued): |
Brazilian customs authorities seized one of the Company’s helicopters (valued at approximately $10.0 million) as a result of allegations that the Company violated Brazilian customs law by failing to ensure its customs agent and the customs agent’s third party shipping company followed approved routing of the helicopter during transport. The Company secured release of the helicopter and is disputing through administrative court action any claim for penalties associated with the seizure and the alleged violation. The Company has preserved its rights by filing a civil action against its customs agent for any losses that may result. At April 30, 2012, it is not possible to determine the outcome of this matter, or the significance, if any, to our business, financial condition and result of operations.
Our Brazilian subsidiary is disputing a claim from the Brazilian tax authorities regarding eligibility for certain tax benefits that our subsidiary claimed in the past in connection with the importation of aircraft parts. The tax authorities are seeking to assess up to $20 million in additional taxes plus interest and penalties. We believe that based on our interpretation of tax legislation and well established aviation industry practice we are in compliance with all applicable tax legislation. On December 19, 2011, a First Level Administrative Panel decision reduced the assessment to $0.3 million. We are appealing the remaining assessment. We will continue to defend this claim vigorously. At April 30, 2012, it is not possible to determine the outcome of this matter, or the significance, if any, to our business, financial condition and result of operations.
Our Brazilian subsidiary is also disputing claims from the Brazilian tax authorities that it was not entitled to certain credits in 2004 and 2007. The tax authorities are seeking up to $3.8 million in additional taxes plus interest and penalties. We believe that based on our interpretation of tax legislation and well established aviation industry practice we are in compliance with all applicable tax legislation and plan to defend this claim vigorously. At April 30, 2012, it is not possible to determine the outcome of this matter, or the significance, if any, to our business, financial condition and result of operations.
The Company received an inquiry from the Nigerian government regarding the tax treatment of certain of its former joint venture partner’s operations in Nigeria. The Company is cooperating with the government of Nigeria. At April 30, 2012, it is not possible to determine the outcome of this matter, or the significance, if any, to our business, financial condition and result of operations.
In the United Kingdom, the Ministry for Transport is investigating potential wrongdoing involving two ex-employees in conjunction with the SAR-H bid award processes. This arose from the Company self-reporting potential improprieties by these individuals upon their discovery in 2010. The SAR-H bid process was subsequently cancelled. The Company will continue to cooperate in all aspects of the investigation. At April 30, 2012, it is not possible to determine the outcome of this matter, or the significance, if any, to our business, financial condition and result of operations.
F-57
Table of Contents
6922767 HOLDING S.à.r.l.
Notes to Consolidated Financial Statements
(Tabular amounts expressed in thousands unless otherwise noted, except capital stock amounts)
| 27. | Segment information: |
The Company operates under the following segments:
| • | Helicopter Services; |
| • | Maintenance, repair and overhaul (“MRO”); and |
| • | Corporate and other. |
The Company has provided information on segment revenues and segment EBITDAR (adjusted) because these are the financial measures used by the Company’s Chief operating decision maker in making operating decisions and assessing performance. Transactions between operating segments are at standard industry rates.
The Helicopter Services segment includes flying operations around the world serving offshore oil and gas, EMS/SAR and other industries.
The MRO segment includes facilities in Norway, Canada, Australia, and the US that provide helicopter repair and overhaul services for the Company’s fleet and for a growing external customer base in Europe, Asia and North America.
During 2011, the Company changed its internal structure resulting in the former European Operations and Global Operations segments being combined to form the Helicopter Services segment. In addition, the former Fleet segment was eliminated as the activities of this segment are now being managed as a cost centre as opposed to as a revenue generating division of the Company. While management does not include aircraft lease and associated costs in an internal measure of profitability for the Helicopter Services segment, these costs are now presented in the Helicopter Services column as they are most directly attributable to Helicopter Services operations and revenues.
Corporate and other includes corporate office costs in various jurisdictions and is not considered a reportable segment.
The accounting policies of the segments and the basis of accounting for transactions between segments are the same as those described in the summary of significant accounting policies.
F-58
Table of Contents
6922767 HOLDING S.à.r.l.
Notes to Consolidated Financial Statements
(Tabular amounts expressed in thousands unless otherwise noted, except capital stock amounts)
| 27. | Segment information (continued): |
| For the year ended April 30, 2012 | ||||||||||||||||||||
| Helicopter services |
MRO | Corporate and other |
Inter-segment eliminations |
Consolidated | ||||||||||||||||
| Revenue from external customers |
$ | 1,520,223 | $ | 166,479 | $ | 5,837 | $ | — | $ | 1,692,539 | ||||||||||
| Add: Inter-segment revenues |
7,550 | 275,920 | 18 | (283,488 | ) | — | ||||||||||||||
|
|
|
|
|
|
|
|
|
|
|
|||||||||||
| Total revenue |
1,527,773 | 442,399 | 5,855 | (283,488 | ) | 1,692,539 | ||||||||||||||
| Direct costs (i) |
(1,117,216 | ) | (353,485 | ) | (18,002 | ) | 283,488 | (1,205,215 | ) | |||||||||||
| Earnings from equity accounted investees |
2,844 | — | — | — | 2,844 | |||||||||||||||
| General and administrative |
— | — | (69,590 | ) | — | (69,590 | ) | |||||||||||||
|
|
|
|
|
|
|
|
|
|
|
|||||||||||
| Segment EBITDAR (adjusted) (ii) |
413,401 | 88,914 | (81,737 | ) | — | 420,578 | ||||||||||||||
| Aircraft lease and associated costs |
(176,685 | ) | — | — | — | (176,685 | ) | |||||||||||||
| Amortization |
(112,967 | ) | ||||||||||||||||||
| Restructuring costs |
(22,511 | ) | ||||||||||||||||||
| Recovery of receivables and funded residual value guarantees |
272 | |||||||||||||||||||
| Impairment of intangible assets |
(4,218 | ) | ||||||||||||||||||
| Impairment of assets held for sale |
(13,469 | ) | ||||||||||||||||||
| Gain on disposal of assets |
8,169 | |||||||||||||||||||
| Interest on long-term debt |
(116,578 | ) | ||||||||||||||||||
| Foreign exchange gain |
1,795 | |||||||||||||||||||
| Other financing charges |
(15,062 | ) | ||||||||||||||||||
| Income tax expense |
(48,217 | ) | ||||||||||||||||||
|
|
|
|||||||||||||||||||
| Loss from continuing operations |
(78,893 | ) | ||||||||||||||||||
| Loss from discontinued operations, net of tax |
(16,107 | ) | ||||||||||||||||||
|
|
|
|||||||||||||||||||
| Loss for the year |
$ | (95,000 | ) | |||||||||||||||||
|
|
|
|||||||||||||||||||
| Segment assets |
$ | 858,930 | $ | 392,150 | $ | 1,385,089 | $ | — | $ | 2,636,169 | ||||||||||
| Segment assets - held-for-sale (note 7) |
521 | — | 79,292 | — | 79,813 | |||||||||||||||
|
|
|
|
|
|
|
|
|
|
|
|||||||||||
| Total assets |
$ | 859,451 | $ | 392,150 | $ | 1,464,381 | $ | — | $ | 2,715,982 | ||||||||||
|
|
|
|
|
|
|
|
|
|
|
|||||||||||
| Segment capital asset expenditures |
$ | 11,762 | $ | 114,971 | $ | 249,891 | $ | — | $ | 376,624 | ||||||||||
| Segment goodwill |
433,811 | — | — | — | 433,811 | |||||||||||||||
|
|
|
|
|
|
|
|
|
|
|
|||||||||||
| (i) | Direct costs in the segment information presented excludes aircraft lease and associated costs. In the consolidated statement of operations these costs are combined. |
| (ii) | Segment EBITDAR (adjusted) is defined as revenues less directs costs, excluding aircraft lease and associated costs, general and administrative expenses plus earnings from equity accounted investees. |
F-59
Table of Contents
6922767 HOLDING S.à.r.l.
Notes to Consolidated Financial Statements
(Tabular amounts expressed in thousands unless otherwise noted, except capital stock amounts)
| 27. | Segment information (continued): |
| For the year ended April 30, 2011 | ||||||||||||||||||||
| Helicopter services |
MRO | Corporate and other |
Inter-segment eliminations |
Consolidated | ||||||||||||||||
| Revenue from external customers |
$ | 1,311,983 | $ | 129,222 | $ | 4,255 | $ | — | $ | 1,445,460 | ||||||||||
| Add: Inter-segment revenues |
7,508 | 238,397 | 617 | (246,522 | ) | — | ||||||||||||||
|
|
|
|
|
|
|
|
|
|
|
|||||||||||
| Total revenue |
1,319,491 | 367,619 | 4,872 | (246,522 | ) | 1,445,460 | ||||||||||||||
| Direct costs (i), (iii) |
(951,268 | ) | (324,057 | ) | (18,049 | ) | 246,522 | (1,046,852 | ) | |||||||||||
| Earnings from equity accounted investees |
2,159 | — | — | — | 2,159 | |||||||||||||||
| General and administrative |
— | — | (65,391 | ) | — | (65,391 | ) | |||||||||||||
|
|
|
|
|
|
|
|
|
|
|
|||||||||||
| Segment EBITDAR (adjusted) (ii) |
370,382 | 43,562 | (78,568 | ) | — | 335,376 | ||||||||||||||
| Aircraft lease and associated costs |
(164,828 | ) | — | — | — | (164,828 | ) | |||||||||||||
| Amortization |
(99,625 | ) | ||||||||||||||||||
| Restructuring costs |
(4,751 | ) | ||||||||||||||||||
| Impairment of receivables and funded residual value guarantees |
(1,919 | ) | ||||||||||||||||||
| Impairment of intangible assets |
(20,608 | ) | ||||||||||||||||||
| Impairment of assets held for sale |
(5,239 | ) | ||||||||||||||||||
| Gain on disposal of assets |
7,193 | |||||||||||||||||||
| Interest on long-term debt |
(91,462 | ) | ||||||||||||||||||
| Foreign exchange gain |
17,916 | |||||||||||||||||||
| Other financing charges |
(67,036 | ) | ||||||||||||||||||
| Income tax recovery |
32,916 | |||||||||||||||||||
|
|
|
|||||||||||||||||||
| Loss from continuing operations |
(62,067 | ) | ||||||||||||||||||
| Loss from discontinued operations, net of tax |
(3,202 | ) | ||||||||||||||||||
|
|
|
|||||||||||||||||||
| Loss for the year |
$ | (65,269 | ) | |||||||||||||||||
|
|
|
|||||||||||||||||||
| Segment assets |
$ | 1,060,591 | $ | 404,940 | $ | 1,272,825 | $ | — | $ | 2,738,356 | ||||||||||
| Segment assets - held-for-sale (note 7) |
2,749 | 15,268 | 31,782 | — | 49,799 | |||||||||||||||
|
|
|
|
|
|
|
|
|
|
|
|||||||||||
| Total assets |
$ | 1,063,340 | $ | 420,208 | $ | 1,304,607 | $ | — | $ | 2,788,155 | ||||||||||
|
|
|
|
|
|
|
|
|
|
|
|||||||||||
| Segment capital asset expenditures |
$ | 12,105 | $ | 100,287 | $ | 116,412 | $ | — | $ | 228,804 | ||||||||||
| Segment goodwill |
448,121 | — | — | — | 448,121 | |||||||||||||||
|
|
|
|
|
|
|
|
|
|
|
|||||||||||
| (i) | Direct costs in the segment information presented excludes aircraft lease and associated costs. In the consolidated statement of operations these costs are combined. |
| (ii) | Segment EBITDAR (adjusted) is defined as revenues less directs costs, excluding aircraft lease and associated costs, general and administrative expenses plus earnings from equity accounted investees. |
| (iii) | Direct costs in the Corporate and other segment includes $10.2 million in the write-off of bid costs previously capitalized and other legal and consulting costs incurred in connection with the planned procurement of the UK Search and Rescue Helicopter Services. |
F-60
Table of Contents
6922767 HOLDING S.à.r.l.
Notes to Consolidated Financial Statements
(Tabular amounts expressed in thousands unless otherwise noted, except capital stock amounts)
| 27. | Segment information (continued): |
| For the year ended April 30, 2010 | ||||||||||||||||||||
| Helicopter services |
MRO | Corporate and other |
Inter-segment eliminations |
Consolidated | ||||||||||||||||
| Revenue from external customers |
$ | 1,186,898 | $ | 112,470 | $ | 14,198 | $ | — | $ | 1,313,566 | ||||||||||
| Add: Inter-segment revenues |
8,462 | 263,085 | 1 | (271,548 | ) | — | ||||||||||||||
|
|
|
|
|
|
|
|
|
|
|
|||||||||||
| Total revenue |
1,195,360 | 375,555 | 14,199 | (271,548 | ) | 1,313,566 | ||||||||||||||
| Direct costs (i) |
(834,351 | ) | (312,431 | ) | (9,576 | ) | 271,548 | (884,810 | ) | |||||||||||
| Earnings from equity accounted investees |
1,436 | — | — | — | 1,436 | |||||||||||||||
| General and administrative |
— | — | (61,157 | ) | — | (61,157 | ) | |||||||||||||
|
|
|
|
|
|
|
|
|
|
|
|||||||||||
| Segment EBITDAR (adjusted) (ii) |
362,445 | 63,124 | (56,534 | ) | — | 369,035 | ||||||||||||||
| Aircraft lease and associated costs |
(145,072 | ) | — | — | — | (145,072 | ) | |||||||||||||
| Amortization |
(77,738 | ) | ||||||||||||||||||
| Restructuring costs |
(4,855 | ) | ||||||||||||||||||
| Impairment of receivables and funded residual value guarantees |
(13,266 | ) | ||||||||||||||||||
| Impairment of intangible assets |
(53,903 | ) | ||||||||||||||||||
| Impairment of assets held for sale |
(26,585 | ) | ||||||||||||||||||
| Impairment of property and equipment |
(36,240 | ) | ||||||||||||||||||
| Loss on disposal of assets |
(2,686 | ) | ||||||||||||||||||
| Interest on long-term debt |
(69,520 | ) | ||||||||||||||||||
| Foreign exchange gain |
16,520 | |||||||||||||||||||
| Other financing charges |
(21,459 | ) | ||||||||||||||||||
| Income tax expense |
(9,297 | ) | ||||||||||||||||||
|
|
|
|||||||||||||||||||
| Loss from continuing operations |
(75,066 | ) | ||||||||||||||||||
| Loss from discontinued operations, net of tax |
(1,436 | ) | ||||||||||||||||||
|
|
|
|||||||||||||||||||
| Loss for the year |
$ | (76,502 | ) | |||||||||||||||||
|
|
|
|||||||||||||||||||
| (i) | Direct costs in the segment information presented excludes aircraft lease and associated costs. In the consolidated statement of operations these costs are combined. |
| (ii) | Segment EBITDAR (adjusted) is defined as revenues less directs costs, excluding aircraft lease and associated costs, general and administrative expenses plus earnings from equity accounted investees. |
F-61
Table of Contents
6922767 HOLDING S.à.r.l.
Notes to Consolidated Financial Statements
(Tabular amounts expressed in thousands unless otherwise noted, except capital stock amounts)
| 27. | Segment information (continued): |
Geographic information:
| Revenue For the year ended |
||||||||||||
| April 30, 2012 |
April 30, 2011 |
April 30, 2010 |
||||||||||
| Canada |
$ | 13,914 | $ | 12,671 | $ | 16,386 | ||||||
| United Kingdom |
262,592 | 243,921 | 251,627 | |||||||||
| Norway |
531,452 | 452,578 | 405,258 | |||||||||
| Africa |
60,503 | 56,361 | 54,776 | |||||||||
| Australia |
213,970 | 137,639 | 126,992 | |||||||||
| Denmark |
29,538 | 29,108 | 29,535 | |||||||||
| The Netherlands |
94,663 | 95,835 | 119,234 | |||||||||
| Brazil |
210,347 | 163,928 | 105,856 | |||||||||
| Asia |
93,782 | 107,305 | 93,671 | |||||||||
| Other European countries |
139,955 | 112,188 | 49,539 | |||||||||
| Other countries |
41,823 | 33,926 | 60,692 | |||||||||
|
|
|
|
|
|
|
|||||||
| Consolidated total |
$ | 1,692,539 | $ | 1,445,460 | $ | 1,313,566 | ||||||
|
|
|
|
|
|
|
|||||||
Revenues are attributed to countries based on the location of the customer for MRO services and the location of service for helicopter flying services.
The Company provides services across different geographic areas to many customers. In the year ended April 30, 2012, revenue from two customers (2011 – one customer) was greater than 10% of the Company’s revenue, contributing $450.5 million (2011 – $249.9 million, 2010 – $152.6 million) in Helicopter Services. As at April 30, 2012, these two customers had outstanding accounts receivable balances of $24.4 million.
| Property and equipment | Goodwill | |||||||||||||||
| April 30, 2012 |
April 30, 2011 |
April 30, 2012 |
April 30, 2011 |
|||||||||||||
| Canada |
$ | 62,425 | $ | 91,779 | $ | 10,857 | $ | 11,149 | ||||||||
| United Kingdom |
60,323 | 75,879 | 87,800 | 93,087 | ||||||||||||
| Norway |
525,470 | 532,338 | 39,716 | 43,526 | ||||||||||||
| Africa |
55,247 | 95,138 | 9,794 | 10,470 | ||||||||||||
| Australia |
111,920 | 97,954 | 19,523 | 20,425 | ||||||||||||
| Denmark |
685 | 744 | 1,076 | 1,199 | ||||||||||||
| The Netherlands |
9,450 | 19,466 | 36,179 | 40,446 | ||||||||||||
| Asia |
43,084 | 46,035 | 16,100 | 16,100 | ||||||||||||
| Other European countries |
58,852 | 58,686 | 7,045 | 7,873 | ||||||||||||
| Other countries |
99,404 | 115,480 | 205,721 | 203,846 | ||||||||||||
|
|
|
|
|
|
|
|
|
|||||||||
| Consolidated total |
$ | 1,026,860 | $ | 1,133,499 | $ | 433,811 | $ | 448,121 | ||||||||
|
|
|
|
|
|
|
|
|
|||||||||
Property and equipment is attributed to countries based on the physical location of the asset at the fiscal year end.
F-62
Table of Contents
6922767 HOLDING S.à.r.l.
Notes to Consolidated Financial Statements
(Tabular amounts expressed in thousands unless otherwise noted, except capital stock amounts)
| 28. | Subsequent events: |
On June 12, 2012, the Company committed to acquire 10 AW139 helicopters from AgustaWestland to be delivered between October 2012 and September 2014. In addition, the Company has options to acquire 16 additional AW139 helicopters.
On June 13, 2012, the Company exercised the option to acquire two additional EC225’s from Eurocopter in addition to the twenty helicopters the Company committed to acquire in fiscal 2012.
| 29. | Supplemental condensed consolidated financial information: |
The Company and certain of its direct and indirect wholly-owned subsidiaries (the “Guarantor Subsidiaries”) fully and unconditionally guaranteed on a joint and several basis certain outstanding indebtedness of CHC Helicopter SA. The following consolidating schedules present financial information as of April 30, 2012 and 2011 and for the years ended April 30, 2012, 2011 and 2010, respectively, based on the guarantor structure that was in place at April 30, 2012.
F-63
Table of Contents
Notes to Consolidated Financial Statements
| Balance Sheets as at April 30, 2012 (Expressed in thousands of United States dollars) |
Parent | Issuer | Guarantor | Non-guarantor | Eliminations | Consolidated | ||||||||||||||||||
| Assets |
||||||||||||||||||||||||
| Current Assets |
||||||||||||||||||||||||
| Cash and cash equivalents |
$ | 196 | $ | (6,771 | ) | $ | 41,032 | $ | 14,319 | $ | 6,771 | $ | 55,547 | |||||||||||
| Receivables, net of allowance for doubtful accounts |
4 | 113 | 115,853 | 150,881 | (736 | ) | 266,115 | |||||||||||||||||
| Current intercompany receivables |
6,065 | 463,703 | 521,817 | 282,677 | (1,274,262 | ) | — | |||||||||||||||||
| Income taxes receivable |
— | — | 4,203 | 16,544 | — | 20,747 | ||||||||||||||||||
| Deferred income tax assets |
— | — | 5,192 | 3,350 | — | 8,542 | ||||||||||||||||||
| Inventories |
— | — | 80,879 | 9,134 | — | 90,013 | ||||||||||||||||||
| Prepaid expenses |
— | — | 12,088 | 9,095 | — | 21,183 | ||||||||||||||||||
| Other assets |
— | 14,202 | 38,973 | 38,575 | (58,555 | ) | 33,195 | |||||||||||||||||
|
|
|
|
|
|
|
|
|
|
|
|
|
|||||||||||||
| 6,265 | 471,247 | 820,037 | 524,575 | (1,326,782 | ) | 495,342 | ||||||||||||||||||
| Property and equipment, net |
— | — | 950,024 | 77,217 | (381 | ) | 1,026,860 | |||||||||||||||||
| Investments |
661,373 | 324,255 | 358,315 | 15,548 | (1,335,265 | ) | 24,226 | |||||||||||||||||
| Intangible assets |
— | — | 215,949 | 1,941 | — | 217,890 | ||||||||||||||||||
| Goodwill |
— | — | 336,703 | 97,108 | — | 433,811 | ||||||||||||||||||
| Restricted cash |
— | — | 6,039 | 19,955 | — | 25,994 | ||||||||||||||||||
| Other assets |
— | 31,497 | 333,683 | 29,362 | (31,439 | ) | 363,103 | |||||||||||||||||
| Long term intercompany receivables |
— | 873,263 | 30,151 | 496,926 | (1,400,340 | ) | — | |||||||||||||||||
| Deferred income tax assets |
— | — | 30,759 | 18,184 | — | 48,943 | ||||||||||||||||||
| Assets held for sale |
— | — | 79,813 | — | — | 79,813 | ||||||||||||||||||
|
|
|
|
|
|
|
|
|
|
|
|
|
|||||||||||||
| $ | 667,638 | $ | 1,700,262 | $ | 3,161,473 | $ | 1,280,816 | $ | (4,094,207 | ) | $ | 2,715,982 | ||||||||||||
|
|
|
|
|
|
|
|
|
|
|
|
|
|||||||||||||
| Liabilities |
||||||||||||||||||||||||
| Current Liabilities |
||||||||||||||||||||||||
| Payables and accruals |
$ | 45 | $ | 5,796 | $ | 255,960 | $ | 107,059 | $ | (5,796 | ) | $ | 363,064 | |||||||||||
| Deferred revenue |
— | — | 14,020 | 9,717 | — | 23,737 | ||||||||||||||||||
| Income taxes payable |
5,433 | 3,908 | 20,763 | 17,385 | (3,908 | ) | 43,581 | |||||||||||||||||
| Current intercompany payables |
1,352 | 31,754 | 327,798 | 489,454 | (850,358 | ) | — | |||||||||||||||||
| Deferred income tax liabilities |
— | — | 11,652 | 77 | — | 11,729 | ||||||||||||||||||
| Current facility secured by accounts receivable |
— | — | — | 45,566 | — | 45,566 | ||||||||||||||||||
| Other liabilities |
— | 34,606 | 49,277 | 18,641 | (78,876 | ) | 23,648 | |||||||||||||||||
| Current portion of long-term debt |
— | — | 17,701 | — | — | 17,701 | ||||||||||||||||||
|
|
|
|
|
|
|
|
|
|
|
|
|
|||||||||||||
| 6,830 | 76,064 | 697,171 | 687,899 | (938,938 | ) | 529,026 | ||||||||||||||||||
| Long-term debt |
— | 1,209,109 | 1,269,379 | — | (1,209,109 | ) | 1,269,379 | |||||||||||||||||
| Long-term intercompany payables |
— | — | 449,595 | 69,313 | (518,908 | ) | — | |||||||||||||||||
| Liabilities held for sale |
— | — | — | — | — | — | ||||||||||||||||||
| Deferred revenue |
— | — | 17,955 | 25,562 | — | 43,517 | ||||||||||||||||||
| Other liabilities |
16 | — | 107,491 | 84,014 | — | 191,521 | ||||||||||||||||||
| Deferred income tax liabilities |
— | — | 16,931 | 3,141 | — | 20,072 | ||||||||||||||||||
|
|
|
|
|
|
|
|
|
|
|
|
|
|||||||||||||
| Total liabilities |
6,846 | 1,285,173 | 2,558,522 | 869,929 | (2,666,955 | ) | 2,053,515 | |||||||||||||||||
| Redeemable non-controlling interests |
— | — | — | 1,675 | — | 1,675 | ||||||||||||||||||
| Capital stock |
1,607,101 | 1,416,405 | 1,667,616 | 527,707 | (3,611,728 | ) | 1,607,101 | |||||||||||||||||
| Other Shareholders’ equity |
(946,309 | ) | (1,001,316 | ) | (1,064,665 | ) | (118,495 | ) | 2,184,476 | (946,309 | ) | |||||||||||||
|
|
|
|
|
|
|
|
|
|
|
|
|
|||||||||||||
| $ | 667,638 | $ | 1,700,262 | $ | 3,161,473 | $ | 1,280,816 | $ | (4,094,207 | ) | $ | 2,715,982 | ||||||||||||
|
|
|
|
|
|
|
|
|
|
|
|
|
|||||||||||||
F-64
Table of Contents
Notes to Consolidated Financial Statements
| Statements of Operations as at April 30, 2012 (Expressed in thousands of United States dollars) |
Parent | Issuer | Guarantor | Non-guarantor | Eliminations | Consolidated | ||||||||||||||||||
| Revenue |
$ | — | $ | — | $ | 1,154,778 | $ | 1,093,376 | $ | (555,615 | ) | $ | 1,692,539 | |||||||||||
| Operating expenses: |
||||||||||||||||||||||||
| Direct costs |
— | (2 | ) | (865,677 | ) | (1,071,839 | ) | 555,618 | (1,381,900 | ) | ||||||||||||||
| Earnings from equity accounted investees |
(107,782 | ) | (102,017 | ) | (42,236 | ) | 1,178 | 253,701 | 2,844 | |||||||||||||||
| General and administration costs |
(387 | ) | 32,223 | (37,504 | ) | (31,515 | ) | (32,407 | ) | (69,590 | ) | |||||||||||||
| Amortization |
— | — | (98,755 | ) | (14,212 | ) | — | (112,967 | ) | |||||||||||||||
| Restructuring costs |
— | — | (18,359 | ) | (4,152 | ) | — | (22,511 | ) | |||||||||||||||
| Recovery of receivables and funded residual value guarantees |
— | — | 272 | — | — | 272 | ||||||||||||||||||
| Impairment of intangible assets |
— | — | (4,218 | ) | — | — | (4,218 | ) | ||||||||||||||||
| Impairment of property and equipment |
— | — | — | — | — | — | ||||||||||||||||||
| Impairment of assets held for sale |
— | — | (12,794 | ) | (675 | ) | — | (13,469 | ) | |||||||||||||||
| Gain on disposal of assets |
— | — | 7,335 | 834 | — | 8,169 | ||||||||||||||||||
|
|
|
|
|
|
|
|
|
|
|
|
|
|||||||||||||
| (108,169 | ) | (69,796 | ) | (1,071,936 | ) | (1,120,381 | ) | 776,912 | (1,593,370 | ) | ||||||||||||||
|
|
|
|
|
|
|
|
|
|
|
|
|
|||||||||||||
| Operating income (loss) |
(108,169 | ) | (69,796 | ) | 82,842 | (27,005 | ) | 221,297 | 99,169 | |||||||||||||||
| Financing charges |
(32 | ) | (42,655 | ) | (120,835 | ) | (8,978 | ) | 42,655 | (129,845 | ) | |||||||||||||
|
|
|
|
|
|
|
|
|
|
|
|
|
|||||||||||||
| Loss from continuing operations before income tax |
(108,201 | ) | (112,451 | ) | (37,993 | ) | (35,983 | ) | 263,952 | (30,676 | ) | |||||||||||||
| Income tax recovery (expense) |
779 | (3,072 | ) | (53,683 | ) | 4,687 | 3,072 | (48,217 | ) | |||||||||||||||
|
|
|
|
|
|
|
|
|
|
|
|
|
|||||||||||||
| Loss from continuing operations |
(107,422 | ) | (115,523 | ) | (91,676 | ) | (31,296 | ) | 267,024 | (78,893 | ) | |||||||||||||
| Loss from discontinued operations, net of tax |
— | — | (16,107 | ) | — | — | (16,107 | ) | ||||||||||||||||
|
|
|
|
|
|
|
|
|
|
|
|
|
|||||||||||||
| Loss for the year |
$ | (107,422 | ) | $ | (115,523 | ) | $ | (107,783 | ) | $ | (31,296 | ) | $ | 267,024 | $ | (95,000 | ) | |||||||
|
|
|
|
|
|
|
|
|
|
|
|
|
|||||||||||||
| Net earnings (loss) attributable to: |
||||||||||||||||||||||||
| Controlling interest |
$ | (107,422 | ) | $ | (115,523 | ) | $ | (107,783 | ) | $ | (43,718 | ) | $ | 267,024 | $ | (107,422 | ) | |||||||
| Non-controlling interests |
— | — | — | 12,422 | — | 12,422 | ||||||||||||||||||
|
|
|
|
|
|
|
|
|
|
|
|
|
|||||||||||||
| Loss for the year |
$ | (107,422 | ) | $ | (115,523 | ) | $ | (107,783 | ) | $ | (31,296 | ) | $ | 267,024 | $ | (95,000 | ) | |||||||
|
|
|
|
|
|
|
|
|
|
|
|
|
|||||||||||||
F-65
Table of Contents
Notes to Consolidated Financial Statements
| Statements of Cash Flows for the year ended April 30, 2012 (Expressed in thousands of United States dollars) |
Parent | Issuer | Guarantor | Non-guarantor | Eliminations | Consolidated | ||||||||||||||||||
| Cash provided by operating activities |
$ | (28,331 | ) | $ | (174,931 | ) | $ | 97,930 | $ | (13,998 | ) | $ | 134,931 | $ | 15,601 | |||||||||
| Financing activities: |
||||||||||||||||||||||||
| Sold interest in accounts receivable, net of collections |
— | — | — | 27,203 | — | 27,203 | ||||||||||||||||||
| Long term debt proceeds |
— | 835,000 | 867,853 | — | (835,000 | ) | 867,853 | |||||||||||||||||
| Long term debt repayments |
— | (780,000 | ) | (786,808 | ) | — | 780,000 | (786,808 | ) | |||||||||||||||
| Long term intercompany flow - issuance of debt |
(71,501 | ) | 71,501 | 71,501 | — | (71,501 | ) | — | ||||||||||||||||
| Dividends paid (received) |
— | 40,000 | (40,000 | ) | — | — | — | |||||||||||||||||
| Senior secured notes, senior credit facility and revolver deferred financing costs |
— | (1,033 | ) | (1,033 | ) | — | 1,033 | (1,033 | ) | |||||||||||||||
| Proceeds from the issuance of capital stock |
100,000 | — | — | — | — | 100,000 | ||||||||||||||||||
|
|
|
|
|
|
|
|
|
|
|
|
|
|||||||||||||
| Cash (used in) provided by financing activities |
28,499 | 165,468 | 111,513 | 27,203 | (125,468 | ) | 207,215 | |||||||||||||||||
| Investing activities: |
||||||||||||||||||||||||
| Property and equipment additions |
— | — | (341,325 | ) | (35,299 | ) | — | (376,624 | ) | |||||||||||||||
| Proceeds from disposal of property and equipment |
— | — | 218,253 | 6 | — | 218,259 | ||||||||||||||||||
| Aircraft deposits net of lease inception refunds |
— | — | (47,307 | ) | — | — | (47,307 | ) | ||||||||||||||||
| Restricted cash |
— | — | 536 | (13,671 | ) | — | (13,135 | ) | ||||||||||||||||
| Distributions from equity investments |
— | — | 1,134 | — | — | 1,134 | ||||||||||||||||||
|
|
|
|
|
|
|
|
|
|
|
|
|
|||||||||||||
| Cash used in investing activities |
— | — | (168,709 | ) | (48,964 | ) | — | (217,673 | ) | |||||||||||||||
| Cash (used in) provided by continuing operations |
168 | (9,463 | ) | 40,734 | (35,759 | ) | 9,463 | 5,143 | ||||||||||||||||
| Cash flows (used in) provided by discontinued operations: |
||||||||||||||||||||||||
| Cash flows provided by (used in) operating activities |
— | — | 2,240 | — | — | 2,240 | ||||||||||||||||||
| Cash flows provided by financing activities |
— | — | (2,240 | ) | — | — | (2,240 | ) | ||||||||||||||||
|
|
|
|
|
|
|
|
|
|
|
|
|
|||||||||||||
| Cash provided by discontinued operations |
— | — | — | — | — | — | ||||||||||||||||||
| Effect of exchange rate changes on cash and cash equivalents |
— | — | (14,718 | ) | (3,799 | ) | — | (18,517 | ) | |||||||||||||||
|
|
|
|
|
|
|
|
|
|
|
|
|
|||||||||||||
| Change in cash and cash equivalents during the year |
168 | (9,463 | ) | 26,016 | (39,558 | ) | 9,463 | (13,374 | ) | |||||||||||||||
| Cash and cash equivalents, beginning of the year |
28 | 2,692 | 15,016 | 53,877 | (2,692 | ) | 68,921 | |||||||||||||||||
|
|
|
|
|
|
|
|
|
|
|
|
|
|||||||||||||
| Cash and cash equivalents, end of the year |
$ | 196 | $ | (6,771 | ) | $ | 41,032 | $ | 14,319 | $ | 6,771 | $ | 55,547 | |||||||||||
|
|
|
|
|
|
|
|
|
|
|
|
|
|||||||||||||
F-66
Table of Contents
Notes to Consolidated Financial Statements
| Balance Sheets as at April 30, 2011 (Expressed in thousands of United States dollars) |
Parent | Issuer | Guarantor | Non-guarantor | Eliminations | Consolidated | ||||||||||||||||||
| Assets |
||||||||||||||||||||||||
| Current Assets |
||||||||||||||||||||||||
| Cash and cash equivalents |
$ | 28 | $ | 2,692 | $ | 15,016 | $ | 53,877 | $ | (2,692 | ) | $ | 68,921 | |||||||||||
| Receivables, net of allowance for doubtful accounts |
4 | 113 | 114,771 | 108,394 | (717 | ) | 222,565 | |||||||||||||||||
| Current intercompany receivables |
6,099 | 354,672 | 438,739 | 227,097 | (1,026,607 | ) | — | |||||||||||||||||
| Income taxes receivable |
— | — | 1 | 11,456 | — | 11,457 | ||||||||||||||||||
| Deferred income tax assets |
— | — | 9,637 | 2,169 | (4,210 | ) | 7,596 | |||||||||||||||||
| Inventories |
— | — | 91,413 | 10,811 | — | 102,224 | ||||||||||||||||||
| Prepaid expenses |
69 | — | 8,007 | 9,777 | — | 17,853 | ||||||||||||||||||
| Other assets |
— | 8,390 | 27,186 | 83,322 | (82,664 | ) | 36,234 | |||||||||||||||||
|
|
|
|
|
|
|
|
|
|
|
|
|
|||||||||||||
| 6,200 | 365,867 | 704,770 | 506,903 | (1,116,890 | ) | 466,850 | ||||||||||||||||||
| Property and equipment, net |
— | — | 1,078,542 | 55,338 | (381 | ) | 1,133,499 | |||||||||||||||||
| Investments |
773,706 | 555,426 | 437,943 | 14,368 | (1,757,895 | ) | 23,548 | |||||||||||||||||
| Intangible assets |
— | — | 241,046 | 2,138 | — | 243,184 | ||||||||||||||||||
| Goodwill |
— | — | 349,373 | 98,748 | — | 448,121 | ||||||||||||||||||
| Restricted cash |
— | — | 6,798 | 6,421 | — | 13,219 | ||||||||||||||||||
| Other assets |
— | 35,595 | 292,382 | 26,671 | (35,595 | ) | 319,053 | |||||||||||||||||
| Long term intercompany receivables |
— | 932,192 | 30,795 | 508,612 | (1,471,599 | ) | — | |||||||||||||||||
| Deferred income tax assets |
— | — | 72,796 | 21,644 | (3,558 | ) | 90,882 | |||||||||||||||||
| Assets held for sale |
— | — | 46,234 | 3,565 | — | 49,799 | ||||||||||||||||||
|
|
|
|
|
|
|
|
|
|
|
|
|
|||||||||||||
| $ | 779,906 | $ | 1,889,080 | $ | 3,260,679 | $ | 1,244,408 | $ | (4,385,918 | ) | $ | 2,788,155 | ||||||||||||
|
|
|
|
|
|
|
|
|
|
|
|
|
|||||||||||||
| Liabilities |
||||||||||||||||||||||||
| Current Liabilities |
||||||||||||||||||||||||
| Payables and accruals |
$ | 20 | $ | 6,383 | $ | 219,217 | $ | 145,611 | $ | (6,383 | ) | $ | 364,848 | |||||||||||
| Deferred revenue |
— | — | 16,114 | 8,069 | — | 24,183 | ||||||||||||||||||
| Income taxes payable |
6,882 | 4,088 | (4,913 | ) | 32,731 | (9,656 | ) | 29,132 | ||||||||||||||||
| Current intercompany payables |
28,712 | 92,601 | 324,848 | 345,739 | (791,900 | ) | — | |||||||||||||||||
| Deferred income tax liabilities |
— | — | 12,373 | 1,900 | (1,238 | ) | 13,035 | |||||||||||||||||
| Current facility secured by accounts receivable |
— | — | — | 21,571 | — | 21,571 | ||||||||||||||||||
| Other liabilities |
— | 81,858 | 91,022 | 19,351 | (159,925 | ) | 32,306 | |||||||||||||||||
| Current portion of long-term debt |
— | — | 106,642 | — | — | 106,642 | ||||||||||||||||||
|
|
|
|
|
|
|
|
|
|
|
|
|
|||||||||||||
| 35,614 | 184,930 | 765,303 | 574,972 | (969,102 | ) | 591,717 | ||||||||||||||||||
| Long-term debt |
— | 1,152,936 | 1,184,844 | — | (1,152,936 | ) | 1,184,844 | |||||||||||||||||
| Long-term intercompany payables |
— | — | 468,315 | 71,083 | (539,398 | ) | — | |||||||||||||||||
| Liabilities held for sale |
— | — | 1,608 | — | — | 1,608 | ||||||||||||||||||
| Deferred revenue |
— | — | 13,014 | 24,785 | — | 37,799 | ||||||||||||||||||
| Other liabilities |
16 | 2 | 105,685 | 82,953 | (2 | ) | 188,654 | |||||||||||||||||
| Deferred income tax liabilities |
— | — | 27,812 | 8,358 | — | 36,170 | ||||||||||||||||||
|
|
|
|
|
|
|
|
|
|
|
|
|
|||||||||||||
| Total liabilities |
35,630 | 1,337,868 | 2,566,581 | 762,151 | (2,661,438 | ) | 2,040,792 | |||||||||||||||||
| Redeemable non-controlling interests |
— | — | — | 3,087 | — | 3,087 | ||||||||||||||||||
| Capital stock |
1,547,101 | 1,416,405 | 1,667,617 | 546,990 | (3,631,012 | ) | 1,547,101 | |||||||||||||||||
| Other Shareholders’ equity |
(802,825 | ) | (865,193 | ) | (973,519 | ) | (67,820 | ) | 1,906,532 | (802,825 | ) | |||||||||||||
|
|
|
|
|
|
|
|
|
|
|
|
|
|||||||||||||
| $ | 779,906 | $ | 1,889,080 | $ | 3,260,679 | $ | 1,244,408 | $ | (4,385,918 | ) | $ | 2,788,155 | ||||||||||||
|
|
|
|
|
|
|
|
|
|
|
|
|
|||||||||||||
F-67
Table of Contents
Notes to Consolidated Financial Statements
| Statements of Operations as at April 30, 2011 (Expressed in thousands of United States dollars) |
Parent | Issuer | Guarantor | Non-guarantor | Eliminations | Consolidated | ||||||||||||||||||
| Revenue |
$ | — | $ | — | $ | 882,995 | $ | 1,008,060 | $ | (445,595 | ) | $ | 1,445,460 | |||||||||||
| Operating expenses: |
||||||||||||||||||||||||
| Direct costs |
— | — | (702,455 | ) | (954,801 | ) | 445,576 | (1,211,680 | ) | |||||||||||||||
| Earnings from equity accounted investees |
(55,754 | ) | (72,037 | ) | 8,669 | 585 | 120,696 | 2,159 | ||||||||||||||||
| General and administration costs |
(572 | ) | (15,203 | ) | (28,576 | ) | (36,088 | ) | 15,048 | (65,391 | ) | |||||||||||||
| Amortization |
— | — | (93,790 | ) | (5,835 | ) | — | (99,625 | ) | |||||||||||||||
| Restructuring costs |
— | — | (4,751 | ) | — | — | (4,751 | ) | ||||||||||||||||
| Impairment of receivables and funded residual value guarantees |
— | — | (1,919 | ) | — | — | (1,919 | ) | ||||||||||||||||
| Impairment of intangible assets |
— | — | (20,608 | ) | — | — | (20,608 | ) | ||||||||||||||||
| Impairment of property and equipment |
— | — | — | — | — | — | ||||||||||||||||||
| Impairment of assets held for sale |
— | — | (5,228 | ) | (11 | ) | — | (5,239 | ) | |||||||||||||||
| Gain on disposal of assets |
— | — | 5,263 | 1,930 | — | 7,193 | ||||||||||||||||||
|
|
|
|
|
|
|
|
|
|
|
|
|
|||||||||||||
| (56,326 | ) | (87,240 | ) | (843,395 | ) | (994,220 | ) | 581,320 | (1,399,861 | ) | ||||||||||||||
|
|
|
|
|
|
|
|
|
|
|
|
|
|||||||||||||
| Operating income (loss) |
(56,326 | ) | (87,240 | ) | 39,600 | 13,840 | 135,725 | 45,599 | ||||||||||||||||
| Financing charges |
(12,480 | ) | 24,032 | (147,367 | ) | 19,558 | (24,325 | ) | (140,582 | ) | ||||||||||||||
|
|
|
|
|
|
|
|
|
|
|
|
|
|||||||||||||
| Loss from continuing operations before income tax |
(68,806 | ) | (63,208 | ) | (107,767 | ) | 33,398 | 111,400 | (94,983 | ) | ||||||||||||||
| Income tax recovery (expense) |
(1,532 | ) | (4,301 | ) | 55,215 | (19,863 | ) | 3,397 | 32,916 | |||||||||||||||
|
|
|
|
|
|
|
|
|
|
|
|
|
|||||||||||||
| Loss from continuing operations |
(70,338 | ) | (67,509 | ) | (52,552 | ) | 13,535 | 114,797 | (62,067 | ) | ||||||||||||||
| Loss from discontinued operations, net of tax |
— | — | (3,202 | ) | — | — | (3,202 | ) | ||||||||||||||||
|
|
|
|
|
|
|
|
|
|
|
|
|
|||||||||||||
| Loss for the year |
$ | (70,338 | ) | $ | (67,509 | ) | $ | (55,754 | ) | $ | 13,535 | $ | 114,797 | $ | (65,269 | ) | ||||||||
|
|
|
|
|
|
|
|
|
|
|
|
|
|||||||||||||
| Net earnings (loss) attributable to: |
||||||||||||||||||||||||
| Controlling interest |
$ | (70,338 | ) | $ | (67,509 | ) | $ | (55,754 | ) | $ | 8,466 | $ | 114,797 | $ | (70,338 | ) | ||||||||
| Non-controlling interests |
— | — | — | 5,069 | — | 5,069 | ||||||||||||||||||
|
|
|
|
|
|
|
|
|
|
|
|
|
|||||||||||||
| Loss for the year |
$ | (70,338 | ) | $ | (67,509 | ) | $ | (55,754 | ) | $ | 13,535 | $ | 114,797 | $ | (65,269 | ) | ||||||||
|
|
|
|
|
|
|
|
|
|
|
|
|
|||||||||||||
F-68
Table of Contents
Notes to Consolidated Financial Statements
| Statements of Cash Flows for the year ended April 30, 2011 (Expressed in thousands of United States dollars) |
Parent | Issuer | Guarantor | Non-guarantor | Eliminations | Consolidated | ||||||||||||||||||
| Cash provided by operating activities |
$ | (153 | ) | $ | (91,172 | ) | $ | (9,200 | ) | $ | 51,643 | $ | 91,172 | $ | 42,290 | |||||||||
| Financing activities: |
||||||||||||||||||||||||
| Sold interest in accounts receivable, net of collections |
— | — | — | (25,309 | ) | — | (25,309 | ) | ||||||||||||||||
| Proceeds from the senior secured notes |
— | 1,082,389 | 1,082,389 | — | (1,082,389 | ) | 1,082,389 | |||||||||||||||||
| Repayment of the senior credit facility debt |
— | (1,020,550 | ) | (1,020,550 | ) | — | 1,020,550 | (1,020,550 | ) | |||||||||||||||
| Redemption of senior subordinated notes |
— | — | (129 | ) | — | — | (129 | ) | ||||||||||||||||
| Settlement of the interest rate swap and other breakage fees |
— | (45,711 | ) | (45,711 | ) | — | 45,711 | (45,711 | ) | |||||||||||||||
| Long term debt proceeds |
— | 262,800 | 262,800 | — | (262,800 | ) | 262,800 | |||||||||||||||||
| Long term debt repayments |
— | (199,737 | ) | (213,920 | ) | — | 199,737 | (213,920 | ) | |||||||||||||||
| Long term intercompany flow - issuance of debt |
— | — | 4,518 | (4,518 | ) | — | — | |||||||||||||||||
| Senior secured notes, senior credit facility and revolver deferred financing costs |
— | (42,650 | ) | (42,721 | ) | — | 42,650 | (42,721 | ) | |||||||||||||||
| Proceeds from the issuance of capital stock |
146 | — | — | — | — | 146 | ||||||||||||||||||
|
|
|
|
|
|
|
|
|
|
|
|
|
|||||||||||||
| Cash (used in) provided by financing activities |
146 | 36,541 | 26,676 | (29,827 | ) | (36,541 | ) | (3,005 | ) | |||||||||||||||
| Investing activities: |
||||||||||||||||||||||||
| Property and equipment additions |
— | — | (204,581 | ) | (24,223 | ) | — | (228,804 | ) | |||||||||||||||
| Proceeds from disposal of property and equipment |
— | — | 61,739 | 29 | — | 61,768 | ||||||||||||||||||
| Proceeds from the sale of the flight training operations to CAE Inc. |
— | — | 20,693 | 9,086 | — | 29,779 | ||||||||||||||||||
| Aircraft deposits net of lease inception refunds |
— | — | (28,253 | ) | — | — | (28,253 | ) | ||||||||||||||||
| Restricted cash |
— | — | (105 | ) | 4,860 | — | 4,755 | |||||||||||||||||
|
|
|
|
|
|
|
|
|
|
|
|
|
|||||||||||||
| Cash used in investing activities |
— | — | (150,507 | ) | (10,248 | ) | — | (160,755 | ) | |||||||||||||||
| Cash (used in) provided by continuing operations |
(7 | ) | (54,631 | ) | (133,031 | ) | 11,568 | 54,631 | (121,470 | ) | ||||||||||||||
| Cash flows (used in) provided by discontinued operations: |
||||||||||||||||||||||||
| Cash flows provided by (used in) operating activities |
— | — | (1,032 | ) | — | — | (1,032 | ) | ||||||||||||||||
| Cash flows provided by financing activities |
— | — | 1,032 | — | — | 1,032 | ||||||||||||||||||
|
|
|
|
|
|
|
|
|
|
|
|
|
|||||||||||||
| Cash provided by discontinued operations |
— | — | — | — | — | — | ||||||||||||||||||
| Effect of exchange rate changes on cash and cash equivalents |
— | — | 10,788 | 4,643 | — | 15,431 | ||||||||||||||||||
|
|
|
|
|
|
|
|
|
|
|
|
|
|||||||||||||
| Change in cash and cash equivalents during the year |
(7 | ) | (54,631 | ) | (122,243 | ) | 16,211 | 54,631 | (106,039 | ) | ||||||||||||||
| Cash and cash equivalents, beginning of the year |
35 | 57,323 | 137,259 | 37,666 | (57,323 | ) | 174,960 | |||||||||||||||||
|
|
|
|
|
|
|
|
|
|
|
|
|
|||||||||||||
| Cash and cash equivalents, end of the year |
$ | 28 | $ | 2,692 | $ | 15,016 | $ | 53,877 | $ | (2,692 | ) | $ | 68,921 | |||||||||||
|
|
|
|
|
|
|
|
|
|
|
|
|
|||||||||||||
F-69
Table of Contents
Notes to Consolidated Financial Statements
| Statements of Operations for the year ended April 30, 2010 (Expressed in thousands of United States dollars) |
Parent | Issuer | Guarantor | Non-guarantor | Eliminations | Consolidated | ||||||||||||||||||
| Revenue |
$ | — | $ | — | $ | 829,544 | $ | 903,524 | $ | (419,502 | ) | $ | 1,313,566 | |||||||||||
| Operating expenses: |
||||||||||||||||||||||||
| Direct costs |
— | — | (616,824 | ) | (832,116 | ) | 419,058 | (1,029,882 | ) | |||||||||||||||
| Earnings from equity accounted investees |
(247,766 | ) | (114,627 | ) | 27,539 | 216 | 336,074 | 1,436 | ||||||||||||||||
| General and administration costs |
(2,483 | ) | (29,425 | ) | (37,338 | ) | (19,574 | ) | 27,663 | (61,157 | ) | |||||||||||||
| Amortization |
— | — | (73,985 | ) | (3,753 | ) | — | (77,738 | ) | |||||||||||||||
| Restructuring costs |
— | — | (3,931 | ) | (924 | ) | — | (4,855 | ) | |||||||||||||||
| Impairment of receivables and funded residual value guarantees |
— | — | (11,588 | ) | (1,678 | ) | — | (13,266 | ) | |||||||||||||||
| Impairment of intangible assets |
— | — | (53,903 | ) | — | — | (53,903 | ) | ||||||||||||||||
| Impairment of property and equipment |
— | — | (34,805 | ) | (1,435 | ) | — | (36,240 | ) | |||||||||||||||
| Impairment of assets held for sale |
— | — | (21,823 | ) | (4,762 | ) | — | (26,585 | ) | |||||||||||||||
| Gain (loss) on disposal of assets |
— | — | 6,518 | (8,822 | ) | (382 | ) | (2,686 | ) | |||||||||||||||
| Goodwill impairment |
— | — | — | — | — | — | ||||||||||||||||||
|
|
|
|
|
|
|
|
|
|
|
|
|
|||||||||||||
| (250,249 | ) | (144,052 | ) | (820,140 | ) | (872,848 | ) | 782,413 | (1,304,876 | ) | ||||||||||||||
|
|
|
|
|
|
|
|
|
|
|
|
|
|||||||||||||
| Operating income (loss) |
(250,249 | ) | (144,052 | ) | 9,404 | 30,676 | 362,911 | 8,690 | ||||||||||||||||
| Financing charges |
183,002 | 88,342 | (261,597 | ) | 4,235 | (88,441 | ) | (74,459 | ) | |||||||||||||||
|
|
|
|
|
|
|
|
|
|
|
|
|
|||||||||||||
| Loss from continuing operations before income tax |
(67,247 | ) | (55,710 | ) | (252,193 | ) | 34,911 | 274,470 | (65,769 | ) | ||||||||||||||
| Income tax recovery (expense) |
(3,360 | ) | (4,360 | ) | 5,863 | (11,801 | ) | 4,361 | (9,297 | ) | ||||||||||||||
|
|
|
|
|
|
|
|
|
|
|
|
|
|||||||||||||
| Loss from continuing operations |
(70,607 | ) | (60,070 | ) | (246,330 | ) | 23,110 | 278,831 | (75,066 | ) | ||||||||||||||
| Loss from discontinued operations, net of tax |
— | — | (1,436 | ) | — | — | (1,436 | ) | ||||||||||||||||
|
|
|
|
|
|
|
|
|
|
|
|
|
|||||||||||||
| Loss for the year |
(70,607 | ) | (60,070 | ) | (247,766 | ) | 23,110 | 278,831 | (76,502 | ) | ||||||||||||||
|
|
|
|
|
|
|
|
|
|
|
|
|
|||||||||||||
| Net earnings (loss) attributable to: |
||||||||||||||||||||||||
| Controlling interest |
(70,607 | ) | (60,070 | ) | (247,766 | ) | 29,005 | 278,831 | (70,607 | ) | ||||||||||||||
| Non-controlling interests |
— | — | — | (5,895 | ) | — | (5,895 | ) | ||||||||||||||||
|
|
|
|
|
|
|
|
|
|
|
|
|
|||||||||||||
| Loss for the year |
$ | (70,607 | ) | $ | (60,070 | ) | $ | (247,766 | ) | $ | 23,110 | $ | 278,831 | $ | (76,502 | ) | ||||||||
|
|
|
|
|
|
|
|
|
|
|
|
|
|||||||||||||
F-70
Table of Contents
Notes to Consolidated Financial Statements
| Statements of Cash Flows for the year ended April 30, 2010 (Expressed in thousands of United States dollars) |
Parent | Issuer | Guarantor | Non-guarantor | Eliminations | Consolidated | ||||||||||||||||||
| Cash provided by operating activities |
$ | 34 | $ | 15,179 | $ | 59,710 | $ | 14,556 | $ | (15,179 | ) | $ | 74,300 | |||||||||||
| Financing activities: |
||||||||||||||||||||||||
| Issuance of convertible preferred equity certificates |
||||||||||||||||||||||||
| Redemption of convertible preferred equity certificates |
(20,000 | ) | — | — | — | — | (20,000 | ) | ||||||||||||||||
| Sold interest in accounts receivable, net of collections |
— | — | — | 43,214 | — | 43,214 | ||||||||||||||||||
| Long term debt proceeds |
— | 268,300 | 275,919 | — | (268,300 | ) | 275,919 | |||||||||||||||||
| Long term intercompany flow - issuance of debt |
— | — | 21,569 | (21,569 | ) | — | — | |||||||||||||||||
| Long term debt repayments |
— | (256,675 | ) | (276,214 | ) | (1 | ) | 256,675 | (276,215 | ) | ||||||||||||||
| Long term intercompany flow - repayment of debt |
— | — | 28,891 | (28,891 | ) | — | — | |||||||||||||||||
| Senior secured notes, senior credit facility and revolver deferred financing costs |
— | (182 | ) | (182 | ) | — | 182 | (182 | ) | |||||||||||||||
|
|
|
|
|
|
|
|
|
|
|
|
|
|||||||||||||
| Cash (used in) provided by financing activities |
(20,000 | ) | 11,443 | 49,983 | (7,247 | ) | (11,443 | ) | 22,736 | |||||||||||||||
| Investing activities: |
||||||||||||||||||||||||
| Property and equipment additions |
— | — | (147,842 | ) | (14,895 | ) | — | (162,737 | ) | |||||||||||||||
| Proceeds from disposal of property and equipment |
— | — | 84,272 | 20,956 | — | 105,228 | ||||||||||||||||||
| Aircraft deposits net of lease inception refunds |
— | — | (42,606 | ) | — | — | (42,606 | ) | ||||||||||||||||
| Restricted cash |
— | — | (1 | ) | (3,860 | ) | — | (3,861 | ) | |||||||||||||||
| Investment in subsidiaries, net of cash acquired |
— | — | (13,300 | ) | — | — | (13,300 | ) | ||||||||||||||||
| Distributions from equity investments |
— | — | 1,275 | — | — | 1,275 | ||||||||||||||||||
|
|
|
|
|
|
|
|
|
|
|
|
|
|||||||||||||
| Cash used in investing activities |
— | — | (118,202 | ) | 2,201 | — | (116,001 | ) | ||||||||||||||||
| Cash (used in) provided by continuing operations |
(19,966 | ) | 26,622 | (8,509 | ) | 9,510 | (26,622 | ) | (18,965 | ) | ||||||||||||||
| Cash flows (used in) provided by discontinued operations |
||||||||||||||||||||||||
| Cash flows used in operating activities |
— | — | (1 | ) | — | — | (1 | ) | ||||||||||||||||
| Cash flows provided by financing activities |
— | — | 1 | — | — | 1 | ||||||||||||||||||
|
|
|
|
|
|
|
|
|
|
|
|
|
|||||||||||||
| Cash provided by discontinued operations |
— | — | — | — | — | — | ||||||||||||||||||
| Effect of exchange rate changes on cash and cash equivalents |
— | — | (680 | ) | 1,533 | — | 853 | |||||||||||||||||
|
|
|
|
|
|
|
|
|
|
|
|
|
|||||||||||||
| Change in cash and cash equivalents during the year |
(19,966 | ) | 26,622 | (9,189 | ) | 11,043 | (26,622 | ) | (18,112 | ) | ||||||||||||||
| Cash and cash equivalents, beginning of the year |
20,001 | 30,701 | 146,448 | 32,818 | (30,701 | ) | 199,267 | |||||||||||||||||
| Less: cash and cash equivalents from deconsolidation of variable interest entities |
— | — | — | (6,195 | ) | — | (6,195 | ) | ||||||||||||||||
|
|
|
|
|
|
|
|
|
|
|
|
|
|||||||||||||
| Cash and cash equivalents, end of the year |
$ | 35 | $ | 57,323 | $ | 137,259 | $ | 37,666 | $ | (57,323 | ) | $ | 174,960 | |||||||||||
|
|
|
|
|
|
|
|
|
|
|
|
|
|||||||||||||
F-71
Table of Contents
| Item 9. | Changes in and disagreements with accountants on accounting and financial disclosure |
None.
| Item 9A. | Controls and procedures |
We maintain disclosure controls and procedures (as defined in Rules 13a-15(e) and 15d-15(e) promulgated under the Securities Exchange Act of 1934, or the “Exchange Act”) that are designed to ensure that information required to be disclosed in Exchange Act reports is recorded, processed, summarized, and reported within the time periods specified in the rules and forms of the Securities and Exchange Commission and that such information is accumulated and communicated to our management, including our Chief Executive Officer and Chief Financial Officer, as appropriate, to allow timely decisions regarding required disclosure. Any controls and procedures, no matter how well designed and operated, can provide only reasonable assurance of achieving the desired control objectives.
Our management, with the participation of our Chief Executive Officer and Chief Financial Officer, has evaluated the effectiveness of the design and operation of our disclosure controls and procedures as of April 30, 2012. Based upon this evaluation and subject to the foregoing, our Chief Executive Officer and Chief Financial Officer concluded that our disclosure controls and procedures were effective as of April 30, 2012, the end of the period covered by this Annual Report on Form 10-K.
Our Chief Executive Officer and Chief Financial Officer do not expect that our disclosure controls or our internal controls will prevent all error and all fraud. The design of a control system must reflect the fact that there are resource constraints and the benefit of controls must be considered relative to their cost. Because of the inherent limitations in all control systems, no evaluation of controls can provide absolute assurance that we have detected all of our control issues and all instances of fraud, if any. The design of any system of controls also is based partly on certain assumptions about the likelihood of future events and there can be no assurance that any design will succeed in achieving our stated goals under all potential future conditions.
There have been no changes in our internal control over financial reporting that occurred during our fiscal year ended April 30, 2012, that have materially affected, or are reasonably likely to materially affect, our internal control over financial reporting.
This Annual Report on Form 10-K does not include a report of management’s assessment regarding internal control over financial reporting or an attestation report of the Company’s registered public accounting firm due to a transition period established by rules of the Securities and Exchange Commission for newly public companies.
| Item 9B. | Other information |
None.
| Item 10. | Directors, executive officers of the registrant and corporate governance |
6922767 Holding S.à r.l. (the “Company”) is a Luxembourg société à responsabilité limitée and as such is managed by a board of managers. In the following discussion in this Item 10, we refer to the Company’s board of managers as the Company’s “board” and to the representatives who serve on the Company’s board as “directors.” The Company’s board currently consists of six directors. Information about the Company’s directors is set forth below.
48
Table of Contents
DIRECTORS
The following were the Company’s directors as of June 29, 2012:
| Name |
Age | Position | Year first elected as director |
|||||||||
| Dod E. Wales |
35 | Manager | 2008 | |||||||||
| Daren R. Schneider |
43 | Manager | 2012 | |||||||||
| Johan G. M. Dejans |
45 | Manager | 2008 | |||||||||
| Richard E.J. Brekelmans |
51 | Manager | 2008 | |||||||||
| Hille-Paul Schut |
34 | Manager | 2010 | |||||||||
| ATC Management (Luxembourg) S.à r.l. |
N/A | Manager | 2008 | |||||||||
Dod E. Wales
Dod E. Wales, Manager, joined First Reserve in 2004 and is currently a Director. His responsibilities at First Reserve range from deal origination and structuring to due diligence, execution and monitoring, with particular focus on the equipment, manufacturing and services sector. Prior to joining First Reserve, he was an Analyst in the Distressed Finance and Restructuring Group at Credit Suisse First Boston. Mr. Wales holds a B.A. in History from Stanford University. Mr. Wales was selected to serve on the Company’s board due to his expertise in finance and experience in the manufacturing, equipment and services sectors.
Daren R. Schneider
Daren R. Schneider, Manager, joined First Reserve in 2007 and is its Controller. He has responsibility for the financial aspects of First Reserve’s funds. Prior to joining First Reserve, he was a Vice President in Credit Suisse’s private equity division for three years. Prior to that time, he spent seven years with The Blackstone Group as the Controller of Merchant Banking. Mr. Schneider worked prior to Blackstone at Viacom Inc. and Deloitte & Touche. Mr. Schneider holds a B.S. in accounting and an M.B.A. in Finance from the School of Professional Accounting at Long Island University in New York. He is a Certified Public Accountant. Mr. Schneider was selected to serve on the Company’s board due to his extensive business and accounting experience.
Johan G. M. Dejans
Johan G. M. Dejans, Manager, joined ATC Corporate Services (Luxembourg) S.A. in 2006 and is currently a Managing Director. Prior to joining ATC, Mr. Dejans headed the “Financial and Patrimonial Structures” Department at what is now ING Group, before holding the position of Managing Director at ING Trust (Luxembourg) S.A. Mr. Dejans started his career as a tax lawyer for KPMG Tiberghien & Co., a reputable Belgian law firm, where he assisted private and corporate clients with their tax matters on both a national and international level. Mr. Dejans holds a Masters in Law from Katholieke Universiteit Leuven, a Masters in European Law from Université Libre de Bruxelles and a Certificate Ecole Spéciale des Sciences Fiscales from ICHEC. Mr. Dejans was selected to serve on the Company’s board due to his expertise in tax laws and his experience advising companies in tax matters in Luxembourg, where the Company is organized.
Richard E.J. Brekelmans
Richard E.J. Brekelmans, Manager, joined ATC Corporate Services Netherlands B.V. in 2000 and has been a director of ATC Corporate Services (Luxembourg) S.A. since its incorporation in 2004. Mr. Brekelmans offers ATC and its clients wide-ranging experience in the administration and domicile of companies in Luxembourg and other jurisdictions. Prior to joining ATC, Mr. Brekelmans assumed various positions within audit firms, principally in Amsterdam and on Curaçao, providing audit and controlling services to financial institutions and investment fund vehicles such as unit trusts, investment companies and investment funds, incorporated in various jurisdictions. Mr. Brekelmans holds a Business Administration degree from HEAO Amsterdam, School of Economics. Mr. Brekelmans was selected to serve on the Company’s board due to his expertise in Luxembourg corporate law and experience advising companies organized in Luxembourg.
Hille-Paul Schut
Hille-Paul Schut, Manager, joined ATC Corporate Services (Luxembourg) S.A. in 2010 and is currently a Team Director. Mr. Schut has served as a legal trust officer at trust companies in the Netherlands and Luxembourg, including as an Assistant Managing Director at Citco REIF Services (Luxembourg) SA from 2007 to 2010. He holds an MSc in Fiscal Economics from the Erasmus University Rotterdam. Mr. Schut was selected to serve on the Company’s board due to his expertise in Luxembourg corporate law and experience advising companies organized in Luxembourg.
ATC Management (Luxembourg) S.à r.l.
Part of the ATC Group, ATC Management (Luxembourg) S.à r.l. offers domiciliation, management, bookkeeping and legal and compliance services to a wide range of clients, working with their professional advisers to form, administer and manage such structures.
49
Table of Contents
EXECUTIVES
We have entered into an agreement with the Company’s wholly owned Canadian subsidiary, Heli-One Canada Inc., to provide certain management services subject to the authority limits as determined by the Company’s board and set out in such agreement. Information about the executives of Heli-One Canada Inc. is set forth below.
William Amelio (President and Chief Executive Officer)
Mr. Amelio, age 54, has extensive international experience with several major corporations. He was President and CEO of the Lenovo Group, the global personal computer maker, where he managed the integration of the IBM personal computer business, implemented a business transformation program and globalized the Lenovo computer brand. During his career Mr. Amelio has also led businesses in leading companies such as Dell, NCR and AlliedSignal. He serves on the board of directors of National Semiconductor, a major designer and manufacturer of analog semiconductor devices.
Mr. Amelio holds a master’s degree in Management from Stanford University and a bachelor of science degree in Chemical Engineering from Lehigh University. Through the Amelio Foundation, Mr. Amelio and his wife founded Caring for Cambodia, a non-profit organization that aims to educate the children of Cambodia through building schools, training teachers and providing for basic human needs.
Mr. Amelio joined the Company on August 10, 2010.
Larry Alexandre (President, Heli-One)
Mr. Alexandre, age 43, was appointed President of Heli-One in June of 2011. Mr. Alexandre has extensive leadership experience in aerospace manufacturing and MRO. The former CEO of Sagem Avionics, a member of the Safran group of companies, Mr. Alexandre has also held leadership positions with Turbomeca as COO of that company’s businesses in the United States, Canada, and Brazil, as well as Teleflex’s aerospace division. Mr. Alexandre has a record of driving cultural change in the companies he has led around the world, with a unique focus on lean deployment as an enabler for change. He has successfully led initiatives globally to increase synergies between business units, reduce inventory, improve productivity and reduce lead times, while relentlessly driving customer focus and satisfaction into every process of the organization. Mr. Alexandre holds a master’s degree in Business Administration from The Ohio State University and a bachelor degree in International Business from the EPSCI-ESSEC Group business school in France.
Joan Hooper (Senior Vice President and Chief Financial Officer)
Ms. Hooper, age 54, was appointed senior vice president and chief financial officer in October 2011. Previously she led finance organizations for Dell’s Global Public and Americas business units, and also oversaw corporate finance and was the chief accounting officer for the company. Before Dell, Ms. Hooper was executive vice president and CFO of FreeMarkets, an innovative provider of procurement tools and services, which she helped take public in 1999 in a highly successful IPO. At AT&T she held a variety of senior finance positions. A finance graduate from Creighton University, Ms. Hooper holds a master’s degree in business administration from Northwestern University’s Kellogg Graduate School of Management. She has earned public and management accounting certifications.
Michael O’Neill (Chief Legal Officer)
Mr. O’Neill, age 54, was appointed Chief Legal Officer of CHC on February 15, 2011. Previously, Mr. O’Neill served as Senior Vice President and General Counsel for the Lenovo Group, the global personal computer maker, where he was responsible for all legal, contracts, government affairs, and security for the company. In addition to his work with the Lenovo Group, Mr. O’Neill was the General Counsel for international practices for Howrey Simon Arnold & White, LLP, where he was responsible for the legal and administrative matters of the firm outside of the United States. Mr. O’Neill earned his JD and M.B.A. (Finance) from the University of Baltimore after completing his B.A. in Business Administration/Economics from Belmont Abbey College. Mr. O’Neill also completed George Washington University’s Postgraduate Masters Program in Government and Technology Contracting and Duke University’s Postgraduate Corporate Counsels Program.
Daniel M. McDonald (Senior Vice President, Fleet and Commercial)
Mr. McDonald, age 47, is an accomplished finance and transportation consultant with more than eighteen years of experience leading business through strategic initiatives in the financing, acquisition and optimization of aircraft. He has previously held senior positions at Northwest Airlines, Delta Airlines, US Airways and DHL Express. He holds a Masters of Business Administration and a Master of Science (Aerospace).
Mr. McDonald served as a consultant for a year and joined the Company on July 12, 2010.
Peter Bartolotta (President and Chief Operating Officer of the Helicopter Services business)
Mr. Bartolotta, age 53, joined CHC Helicopter in June 2012. Prior to joining the Company Mr. Bartolotta worked for Lenovo Corporation, where he most recently served as Senior Vice President of Lenovo Global Services. Prior to Lenovo, Mr. Bartolotta led NCR Corporation’s Global Retail Product Management function; was Vice President, Operations and Six
50
Table of Contents
Sigma, for AlliedSignal’s Turbocharging Systems business; led operations for AlliedSignal’s Honeywell avionics business; and held positions at IBM Corporation including director and site manager of operations for IBM’s personal-computer manufacturing facility. Mr. Bartolotta holds an MBA from the University of Texas at Austin and a Bachelor of Science degree in Chemistry from the State University of New York at Binghamton.
Michael Summers (Senior Vice President, Human Resources)
Mr. Summers, age 57, joined CHC in 2010 after spending the past 29 years as both a Senior Human Resources executive and consultant in Human Resources functions. Mr. Summers has 15 years of experience in Senior Human Resources positions with Fortune 500 corporations and as a member of the senior executive teams, worked as an active contributor to the business performance by providing effective organizational design, leadership acquisition and development, and human resource strategies well integrated with business objectives. During his time working with clients such as Celanese, Dell Computer, Allied Signal, Nabisco Brands, Quaker Oats and Newport News Shipbuilding, Mr. Summers provided insight to business leadership on executive development, assessment and organization design, and talent management strategies, while influencing successful organizational change efforts resulting in significant business improvements in the areas of productivity, operating expense reduction, customer focus and market strategy, and lower labor costs. Mr. Summers received his Bachelor of Science in Industrial Psychology from Fairmont State College and completed his Masters of Science in Industrial Relations from West Virginia University.
6922767 HOLDING (CAYMAN) INC.
The Company is a wholly-owned subsidiary of 6922767 Holding (Cayman) Inc. (“CHC Cayman”), which indirectly owns all of its issued and outstanding capital stock. As of June 30, 2012, the board of directors of CHC Cayman was comprised of William E. Macaulay, William Amelio, Jonathan Lewis, John Mogford, Kenneth M. Moore, and Dod E. Wales.
William E. Macaulay
William E. Macaulay, Chairman and Chief Executive Officer of First Reserve, has been with the firm since its founding in 1983. He is responsible for supervision of all aspects of the firm’s investment program and strategy, as well as overall management of the firm. Prior to participating in the acquisition of First Reserve in 1983, Mr. Macaulay was a co-founder of Meridien Capital Company, a private equity buyout firm. From 1972 to 1982, Mr. Macaulay was with Oppenheimer & Co., Inc., where he served as Director of Corporate Finance with responsibility for investing Oppenheimer’s capital in private equity transactions. At Oppenheimer, he also served as a General Partner and member of the Management Committee of Oppenheimer & Co., as well as President of Oppenheimer Energy Corporation. He was the founder and largest stockholder of Peppermill Oil Company. Mr. Macaulay holds a B.B.A. degree Magna Cum Laude in Economics from City College of New York and an M.B.A. from the Wharton School of the University of Pennsylvania, where he also has served as a member of the Executive Board. Mr. Macaulay was selected to serve on our board due to his extensive international business and private equity experience, particularly in the manufacturing, equipment and services sectors, as well as in view of his familiarity with and control over First Reserve, one of our controlling stockholders.
Jonathan Lewis
Jonathan Lewis is senior vice president, Europe Sub-Saharan Africa Region of Halliburton, which he joined in 1996. Prior to joining Halliburton, Dr. Lewis taught graduate students and managed commercially funded research groups through academic positions at Imperial College in London, England and Heriot – Watt University in Edinburgh, Scotland. Dr. Lewis has been Chairman of the board of directors of the Petrotechnical Open Standards Consortium and a member of the board of directors of ASF Portal. Dr. Lewis holds a Bachelor of Science in Geology from Kingston University, a P.h.D. in Geology/Sedimentology from the University of Reading, and is a graduate of the Stanford Executive Program of the Stanford University Graduate School of Business.
Kenneth M. Moore
Kenneth W. Moore is a managing director of First Reserve, which he joined in 2004. Prior to joining First Reserve, Mr. Moore spent four years with Morgan Stanley in New York. Mr. Moore served as a director of Chart Industries, Inc. from October 2005 to November 2007 and Dresser-Rand Group Inc. from October 2004 to May 2007. He has been a member of the board of directors of Cobalt International Energy, Inc. since August 2007. Mr. Moore holds a Bachelor of Arts from Tufts University and a Master in Business Administration from the Johnson School of Management at Cornell University.
John Mogford
John Mogford is a managing director of First Reserve, which he joined in 2009. Mr. Mogford’s responsibilities at First Reserve include providing direct operational support and guidance to First Reserve’s portfolio company executives as well as strategic advice to First Reserve investment teams. Prior to joining First Reserve, Mr. Mogford spent 32 years at BP in various roles, including Executive Vice President for Refining, Head of Refining at BP plc, and Chief Operating Officer of Refining sub-segment of BP plc. Mr. Mogford served as a Member of the BP Executive Management Team, and was also
51
Table of Contents
one of 10 members of BP’s Executive Committee. Mr. Mogford has been a Non Executive Director of The Weir Group PLC since June 1, 2008. Mr. Mogford holds a Bachelors of Engineering from Sheffield University and is a Fellow of the Institute of Mechanical Engineers. He has also received business qualifications from INSEAD and Stanford Universities.
Corporate Governance
Because our registration statement on Form S-4, which was declared effective in May 2012, registers only debt securities and because we do not have and are not seeking to list any securities on a national securities exchange or on an inter-dealer quotation system, we are not subject to a number of the corporate governance requirements of the SEC or of any national securities exchange or inter-dealer quotation system. For example, we are not required to have a board of directors comprised of a majority of independent directors or to have an audit committee comprised of independent directors. We have a separately designated standing audit committee, however, we have not made any determination as to whether any of the members of the Company’s board of managers, or any committees thereof, would qualify as independent under the listing standards of any national securities exchange or any inter-dealer quotation system or under any other independence definition.
Code of Ethics
We have adopted a Code of Ethics and Integrity, which sets forth ethical standards for our officers and employees. We will provide a copy of our Code of Ethics and Integrity to any person, without charge, upon request, by writing to the Deputy General Counsel, CHC Helicopter S.A., 4740 Agar Drive, Richmond, British Columbia, Canada V7B 1A3.
Audit Committee
We have a separately-designated standing audit committee which approves the selection of our independent registered public accounting firm and meets and interacts with the independent registered public accounting firm to discuss issues related to financial reporting. In addition, the Company’s board of managers reviews the scope and results of the audit with the independent registered public accounting firm, reviews with management and the independent registered public accounting firm the Company’s annual operating results, considers the adequacy of the Company’s internal accounting procedures and considers other auditing and accounting matters including fees to be paid to the independent registered public accounting firm and the performance of the independent registered public accounting firm.
We have not formally designated an audit committee financial expert because of the nature of our company and our board of managers at this time, however, multiple members of the Company’s audit committee would likely qualify as an audit committee financial expert due to their educational background and work experience.
| Item 11. | Executive Compensation |
Compensation Discussion and Analysis
The following discussion and analysis of the compensation arrangements of our named executive officers should be read together with the compensation tables and related disclosures regarding our current plans, considerations, expectations and determinations regarding future compensation programs. Our future compensation programs could differ materially from those summarized in this discussion and analysis.
Compensation Philosophy
The primary objectives of our executive compensation program are to attract and retain talented executives to effectively manage and lead our company and create value for our stockholders. The compensation packages for our named executive officers generally include a base salary, performance-based annual cash awards, equity awards and other benefits.
The discussion below includes a review of our compensation decisions with respect to our 2012 fiscal year, which ended on April 30, 2012. Our named executive officers for fiscal 2012 were:
| • | William Amelio, President and Chief Executive Officer; |
| • | Joan Hooper, Senior Vice President and Chief Financial Officer; |
| • | Rick Davis, former Senior Vice President and Financial Officer(1); |
| • | John Graber, President, CHC Helicopter Services(2); |
| • | Michael Summers, Senior Vice President, Human Resources; and |
| • | Michael O’Neill, Senior Vice President, Legal. |
52
Table of Contents
| (1) | Mr. Davis’ employment with the CHC Helicopter group of companies terminated during fiscal 2012 on August 7, 2011. |
| (2) | On June 25, 2012, the Company announced that Mr. Graber will depart the Company in July 2012 as part of a leadership change. |
Compensation Determination Process
Our current compensation program for our named executive officers has been designed based on our view that the various components of executive compensation should be set at levels that are necessary, within reasonable parameters, to successfully attract and retain skilled executives and that are fair and equitable in light of market practices. In setting an individual named executive officer’s initial compensation package and the relative allocation among different elements of compensation, we consider the nature of the position being filled, the scope of associated responsibilities, the individual’s prior experience and skills and the individual’s compensation expectations, as well as the compensation of existing executive officers at our company and our general impressions of prevailing conditions in the market for executive talent.
During the first part of fiscal 2012, our compensation programs were overseen by the board of directors of CHC Cayman. Following its establishment in September 2011, the Compensation Committee of the board of directors of CHC Cayman (the “Compensation Committee”) has overseen our executive compensation programs and our overall compensation philosophy, including program design principles, budgeting and executive benchmarking. The Compensation Committee has established an annual review process for reviewing executive compensation levels, benchmarks and budgets. Base salaries are typically reviewed in April and adjustments are effective in May of each year. Financial goals under our annual Short Term Incentive Plan (the “Bonus Plan”) are reviewed and established in April of each year for the following fiscal year. The determination of payouts under our Bonus Plan typically happens in June each year following the end of the fiscal year with payouts generally occurring in July. The Compensation Committee may utilize external compensation consultants periodically to review both the external and internal position of our executives and all aspects of their compensation. During the second half of fiscal 2012, the Compensation Committee engaged the Company’s outside compensation consultant, AON-Hewitt, to assist in constructing a peer group of companies and provide marketplace information and advice on competitive market practices and assessment of pay for certain executive positions.
Elements of Compensation
Base Salaries
Base salaries are intended to provide a fixed level of compensation sufficient to attract and retain an effective management team when considered in combination with other components of our executive compensation program. We believe that the base salary element is required to provide our named executive officers with a stable income stream that is commensurate with their responsibilities and competitive market conditions. Annual base salaries are established on the basis of market conditions at the time we hire an executive officer. Any subsequent modifications to annual base salaries are influenced by the performance of the executive and by significant changes in market conditions. The Compensation Committee will review base salary modification recommendations made by the Chief Executive Officer with respect to all named executive officers other than himself on an annual basis.
The annual base salaries for our named executive officers during fiscal 2012 were as follows:
| Named Executive Officer |
Fiscal 2012 Annual Base Salary (US $) |
|||
| William Amelio |
$ | 750,000 | ||
| Joan Hooper (1) |
$ | 475,000 | ||
| Rick Davis (2) |
$ | 404,680 | ||
| John Graber (3) |
$ | 400,000 | ||
| Michael Summers |
$ | 450,000 | ||
| Michael O’Neill |
$ | 450,000 | ||
| (1) | Ms. Hooper joined the CHC Helicopter group of companies during fiscal 2012 in October 2011 and therefore received a pro-rated annual salary for fiscal 2012. |
| (2) | Mr. Davis’ employment with the CHC Helicopter group of companies terminated during fiscal 2012 on August 7, 2011. The amount in the table above reflects a conversion from Canadian dollars to United States dollars based on the exchange rate in effect on April 30, 2012 of one Canadian dollar being equivalent to $1.0117 U.S. dollars. |
53
Table of Contents
| (3) | Mr. Graber joined the CHC Helicopter group of companies during fiscal 2012 in July 2011 and therefore received a pro-rated annual salary for fiscal 2012. |
Performance-Based Annual Cash Awards
Our named executive officers (and other employees), other than Mr. Amelio, are generally eligible for performance-based annual cash awards under our Bonus Plan. The fiscal 2012 performance-based bonus for Mr. Amelio generally follows the same corporate financial goals and terms as the other named executive officers to be paid under the Bonus Plan except that Mr. Amelio could receive up to 300% of his target bonus as opposed to being subject to the Bonus Plan’s 200% maximum of target bonus limit. The Bonus Plan is intended to provide a measure of management performance against annual targets, the results of which form the basis for the calculation of the Bonus Plan incentive awards. The Bonus Plan’s guiding objectives and principles are as follows:
| • | provide focus and clarify business objectives, specific priorities and financial targets; |
| • | link the behavior and actions of senior management to the interests of shareholders by providing incentive awards for performance beyond our financial targets; |
| • | provide a certain amount of discretion to the employee’s manager to differentiate incentive compensation based on an individual’s performance; and |
| • | remain competitive with executive compensation practices so as to attract and retain competent and professional management. |
The purposes of the Bonus Plan are (1) focusing employees on our key annual financial goals of (a) earnings before interest, taxes, depreciation, amortization, and rent (leases) (“EBITDAR”) and (b) cash flow excluding EBITDAR (and certain other exclusions) (“Cash Flow”), (2) encouraging top performance at all levels (corporate, business unit and individual levels) and (3) providing competitive rewards when performance is strong.
Our Bonus Plan has been designed such that it is composed of a target bonus which is based on our annual financial performance. In this respect, each named executive officer is provided a target award based on a percentage of annual base salary. The actual amounts paid under the Bonus Plan are linked to our performance in relation to both corporate financial and individual performance factors. Actual bonus awards under our Bonus Plan may range from zero to a maximum payout of twice such target bonus award, based upon achievement of specified performance metrics; provided that our EBITDAR for fiscal 2012 must be at least 85% of the established EBITDAR target for any bonus awards to be paid.
Under our Bonus Plan that was in effect for fiscal 2012 and that is in effect for fiscal 2013, our named executive officers are eligible for a target Bonus Plan award based on a percentage of his or her annual base salary with such target percentage reflected in the table below. The corporate financial factors are weighted 50% based on corporate EBITDAR performance and 50% based on Cash Flow performance. The corresponding payout amount as determined by the level of EBITDAR and Cash Flow performance at fiscal year-end is then multiplied by the named executive officer’s individual performance modifier to calculate the actual performance-based annual cash awards earned under the Bonus Plan.
| Named Executive Officer |
Target Percentage of fiscal 2012 base salary |
Individual Performance Modifier for fiscal 2012 |
||||||
| William Amelio |
100 | % | 3.0 | |||||
| Joan Hooper |
85 | % | 1.0 | |||||
| Rick Davis |
85 | % | 0 | |||||
| John Graber |
85 | % | 0 | |||||
| Michael Summers |
85 | % | 1.25 | |||||
| Michael O’Neill |
85 | % | 1.25 | |||||
54
Table of Contents
For fiscal 2012, our EBITDAR target was approximately $389.7 million and our actual performance was approximately $(420.6) million, which resulted in a corresponding EBITDAR payout percentage of 120%. Our Cash Flow target for fiscal 2012 was approximately $(495.5) million and our actual performance was approximately $(486.5) million, which resulted in a corresponding Cash Flow payout percentage of 109%. Based on our actual performance for fiscal 2012, the named executive officers received a performance-based annual cash award under our Bonus Plan in the amount shown in the table below. Ms. Hooper and Mr. Graber, who each joined the Company during fiscal 2012, received a pro-rated bonus (as shown in the table below), in addition to a signing bonus as described more fully below under the “Employment agreements” section.
| Named Executive Officer |
Total Fiscal
2012 Performance- Based Bonus Award |
|||
| William Amelio |
$ | 2,250,000 | ||
| Joan Hooper |
$ | 265,819 | ||
| Rick Davis (1) |
— | |||
| John Graber |
$ | 255,000 | ||
| Michael Summers |
$ | 547,453 | ||
| Michael O’Neill |
$ | 547,453 | ||
| (1) | Mr. Davis’s employment was terminated prior to the completion of the 2012 fiscal year-end and therefore did not earn a performance bonus under the Bonus Plan for fiscal 2012. The severance payments and benefits he received in connection with the termination of his employment are described below in “Summary Compensation Table—Fiscal Year 2012” and “—Employment Agreements.” |
Long-Term Incentive Compensation
We currently issue long-term incentive compensation to our named executive officers under the 6922767 Holding (Cayman) Inc. 2011 Management Equity Plan (the “2011 MEP”). The Board adopted the 2011 MEP to be effective as of November 21, 2011. See “Narrative Disclosure to Summary Compensation Table and Grants of Plan-Based Awards in Fiscal 2012 Table—Equity Plans—2011 Management Equity Plan” for a description of the material terms of this plan.
Prior to December 30, 2011, we provided long-term equity incentive compensation to our named executive officers in the form of stock options to purchase Ordinary B shares (“Options”) and grants of Special A shares (“Special Shares”) under the 6922767 Holding (Cayman) Inc. Share Incentive Plan (the “SIP”). The purpose of the SIP was to promote the long-term success of CHC Cayman by providing equity-based incentive awards to eligible employees of CHC Cayman and its affiliates. The SIP was designed to provide eligible employees a proprietary interest in CHC Cayman and thereby encourage such employees to perform the duties of their employment to the best of their abilities and to devote their business time and efforts to increase the value of CHC Helicopter Limited, LLC and to facilitate a successful public offering or other disposition of the shares or other economic interests in CHC Helicopter Limited, LLC. The SIP was also intended to assist CHC Cayman and its affiliates in attracting and retaining individuals with superior experience and ability.
In connection with our transition from the SIP to the 2011 MEP due in part to the economic conditions in which we operate and due to the shares underlying the previously granted Options having a fair market value below the exercise price of the Options and the low probability that the Special Shares would become vested, we determined that offering New Options (as defined below under “—2011 Management Equity Plan”) with different vesting terms and a lower per-share exercise price may be better suited than the existing Options and Special Shares to meet CHC Cayman’s objectives to attract, motivate, retain and reward talented and experienced individuals. Holders of unvested Options (or Options that vested on September 16, 2011) and Special Shares were offered an opportunity to exchange such awards for New Options under the 2011 MEP (the “Eligible Group”). Members of the Eligible Group who held such Options had the opportunity to elect to have such Options replaced with an equivalent number of New Time and Performance Options granted pursuant to the 2011 MEP. Members of the Eligible Group who held Special Shares had the opportunity to elect to have such Special Shares replaced with New Performance Options granted pursuant to the 2011 MEP. The exercise price for such New Time and Performance Options and New Performance Options was the fair value of an Ordinary B share on the grant date.
Pension and Supplemental Retirement Plans
Prior to September 2008, a predecessor to Heli-One Canada Inc. (“Heli-One Canada”) entered into a Supplemental Retirement Plan Agreement (the “SERP”) with Mr. Davis. The SERP is a closed plan, and there are no other eligible participants.
55
Table of Contents
The SERP is intended to work in tandem with the Company’s registered pension plan such that the aggregate target benefit provided to Mr. Davis through the Company’s registered pension plan, the SERP, the Canada Pension Plan (the “CPP”) and any payments from other pension plans equals 2% of his highest three years’ average earnings, including a specified percentage of operations bonuses, but excluding special transaction bonuses, multiplied by years of credited service. Generally, the SERP provides benefits by multiplying Mr. Davis’s credited service by the sum of the following: (1) 0.5% of average earnings up to the CPP earnings limit at retirement; (2) 1% of average earnings above such CPP earnings limit up to the earnings for which the Canada Revenue Agency (the “CRA”) maximum contribution could be made under the SERP in the year of retirement; and (3) 2% of average earnings in excess of the above CRA earnings limit.
In connection with our acquisition by funds affiliated with First Reserve in September 2008, benefits under the SERP were frozen such that no benefits were accrued post-closing (subject to possible indexing), benefits under the SERP became vested and a requirement under the SERP was triggered which required the establishment of a trust to secure the full funding of benefits under the SERP. Mr. Davis waived such requirement which deferred the need for a letter of credit until his respective termination dates. When his employment was terminated, it triggered the requirement for a letter of credit, which in turn resulted in Heli-One Canada establishing a Retirement Compensation Arrangement Trust (the “RCA”) for the benefit of Mr. Davis. Pursuant to the RCA, if an Event of Default (as defined in the RCA) occurs, the face value of the letter of credit will then be available to satisfy the SERP entitlements. Distributions under the SERP are being paid (or will be paid when Mr. Davis commences to receive his pension) by Heli-One Canada out of general revenues on a monthly basis.
Other Compensation
We also provide various other benefits to our named executive officers that are intended to be part of a competitive compensation program. These benefits include the following:
| • | We provide matching contributions under our 401(k) plan of up to 4% of eligible base salary, subject to Internal Revenue Service limitations, to all eligible executives. This plan is a tax-qualified retirement plan and is extended to all eligible U.S. employees. |
| • | We have a Canadian defined contribution pension plan, pursuant to which we make matching contributions of up to 6% of employee contributions, subject to Canadian tax legislation limitations. |
| • | Annual automobile allowances are paid to eligible U.K., Canadian and U.S. employees. |
| • | Tax return preparation services are provided by Deloitte Canada to certain executives, if they chose to utilize this service. Tax returns are processed in the U.S. and Canada as required by legislation in each country. |
| • | Tax equalization payments are made for certain executives as a result of their employment in Canada. Returns are filed in the U.S. and Canada with respective tax liabilities resulting from employment in Canada. We pay the executive’s Canadian taxes, and the executive is responsible for paying his or her U.S. taxes. |
| • | We reimburse our employees for certain expenses, such as relocation costs and certain business expenses. |
We believe that these benefits are comparable to those offered by other companies that compete with us for executive talent.
Payments Upon Termination or Change in Control
We have an employment agreement with each of our named executive officers. Pursuant to the terms of these employment agreements, each of our named executive officers has received or is entitled to receive certain payments and benefits in connection with certain terminations of his or her employment with us, the terms of which are described below under “Narrative Disclosure to Summary Compensation Table and Grants of Plan-Based Awards in Fiscal 2012 Table—Employment Agreements” and “Potential Payments Upon Termination or Change in Control.” We believe that these benefits are valuable as they address the valid concern that it may be difficult for these named executive officers to find comparable employment in a short period of time in the event of termination. On June 25, 2012, the Company announced that Mr. Graber will depart the Company in July 2012 as part of a leadership change.
Fiscal 2013 compensation decisions
In June 2012, the Compensation Committee reviewed the named executive officers’ compensation for potential adjustments for fiscal 2013. In connection with its review, and with input from AON-Hewitt, the Compensation Committee decided to not increase (or decrease) the base salaries of the named executive officers for fiscal 2013. The Compensation Committee also unanimously approved the fiscal 2013 financial targets for Mr. Amelio, Ms. Hooper, Mr. Summers and Mr. O’Neill for their fiscal 2013 performance-based cash opportunity bonus which will be provided and administered under our
56
Table of Contents
Bonus Plan. While the financial targets have been established, the fiscal 2013 Bonus Plan has not yet been approved by the Compensation Committee or the CHC Cayman board of directors. The fiscal year 2013 Bonus Plan will be presented to the CHC Cayman board of directors for approval later in July 2012. For fiscal 2013, cash bonuses for each of these named executive officers will remain based on the Company’s achievement of annual EBITDAR and Cash Flow performance objectives with individual objectives also considered. These fiscal 2013 performance objectives will be difficult to attain. The target bonus that can be earned by the named executive officers for fiscal 2013 under these performance-based opportunities is calculated as a percentage of annual base salary. The target percentage for fiscal 2013 for the named executive officers remains unchanged from the percentage for fiscal 2012, which is disclosed in “Performance-Based Annual Cash Awards” above. The actual bonus paid may be more or less than the target amount; however, any bonus payment will be subject to the limit(s) provided by the Bonus Plan.
Executive compensation
The following tables provide information on compensation for the services of the named executive officers for fiscal 2012.
Summary Compensation Table – Fiscal Year 2012
The following table provides summary information concerning compensation paid or accrued by us to or on behalf of our named executive officers, for services rendered to us during the fiscal year ended on April 30, 2012. The amounts in the table for Mr. Amelio were converted from Canadian dollars based on the exchange rate in effect on April 30, 2012 of one Canadian dollar being equivalent to $1.0117 U.S. dollars.
| Name and Principal Position |
Year | Salary ($) |
Bonus ($) |
Stock Awards ($)(3) |
Option Awards ($)(4) |
Non-Equity Incentive Plan Compensation ($)(5) |
Change in Pension Value and Nonqualified Deferred Compensation Earnings ($) |
All Other Compensation ($)(6) |
Total ($) |
|||||||||||||||||||||||||||
| William Amelio, |
2012 | 765,491 | — | — | — | 2,250,000 | — | 795,293 | 3,810,784 | |||||||||||||||||||||||||||
| President and Chief Executive Officer |
2011 | 562,500 | 540,000 | (1) | — | — | — | — | 272,130 | 1,374,630 | ||||||||||||||||||||||||||
| Joan Hooper, |
2012 | 255,769 | 150,000 | (2) | — | — | 265,819 | — | 34,094 | 705,683 | ||||||||||||||||||||||||||
| Senior Vice President and Chief Financial Officer |
||||||||||||||||||||||||||||||||||||
| Rick Davis, |
2012 | 132,308 | — | — | — | — | 338,400 | 1,213,885 | 1,684,593 | |||||||||||||||||||||||||||
| Former Senior Vice President and Financial Officer |
2011 | 395,062 | — | — | — | — | 99,583 | 11,852 | 506,497 | |||||||||||||||||||||||||||
| John Graber, |
2012 | 300,000 | 384,000 | (2) | — | — | — | 255,000 | 46,020 | 985,020 | ||||||||||||||||||||||||||
| President, Helicopter Services |
||||||||||||||||||||||||||||||||||||
| Michael Summers, |
2012 | 460,346 | — | — | — | 547,453 | — | 77,899 | 1,085,698 | |||||||||||||||||||||||||||
| Senior Vice President, Human Resources |
2011 | 262,500 | 223,125 | (1) | — | — | — | — | 34,760 | 520,385 | ||||||||||||||||||||||||||
| Michael O’Neill, |
2012 | 450,000 | — | — | — | 547,453 | — | 49,197 | 1,046,650 | |||||||||||||||||||||||||||
| Senior Vice President, Legal |
2011 | 112,500 | — | — | — | — | — | 6,825 | 119,325 | |||||||||||||||||||||||||||
57
Table of Contents
| (1) | These amounts represent guaranteed bonus payments pursuant to the terms of employment arrangements. |
| (2) | This amount represents a signing bonus paid pursuant to the terms of the named executive officer’s employment agreement. |
| (3) | Represents the grant date fair value of the restricted share units (also known as restricted stock units) awarded to the named executive officers in recognition of the premium paid for the Ordinary B shares as described under “2011 Management Equity Plan – Equity Plans”. The grant date value for the restricted stock units is also zero because the named executive officers provided cash consideration such that there is no compensation expense for these restricted stock units. |
| (4) | Represents the incremental grant date fair value, as determined under FASB ASC Topic 718, Stock Compensation, of the performance and time and performance option awards granted to the named executive officer during fiscal 2012 and which are described in the “Long-Term Incentive Compensation” section above and the “Grants of Plan-Based Awards-Fiscal Year 2012” table below. The Company has determined it is not probable that the performance condition(s) will be met for the performance and time and performance options awarded on December 30, 2011 and therefore the incremental grant date fair value represented above is zero. Additional assumptions used to calculate these amounts are included in Note 19, “Stock Based Compensation,” to the Company’s consolidated financial statements for the fiscal year ended April 30, 2012 in this Annual Report on Form 10-K. |
In the event that the performance criteria relating to an Exit Event (as defined in the 2011 MEP) is met for the time and performance options the value of the award at the grant date would be as follows: (a) William Amelio, $2,560,007; (b) Joan Hooper, $640,000; (c) John Graber, $640,000; (d) Michael Summers, $640,000; and (e) Michael O’Neill, $640,000.
In the event that an Exit Event occurs and the Exit Value (as defined in the 2011 MEP) is equal to or exceeds 2.5 times the Adjusted Equity Investment (as defined in the 2011 MEP), which would result in the maximum possible value of the option awards, the value of the award at the grant date would be as follows: (a) William Amelio, $4,923,534; (b) Joan Hooper, $863,772; (c) John Graber, $863,772; (d) Michael Summers, $863,772; and (e) Michael O’Neill, $863,772.
| (5) | Represents the amount of the fiscal 2012 performance-based bonuses that was paid under the Bonus Plan for Ms. Hooper and Messrs. Graber, Summers and O’Neill. The fiscal 2012 performance-based bonus for Mr. Amelio follows the same corporate financial goals as the other named executive officers that were paid under the Bonus Plan except that Mr. Amelio could receive up to 300% of his target bonus as opposed to being subject to a 200% maximum award. Further details on the fiscal 2012 performance-based bonuses paid under the Bonus Plan are described in “Performance-Based Annual Cash Awards” above and the “Grants of Plan-Based Awards-Fiscal Year 2012” table below. |
58
Table of Contents
| (6) | The amount for fiscal 2012 consists of the following (note that certain of the amounts set forth in the table below have been converted from Canadian dollars based on the exchange rate in effect on April 30, 2012 of one Canadian dollar being equivalent to $1.0117 U.S. dollars): |
| Named Executive Officer |
Car allowance |
Company contributions to the Canada Pension Plan |
Tax equalization payments |
Tax preparation fees |
Employer matching contributions to 401(k) plan |
Severance payment |
Post- termination medical and insurance benefits |
Premiums for private health and life insurance coverage |
Other | |||||||||||||||||||||||||||
| William Amelio |
$ | 14,568 | $ | 23,820 | $ | 464,748 | $ | 33,320 | — | — | — | $ | 8,837 | $ | 250,000 | (a) | ||||||||||||||||||||
| Joan Hooper |
$ | 5,815 | — | $ | 8,216 | $ | 1,578 | $ | 6,554 | — | — | $ | 11,931 | — | ||||||||||||||||||||||
| Rick Davis |
$ | 3,277 | — | — | — | — | $ | 1,188,910 | $ | 10,849 | $ | 10,849 | — | |||||||||||||||||||||||
| John Graber |
$ | 7,477 | — | $ | 11,614 | $ | 759 | $ | 9,659 | — | — | $ | 16,511 | — | ||||||||||||||||||||||
| Michael Summers |
$ | 10,800 | — | $ | 46,756 | $ | 1,467 | $ | 17,000 | — | — | $ | 1,876 | — | ||||||||||||||||||||||
| Michael O’Neill |
$ | 10,800 | — | $ | 9,364 | $ | 1,518 | $ | 17,000 | — | — | $ | 10,515 | — | ||||||||||||||||||||||
| (a) | Represents $250,000 of the $500,000 loan described below under “— Employment Agreement — William J. Amelio” which has been forgiven by Heli-One Canada. |
Grants of Plan-Based Awards - Fiscal Year 2012
The following table provides supplemental information relating to grants of plan-based awards to help explain information provided above in our Summary Compensation Table. The amounts in the table for Mr. Amelio were converted from Canadian dollars based on the exchange rate in effect on April 30, 2012 of one Canadian dollar being equivalent to $1.0117 U.S. dollars.
| Name |
Grant Date |
Date of Compensation Committee Approval |
Estimated Future Payouts Under Non-Equity Incentive Plan Awards (1) |
Estimated Future Payouts Under Equity Incentive Plan Awards |
All Other Stock Awards: Number of Shares of Stock or Units (#)(6) |
All Other Option Awards: Number of Securities Underlying Options (#) |
Exercise or Base Price of Option Awards ($/Sh) |
Grant Date Fair Value of Stock and Option Awards ($)(5) |
||||||||||||||||||||||||||||||||||||||||
| Threshold ($) |
Target ($) |
Maximum ($) |
Threshold (#) |
Target (#) |
Maximum (#) |
|||||||||||||||||||||||||||||||||||||||||||
| William Amelio, |
12/30/11 | 12/13/11 | — | 750,000 | 2,250,000 | — | — | — | — | 11,130,466 | (2) | 0.6515 | — | |||||||||||||||||||||||||||||||||||
| President and Chief |
12/30/11 | 12/13/11 | — | — | — | — | — | — | — | 16,452,900 | (3) | 0.6515 | — | |||||||||||||||||||||||||||||||||||
| Executive Officer |
12/30/11 | 12/13/11 | — | — | — | — | — | — | — | 6,992,050 | (4) | 0.6515 | — | |||||||||||||||||||||||||||||||||||
| Joan Hooper, |
12/30/11 | 12/13/11 | 80,750 | 403,750 | 807,500 | — | — | — | — | 2,782,610 | (2) | 0.6515 | — | |||||||||||||||||||||||||||||||||||
| Senior Vice President and Chief Financial Officer |
12/30/11 | 12/13/11 | — | — | — | — | — | — | 33,010 | 4,113,200 | (3) | 0.6515 | — | |||||||||||||||||||||||||||||||||||
| Rick Davis, |
— | — | — | — | — | — | — | — | — | — | ||||||||||||||||||||||||||||||||||||||
| Former Senior Vice President and Financial Officer |
||||||||||||||||||||||||||||||||||||||||||||||||
| John Graber, |
12/30/11 | 12/13/11 | 68,000 | 340,000 | 680,000 | — | — | — | — | 2,782,610 | (2) | 0.6515 | — | |||||||||||||||||||||||||||||||||||
| President, Helicopter Services |
12/30/11 | 12/13/11 | — | — | — | — | — | — | 132,040 | 4,113,200 | (3) | 0.6515 | — | |||||||||||||||||||||||||||||||||||
| Michael Summers, |
12/30/11 | 12/13/11 | 95,625 | 382,500 | 765,000 | — | — | — | — | 2,782,610 | (2) | 0.6515 | — | |||||||||||||||||||||||||||||||||||
| Senior Vice President, Human Resources |
12/30/11 | 12/13/11 | — | — | — | — | — | — | 33,010 | 4,113,200 | (3) | 0.6515 | — | |||||||||||||||||||||||||||||||||||
| Michael O’Neill, |
12/30/11 | 12/13/11 | 95,625 | 382,500 | 765,000 | — | — | — | — | 2,782,610 | (2) | 0.6515 | — | |||||||||||||||||||||||||||||||||||
| Senior Vice President, Legal |
12/30/11 | 12/13/11 | — | — | — | — | — | — | 66,020 | 4,113,200 | (3) | 0.6515 | — | |||||||||||||||||||||||||||||||||||
59
Table of Contents
| (1) | Each named executive officer was eligible to earn a fiscal 2012 performance-based bonus pursuant to his or her employment agreement and, in the case of Ms. Hooper and Messrs. Davis, Graber, Summers and O’Neil, as implemented under the Bonus Plan as discussed in “Performance-Based Annual Cash Awards” and “Employment agreements”. The performance bonus for each named executive officer was based on attaining a fiscal 2012 EBITDAR target of $389.7 million, a target fiscal 2012 Cash Flow target of $(495.5) million and individual performance objectives. The named executive officers were eligible to earn a performance bonus upon the attainment of 85% of the fiscal 2012 Adjusted EBITDAR target goal and could earn up to a maximum amount of 2 times his or her respective target, in the case of Ms. Hooper and Messrs. Davis, Graber, Summers and O’Neil. These threshold and maximum limits mirrored the Company’s approach for our non-executive annual bonus plan. The Company’s actual EBITDAR was approximately $420.6 million and actual Cash Flow was approximately $(486.5) million and therefore the bonus amounts were paid and are reported above in the “Performance-Based Annual Cash Awards” and the “Summary Compensation Table-Fiscal Year 2012”. |
| (2) | These options are referred to as time and performance options and vest in four equal annual installments of twenty-five percent (25%) beginning on the first anniversary of the grant date, subject to the named executive officer’s continued service with the Company and an Exit Event (as defined in the 2011 MEP) occurring, and include acceleration of vesting, that is generally as described above under “Long-Term Incentive Compensation”. |
60
Table of Contents
| (3) | These options are referred to as performance options and vest in up to three tranches, each equal to one-third of the total award of the option, upon the achievement of an Exit Event or Final Exit Event which results in an Exit Value, at the time of the applicable Exit Event or Final Exit Event, equal to or in excess of: (1) the Equity Investment; (2) 2.0 times the Adjusted Equity Investment; and (3) 2.5 times the Adjusted Equity Investment (as such terms are defined in the 2011 MEP). |
| (4) | These Performance Options were granted on December 30, 2011 and vest in up to two tranches, each equal to one-half of the total award of the Performance Option, upon the achievement of an Exit Event or Final Exit Event which results in an Exit Value equal to or in excess of: (i) 2.0 times the Adjusted Equity Investment; and (ii) 2.5 times the Adjusted Equity Investment (as such terms are defined in the 2011 MEP). |
| (5) | In accordance with applicable SEC rules, this column shows the aggregate grant date fair value of the stock options and restricted stock units granted to the named executive officers during fiscal 2012 and are further described in the ‘‘Outstanding Equity Awards at 2012 Fiscal Year-End’’ table and ‘‘2011 Management Equity Plan—Equity Plans’’ below. The incremental grant date fair value for these options represented above is zero as the Company has determined it is not probable that the performance condition(s) of the performance and time and performance options will be met. The grant date value for the restricted stock units is also zero because, as referenced in footnote (6) below, the named executive officers provided cash consideration such that there is no compensation expense for these restricted stock units. For additional information on the valuation assumptions, refer to Note 19, ‘‘Stock Based Compensation,’’ to our consolidated financial statements for the fiscal year ended April 30, 2012, in this Annual Report on Form 10-K. |
| (6) | These restricted stock units were awarded to the named executive officers in recognition of the premium paid for the Ordinary B Shares and are further described in the “Outstanding Equity Awards at 2012 Fiscal Year-End” table and “2011 Management Equity Plan-Equity Plans” below. |
Narrative Disclosure to Summary Compensation Table and Grants of
Plan-Based Awards in Fiscal 2012 Table
Employment Agreements
William J. Amelio
Heli-One Canada entered into an employment agreement with Mr. Amelio, dated as of July 15, 2010, whereby Mr. Amelio serves as the President and Chief Executive Officer of CHC Helicopter S.à r.l. and its direct and indirect subsidiaries (the “CHC Group”). Mr. Amelio’s employment agreement has an indefinite term which commenced on August 10, 2010, subject to the right of Heli-One Canada or Mr. Amelio to terminate the employment agreement in accordance with its terms. Pursuant to the terms of his employment agreement, Mr. Amelio’s annual base salary was originally set at $750,000, which Heli-One Canada will review at the end of each fiscal year and will maintain or increase such annual base salary as the Board of Managers of CHC Helicopter S.à r.l. may determine in its discretion. Additionally, Mr. Amelio is eligible to participate in the Bonus Plan, pursuant to which he is entitled to earn an annual incentive bonus of up to 100% of his base salary if he meets, or up to 300% of his base salary if he exceeds, certain quantitative and qualitative performance targets as set by the Board of Managers of CHC Helicopter S.à r.l. If Mr. Amelio is an employee of Heli-One Canada at the end of a fiscal year, he will be eligible to collect any annual incentive bonus with respect to such fiscal year even if he ceases to be an employee prior to the date on which the annual incentive bonus is paid. Under the agreement, Mr. Amelio is also eligible to receive relocation cash payments and reimbursements upon his relocation to Metro Vancouver or a proximate area in the State of Washington.
The agreement also provided for Mr. Amelio to receive stock option awards and provides him with an automobile allowance of approximately $1,214 per month (based on the April 30, 2012 exchange rate of Canadian dollars to U.S. dollars) and for Heli-One Canada to pay all reasonable operating costs for the use of the vehicle. Pursuant to the terms of the employment agreement, Mr. Amelio is also entitled to participate in Heli-One Canada’s defined contribution plan and all employee insurance and other benefit plans as may be provided by Heli-One Canada to its executive employees. In addition, for each calendar year during which Mr. Amelio is subject to Canadian tax as a result of income arising out of his employment agreement, Heli-One Canada will pay for the services of a tax professional to prepare Mr. Amelio’s U.S. and Canadian tax returns and to manage any audit with respect to such returns. For each calendar year during which Mr. Amelio is subject to Canadian or other non-U.S. tax as a result of income arising under his employment agreement, Heli-One Canada will pay the costs of tax equalization. The agreement also required Mr. Amelio to purchase $2,000,000 of ordinary shares of 6622767 Holding (Cayman) Inc. no later than August 10, 2010 (which Mr. Amelio satisfied). Heli-One Canada advanced $500,000 to Mr. Amelio as a loan to assist him with the purchase of these shares, with a term of two years and interest at the Canadian Prescribed rate as determined by the Income Tax Act (Canada) payable annually. $250,000 of the principal balance of this loan has now been repaid by Mr. Amelio and the remaining $250,000 of the principal balance of this loan was forgiven by Heli-One and is included under the column “All Other Compensation” in the Summary Compensation Table above.
If Mr. Amelio’s employment is terminated: (1) by Heli-One Canada other than for Cause; (2) by him for Good Reason; (3) upon Mr. Amelio’s death or permanent disability; or (4) if during the 180-day period following a Change of Control (as defined in Mr. Amelio’s employment agreement), (i) Mr. Amelio’s employment is terminated by Heli-One Canada other than for Cause or (ii) Mr. Amelio is required to perform his principal duties at a location that is more than 150 kilometers from the
61
Table of Contents
location at which he performed his duties immediately before the Change of Control (a “CIC Constructive Termination”), subject to signing a general release of claims (except in the event of his Permanent Disability (as defined in Mr. Amelio’s employment agreement) or death), he will be entitled to, in addition to certain accrued amounts:
| • | a lump sum payment in an amount equal to 12 months of his base salary (18 months, in the event that Mr. Amelio’s employment is terminated by Heli-One Canada other than for Cause, Permanent Disability or death within two years of Mr. Amelio relocating to the Metro Vancouver area or a proximate area in Washington State); |
| • | subject to the terms and conditions of the applicable benefit plan(s), continuation of his medical and insurance benefits for 12 months, except that Heli-One Canada shall not be required to provide Mr. Amelio and his eligible dependents with medical insurance coverage as long as they are receiving comparable medical insurance coverage from another employer; and |
| • | a pro-rated annual cash bonus based on the average of the bonuses earned in each of the previous two years (except if he is employed for less than two years, in which case such bonus will be the previous year’s bonus). |
The employment agreement provides for Mr. Amelio to be indemnified under certain circumstances, however, if Mr. Amelio’s employment has been terminated by Heli-One Canada for Cause, Heli-One Canada will have no obligation to indemnify Mr. Amelio for any claim arising out of the matter for which his employment was terminated.
In the event it is determined that any payment or distribution by Heli-One Canada or its affiliates to or for the benefit of Mr. Amelio would be subject to the excise tax imposed by Section 4999 of the Internal Revenue Code of 1986, as amended, or any interest or penalties are incurred by Mr. Amelio with respect to such excise tax, then Mr. Amelio will be entitled to receive a gross-up payment that fully reimburses him for such excise taxes.
Pursuant to the terms of his employment agreement, Mr. Amelio is subject to the following covenants: (1) a covenant not to disclose confidential information while employed and at all times thereafter; (2) a covenant not to compete for a period of twelve months following his termination of employment for any reason; and (3) a covenant not to solicit employees or customers for a period of twelve months following his termination of employment for any reason. In the event Mr. Amelio breaches any of the foregoing restrictive covenants, Heli-One Canada will have no obligation to make the termination payments described above and where such payments have already been made, Mr. Amelio agrees to reimburse Heli-One Canada for the amount paid.
Joan Hooper
Heli-One American Support LLC (“Heli-One”) entered into an employment agreement with Ms. Hooper, dated as of September 26, 2011, whereby Ms. Hooper serves as the Senior Vice-President, Chief Financial Officer for the CHC Group. Ms. Hooper’s employment agreement has an indefinite term which commenced on October 3, 2011, subject to the right of Heli-One or Ms. Hooper to terminate the employment agreement in accordance with its terms. Ms. Hooper’s annual base salary under the employment agreement was originally set at $475,000, which Heli-One will review from time to time and may, in its sole discretion, consider it for increase (but not decrease, other than a decrease generally applicable to other similarly situated executives). Additionally, Ms. Hooper is eligible to participate in the SIP and the Bonus Plan, pursuant to which she is eligible to earn a target annual incentive bonus of 85% of her base salary subject to the attainment of certain performance thresholds (for the first plan year of Ms. Hooper’s employment, such bonus will be prorated for the portion of the plan year during which she was employed by Heli-One). Under the agreement, Ms. Hooper was also eligible to receive a five percent (5%) management promote (which are options and restricted share grants) under the 2011 MEP. Heli-One provides Ms. Hooper with an automobile allowance of $10,800 per year and pays all reasonable operating costs for the use of the vehicle. Pursuant to the terms of the employment agreement, Ms. Hooper is entitled to participate in Heli-One’s defined contribution plan and all employee insurance and other benefit plans as is provided from time to time by Heli-One to other similarly-situated executive employees. Ms. Hooper received a sign-on bonus of $150,000 upon the commencement of her employment. Ms. Hooper will be entitled to the benefits of Heli-One’s Tax Equalization Policy as it exists from time to time.
If Ms. Hooper’s employment is terminated: (1) by Heli-One other than for Cause, death, or Total Disability or (2) by her for Good Reason (as these terms are defined in Ms. Hooper’s employment agreement), subject to signing a general release of claims, she is entitled to, in addition to certain accrued amounts:
| • | a lump sum payment in an amount equal to 12 months of her base salary; |
| • | payment on Ms. Hooper’s behalf of the applicable premium for health care continuation coverage pursuant to COBRA for a period of 12 months or until she ceases to be eligible for COBRA continuation coverage, if earlier; and |
| • | a pro-rated annual cash bonus based on the average of the bonuses earned in each of the previous two years under the Bonus Plan (except if she is employed for less than two years, such bonus will be the previous year’s bonus or if she is employed for less than one year, such bonus will be the target bonus). |
62
Table of Contents
The employment agreement provides for Ms. Hooper to be indemnified under certain circumstances.
Pursuant to the terms of her employment agreement, Ms. Hooper is subject to the following covenants: (1) a covenant not to disclose confidential information while employed and at all times thereafter; (2) a covenant not to compete for a period of 12 months following her termination of employment for any reason; and (3) a covenant not to solicit employees or customers for a period of 12 months following her termination of employment for any reason. In the event Ms. Hooper breaches any of the foregoing restrictive covenants, Heli-One will have no obligation to make the termination payments described above and where such payments have already been made, Ms. Hooper agrees to reimburse Heli-One for the amount paid.
Rick Davis
Heli-One Canada entered into an employment agreement with Mr. Davis, dated as of September 16, 2008, whereby Mr. Davis served as the Senior Vice President and Chief Financial Officer of the CHC group of companies until his employment terminated on August 7, 2011. Mr. Davis’s annual base salary was approximately $400,000 (based on the April 30, 2012 exchange rate of Canadian dollars to U.S. dollars), and he was eligible to participate in the Bonus Plan, the share option plan and the special share plan. Heli-One Canada provided Mr. Davis with an automobile allowance of approximately $1,012 per month (based on the April 30, 2012 exchange rate of Canadian dollars to U.S. dollars) and paid all reasonable operating costs for the use of the vehicle. Pursuant to the terms of the employment agreement, Mr. Davis was entitled to participate in Heli-One Canada’s defined contribution plan and all employee insurance and other benefit plans as were provided by Heli-One Canada to its executive employees.
Pursuant to the terms of the employment agreement, in connection with the termination of his employment, he was entitled to, in addition to certain accrued amounts, (1) a lump sum payment in an amount equal to 24 months of his base salary; (2) an annual cash bonus equal to two times the average of the bonuses earned in the immediately preceding two years; (3) subject to the terms and conditions of the applicable benefit plan(s), continuation of his medical and insurance benefits for 24 months, except that CHC will not be required to provide Mr. Davis and his eligible dependents with medical insurance coverage as long as they are receiving comparable medical insurance coverage from another employer; and (4) a pro-rated annual cash bonus based on the average of the bonuses earned in each of the previous two years.
The employment agreement provided for Mr. Davis to be indemnified under certain circumstances.
Pursuant to the terms of his employment agreement, Mr. Davis is currently subject to the following covenants: (1) a covenant not to disclose confidential information while he was employed and at all times thereafter; (2) a covenant not to compete for a period of 24 months following his termination of employment; and (3) a covenant not to solicit employees or customers for a period of 24 months following his termination of employment. In the event Mr. Davis breaches any of the foregoing restrictive covenants, CHC will have no obligation to make the termination payments described above and where such payments have already been made, Mr. Davis agrees to reimburse CHC for the amount paid.
John Graber
Heli-One entered into an employment agreement with Mr. Graber, dated as of July 18, 2011, whereby Mr. Graber serves as the Senior Vice-President for the CHC Group and as President of the Company’s Helicopter Services division. Mr. Graber’s employment agreement has an indefinite term which commenced on July 18, 2011, subject to the right of Heli-One or Mr. Graber to terminate the employment agreement in accordance with its terms. Mr. Graber’s annual base salary under the employment agreement was originally set at $400,000, which Heli-One will review at the end of each fiscal year and will maintain or increase such annual base salary for the following year to such amount as the President and Chief Executive Officer in consultation with the Compensation Committee may determine in its discretion. Additionally, Mr. Graber is eligible to participate in the SIP and the Bonus Plan, pursuant to which he is eligible to earn a target annual incentive bonus of 85% of his base salary subject to the attainment of certain performance thresholds. Under the agreement, for fiscal 2012, Mr. Graber was entitled to, and received, a bonus of $255,000 on May 1, 2012 and if his performance bonus under the Bonus Plan for fiscal 2012 was determined to be greater than $255,000 he was eligible to receive such additional amount which exceeded $255,000 payable on the date that bonus payments under the Bonus Plan were generally payable. In addition, Heli-One was obligated under the employment agreement to pay Mr. Graber a signing bonus of $384,000, payable in three installments of $128,000 each, on July 18, 2011, October 1, 2011 and January 1, 2012. The agreement further provided stock option awards to Mr. Graber and provides him with an automobile allowance of $900 per month and for Heli-One to pay all reasonable operating costs for the use of the vehicle. Pursuant to the terms of the employment agreement, Mr. Graber is entitled to participate in Heli-One’s defined contribution plan and all employee insurance and other benefit plans as is provided by Heli-One to its executive employees. If Heli-One relocates Mr. Graber to Vancouver or to another city in the continental United States, as requested by Mr. Graber and approved by Heli-One, Heli-One will provide Mr. Graber with relocation assistance in accordance with its policies and practices for similarly situated executives. Under the agreement, Mr. Graber is also entitled to the benefits of Heli-One’s Tax Equalization Policy as it exists from time to time.
63
Table of Contents
If Mr. Graber’s employment is terminated: (1) by Heli-One other than for Cause, (2) by him for Good Reason, or (3) upon his death or permanent disability (as these terms are defined in Mr. Graber’s employment agreement), subject to signing a general release of claims, he is entitled to, in addition to certain accrued amounts:
| • | a lump sum payment in an amount equal to 12 months of his base salary; |
| • | subject to the terms and conditions of the applicable benefit plan(s), continuation of his medical and insurance benefits for 12 months; and |
| • | a pro-rated annual cash bonus based on the average of the bonuses earned in each of the previous two years under the Bonus Plan (except if he is employed for less than two years, such bonus will be the previous year’s bonus or if he is employed for less than one year, such bonus will be the target bonus). |
The employment agreement provides for Mr. Graber to be indemnified under certain circumstances, however, if Mr. Graber’s employment has been terminated by Heli-One for Cause, Heli-One will have no obligation to indemnify Mr. Graber for any claim arising out of the matter for which his employment was terminated.
Pursuant to the terms of his employment agreement, Mr. Graber is subject to the following covenants: (1) a covenant not to disclose confidential information while employed and at all times thereafter; (2) a covenant not to compete for a period of 12 months following his termination of employment for any reason; and (3) a covenant not to solicit employees or customers for a period of 12 months following his termination of employment for any reason. In the event Mr. Graber breaches any of the foregoing restrictive covenants, Heli-One will have no obligation to make the termination payments described above and where such payments have already been made, Mr. Graber agrees to reimburse Heli-One for the amount paid.
On June 25, 2012, the Company announced that Mr. Graber will depart the Company in July 2012 as part of a leadership change.
Michael Summers
Heli-One entered into an employment agreement with Mr. Summers, dated as of October 4, 2010, which was amended and restated as of January 5, 2012, whereby Mr. Summers serves as the Senior Vice-President, Human Resources of the CHC Group. The employment agreement is also supplemented by an employment offer letter from Heli-One to Mr. Summers, dated October 26, 2010. Mr. Summers’s employment agreement has an indefinite term which commenced on October 4, 2010, subject to the right of Heli-One or Mr. Summers to terminate the employment agreement in accordance with its terms. Mr. Summers’s annual base salary under the employment agreement is $450,000, which Heli-One will review at the end of each fiscal year and will maintain or increase such annual base salary for the following year to such amount as the President and Chief Executive Officer in consultation with the Compensation Committee may determine in its discretion. Additionally, Mr. Summers is eligible to participate in the SIP, the 2011 MEP and the Bonus Plan, pursuant to which he is eligible to earn an annual target performance bonus of 85% of his base salary if certain corporate performance targets are attained. Heli-One provides Mr. Summers with an automobile allowance of $900 per month and pays all reasonable operating costs for the use of the vehicle. Pursuant to the terms of the employment agreement, Mr. Summers is entitled to participate in Heli-One’s defined contribution plan, supplemental pension plan, and all employee insurance and other benefit plans as is provided by Heli-One to its executive employees. Further, Mr. Summers is entitled to be provided tax preparation assistance and tax equalization payments in accordance with Heli-One’s Tax Equalization Policy.
If Mr. Summers’s employment is terminated: (1) by Heli-One other than for Cause, (2) by him for Good Reason, or (3) upon his death or permanent disability (as these terms are defined in Mr. Summers’s employment agreement), subject to signing a general release of claims, he is entitled to, in addition to certain accrued amounts:
| • | a lump sum payment in an amount equal to 12 months of his base salary; |
| • | subject to the terms and conditions of the applicable benefit plan(s), continuation of his medical and insurance benefits for 12 months, except that Heli-One will not be required to provide Mr. Summers and his eligible dependents with medical insurance coverage as long as they are receiving comparable medical insurance coverage from another employer; and |
| • | a pro-rated annual cash bonus based on the average of the bonuses earned in each of the previous two years under the Bonus Plan (except if he is employed for less than two years, such bonus will be the previous year’s bonus or if he is employed for less than one year, such bonus will be the target bonus). |
64
Table of Contents
The employment agreement provides for Mr. Summers to be indemnified under certain circumstances, however, if Mr. Summers’s employment has been terminated by CHC for Cause, CHC will have no obligation to indemnify Mr. Summers for any claim arising out of the matter for which his employment was terminated.
Pursuant to the terms of his employment agreement, Mr. Summers is subject to the following covenants: (1) a covenant not to disclose confidential information while employed and at all times thereafter; (2) a covenant not to compete for a period of 12 months following his termination of employment for any reason; and (3) a covenant not to solicit employees or customers for a period of 12 months following his termination of employment for any reason. In the event Mr. Summers breaches any of the foregoing restrictive covenants, Heli-One will have no obligation to make the termination payments described above and where such payments have already been made, Mr. Summers agrees to reimburse Heli-One for the amount paid.
Michael O’Neill
Heli-One entered into an employment agreement with Mr. O’Neill, dated as of February 2, 2011, whereby Mr. O’Neill serves as the Senior Vice-President, Legal of the CHC Group. Mr. O’Neill’s employment agreement has an indefinite term which commenced on February 2, 2011, subject to the right of Heli-One or Mr. O’Neill to terminate the employment agreement in accordance with its terms. Mr. O’Neill’s annual base salary under the employment agreement was originally set at $450,000, which Heli-One will review at the end of each fiscal year and will maintain or increase such annual base salary for the following year to such amount as the President and Chief Executive Officer in consultation with the Compensation Committee may determine in its discretion (during the first year of Mr. O’Neill’s employment, such review will occur in connection with the mid-year review process), and he is eligible to participate in the Bonus Plan and the SIP. Heli-One provides Mr. O’Neill with an automobile allowance of $900 per month and pays all reasonable operating costs for the use of the vehicle. Pursuant to the terms of the employment agreement, Mr. O’Neill is entitled to participate in Heli-One’s defined contribution plan and all employee insurance and other benefit plans as is provided by Heli-One to its executive employees. If Heli-One relocates Mr. O’Neill to Vancouver on or before August 1, 2012, with Mr. O’Neill’s prior written consent, Heli-One will provide Mr. O’Neill with relocation assistance in accordance with its policies and practices for similarly situated executives. Mr. O’Neill has not yet relocated to Vancouver and, therefore, he has not yet received any such relocation assistance.
If Mr. O’Neill’s employment is terminated: (1) by Heli-One other than for Cause, (2) by him for Good Reason, or (3) upon his death or permanent disability (as these terms are defined in Mr. O’Neill’s employment agreement), subject to signing a general release of claims, he is entitled to, in addition to certain accrued amounts:
| • | a lump sum payment in an amount equal to 12 months of his base salary; |
| • | subject to the terms and conditions of the applicable benefit plan(s), continuation of his medical and insurance benefits for 12 months, except that Heli-One will not be required to provide Mr. O’Neill and his eligible dependents with medical insurance coverage as long as they are receiving comparable medical insurance coverage from another employer; and |
| • | a pro-rated annual cash bonus based on the average of the bonuses earned in each of the previous two years under the Bonus Plan (except if he is employed for less than two years, such bonus will be the previous year’s bonus or if he is employed for less than one year, such bonus will be the target bonus). |
The employment agreement provides for Mr. O’Neill to be indemnified under certain circumstances, however, if Mr. O’Neill’s employment has been terminated by Heli-One for Cause, Heli-One will have no obligation to indemnify Mr. O’Neill for any claim arising out of the matter for which his employment was terminated.
Pursuant to the terms of his employment agreement, Mr. O’Neill is subject to the following covenants: (1) a covenant not to disclose confidential information while employed and at all times thereafter; (2) a covenant not to compete for a period of 12 months following his termination of employment for any reason; and (3) a covenant not to solicit employees or customers for a period of 12 months following his termination of employment for any reason. In the event Mr. O’Neill breaches any of the foregoing restrictive covenants, Heli-One will have no obligation to make the termination payments described above and where such payments have already been made, Mr. O’Neill agrees to reimburse Heli-One for the amount paid.
Equity Plans
Share Incentive Plan
The SIP authorizes the Board, or any person or persons designated by the Board to administer the SIP (the “Designated Committee”), to grant Options and Special Shares to employees, directors or consultants of CHC Cayman and its affiliates.
65
Table of Contents
Options. The Options vest in five equal annual installments beginning on the first anniversary of the effective date of the stock option agreement. The Options will also become 100% vested (x) immediately following receipt by the funds and the investors of aggregate distributions from CHC Cayman in an amount equal to the Investors’ Investment and (y) immediately prior to the occurrence of a Change in Control (as such terms are defined in the SIP), whichever occurs first. Upon termination of a participant’s employment, (1) unvested Options held by such participant will be cancelled as of such date of termination and (2) vested Options held by such participant will be exercisable within the period commencing on the date such Option becomes vested and ending on the earlier of (A) the occurrence of the Final Exit Event (as defined in the SIP) and (B) the tenth anniversary of the effective date of the stock option agreement, except if the participant’s employment (x) is terminated by us for Cause or (y) is terminated by us without Cause or terminates due to Retirement (as such terms are defined in the SIP) prior to a Change in Control (where, in the case of clause (y), such participant is employed by, contracts or consults with a competitor of CHC Cayman or any of its affiliates at any time during the 1 year period following the date of termination), in which case vested Options held by such participant will be cancelled effective as of the date of termination. In addition, if the participant’s employment terminates due to Disability (as defined in the SIP) or death, the participant (or, in the case of the death of the participant, the participant’s legal representative or estate) will have the right to surrender to CHC Cayman all Options granted to the participant which have vested as of such date of termination for a cash amount equal to the excess of the fair value of the Ordinary B shares as of such date underlying such Options over the aggregate exercise price for such Options.
Special Shares. The Special Shares vest upon a given Exit Event once the aggregate Exit Value in connection with such Exit Event and all Exit Events prior to such Exit Event equals or exceeds a certain multiple of the Investors’ Investment, provided that the participant’s employment has not been terminated prior to the date of such Exit Event (as such terms are defined in the SIP). Pursuant to the SIP: (1) if the participant’s employment terminates due to Retirement or is terminated by us without Cause (other than where such participant is employed by, contracts or consults with a competitor of CHC Cayman or any of its affiliates at any time during the 1 year period following the date of termination), CHC Cayman may redeem using the proceeds received by it in connection with an Exit Event, at any time following the Exit Event until or on the date of the Final Exit Event, any unvested Special Shares, for their fair value determined as of the participant’s date of termination, immediately following such redemption, the unvested Special Shares will be cancelled; (2) if the participant’s employment terminates due to death or Disability, CHC Cayman may redeem at any time until or on the date of the Final Exit Event any unvested Special Shares, for their fair value determined as of the participant’s date of termination, and immediately following such redemption, the unvested Special Shares will be cancelled; (3) except where CHC Cayman exercises its right to redeem a participant’s Special Shares pursuant clauses (1) or (2) above, if the participant’s employment terminates for any reason, CHC Cayman will redeem the unvested Special Shares issued to the participant effective as of the participant’s date of termination for their par value, immediately following which the unvested Special Shares so redeemed will be cancelled; (4) if the participant’s employment (a) is terminated by us for Cause or (b) is terminated by us without Cause or terminates due to Retirement (where, in the case of clause (b), such participant is employed by, contracts or consults with a competitor of CHC Cayman or any of its affiliates at any time during the 1 year period following the date of termination), any vested Special Shares (determined as of the date of termination) may be redeemed by CHC Cayman for their par value, immediately following which the vested Special Shares so redeemed will be cancelled; and (5) except where CHC Cayman exercises its right to redeem a participant’s Special Shares pursuant to clause (6) above, if the participant’s employment terminates for any reason, CHC Cayman may redeem, at any time following 6 months plus 1 day following the date of vesting applicable to such shares until or on the Final Exit Event, the vested Special Shares issued to the participant for their fair value determined as of the later of such date of termination and 6 months plus 1 day following the date of vesting applicable to such shares, immediately following which the vested Special Shares so redeemed will be cancelled.
2011 Management Equity Plan
Our Board adopted the 2011 MEP in November 2011. The following description of the 2011 MEP is not complete and is qualified by reference to the full text of the plan which is attached as Exhibit 10.6 to our Form S-4 registration statement filed with the SEC on January 18, 2012. The 2011 MEP is designed to provide eligible employees a proprietary interest in us and thereby encourage such employees to perform the duties of their employment to the best of their abilities and to devote their business time and efforts to increase the value of CHC Helicopter S.A. (“CHC S.A.”) and to facilitate a successful public offering or other disposition of the shares or other economic interests in CHC S.A. The 2011 MEP is also intended to assist CHC Cayman and its affiliates in attracting and retaining individuals with superior experience and ability.
The 2011 MEP authorizes the Designated Committee to grant time- and performance-based stock options to purchase Ordinary B shares (the “New Time and Performance Options”), performance-based stock options to purchase Ordinary B Shares (the “New Performance Options” and together with the New Time and Performance Options, the “New Options”) and restricted share units (“RSUs”) to employees, directors or consultants of CHC Cayman and its affiliates.
New Options. Unless otherwise provided in an award agreement, the New Time and Performance Options vest in four equal annual installments of 25% beginning on the first anniversary of the effective date of the stock option agreement. Notwithstanding the foregoing, all unvested New Time and Performance Options will vest immediately in the event of the funds and the investors receiving aggregate distributions from us in an amount equal to the Equity Investment, or
66
Table of Contents
immediately prior to a Change in Control (as such terms are defined in the 2011 MEP). The New Performance Options vest in up to three tranches, each equal to one-third of the total award of New Performance Options, upon the achievement of an Exit Event or Final Exit Event which results in an Exit Value, at the time of the applicable Exit Event or Final Exit Event, equal to or in excess of: (1) the Equity Investment; (2) 2.0 times the Adjusted Equity Investment; and (3) 2.5 times the Adjusted Equity Investment (as such terms are defined in the 2011 MEP). The exercise price for each Ordinary B share issuable under any New Option will be determined by the Designated Committee, but in any event, will be no less than the fair value per Ordinary B share on the date of grant. The terms addressing the exercise period and the consequences of a termination of an option holder’s employment of the New Options are generally the same as the terms provided under the SIP.
Restricted Stock Units. The Designated Committee may from time to time grant RSUs to participants in such number and on such terms and conditions consistent with the 2011 MEP, as the Designated Committee determines. Unless otherwise provided in an award agreement, RSUs will be vested on the date of grant and will generally be settled on the earlier to occur of (1) the fifth anniversary of the date of grant and (2) the date of a 409A Change of Control (as such term is defined in the 2011 MEP) (the “Settlement Date”). If a participant’s employment terminates for any reason (other than by the Company for Cause or due to death) prior to the Settlement Date, the participant’s RSUs will continue to be eligible for settlement. In the event that an RSU holder dies prior to the Settlement Date, any RSUs credited to such participant’s account on the date of death will be settled and the Company will deliver the requisite number of Ordinary B shares issued from treasury to the participant’s personal representative as soon as practical following the Participant’s death. In the event that an RSU holder’s employment is terminated by the Company for Cause, all RSUs credited to his or her account will be forfeited and cancelled, and the participant will receive no compensation for such forfeiture and cancellation.
Buy-In Program. In order to participate in the 2011 MEP, the named executive officers were required to purchase Ordinary B shares of CHC Cayman at a premium. The named executive officer purchased such shares pursuant to a Subscription Agreement dated December 30, 2011 between the named executive officer and CHC Cayman at a subscription price of $0.83 a share. In recognition of the premium paid by the named executive officers, they each were awarded, pursuant to the 2011 MEP, RSUs. Each named executive officer received an award of RSUs redeemable on settlement for a number of Ordinary B shares equal to 27.39% of the Ordinary B shares purchased by him or her above, rounded down to the nearest whole number.
Outstanding Equity Awards at 2012 Fiscal Year-End
The following table provides information regarding outstanding equity awards held by our named executive officers as of April 30, 2012.
| Option Awards | Stock Awards | |||||||||||||||||||||||||||||||||||||
| Name |
Number of Securities Underlying Unexercised Options (#) Exercisable |
Number of Securities Underlying Unexercised Options (#) Unexercisable |
Equity Incentive Plan Awards: Number of Securities Underlying Unexercised Unearned Options (#) |
Option Exercise Price ($) |
Option Expiration Date |
Number of Shares or Units of Stock That Have Not Vested (#) |
Market Value of Shares or Units of Stock That Have Not Vested ($) |
Equity Incentive Plan Awards: Number of Unearned Shares, Units or Other Rights That Have Not Vested (#) |
Equity Incentive Plan Awards: Market or Payout Value of Unearned Shares, Units or Other Rights That Have Not Vested ($) |
|||||||||||||||||||||||||||||
| William Amelio, |
— | 11,130,466 | — | 0.6515 | 12/30/21 | (1) | — | — | — | — | ||||||||||||||||||||||||||||
| President and Chief Executive Officer |
— | 16,452,900 | — | 0.6515 | 12/30/21 | (2) | — | — | — | — | ||||||||||||||||||||||||||||
| — | 6,992,500 | — | 0.6515 | 12/30/21 | (4) | — | — | — | — | |||||||||||||||||||||||||||||
| Joan Hooper, |
— | 2,782,610 | — | 0.6515 | 12/30/21 | (1) | — | — | — | — | ||||||||||||||||||||||||||||
| Senior Vice President and Chief Financial Officer |
— | 4,113,200 | — | 0.6515 | 12/30/21 | (2) | — | — | 33,010 | (6) | 21,506 | (6) | ||||||||||||||||||||||||||
| Rick Davis, |
331,050 | (3) | — | — | 0.10 | 6/29/15 | — | — | — | — | ||||||||||||||||||||||||||||
| Former Senior Vice President and Chief Financial Officer |
2,671,307 | (3) | — | — | 1.00 | 9/16/18 | — | — | 48,000 | (5) | 31,272 | (5) | ||||||||||||||||||||||||||
| John Graber, |
— | 2,782,610 | — | 0.6515 | 12/30/21 | (1) | — | — | — | — | ||||||||||||||||||||||||||||
| President, Helicopter Services |
— | 4,113,200 | — | 0.6515 | 12/30/21 | (2) | — | — | 132,040 | (6) | 86,024 | (6) | ||||||||||||||||||||||||||
| Michael Summers, |
— | 2,782,610 | — | 0.6515 | 12/30/21 | (1) | — | — | 33,010 | (6) | 21,506 | (6) | ||||||||||||||||||||||||||
| Senior Vice President, Human Resources |
4,113,200 | — | 0.6515 | 12/30/21 | (2) | — | — | — | — | |||||||||||||||||||||||||||||
| Michael O’Neill, |
— | 2,782,610 | — | 0.6515 | 12/30/21 | (1) | — | — | 66,020 | (6) | 43,012 | (6) | ||||||||||||||||||||||||||
| Senior Vice President, Legal |
4,113,200 | 0.6515 | 12/30/21 | (2) | — | — | — | — | ||||||||||||||||||||||||||||||
67
Table of Contents
| (1) | These Time and Performance Options were granted on December 30, 2011 and vest in four equal annual installments of twenty-five percent (25%) beginning on the first anniversary of the grant date. In addition, these options may become fully vested in the event of the funds and the investors receiving aggregate distributions from us in an amount equal to the Equity Investment, or immediately prior to a Change in Control (as such terms are defined in the 2011 MEP). However, these options will only be exercisable in the event of an Exit Event or Final Exit Event, as the case may be, which results in an Exit Value equal to or in excess of the Equity Investment, as at the time of the applicable event (as such terms are defined in the 2011 MEP). |
| (2) | These Performance Options were granted on December 30, 2011 and vest in up to three tranches, each equal to one-third of the total award of the Performance Option, upon the achievement of an Exit Event or Final Exit Event which results in an Exit Value, at the time of the applicable Exit Event or Final Exit Event, equal to or in excess of: (1) the Equity Investment; (2) 2.0 times the Adjusted Equity Investment; and (3) 2.5 times the Adjusted Equity Investment (as such terms are defined in the 2011 MEP). |
| (3) | All options vest equally 20% per year beginning on the grant date. Options expire 10 years following the grant date. |
| (4) | These Performance Options were granted on December 30, 2011 and vest in up to two tranches, each equal to one-half of the total award of the Performance Option, upon the achievement of an Exit Event or Final Exit Event which results in an Exit Value equal to or in excess of: (i) 2.0 times the Adjusted Equity Investment; and (ii) 2.5 times the Adjusted Equity Investment (as such terms are defined in the 2011 MEP). |
| (5) | These shares are Special Shares that vest upon a given Exit Event as described under “Narrative Disclosure to Summary Compensation Table and Grants of Plan-Based Awards in Fiscal 2012 Table – Equity Plans – Share Incentive Plan.” Because there is no public market for our equity securities, the market value of the Special Shares is not readily determinable. However, purely for purposes of completing the above table, the fair market value of an Ordinary B share as of April 30, 2012 has been assumed to be $0.6515. |
| (6) | These restricted share units are settled on the earlier of: (i) the fifth anniversary of the date of grant; and (ii) the date of a 409A Change of Control as described under “2011 Management Equity Plan – Equity Plans.” Because there is no public market for our equity securities, the market value of the restricted share units is not readily determinable. However, purely for purposes of completing the above table, the fair market value of an Ordinary B share as of April 30, 2012 has been assumed to be $0.6515. |
Option Exercises and Stock Vested – Fiscal Year 2012
None of our named executive officers had options that were exercised or stock that vested during the 2012 fiscal year.
Pension Benefits – Fiscal Year 2012
None of our named executive officers received any pension benefits in the 2012 fiscal year.
Non-Qualified Deferred Compensation – Fiscal Year 2012
We do not offer non-qualified deferred compensation to our named executive officers.
Hypothetical Potential Payments Upon Termination or Change in Control
Each of our named executive officers is or was party to an employment agreement as described above under “Narrative Disclosure to Summary Compensation Table and Grants of Plan-Based Awards in Fiscal 2012 Table—Employment Agreements.” Pursuant to these agreements, our named executive officers are or were entitled to certain severance payments and benefits and are subject to certain confidentiality, non-competition and non-solicitation provisions.
68
Table of Contents
The following tables below provide estimates for compensation payable to each named executive officer under hypothetical termination of employment and change in control scenarios under our compensatory arrangements other than nondiscriminatory arrangements generally available to salaried employees. The amounts shown in the tables are estimates and assume the hypothetical involuntary termination or change in control occurred on April 30, 2012, the last day of fiscal 2012, applying the provisions of the agreements that were in effect as of such date. Due to the number of factors and assumptions that can affect the nature and amount of any benefits provided upon the events discussed below, any amounts paid or distributed upon an actual event may differ.
For purposes of the hypothetical payment estimates shown in the below table, some of the important assumptions were:
| • | Executive’s rate of base salary as of April 30, 2012; |
| • | Cash severance as provided under the executive’s employment agreement in effect as of April 30, 2012; |
| • | Company change in control occurring on April 30, 2012; |
| • | Termination of executive’s employment occurring on April 30, 2012; |
| • | April 30, 2012 share price of $0.6515; |
| • | Exchange rate in effect on April 30, 2012 of one Canadian dollar being equivalent to $1.0117 U.S. dollars; and |
| • | The executives’ employment agreements that were in effect as of April 30, 2012 were utilized. |
Each of the columns in the table below show the total hypothetical payment estimate upon a specified event and the amounts in the columns should not be aggregated across the table.
Mr. Amelio
| Change in Control |
Involuntary Termination (without cause or resignation by executive for good reason) |
Involuntary Termination (without cause or resignation by executive for good reason) during a Change in Control Period |
Death or Permanent Disability |
|||||||||||||
| Base Salary Continuation |
— | $ | 750,000 | (1) | $ | 750,000 | (1) | $ | 750,000 | (1) | ||||||
| Bonus |
— | $ | 540,000 | (2) | $ | 540,000 | (2) | $ | 540,000 | (2) | ||||||
| Continuation of Health Insurance Benefits |
— | $ | 8,837 | (3) | $ | 8,837 | (3) | $ | 8,837 | (3) | ||||||
| Tax Gross-up |
— | $ | — | (4) | $ | — | (4) | $ | — | (4) | ||||||
| Total |
— | $ | 1,298,837 | $ | 1,298,837 | $ | 1,298,837 | |||||||||
69
Table of Contents
| (1) | This amount represents a lump sum payment in an amount equal to 12 months of Mr. Amerlio’s base salary. The lump sum payment would be equal to 18 months salary in the event that Mr. Amelio’s employment is terminated by Heli-One Canada other than for cause, permanent disability or death within two years of Mr. Amelio relocating to the Metro Vancouver area or a proximate area in Washington State. |
| (2) | This amount represents a pro-rated annual bonus based on the bonus he earned in fiscal 2011. |
| (3) | This amount represents the value of continuation of medical and insurance benefits for 12 months. |
| (4) | In the event it is determined that any payment or distribution by Heli-One Canada or its affiliates to or for the benefit of Mr. Amelio would be subject to the excise tax imposed by Section 4999 of the Internal Revenue Code of 1986, as amended, or any interest or penalties are incurred by Mr. Amelio with respect to such excise tax, then Mr. Amelio will be entitled to receive a gross-up payment that fully reimburses him for such excise taxes. |
Ms. Hooper
| Involuntary Termination (without cause or resignation by executive for good reason) |
Involuntary Termination (without cause or resignation by executive for good reason) during a Change in Control Period |
Death or Permanent Disability |
||||||||||
| Base Salary Continuation |
$ | 475,000 | (1) | $ | 475,000 | (1) | — | |||||
| Bonus |
$ | 233,401 | (2) | $ | 233,401 | (2) | — | |||||
| Continuation of Health Insurance Benefits |
$ | 11,931 | (3) | $ | 11,931 | (3) | — | |||||
| Total |
$ | 720,332 | $ | 720,332 | — | |||||||
| (1) | This amount represents a lump sum payment in an amount equal to 12 months of Ms. Hooper’s base salary. |
| (2) | This amount represents a pro-rated annual bonus based on her target bonus under the Bonus Plan for fiscal 2012. |
| (3) | This amount represents the value of continuation of medical and insurance benefits for 12 months. |
Mr. Davis
Mr. Davis’s employment was terminated on August 7, 2011, and, in connection with such termination, he received a $1,110,411 lump sum severance payment in August 2011 (which consisted of an amount equal to 24 months of his annual base salary at the time of his termination and an amount equal to two times the average of the annual cash bonuses he had earned in the two years preceding the year of his termination), continuation of his medical and insurance benefits for 24 months (which is valued at approximately $20,640), and a pro-rated annual bonus of $75,000 in August 2011 (which was based on the average of the annual cash bonuses he had earned in the two years preceding the year of his termination).
In connection with the termination of Mr. Davis’s employment, Heli-One Canada and Mr. Davis entered into a separation agreement, dated August 8, 2011 (the “Separation Agreement”). In addition to the payments and benefits described in the preceding paragraph, (1) CHC Cayman agreed to not exercise its call right on his 458,266 Ordinary B shares;
70
Table of Contents
(2) 1,780,870 Ordinary B shares underlying an Option will remain outstanding and continue to be exercisable by him; and (3) subject to abiding by the terms of the consulting agreement (as discussed below), at the end of the Term (as defined below) CHC Cayman agreed (i) to vest an additional 890,435 Ordinary B shares underlying an Option and (ii) not to redeem 48,000 Special Shares. In addition, Mr. Davis will continue to be obligated by the terms of a promissory note issued by him to FR Horizon Topco S.à r.l., dated September 16, 2008, evidencing indebtedness of $235,291.82. This promissory note was still outstanding as of April 30, 2012.
In connection with the Separation Agreement, Mr. Davis entered into a consulting agreement, dated August 8, 2011. The term of the consulting agreement commenced on August 8, 2011 and ended on November 7, 2011 (the “Term”). During the Term, Mr. Davis provided full time consulting services to Heli-One Canada consisting of assisting in the transitioning of his duties and responsibilities as Heli-One Canada’s former Chief Financial Officer, for which Mr. Davis received $32,918 per month.
Mr. Graber
| Involuntary Termination (without cause or resignation by executive for good reason) |
Involuntary Termination (without cause or resignation by executive for good reason) during a Change in Control Period |
Death or Permanent Disability |
||||||||||
| Base Salary Continuation |
$ | 400,000 | (1) | $ | 400,000 | (1) | $ | 400,000 | (1) | |||
| Bonus |
$ | 268,274 | (2) | $ | 268,274 | (2) | $ | 268,274 | (2) | |||
| Continuation of Health Insurance Benefits |
$ | 16,511 | (3) | $ | 16,511 | (3) | $ | 16,511 | (3) | |||
| Total |
$ | 684,785 | $ | 684,785 | $ | 684,785 | ||||||
| (1) | This amount represents a lump sum payment in an amount equal to 12 months of Mr. Graber’s base salary. |
| (2) | This amount represents a pro-rated annual bonus based on his target bonus under the Bonus Plan for fiscal 2012. |
| (3) | This amount represents the value of continuation of medical and insurance benefits for 12 months. |
71
Table of Contents
On June 25, 2012, the Company announced that Mr. Graber will depart the Company in July 2012 as part of a leadership change.
Mr. Summers
| Involuntary Termination (without cause or resignation by executive for good reason) |
Involuntary Termination (without cause or resignation by executive for good reason) during a Change in Control Period |
Death or Permanent Disability |
||||||||||
| Base Salary Continuation |
$ | 450,000 | (1) | $ | 450,000 | (1) | $ | 450,000 | (1) | |||
| Bonus |
$ | — | (2) | $ | — | (2) | $ | — | (2) | |||
| Continuation of Health Insurance Benefits |
$ | 1,876 | (3) | $ | 1,876 | (3) | $ | 1,876 | (3) | |||
| Total |
$ | 451,876 | $ | 451,876 | $ | 451,876 | ||||||
| (1) | This amount represents a lump sum payment in an amount equal to 12 months of Mr. Summers’s base salary. |
| (2) | This amount represents a pro-rated annual bonus based on the bonus he earned in fiscal 2011. |
| (3) | This amount represents the value of continuation of his medical and insurance benefits for 12 months. |
Mr. O’Neill
| Involuntary Termination (without cause or resignation by executive for good reason) |
Involuntary Termination (without cause or resignation by executive for good reason) during a Change in Control Period |
Death or Permanent Disability |
||||||||||
| Base Salary Continuation |
$ | 450,000 | (1) | $ | 450,000 | (1) | $ | 450,000 | (1) | |||
| Bonus |
$ | — | (2) | $ | — | (2) | $ | — | (2) | |||
| Continuation of Health Insurance Benefits |
$ | 10,515 | (3) | $ | 10,515 | (3) | $ | 10,515 | (3) | |||
| Total |
$ | 460,515 | $ | 460,515 | $ | 460,515 | ||||||
72
Table of Contents
| (1) | This amount represents a lump sum payment in an amount equal to 12 months of Mr. O’Neill’s base salary. |
| (2) | This amount represents a pro-rated annual bonus based on the bonus he earned in fiscal 2011. |
| (3) | This amount represents the value of continuation of his medical and insurance benefits for 12 months. |
Board Compensation
With the exception of Mr. Lewis, the members of the Company’s board of directors and CHC Cayman’s board of managers do not receive compensation in their capacity as directors or members of the board of managers. In his capacity as an outside member of the CHC Cayman board of managers, Mr. Lewis is entitled to a retainer of $40,000; a meeting fee of $2,500 per board of managers meeting attended (subject to a maximum of $10,000 per annum); a restricted stock grant of the Company of $100,000, vesting over a three year period; and additional committee chair fees, as applicable.
| Item 12. | Security ownership of certain beneficial owners and management and related stockholder matters |
CHC Helicopter S.A. is a wholly-owned subsidiary of CHC Helicopter Holding S.à r.l., which owns all of its issued and outstanding capital stock. CHC Helicopter Holding S.à r.l. is a wholly-owned subsidiary of 6922767 Holding S.à r.l., which owns all of its issued and outstanding capital stock. 6922767 Holding S.à r.l. is a wholly-owned subsidiary of CHC Cayman, which indirectly owns all of its issued and outstanding capital stock. The capital stock of CHC Cayman is comprised of Ordinary A shares (“Class A Shares”), Ordinary B shares (“Class B Shares”), Special A shares (“Special Shares”) and Adjustable C shares (“Class C Shares”). Holders of Class A Shares are entitled to one vote per Class A Share. Holders of Special Shares are entitled to one vote per 100 Special Shares. Holders of Class C Shares do not have any voting rights until a Qualified EEA JV Sale (as such term is defined in CHC Cayman’s Amended and Restated Memorandum and Articles of Association) occurs. Following the occurrence of a Qualified EEA JV Sale, holders of Class C Shares will, under certain circumstances, be entitled to the same voting rights as holders of Class A Shares. Holders of Class B Shares do not have any voting rights.
The following table sets forth as of June 30, 2012, certain information regarding the beneficial ownership of voting securities of CHC Cayman by each person who beneficially owns more than five percent of CHC Cayman’s voting securities. In addition, the following table sets forth as of June 30, 2012 certain information regarding the beneficial ownership of equity securities of CHC Cayman by each of the directors and executive officers of the Company, individually, and by the directors and executive officers of the Company as a group.
The percentages of shares outstanding are based on 1,870,561,417 Class A Shares, 8,512,986 Class B Shares, 318,000 Special Shares and one Class C Share outstanding as of June 30, 2012. The amounts and percentages of shares beneficially owned are reported on the basis of SEC regulations governing the determination of beneficial ownership of securities. Under SEC rules, a person is deemed to be a “beneficial owner” of a security if that person has or shares voting power or investment power, which includes the power to dispose of or to direct the disposition of such security. A person is also deemed to be a beneficial owner of any securities of which that person has a right to acquire beneficial ownership within 60 days. Securities that can be so acquired are deemed to be outstanding for purposes of computing such person’s ownership percentage, but not for purposes of computing any other person’s percentage. Under these rules, more than one person may be deemed to be a beneficial owner of the same securities and a person may be deemed to be a beneficial owner of securities as to which such person has no economic interest.
73
Table of Contents
| Aggregate Number of
Shares Beneficially Owned (1) |
||||||||
| Name and Address of Beneficial Owner |
Number of
Issued Shares |
Percent of Class | ||||||
| Horizon Alpha Limited (2)(4) |
|
1,404,461,768 Class A Shares |
|
75.1 | % | |||
| FR XI Horizon Co-Investment I, L.P. (3)(4) |
|
424,000,000 Class A Shares |
|
22.7 | % | |||
| FR XI Horizon Co-Investment II, L.P. (3)(4) |
|
17,099,649 Class A Shares |
|
0.9 | % | |||
| Directors and Current Executive Officers: |
||||||||
| Dod Wales (5) |
— | — | ||||||
| Daren Schneider (5) |
— | — | ||||||
| John Dejans |
— | — | ||||||
| Richard Brekelmans |
— | — | ||||||
| Hille-Paul Schut |
— | — | ||||||
| Joan Hooper (6) |
|
153,492 Class B Shares |
|
1.8 | % | |||
| William Amelio |
|
2,000,000 Class B Shares |
|
23.5 | % | |||
| Larry Alexandre (7) |
|
76,746 Class B Shares |
|
0.9 | % | |||
| Aggregate Number of
Shares Beneficially Owned (1) |
||||||||
| Name and Address of Beneficial Owner |
Number of
Issued Shares |
Percent of Class | ||||||
| Michael O’Neill (8) |
|
306,984 Class B Shares |
|
3.6 | % | |||
| Daniel M. McDonald (9) |
|
76,746 Class B Shares |
|
0.9 | % | |||
| John Graber (10) |
|
613,968 Class B Shares |
|
7.1 | % | |||
| Michael Summers (11) |
|
153,492 Class B Shares |
|
1.8 | % | |||
| All current directors and executive officers as a group |
|
3,381,428 Class B Shares |
|
38.4 | % | |||
| Former Executive Officers: |
||||||||
| Christine Baird |
|
309,292 Class B Shares |
|
3.6 | % | |||
|
|
40,000 Special Shares |
|
12.6 | % | ||||
| Neil Calvert |
|
309,292 Class B Shares |
|
3.6 | % | |||
|
|
40,000 Special Shares |
|
12.6 | % | ||||
| Rick Davis |
|
458,266 Class B Shares |
|
5.4 | % | |||
|
|
48,000 Special Shares |
|
15.1 | % | ||||
| Tillman Gabriel |
— | — | ||||||
| All former executive officers as a group |
|
1,076,850 Class B Shares |
|
12.6 | % | |||
| |
128,000 Special Shares |
|
40.3 | % | ||||
| (1) | Includes shares held in the beneficial owner’s name or jointly with others, or in the name of a bank, nominee or trustee for the beneficial owner’s account. Unless otherwise indicated in the footnotes to this table and subject to community property laws where applicable, we believe that each stockholder named in this table has sole voting and investment power with respect to the shares indicated as beneficially owned. |
| (2) | Class A Shares of CHC Cayman held by Horizon Alpha Limited may also be deemed to be beneficially owned by the following entities and persons: (i) First Reserve Fund XII, L.P. (“FR Fund XII”), FR XII–A Parallel Vehicle, L.P. (“Parallel LP”) and FR Horizon AIV, L.P. (“FR Horizon AIV LP”), which collectively own all of the equity in Horizon Alpha Limited; (ii) First Reserve GP XII, L.P., the general partner of FR Fund XII and Parallel LP; (iii) First Reserve GP XII Limited, the general partner of First Reserve GP XII, L.P.; (iv) FR Horizon GP, L.P., the general partner of FR Horizon AIV LP; and (v) FR Horizon GP Limited, the general partner of FR Horizon GP, L.P. The address of each of the persons mentioned in this paragraph is c/o First Reserve Corporation, One Lafayette Place, Greenwich, Connecticut 06830. |
74
Table of Contents
| (3) | Class A Shares of CHC Cayman held by FR XI Horizon Co-Investment I, L.P. (“FR XI Co-Investment I LP”) may also be deemed beneficially owned by FR Horizon GP Limited, the general partner of FR XI Co-Investment I LP. Class A Shares of CHC Cayman held by FR XI Horizon Co-Investment II, L.P. (“FR XI Co-Investment II LP”) may also be deemed beneficially owned by FR Horizon GP Limited, the general partner of FR XI Co-Investment II LP. The address of each of the persons mentioned in this paragraph is c/o First Reserve Corporation, One Lafayette Place, Greenwich, Connecticut 06830. |
| (4) | Decisions with respect to voting and investments are made by William E. Macaulay, Alex T. Krueger, Timothy H. Day and Kenneth W. Moore, who are the voting members of the investment committee of First Reserve GP XII Limited and FR Horizon GP Limited, and are all Managing Directors of First Reserve GP XII Limited and FR Horizon GP Limited. All of them disclaim beneficial ownership of any shares of CHC Cayman’s equity securities owned by such entities or their affiliates (including FR Fund XII, Parallel LP, FR Horizon AIV LP, FR XI Co-Investment I LP and FR XI Co-Investment II LP). With respect to investments held by these entities, decisions with respect to operations oversight are made by the officers that work most closely on a given investment, which includes Messrs. John Mogford, Kenneth W. Moore, and Dod E. Wales in the case of CHC Cayman. |
| (5) | Mr. Wales is a non-executive Director of First Reserve GP XII Limited and FR Horizon GP Limited and Mr. Schneider is the Controller of First Reserve GP XII Limited and FR Horizon GP Limited. Messrs. Schneider and Wales disclaim beneficial ownership of any shares of CHC Cayman’s equity securities owned by such entity or its affiliates (including FR Fund XII, Parallel LP, FR Horizon AIV LP, FR XI Co-Investment I LP and FR XI Co-Investment II LP). |
| (6) | Includes 33,010 vested Restricted Stock Units. |
| (7) | Includes 16,505 vested Restricted Stock Units. |
| (8) | Includes 66,020 vested Restricted Stock Units. |
| (9) | Includes 16,505 vested Restricted Stock Units. |
| (10) | Includes 132,040 vested Restricted Stock Units. |
| (11) | Includes 33,010 vested Restricted Stock Units. |
Please see Item 5 “Market for registrant’s common equity, related stockholder matters and issuer purchases of equity securities—Equity Compensation Plan Information” for information regarding our securities authorized for issuance under equity compensation plans.
| Item 13. | Certain relationships and related transactions, and director independence |
Management Shareholders Agreement
All members of our management who own shares of CHC Cayman common stock are parties to a Management Shareholders Agreement, dated September 16, 2008, among CHC Cayman and such members of CHC Cayman’s management (the “Management Shareholders Agreement”). The Management Shareholders Agreement imposes significant restrictions on transfers of shares of CHC Cayman common stock held by management.
The Management Shareholders Agreement provides that if the management shareholder is no longer employed by or providing services to CHC Cayman or an affiliate of CHC Cayman, CHC Cayman or an affiliate of CHC Cayman has the right (but not the obligation) to purchase all or a portion of the shares of CHC Cayman common stock held by such management shareholder, including those that have been received upon the exercise of stock options, at a purchase price equal to their Fair Value (as defined in the Management Shareholders Agreement); provided, however, that such repurchase right with respect to shares received upon exercise of stock options only applies on or prior to the Final Exit Event (as defined in the Management Shareholders Agreement). In addition, the Management Shareholders Agreement provides that, if the management shareholder’s employment or service with CHC Cayman or an affiliate of CHC Cayman terminates due to death or disability, such management shareholder (or his or her legal representative or estate) may, for the period of one year, exercise his or her right to sell his or her vested Special Shares or shares of CHC Cayman common stock to CHC Cayman or an affiliate of CHC Cayman, and CHC Cayman or such affiliate will required to repurchase such shares, at a purchase price equal to the Fair Value of such shares as of the termination date.
The management shareholders who are not subject to a written employment, consulting or similar agreement that contains restrictive covenants are subject to the following covenants: (1) a covenant not to disclose confidential information while employed and at all times thereafter; (2) a covenant not to compete while employed or for a period of 12 months following his or her termination of employment; and (3) a covenant not to solicit employees or customers while employed or for a period of 12 months following his or her termination of employment. In the event a management shareholder materially breaches any of the foregoing restrictive covenants, in addition to other remedies that may be available to CHC Cayman, the management shareholder is required to pay to CHC Cayman the lesser of (i) the aggregate of any amounts actually paid to the management shareholder by CHC Cayman in respect of any exercise, purchase or repurchase by CHC Cayman of stock options or shares received upon exercise of stock options and (ii) an amount equal to the financial loss caused to CHC Cayman or any of its affiliates by the management shareholder’s material breach.
75
Table of Contents
Transactions with Shareholders
During the years ended April 30, 2012 and April 30, 2011, the Company entered into operating lease agreements to lease aircraft from certain variable interest entities (“VIEs”) related to the Company’s indirect shareholder, CHC Cayman. The operating lease payments to these related party lessors were $28.8 million and $20.5 million for the fiscal year ended April 30, 2012 and the fiscal year ended April 30, 2011, respectively.
The lessor VIEs are considered related parties because they are partially financed through equity contributions from entities that have also invested in the Company.
During the year ended April 30, 2009, the Company provided a short-term non-interest bearing loan for $7.8 million to a shareholder of CHC Cayman. This amount was recorded in receivables, net of allowance for doubtful accounts. During the year ended April 30, 2010, this loan was extinguished as part of the redemption of ordinary shares by the shareholder.
Transactions with a Company Previously Subject to Significant Influence
In the course of its regular business activities, the Company entered into routine transactions with Aero Contractors Company of Nigeria Limited (“ACN”). During the year ended April 30, 2010, the Company agreed to convert $30.0 million of the trade receivable balance due from ACN into a term loan. On July 1, 2010, the Company entered into a term loan agreement with ACN to forgive $15.0 million of the trade receivable balance, which reduced the outstanding indebtedness owed by ACN to the Company from $27.5 million to $12.5 million. Under the new agreement, the term loan is non-interest bearing until the occurrence of an event of default. The loan is repayable in monthly installments commencing July 31, 2012.
On July 1, 2010, the Company sold its interests in ACN for consideration of 1 Nigerian naira and ACN ceased to be a related party of the Company. Prior to the sale of the Company’s interests in ACN, the Company earned $9.4 million in revenues in the course of regular business activities (April 30, 2010—$60.7 million). These transactions were measured at the amounts exchanged, which is the amount of consideration determined and agreed to by the related parties. All outstanding balances due from ACN were fully provided.
Policy and Procedures with Respect to Related Person Transactions
The Board of Directors has not adopted a formal written policy for the review and approval of transactions with related persons. However, all such transactions will be reviewed by the Board on an as-needed basis.
Director Independence
As a privately held company, the board is not required to have a majority of its directors be independent. We believe that Messrs. Dejans, Brekelmans and Schut would be deemed independent directors according to the independence definition promulgated under the New York Stock Exchange listing standards.
| Item 14. | Principal accounting fees and services |
The table below sets forth the aggregate fees billed to us for audit and tax services provided by Ernst & Young LLP to us during the fiscal years ended April 30, 2012 and April 30, 2011.
| Fiscal 2012 | Fiscal 2011 | |||||||
| (in thousands) | ||||||||
| Audit fees |
$ | 4,322 | $ | 5,063 | ||||
| Audit related fees |
90 | 166 | ||||||
| Tax fees |
170 | 66 | ||||||
| Other |
3 | — | ||||||
|
|
|
|
|
|||||
| Total |
$ | 4,585 | $ | 5,295 | ||||
Audit fees relate primarily to costs associated with the annual audit, including reviews of the Company’s quarterly reports and statutory audits required internationally, auditor involvement with registration statements and financing documents, tax and accounting consultation services directly related to the audit.
Audit-related fees primarily included costs associated with the audit of employee pension plans and certain other agreements.
Tax fees included tax compliance, tax advice and tax planning.
76
Table of Contents
The Audit Committee is responsible for appointing, setting compensation for and overseeing the work of the Company’s independent accountant. The Audit Committee has established a policy requiring its pre-approval of all audit and permissible non-audit services provided by the independent accountant and has approved all such services.
The Audit Committee will not grant approval for any services prohibited by applicable regulatory or stock exchange requirement. In addition, in determining whether to grant pre-approval of any non-audit services, the Audit Committee will consider all relevant facts and circumstances.
| Item 15. | Exhibit and Financial Statement Schedules |
(a) The following documents are filed as part of or are included in this Annual Report on Form 10-K:
| 1. | Financial Statements |
See Index to Consolidated Financial Statements on page F-1 of this Annual Report on Form 10-K.
| 2. | Financial Statement Schedules |
Schedule II—Valuation and qualifying accounts was omitted as the required disclosures are included in Note 12 to the Consolidated Financial Statements.
All other schedules are omitted since the information required is not applicable or is shown in the Consolidated Financial Statements or notes thereto
| 3. | List of Exhibits |
The Exhibits filed as part of this Annual Report on Form 10-K, or incorporated by reference, are listed on the Exhibit Index immediately preceding such Exhibits, which Exhibit Index is incorporated herein by reference.
77
Table of Contents
Pursuant to the requirements of Section 13 or 15(d) of the Securities Exchange Act of 1934, the Registrant has duly caused this report to be signed on its behalf by the undersigned, thereunto duly authorized.
| CHC Helicopter S.A. | ||||||
| (Registrant) | ||||||
| July 10, 2012 | By: | /s/ William Amelio | ||||
| William Amelio | ||||||
| Chief Executive Officer of Heli-One Canada, Inc.* | ||||||
SIGNATURE AND POWER OF ATTORNEY
Each person whose signature appears below hereby constitutes and appoints Russ Hill and Mike O’Neill and each of them, with full power of substitution and resubstitution and full power to act without the other, as his or her true and lawful attorney-in-fact and agent to act in his or her name, place and stead and to execute in the name and on behalf of each person, individually and in each capacity stated below, and to file any and all amendments to this Annual Report on Form 10-K, and to file the same, with all exhibits thereto, and other documents in connection therewith, with the Securities and Exchange Commission, granting unto said attorneys-in-fact and agents, and each of them, full power and authority to do and perform each and every act and thing, ratifying and confirming all that said attorneys-in-fact and agents or any of them or their or his substitute or substitutes may lawfully do or cause to be done by virtue thereof.
Pursuant to the requirements of the Securities Exchange Act of 1934, this report has been signed below by the following persons on behalf of the Registrant and in the capacities and on the dates indicated.
| Signature | Title | Date | ||
| /s/ William Amelio William Amelio |
Chief Executive Officer of Heli-One Canada, Inc.* (Principal Executive Officer) |
July 10, 2012 | ||
| /s/ Joan Schweikart Hooper Joan Schweikart Hooper |
Senior Vice President and Chief Financial Officer of Heli-One Canada, Inc.* and A Director (Principal Financial Officer) |
July 10, 2012 | ||
| /s/ Rebecca Camden Rebecca Camden |
Vice President and Chief Accounting Officer of Heli-One Canada, Inc.* (Principal Accounting Officer) |
July 10, 2012 | ||
| /s/ Richard Brekelmans Richard Brekelmans |
B Director | July 10, 2012 | ||
| /s/ Johan Dejans Johan Dejans |
B Director | July 10, 2012 | ||
| * | CHC Helicopter S.A. has entered into an agreement with its wholly owned subsidiary, Heli-One Canada Inc., to provide certain management services subject to the authority limits as determined by CHC Helicopter S.A.’s board of directors and set out in such agreement. |
Table of Contents
EXHIBIT INDEX
| Exhibit Number |
Description | |
| 3.1# |
CHC Helicopter S.A., Articles of Association, dated January 4, 2012. | |
| 3.2# |
6922767 Holding S.à r.l, Articles of Association, dated September 9, 2010. | |
| 3.3# |
Capital Aviation Services B.V., Amended Articles of Association, dated December 24, 2003. | |
| 3.4# |
CHC Capital (Barbados) Limited, Certificate of Incorporation, dated January 23, 2004. | |
| 3.5# |
CHC Capital (Barbados) Limited, Bylaws, undated. | |
| 3.6# |
CHC Den Helder B.V., Amended Articles of Association, dated July 15, 2009. | |
| 3.7# |
CHC Global Operations (2008) Inc., Certificate of Incorporation, dated June 16, 2003. | |
| 3.8# |
CHC Global Operations (2008) Inc., Bylaws, dated December 13, 2007. | |
| 3.9# |
CHC Global Operations International Inc., Certificate of Incorporation, dated May 15, 2008. | |
| 3.10# |
CHC Global Operations International Inc., Bylaws, dated May 15, 2008. | |
| 3.11# |
CHC Helicopter Holding S.à r.l, Articles of Association, dated September 21, 2010. | |
| 3.12# |
CHC Helicopters (Barbados) Limited, Amended Articles of Incorporation, dated April 2, 2002. | |
| 3.13# |
CHC Helicopters (Barbados) Limited, Bylaws, dated July 11, 1995. | |
| 3.14# |
CHC Holding NL B.V., Deed of Incorporation, dated July 7, 2008. | |
| 3.15# |
CHC Holding (UK) Limited, Certificate of Incorporation, dated November 3, 2008. | |
| 3.16# |
CHC Holding (UK) Limited, Amended Memorandum of Association, dated November 3, 2008, and Amended Articles of Association, dated March 16, 1995. | |
| 3.17# |
CHC Hoofddorp B.V., Deed of Incorporation, dated July 17, 2007. | |
| 3.18# |
CHC Netherlands B.V., Amended Articles of Association, dated March 16, 2004. | |
| 3.19# |
CHC Norway Acquisition Co. AS, Certificate of Registration, dated September 17, 2008. | |
| 3.20# |
CHC Norway Acquisition Co. AS, Articles of Association, dated August 6, 2007. | |
| 3.21# |
CHC Sweden AB, Certificate of Registration, dated October 24, 2002. | |
| 3.22# |
CHC Sweden AB, Articles of Association and Rules of Procedure, dated December 16, 2003. | |
| 3.23# |
Helicopter Services Group AS, Articles of Association, dated October 23, 2008. | |
| 3.24# |
Helicopter Services Group AS, Certificate of Registration, dated February 20, 1956. | |
| 3.25# |
Helikopter Service AS, Certificate of Registration, dated April 4, 1994. | |
| 3.26# |
Helikopter Service AS, Articles of Association, dated May 27, 2009. | |
| 3.27# |
Heli-One Canada Inc., Certificate of Amalgamation, dated September 17, 2008. | |
Table of Contents
| 3.28# |
Heli-One Canada Inc., Bylaws, dated January 24, 2011. | |
| 3.29# |
Heli-One Defence B.V., Amended Articles of Association, dated September 1, 2006. | |
| 3.30# |
Heli-One Holdings (UK) Limited, Certificate of Incorporation, dated August 21, 2008. | |
| 3.31# |
Heli-One Holdings (UK) Limited, Memorandum of Association and Articles of Association, dated August 21, 2008. | |
| 3.32# |
Heli-One (Europe) AS, Amended Articles of Association, dated September 8, 2008. | |
| 3.33# |
Heli-One (Europe) AS, Certificate of Registration, dated March 5, 1999. | |
| 3.34# |
Heli-One Leasing Inc., Certificate of Incorporation, dated June 30, 2008. | |
| 3.35# |
Heli-One Leasing Inc., Bylaws, dated June 30, 2008. | |
| 3.36# |
Heli-One Leasing (Norway) AS, Amended Articles of Association, dated October 16, 2008. | |
| 3.37# |
Heli-One Leasing (Norway) AS, Certificate of Registration, dated January 31, 1970. | |
| 3.38# |
Heli-One (Norway) AS, Amended Articles of Association, dated October 30, 2008. | |
| 3.39# |
Heli-One (Norway) AS, Certificate of Registration, dated June 15, 2000. | |
| 3.40# |
Heli-One (Netherlands) B.V., Amended Articles of Association, dated September 19, 2005. | |
| 3.41# |
Heli-One (UK) Limited, Amended Certificate of Incorporation and Memorandum of Association, dated January 19, 2006. | |
| 3.42# |
Heli-One (UK) Limited, Amended Articles of Association, dated March 31, 1993. | |
| 3.43# |
Heli-One (US) Inc., Certificate of Incorporation, dated November 8, 2006. | |
| 3.44# |
Heli-One (US) Inc., Bylaws, dated November 8, 2006. | |
| 3.45# |
Heli-One USA Inc., Amended Articles of Incorporation, dated May 7, 2007. | |
| 3.46# |
Heli-One USA Inc., Bylaws, dated December 1, 1989. | |
| 3.47# |
Heliworld Leasing Limited, Certificate of Incorporation, dated April 26, 2002. | |
| 3.48# |
Heliworld Leasing Limited, Memorandum of Association and Articles of Association, dated April 10, 2002. | |
| 3.49# |
CHC Leasing (Ireland) Limited, Certificate of Incorporation, dated November 1, 2010. | |
| 3.50# |
CHC Leasing (Ireland) Limited, Memorandum of Association and Articles of Association, dated October 26, 2010. | |
| 3.51# |
Integra Leasing AS, Articles of Association, dated October 16, 2008. | |
| 3.52# |
Integra Leasing AS, Certificate of Registration, dated November 30, 1992. | |
| 3.53# |
Lloyd Bass Strait Helicopters Pty. Ltd., Certificate of Registration, dated June 26, 2000. | |
| 3.54# |
Lloyd Bass Strait Helicopters Pty. Ltd., Constitution, dated October 28, 2008. | |
| 3.55# |
Lloyd Helicopters International Pty. Ltd. In its own capacity and as trustee of the Australian Helicopters Trust, Indenture Establishing the Australian Helicopter Trust, dated April 6, 1993. | |
Table of Contents
| 3.56# |
Lloyd Helicopters International Pty. Ltd. In its own capacity and as trustee of the Australian Helicopters Trust, Certificate of Registration and Constitution of Lloyd Helicopters International Pty. Ltd., dated October 28, 2008. | |
| 3.57# |
Lloyd Helicopters Pty. Ltd., Certificate of Registration, dated June 26, 2000. | |
| 3.58# |
Lloyd Helicopters Pty. Ltd., Constitution, dated October 28, 2008. | |
| 3.59# |
Lloyd Helicopter Services Limited, Certificate of Incorporation and Memorandum of Association, dated December 12, 1997. | |
| 3.60# |
Lloyd Helicopter Services Limited, Articles of Association, dated January 4, 1998. | |
| 3.61# |
Lloyd Helicopter Services Pty. Ltd., Certificate of Registration, dated December 10, 1992. | |
| 3.62# |
Lloyd Helicopter Services Pty. Ltd., Constitution, dated October 28, 2008. | |
| 3.63# |
Lloyd Offshore Helicopters Pty. Ltd., Certificate of Registration, dated June 26, 2000. | |
| 3.64# |
Lloyd Offshore Helicopters Pty. Ltd., Constitution, dated October 28, 2008. | |
| 3.65# |
Management Aviation Limited, Certificate of Incorporation, dated October 1, 1984. | |
| 3.66# |
Management Aviation Limited, Memorandum of Association and Articles of Association, dated October 31, 1994. | |
| 3.67# |
North Denes Aerodrome Limited, Certificate of Incorporation, dated January 7, 1971. | |
| 3.68# |
North Denes Aerodrome Limited, Memorandum of Association and Articles of Association, dated October 31, 1994. | |
| 3.69(1) |
CHC Global Operations Canada (2008) Inc., Certificate of Incorporation, dated April 8, 2008. | |
| 3.70(1) |
CHC Global Operations Canada (2008) Inc., Bylaws, dated April 8, 2008. | |
| 4.1# |
Indenture, dated as of October 4, 2010, among CHC Helicopter S.A., the Guarantors named therein, HSBC Corporate Trustee Company (UK) Limited, as Collateral Agent, and The Bank of New York Mellon, as Trustee, governing the 9.250% Senior Secured Notes due 2020. | |
| 4.2# |
Form of 9.250% Senior Secured Notes due 2020 (included in Exhibit 4.1) | |
| 4.3# |
Registration Rights Agreement, dated as of October 4, 2010, by and among CHC Helicopter S.A., the Guarantors named therein, Morgan Stanley & Co. Incorporated, HSBC Securities (USA) Inc., RBC Capital Markets Corporation and UBS Securities LLC. | |
| 4.4# |
Collateral Agent and Administrative Agent Appointment Deed, dated October 4, 2010, among HSBC Bank plc, as Administrative Agent, The Bank of New York Mellon, as Notes Trustee, the Grantors identified therein, the Lenders identified therein, the Arrangers identified therein, and HSBC Corporate Trust Company (UK) Limited, as Collateral Agent. | |
| 4.5(1) |
First Supplemental Indenture, dated as of February 20, 2012, among CHC Global Operations Canada (2008) Inc., CHC Helicopter S.A., the Guarantors named therein, HSBC Corporate Trustee Company (UK) Limited, as Collateral Agent, and The Bank of New York Mellon, as Trustee, governing the 9.250% Senior Secured Notes due 2020. | |
| 4.6(3) |
Intercreditor Agreement, dated as of October 4, 2010, among CHC Helicopter S.A., the other Grantors party thereto, HSBC Corporate Trustee Company (UK) Limited, as Initial Collateral Agent, HSBC Bank plc, as Administrative Agent, The Bank of New York Mellon, as Indenture Trustee, and each Additional Collateral Agent from time to time party thereto. | |
Table of Contents
| 10.1# |
Credit Agreement, dated as of October 4, 2010, by, among others, 6922767 Holding S.à r.l., CHC Helicopter Holding S.à r.l., CHC Helicopter S.A., HSBC Bank plc, as Administrative Agent, HSBC Corporate Trustee Company (UK) Limited, as Collateral Agent and Morgan Stanley Senior Funding, Inc., HSBC Securities (USA) Inc., RBC Capital Markets Corporation and UBS Securities LLC, as Joint Lead Arrangers and Joint Bookrunners. | |
| 10.2# |
Guarantee, dated and effective as of October 4, 2010, by each of the signatories thereto and each of the other entities that becomes a party thereto, in favor of HSBC Bank plc, as Administrative Agent, for the benefit of the Secured Parties. | |
| 10.3†(2) |
Contract for the Supply of Sixteen EC225 Helicopters and Ten Optional EC255 Helicopters with Related Services, dated as of March 1, 2007, between Eurocopter S.A.S. and Heli-One, a division of CHC Helicopters International Inc. | |
| 10.4†(2) |
Sale Purchase Agreement for the Supply of Twenty Firm EC225 Helicopters and Four Optional EC255 Helicopters with Related Services, dated as of September 13, 2011, between Eurocopter S.A.S. and CHC Leasing (Ireland) Limited | |
| 10.5†(2) |
Framework Agreement, dated as of October 31, 2007, between Augusta S.p.A. and CHC Helicopters International Inc. | |
| 10.6#* |
2011 Management Equity Plan of 6922767 Holding (Cayman) Inc. | |
| 10.7#* |
Form of 2011 Option Agreement of 6922767 Holding (Cayman) Inc. | |
| 10.8#* |
Form of 2011 Restricted Share Unit Grant Agreement of 6922767 Holding (Cayman) Inc. | |
| 10.9#* |
Form of 2011 Subscription Agreement of 6922767 Holding (Cayman) Inc. | |
| 10.10#* |
2008 Share Incentive Plan of 6922767 Holding (Cayman) Inc., adopted September 16, 2008 | |
| 10.11#* |
Form of 2008 Option Agreement of 6922767 Holding (Cayman) Inc. | |
| 10.12#* |
Form of 2008 Option Rollover Agreement of 6922767 Holding (Cayman) Inc. | |
| 10.13#* |
Form of 2008 Special A Share Subscription Agreement of 6922767 Holding (Cayman) Inc. | |
| 10.14#* |
Form of 2008 Subscription Agreement of 6922767 Holding (Cayman) Inc. | |
| 10.15#* |
Management Shareholders Agreement among 6922767 Holding (Cayman) Inc. and Management Shareholders of 6922767 Holding (Cayman) Inc., dated as of September 16, 2008 | |
| 10.16#* |
Employment Agreement between Heli-One Canada Inc. and William J. Amelio, dated July 15, 2010 | |
| 10.17#* |
Employment Agreement of CHC Global Operations (2008) Inc. and Christine Baird, dated September 16, 2008 | |
| 10.18#* |
Employment Agreement between Heli-One Canada Inc. and Neil Calvert, dated September 16, 2008 | |
| 10.19#* |
Employment Agreement between Heli-One Canada Inc. and Rick Davis, dated September 16, 2008 | |
| 10.20#* |
Employment Agreement between EEA Helicopter Operations B.V. and Tilmann Gabriel, dated October 30, 2009 | |
| 10.21#* |
Employment Agreement between Heli-One American Support, LLC and Joan Hooper, dated September 26, 2011 | |
Table of Contents
| 10.22#* |
Employment Agreement between Heli-One American Support and Michael O’Neill, dated February 2, 2011 | |
| 10.23#* |
Amended and Restated Employment Agreement between Heli-One American Support, LLC and Michael Summers, dated January 5, 2012 | |
| 10.24#* |
Amended and Restated Supplemental Retirement Plan Agreement between CHC Helicopters International Inc. and Christine Baird, dated April 30, 2011 | |
| 10.25#* |
Retirement Compensation Arrangement Trust Agreement among Heli-One Canada Inc., Royal Trust Corporation of Canada and Christine Baird, dated March 1, 2011 | |
| 10.26#* |
Retirement Compensation Arrangement Trust Agreement among Heli-One Canada Inc., Royal Trust Corporation of Canada and Neil Calvert, dated October, 2011 | |
| 10.27#* |
Amended and Restated Supplemental Retirement Plan Agreement between CHC Helicopters International Inc. and Neil Calvert April 30, 2007 | |
| 10.28#* |
Supplemental Retirement Plan Agreement between CHC Helicopters International Inc. and Rick Davis, dated October 12, 2006 | |
| 10.29#* |
Retirement Compensation Arrangement Trust Agreement among Heli-One Canada Inc., Royal Trust Corporation of Canada and Rick Davis, dated October, 2011 | |
| 10.30#* |
Agreement Regarding Termination of Employment and Consulting Agreement between Heli-One Canada Inc. and Christine Baird, dated February 8, 2011 | |
| 10.31#* |
Agreement Regarding Termination of Employment and Consulting Agreement between Heli-One Canada Inc. and Neil Calvert, dated April 29, 2011 | |
| 10.32#* |
Agreement Regarding Termination of Employment between Heli-One Canada Inc. and Rick Davis, dated August 18, 2011 | |
| 10.33#* |
Consulting Agreement between Heli-One Canada Inc. and Rick Davis, dated August 8, 2011 | |
| 10.34#* |
Compromise Agreement between EEA Helicopter Operations B.V. and Tilmann Gabriel, dated April 5, 2011 | |
| 10.35#* |
Offer Letter of Heli-One American Support, LLC to Michael Summers, dated April 11, 2011 | |
| 10.36+* |
Employment Agreement between Heli-One American Support LLC and John Graber, dated July 18, 2011. | |
| 12.1+ |
Computation of Ratio of Earnings to Fixed Charges. | |
| 18.1+ |
Letter of Independent Registered Public Accounting Firm Regarding Change in Accounting Principle. | |
| 21.1+ |
Schedule of Subsidiaries of 6922767 Holding S.à r.l. | |
| 31.1+ |
Certification Pursuant to Section 302 of the Sarbanes-Oxley Act of 2002 | |
| 31.2+ |
Certification Pursuant to Section 302 of the Sarbanes-Oxley Act of 2002 | |
| 32.1+ |
Certification Pursuant to 18 U.S.C. Section 1350 as Adopted Pursuant to Section 906 of the Sarbanes-Oxley Act of 2002 | |
| 32.2+ |
Certification Pursuant to 18 U.S.C. Section 1350 as Adopted Pursuant to Section 906 of the Sarbanes-Oxley Act of 2002 | |
Table of Contents
| * | Constitutes management contract or compensatory contract |
| + | Filed herewith |
| † | Confidential information has been omitted from this exhibit and filed separately with the SEC pursuant to a confidential treatment request under Rule 406. |
| # | Filed on January 18, 2012 as an exhibit to our Registration Statement on Form S-4 and incorporated herein by reference. |
| (1) | Filed on March 28, 2012 as an exhibit to Amendment No. 1 to our Registration Statement on Form S-4/A and incorporated herein by reference. |
| (2) | Filed on April 19, 2012 as an exhibit to Amendment No. 2 to our Registration Statement on Form S-4/A and incorporated herein by reference |
| (3) | Filed on May 9, 2012 as an exhibit to Amendment No. 3 to our Registration Statement on Form S-4/A and incorporated herein by reference |