Attached files
| file | filename |
|---|---|
| 8-K - 8-K - Zep Inc. | a12-16036_18k.htm |
| EX-99.1 - EX-99.1 - Zep Inc. | a12-16036_1ex99d1.htm |
Exhibit 99.2
|
|
Zep Third Quarter Fiscal 2012 Earnings Conference Call July 10, 2012 John K. Morgan Chairman, President and Chief Executive Officer Mark R. Bachmann Executive Vice President and Chief Financial Officer |

|
|
Agenda Third Quarter Overview Detailed Financial Performance Questions and Answers 2 © 2012 Zep Inc. - All rights reserved. |
|
|
Safe Harbor This presentation and our commentary contain forward-looking statements within the meaning of the Private Securities Litigation Reform Act of 1995. Specifically, forward-looking statements include, but are not limited to, statements relating to our future economic performance, business prospects, revenue, income, and financial condition; and statements preceded by, followed by, or that include the words "expects," "believes," "intends," "will," "anticipates," and similar terms that relate to future events, performance, or our results. Examples of forward-looking statements in this presentation and our commentary include but are not limited to: statements regarding the economic environment and the impact this environment has had or could have on our current and/or future financial results; statements regarding our expectations for pricing actions and gross margin performance; statements regarding benefits that we may realize from our acquisitions and our restructuring activities; statements regarding investments that may be made in the future to grow our business, either organically or otherwise, in accordance with our strategic plan, or that may be made for other purposes; and statements and related estimates concerning the benefits that the execution of our strategic initiatives are expected to have on future financial results. Our forward-looking statements are subject to certain risks and uncertainties that could cause actual results, expectations, or outcomes to differ materially from our historical experience as well as our present expectations or projections. These risks and uncertainties include, but are not limited to: economic conditions in general; customer and supplier relationships and prices; competition; ability to realize anticipated benefits from strategic planning initiatives and timing of benefits; market demand; and litigation and other contingent liabilities, such as environmental matters. A variety of other risks and uncertainties could cause our actual results to differ materially from the anticipated results or other expectations expressed in our forward-looking statements. A number of those risks are discussed in Part I, "Item 1A. Risk Factors" of our Annual Report on Form 10-K for the fiscal year ended August 31, 2011. We believe the forward-looking statements are reasonable;however, undue reliance should not be placed on any forward-looking statements, which are based on current expectations. Further, forward-looking statements speak only as of the date they are made, and we undertake no obligation to update publicly any of them in light of new information or future events. 3 © 2012 Zep Inc. - All rights reserved. |

|
|
Third Quarter Fiscal 2012 Overview |
|
|
Third Quarter 2012 Highlights Record Sales of $176.6 million, up 5.2% Organic sales grew 5.0% on a constant currency basis Record EBITDA of $18.7 million up, 23% Record EPS of $0.39 up 39% from $0.28 LY Gross profit rate improves; operating expense leverage 5 © 2012 Zep Inc. - All rights reserved. Remain Confident in Long Term Strategy |

|
|
Sales reflect strength in Retail and Distribution Zep Commercial gaining broader retail brand visibility Positioning Zep as “go to” provider in automotive aftermarket and vehicle wash Jan San/Industrial improving on increased customer penetration Third Quarter 2012 Overview 6 © 2012 Zep Inc. - All rights reserved. Strong Performance and Execution |
|
|
Zep Inc. Strategy Multi-Channel and Brand Approach Continue to Expand Market Access Drive Economies of Scale Focus on Organic Growth Goal to Position Zep as a Leader in Each Channel 7© 2012 Zep Inc. - All rights reserved. |

|
|
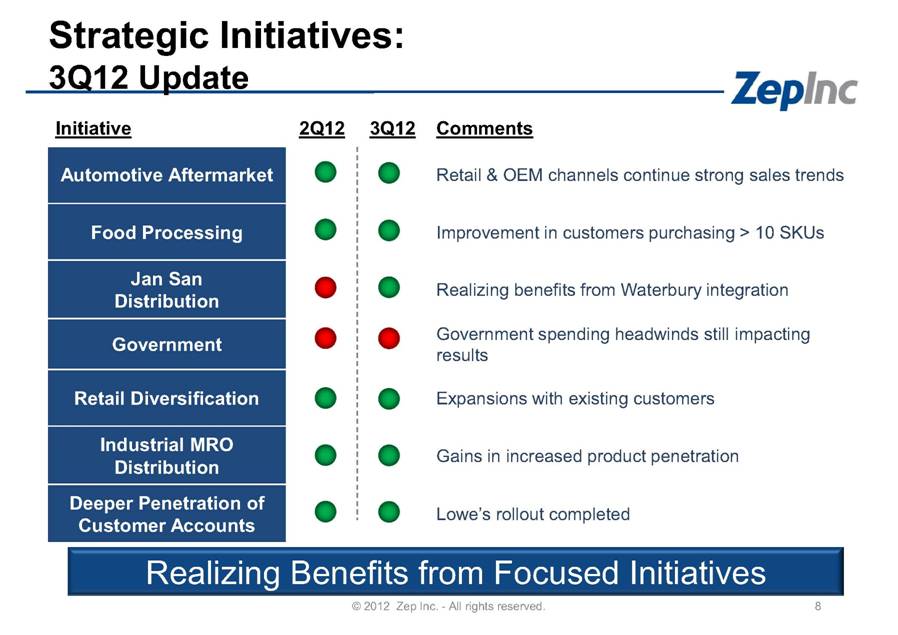
Strategic Initiatives: 3Q12 Update © 2012 Zep Inc. - All rights reserved. Initiative 2Q12 3Q12 Comments Automotive Aftermarket Retail & OEM channels continue strong sales trends Food Processing Improvement in customers purchasing > 10 SKUs Jan San Distribution Realizing benefits from Waterbury integration Government Government spending headwinds still impacting results Retail Diversification Expansions with existing customers Industrial MRO Distribution Gains in increased product penetration Deeper Penetration of Customer Accounts Realizing Benefits from Focused Initiatives Lowe’s rollout completed |
|
|
Business Groups Sales & Service Distribution Retail $4B Market 21% of Market 60% of Zep Sales - Small business, Gov’t $8.4B Market 44% of Market 22% of Zep Sales - Large national, and regional B2B distributors $6.8B Market 35% of Market 18% of Zep Sales - Focus on Pro in >5,000 retail stores Transportation Food Institutional Industrial Government Automotive OEM / Distributors Jan / San Industrial MRO Redistribution Home Improvement & Hardware Automotive Aftermarket Mass Merchandise Office Supplies Dollar/Discount 9 1 Information compiled by Zep Inc. based on research provided by Kline & Company and the Automotive Aftermarket Industry Association. © 2012 Zep Inc. - All rights reserved.End Markets(order of size) |

|
|
Strategic Investments Serving Customers the Way they Want to be Served 10 © 2012 Zep Inc. - All rights reserved. |
|
|
Detailed Financial Performance 11 |
|
|
$167.9 $4.2 $4.2 ($1.7) $2.0 $176.6 3Q11 Volume Price FX Acquisitions 3Q12 3Q12 Net Sales 12$ Millions © 2012 Zep Inc. -All rights reserved.Organic Sales Growth of 5% |
|
|
End Market S&S Distribution Retail Total % of $19B U.S. Market 21% 44% 35% Jan San / Institutional Automotive Aftermarket Industrial / MRO Vehicle Wash Food Processing Government and Schools 3Q12 North American Sales Trends –Channel and End-market Performance © 2012 Zep Inc. -All rights reserved. 13 Continued Improvement in End Market Performance |
|
|
46.7% (90bp) (10bp) 60bp 46.3% 3Q11 Business Mix Material Margin Mfg 3Q12 44.8% 120bp 50bp (20bp) 46.3% 2Q12 Mfg Material Margin Business Mix 3Q1214 3Q12 Gross Profit Margin © 2012 Zep Inc. -All rights reserved. Year-over-Year (40bp) Quarter-to-Quarter+150bp Continue to Expect FY12 GM Between 46% and 47% |

|
|
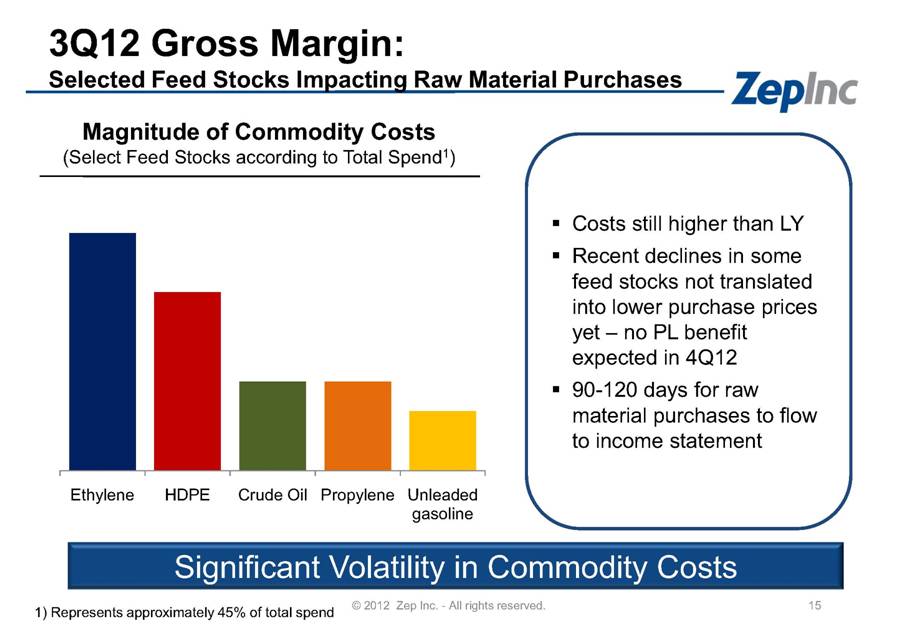
3Q12 Gross Margin: Selected Feed Stocks Impacting Raw Material Purchases © 2012 Zep Inc. - All rights reserved. Magnitude of Commodity Costs (Select Feed Stocks according to Total Spend1) Significant Volatility in Commodity Costs Costs still higher than LY Recent declines in some feed stocks not translated into lower purchase prices yet – no PL benefit expected in 4Q12 90-120 days for raw material purchases to flow to income statement 1) Represents approximately 45% of total spend Ethylene HDPE Crude Oil Propylene Unleaded gasoline |
|
|
9.0% (40bp) 200bp 10.6% 3Q11 Gross Margin Rate Op. Exp. Rate 3Q12 3Q12 Reported EBITDA Margin 16 © 2012 Zep Inc. - All rights reserved. Gross margin pressures y/y due to business mix Operating expenses lower due to business mix and reduced costs Record EBITDA Margins |
|
|
Costs Impacting 3Q12 Results 3Q12 California legal costs were $500,000 Expect 4Q12 legal costs for California lawsuit to range between $400,000 and $600,000 3Q12 corporate development costs were $300,000 for Mykal acquisition Expect corporate development costs in the future Last year’s 3Q diluted EPS included: – $0.02 per share related to acquisition and integration costs – $0.02 per share related to incremental legal expenses Corporate Development and Legal Costs to Continue 17 © 2012 Zep Inc. -All rights reserved. |
|
|
Cash Flow 3Q12 free cash flow generated was $8 million, vs. $12.6 million generated last year – Higher net income, offset by higher capital expenditures and working capital Net trade cycle improved by 9 days compared to LY $5.4 million in capital expenditures for 3Q12 –$3.4 million above last year, primarily for technology investments Now anticipate capital spending of $17 to $18 million in FY 2012 18 © 2012 Zep Inc. - All rights reserved. |
|
|
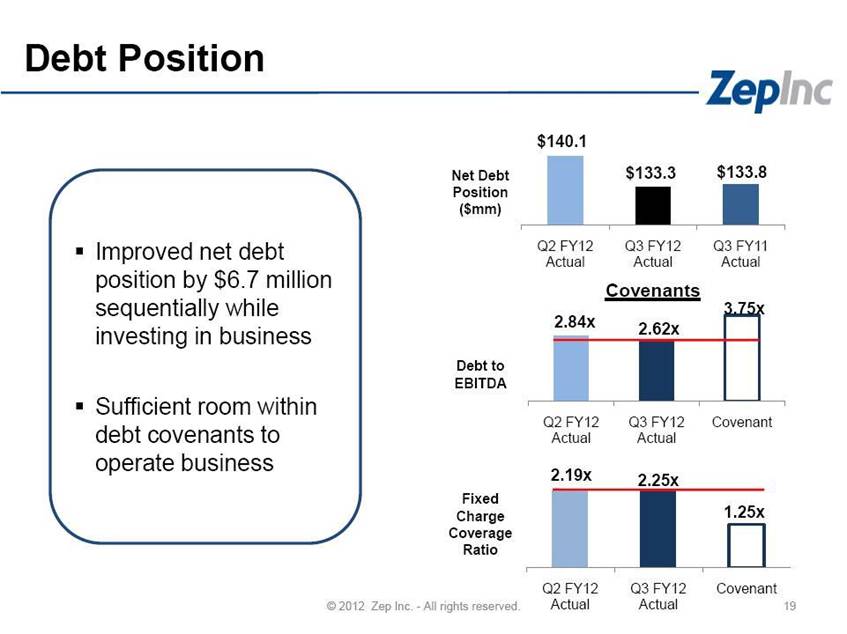
2.84x 2.62x 3.75x Q2 FY12 Actual Q3 FY12 Actual Covenant $140.1 $133.3 $133.8 Q2 FY12 Actual Q3 FY12 Actual Q3 FY11 Actual 2.19x 2.25x 1.25x Q2 FY12 Actual Q3 FY12 Actual Covenant Fixed Charge Coverage Ratio Debt to EBITDA Net Debt Position ($mm) Covenants Debt Position 19 © 2012 Zep Inc. - All rights reserved. Improved net debt position by $6.7 million sequentially while investing in business Sufficient room within debt covenants to operate business |
|
|
Long-Term Financial Objectives Revenue growth in excess of market growth Target of 50 bp annualized EBITDA margin improvement 11%-13% annualized EPS improvement Return on Invested Capital (ROIC) target of 15%+ 20 © 2012 Zep Inc. - All rights reserved. |
|
|
Fiscal 2012 Outlook 21 © 2012 Zep Inc. - All rights reserved. Expect second half to improve relative to LY Benefits from strategic growth initiatives Expect fourth quarter revenues to be below third quarter Assumes better relationship between selling prices and raw material input costs Confident in strategy despite inconsistent results quarter-to-quarter |

|
|
Questions and Answers |
