Attached files
| file | filename |
|---|---|
| 8-K - 8-K - LIONS GATE ENTERTAINMENT CORP /CN/ | a12-15787_18k.htm |
Exhibit 99.1
|
|
LIONSGATE® Investor Presentation July 2012 |
|
|
Special Notice Regarding Forward-Looking Statements 2 This presentation contains projections and forward-looking statements. Forward-looking statements typically can be identified by the use of forward-looking words, such as “may,” “will,” “could,” “project,” “believe,” “anticipate,” “expect,” “estimate,” “continue,” “potential,” “plan,” “intend,” “forecast,” "projection“ and the like. Actual results in the future could differ materially and adversely from those described in the forward-looking statements as a result of various important factors including the substantial investment of capital required to produce and market films and television series; increased costs for producing and marketing feature films; budget overruns; limitations imposed by Lionsgate’s credit facilities and other debt; unpredictability of the commercial success of Lionsgate’s motion pictures and television programming; the cost of defending Lionsgate’s intellectual property; difficulties in integrating acquired businesses, technological changes and other trends affecting the entertainment industry; and the risks and uncertainties described under the heading “Risk Factors” in Lionsgate’s Annual Report on Form 10-K for the fiscal year ended March 31, 2012, as filed with the Securities and Exchange Commission on May 30, 2012. Lionsgate undertakes no obligation to update publicly the information contained in this presentation, or any forward-looking statements, to reflect new information, events or circumstances after the date they were made, or to reflect the occurrence of unanticipated events. This presentation contains references to Lionsgate’s trademarks and service marks and to those belonging to other entities. Lionsgate does not intend its use or display of other companies’ trade names, trademarks or service marks to imply a relationship with, or endorsement or sponsorship of Lionsgate by, any other companies. Any other companies’ trade names, trademarks or service marks are the sole property of their respective owners. |
|
|
Recent Events at Lionsgate Acquired Summit Entertainment Producer of THE TWILIGHT SAGA franchise, whose first four films have grossed more than $2.5B1 at the worldwide box office THE TWILIGHT SAGA: BREAKING DAWN – PART 2 will be released November 16, 2012 Strengthened international presence with output deals around the world Acquisition financed primarily with Summit's own cash Refinanced existing term loan with a new $500M term loan Reduced loan to $299M in less than six months Launched THE HUNGER GAMES Franchise THE HUNGER GAMES, first of a franchise, is the 12th highest-grossing North American release of all time ($404M DBO1) Next installment, THE HUNGER GAMES: CATCHING FIRE, begins production in September 2012 for November 22, 2013 release 36.5M books of trilogy in print in U.S. Book sales accelerating internationally 3 1 Source: www.boxofficemojo.com |
|
|
Recent Events at Lionsgate (cont.) Debuted ANGER MANAGEMENT, starring Charlie Sheen, on FX Network Drew 5.5M viewers, most-watched series premiere in FX's history Second episode outperformed first (5.7M viewers) If first 10 episodes hit predetermined ratings targets, a follow-up order of 90 episodes will be automatically triggered Already sold in nine international territories for approximately $700K per episode Debt Reduction Initiatives Underway Calling certain series of 3.625% convertible notes ($23.5M held by third parties) Reviewing additional modifications to debt structure to achieve corporate deleveraging goals 4 |
|
|
Lionsgate Today Anticipate EBITDA of approximately $900M1 over next three years beginning April 1, 2012 Following Summit acquisition, feature film slate is positioned to generate more than a billion dollars at the North American box office in CY2012, with another billion dollars anticipated at the international box office Television business continues to grow and diversify with 23 shows on 16 networks 13,000+ title motion picture and TV library Partner in nine cable networks in U.S. and Asia Lionsgate U.K. self-distributes film, TV and home entertainment product; output deals in most other major international territories Innovator in content creation and distribution for digital platforms 5 Key Lines of Business Television Channels / Digital Home Entertainment / Managed Brands Library Film A Leading Content Creator And Distributor Capitalizing On Growth In Worldwide Consumption of Content Across Multiple Platforms 1 Please see Reconciliation of Non-GAAP Forward-Looking Measures in Appendix. |
|
|
Powerful Brand Portfolio 6 |

|
|
Go-forward slates are anchored by established franchises and strong brands with franchise potential THE HUNGER GAMES: CATCHING FIRE, THE HUNGER GAMES: MOCKINGJAY 1 & 2, THE TWILIGHT SAGA: BREAKING DAWN – PART 2, ENDER’S GAME Diversified portfolio of wide theatrical motion picture releases each year, balanced between in-house productions and acquisitions International presales typically cover more than 50% of production cost, mitigating risk YTD1 theatrical market share of 12%, ranking fourth among all studios2 66 Academy Award® nominations and 17 Oscar wins in the past 13 years 7 A Unique World-Class Film Business 1 YTD as of 6/24/12. 2 Source: Rentrak Branded, Franchise Properties Continue To Drive Growth |
|
|
Core Global Franchises 8 |
|
|
9 13,000+ Title Library Has Achieved Seven Straight Years of Growth World Class Library Of Films And Television Programming 13,000+ motion picture titles and television episodes Generated approximately $150 million in cash flow in FY2012 Library revenue contribution from digital/on-demand has increased from zero to 19% in past five years; reliance on packaged media revenues has decreased from 70% to 38% in same period Television and international sales have also meaningfully contributed to revenue growth over past five years Annual Reported Library Revenue ($ mm) 9% CAGR $416 $374 $371 $319 $296 $274 FY2007A FY2008A FY2009A FY2010A FY2011A FY2012A |
|
|
EPIX - Multiplatform Premium Entertainment Network 10 Generated approximately $75M in annual EBITDA for venture partners less than three years after launch Fastest growing premium network with nearly 10M subscribers Available in 32M homes through eight distribution partnerships Launching major marketing campaign tied to unique position as only pay network offering THE HUNGER GAMES and THE AVENGERS, two biggest blockbusters of 2012 to-date Technologically advanced pay TV network; partnership with Netflix broadens distribution footprint and makes EPIX an innovator in digital distribution Provides greater control of Lionsgate product in pay television window, allowing maximum flexibility for on-demand distribution EPIX Poised To Benefit From The Transition From Traditional To Digital Media Note: As of March 31, 2012, Lionsgate owned 31.2% of EPIX. |
|
|
11 TV business continues to build upon core competence of programming for cable networks (MAD MEN, WEEDS, NURSE JACKIE, BOSS) Entered broadcast network space with NASHVILLE for ABC in coveted Wednesday 10p time slot and NEXT CALLER for NBC Partnered with networks' respective studios on both series and producing in states with tax incentives to mitigate risk ANGER MANAGEMENT debuted with record 5.5M viewers on FX Network; unique 10+90 syndication business model accelerates path to syndication and creates upside in success 98 Emmy® nominations (19 Awards) and 26 Golden Globe nominations (6 Awards) over the past seven years Television Segment Revenue ($M) Note: Excludes EPIX and TV Guide. Television Overview 23 Television Series On 16 Different Networks 27% CAGR $397 $353 $351 $222 $211 $119 FY2007A FY2008A FY2009A FY2010A FY2011A FY2012A |
|
|
Mad Men Critically acclaimed series has won four consecutive Best Drama Emmy® awards Season 5 ratings exceeded the previous season by approximately 15% All seven seasons already licensed into syndication to Netflix Nurse Jackie Critically-acclaimed series Received two Emmy® nominations On path toward syndication -- fifth season ordered by Showtime Weeds One of Showtime’s most successful series with 8 seasons ordered Expected to generate over $150M in total home entertainment revenues over its lifetime 12 Television Production – Returning Series A Leading Producer And Supplier Of Popular And Critically Acclaimed Shows For Cable Networks Boss Riveting drama starring Kelsey Grammer, who won a Golden Globe for his first season performance Airing in second season on Starz |
|
|
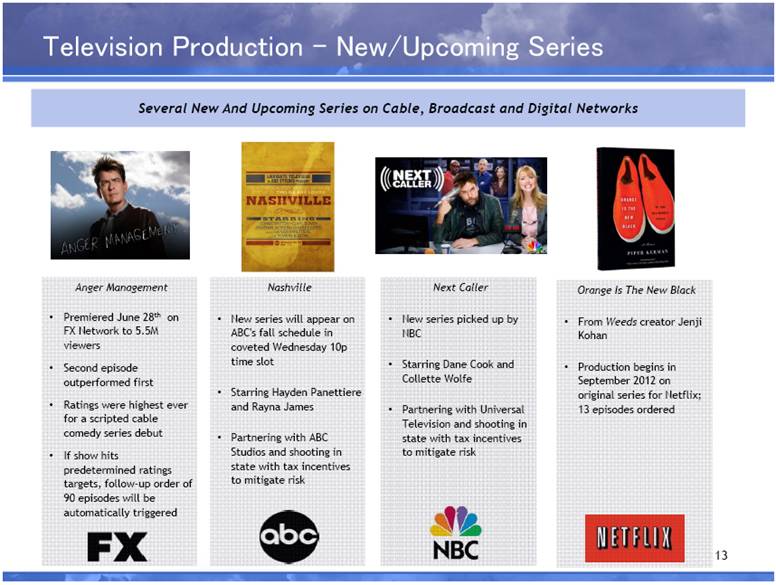
Next Caller New series picked up by NBC Starring Dane Cook and Collette Wolfe Partnering with Universal Television and shooting in state with tax incentives to mitigate risk Anger Management Premiered June 28th on FX Network to 5.5M viewers Second episode outperformed first Ratings were highest ever for a scripted cable comedy series debut If show hits predetermined ratings targets, follow-up order of 90 episodes will be automatically triggered 13 Television Production – New/Upcoming Series Several New And Upcoming Series on Cable, Broadcast and Digital Networks Orange Is The New Black From Weeds creator Jenji Kohan Production begins in September 2012 on original series for Netflix; 13 episodes ordered Nashville New series will appear on ABC's fall schedule in coveted Wednesday 10p time slot Starring Hayden Panettiere and Rayna James Partnering with ABC Studios and shooting in state with tax incentives to mitigate risk |
|
|
14 Lionsgate’s Debmar-Mercury syndication company is a successful distributor of first run sitcoms and popular syndicated television shows and is building a strong slate of talk shows Nearly 500 episodes of original syndicated sitcoms ordered to-date under innovative 10+90 business model with more in the pipeline House of Payne: 254 episodes Meet the Browns: 140 episodes Are We There Yet?: 100 episodes Anger Management: Record cable debut on FX on June 28th; strong interest also expected for Fall 2014 syndication window Creating vehicle for comedy star George Lopez using same model After three years in syndication, Wendy Williams talk show now profitable; positioned to become potential long-term annuity Television Syndication |
|
|
Channel, Digital and International Ventures 15 Nationally distributed cable network reaching approximately 81 million homes1 Transformed utility channel with navigation component into full screen entertainment channel across majority of distribution footprint (85% full screen expected by the end of CY 2012) A leading branded horror movie VOD service, linear cable network, and broadband offering Jointly owned by Sony, Comcast and Lionsgate A leading independent digital destination network targeting men aged 18-34 with online video and editorial content #1 distributor of online comedy videos2; operates 11th largest online entertainment network (ahead of People, Yahoo! Movies, Yahoo! TV, and TMZ)2; 75 million3 global monthly unique visitors throughout network; 2+ million mobile downloads Venture with Astro Networks and Saban Capital to target multi-billion Asia pay TV market Six channel brands, 13 platforms and growing distribution footprint throughout Southeast Asia Orchestrated Lionsgate content licensing deals with leading Asian VOD and Internet operators Note: As of March 31, 2012, Lionsgate owned 51.0% of TV Guide Network and TVGuide.com, 42.6% of Break Media, 16.0% of Celestial Tiger Entertainment, and 34.5% of FearNet. 1 Source: Nielsen as of May 2012. 2 Source: Comscore as of May 2012. 3 Source: Comscore as of December 2011. Our Channel And Digital Ventures Represent Substantial Asset Value |
|
|
66 Oscar Nominations 98 Emmy Nominations and 69 Golden Globe nominations 13,000+ Titles 5 Channels 1 Vision 16 Look What We’ve Built |
|
|
Appendix 17 |

|
|
Reconciliation of Non-GAAP Forward-Looking Measures 18 EBITDA is defined as earnings before interest, income tax provision, depreciation and amortization. EBITDA is a non-GAAP measure. A non-GAAP financial measure is a numerical measure of a company’s performance, financial position, or cash flow that either excludes or includes amounts that are not normally excluded or included in the most directly comparable measure calculated and presented in accordance with Generally Accepted Accounting Principles (“GAAP”). Presentation of EBITDA is a non-GAAP financial measure commonly used in the entertainment industry and by financial analysts and others who follow the industry to measure operating performance. The Company’s management believes EBITDA to be a meaningful indicator of the Company’s performance which provides useful information to investors regarding its financial condition and results of operations. While the Company’s management considers EBITDA to be an important measure of operating performance, it should be considered in addition to, but not as a substitute for, net income and cash flow from operating activities and other measures of financial performance reported in accordance with GAAP. Not all companies calculate EBITDA in the same manner and the measure as presented may not be comparable to similarly-titled measures presented by other companies. The following table sets forth a reconciliation of the forward looking projected EBITDA to net income for the three years from April 1, 2012 through March 31, 2015. ($000s) Three Years Ended March 31, 2015 EBITDA $900,000 Depreciation and Amortization (21,100) Contractual Cash Interest Expense * Noncash Interest Expense * Interest and Other Income 4,500 Income Tax Provision ** Net Income *** |
|
|
Reconciliation of Non-GAAP Forward-Looking Measures (cont.) 19 * Due to possible strategic alternatives available to the Company, the variability of the extent of the use of the Company’s cash flows to reduce its debt balances, and possible conversion of certain of its debt instruments, the Company’s debt balances may vary widely. In addition, some of the Company’s interest rates are variable. Accordingly, even though these amounts are currently anticipated to be significant, these interest amounts cannot be estimated without unreasonable effort. The Company’s interest expense for its year ended March 31, 2012 was approximately $78 million ($62.4 million was cash based interest and $15.7 million was amortization of debt discount (premium) and deferred financing costs) and with the addition of the Summit Entertainment term loan entered into in the fourth quarter of fiscal 2012, these amounts may increase in the Company’s fiscal year 2013 and then decrease as the Company pays off the term loan and other debt with excess cash flows. ** Due to the inherent difficulties in forecasting the timing of tax deductions and the use of the Company’s net operating loss (“NOL”) carry forwards in various jurisdictions, as well as the inability to forecast its interest charges, these amounts cannot be estimated without unreasonable effort. However, the Company does believe it will begin to pay taxes in fiscal 2014 and 2015 after the use of its NOL’s. *** Due to the amounts above which are not estimated, a net income estimate is not presented. Safe Harbor Statement The preceding forward-looking projection of EBITDA over the three years ended March 31, 2015 represents forward-looking statements and projections based on expectations, assumptions and estimates that the Company believes are reasonable given its assessment of historical trends and other information reasonably available as of May 31, 2012. Forward-looking statements can often be identified by words such as “expect” and “anticipate”. The amounts consists of projections only, and are subject to a wide range of known and unknown business risks and uncertainties, including those described in the Company’s Securities and Exchange Commission (“SEC”) filings referred to below, many of which are beyond the Company’s control. Forward-looking statements such as those contained above should not be regarded as representations by the Company that the projected results will be achieved. Projections and estimates are necessarily speculative in nature and actual results may vary materially from the outlook the Company provides today. The Company undertakes no obligation to publicly update or revise any forward-looking statements, including the forecasts set forth herein, except as required by law. The forecast set forth above should be read together with the Company’s Annual Report on Form 10-K for the year ended March 31, 2012 including the risks identified under “Item 1A. Risk Factors” and the Company’s other SEC filings. |
|
|
20 |