Attached files
| file | filename |
|---|---|
| 8-K - FORM 8-K - Vantage Drilling CO | d372633d8k.htm |
 Vantage Drilling Company
GHS 100 Energy Conference
San Francisco, California
June 25, 2012
Exhibit 99.1 |
 Some of the statements in this presentation constitute forward-looking
statements. Forward-looking statements relate to
expectations,
beliefs,
projections,
future
plans
and
strategies,
anticipated
events
or
trends
and
similar
expressions
concerning matters that are not historical facts. The forward looking
statements contained in this presentation involve risks and uncertainties as
well as statements as to: •
our limited operating history;
•
availability of investment opportunities;
•
general volatility of the market price of our securities;
•
changes in our business strategy;
•
our ability to consummate an appropriate investment opportunity within given time
constraints; •
availability of qualified personnel;
•
changes in our industry, interest rates, the debt securities markets or the
general economy; •
changes in governmental, tax and environmental regulations and similar
matters; •
changes in generally accepted accounting principles by standard-setting
bodies; and •
the degree and nature of our competition.
The forward-looking statements are based on our beliefs, assumptions and
expectations of our future performance, taking into account all information
currently available to us. These beliefs, assumptions and expectations can change as a result
of many possible events or factors, not all of which are known to us or are within
our control. If a change occurs, our business, financial condition,
liquidity and results of operations may vary materially from those expressed in our forward-
looking statements.
Forward-Looking Statements
2 |
 Symbol:
VTG (NYSE AMEX)
Location:
HQ –
Houston; Operations –
Singapore; Marketing –
Dubai
Market Cap:
$450 million
Book Value:
$700 million
Enterprise Value:
$2.5 billion
Employees:
> 1,000
Contract Backlog:
$2.8 billion
Owned Fleet:
4 Ultra-Premium Jackups
1 Ultra-Deepwater Drillship
1 Ultra-Deepwater Drillship in transit to US GOM
1 Ultra-Deepwater Drillship under construction
Managed Fleet:
1 Ultra-Deepwater Drillship under construction
Corporate Overview
3 |
 Acquisition of 100% of Titanium Explorer
announced on March 20, 2012; deal closed simultaneously with the
delivery of the Titanium Explorer
in April 2012 –
the Titanium Explorer has completed load-out and is sailing
in the Atlantic with an expected arrival in Port Fourchon, Louisiana in mid
July.
Sapphire
Driller
awarded
two
new
short-term
contracts
at
$165,000
per
day
net
of
taxes
which
will
keep
on
contract through the middle of 2013.
Tungsten
Explorer
has
left
drydock,
expected
delivery
2
quarter
2013
Ultra-deepwater rates moving up rapidly, providing excellent contracting
opportunity for newbuild Tungsten Explorer
Q4 2010 -
Took delivery of Platinum Explorer
–
on-time, on budget, commenced operations with ONGC, and
achieved impressive utilization –
First
12
months
of
operation
–
92.4%
utilization
Completed 1 Quarter 2012 @ 97.0% utilization
Commenced high-profile jackup contract for ultra-HPHT work in Malaysia
@ $187,000 per day (inclusive of reimbursed upgrades); 14-21 month
duration Recent Developments
4
nd
st
April 2, 2012, closed a $775.0 million 11.5% Senior Notes “Tack-on” financing at on
offer price of 108%, resulting in net proceeds to Vantage of approximately $820.0 million to
complete the financing of the Titanium Explorer acquisition and working capital. |
 Premium high-specification drilling units, including four jackup rigs and
three drillships Vantage’s modern rigs are capable of drilling to
deeper depths and possess enhanced operational efficiency and technical
capabilities, resulting in higher utilization, dayrates and margins
Total
costs
of
owned
fleet
of
four
jackups,
the
Platinum
Explorer
drillship
and
the
Titanium
Explorer
of
approximately $2.5 billion
Premium Fleet
Successful
track
record
of
managing,
constructing,
marketing
and
operating
offshore
drilling
units
In-house team of engineers and construction personnel overseeing complex
construction projects All newbuilds delivered on budget and on time
Jackup fleet has experienced approx. 99% of productive time for Vantage’s
first 38 months in operation Proven Operational
Track
Record
Significant cash flow visibility
Contract backlog of approximately $2.8 billion with industry leading E&P
Companies. Prior work experience includes a strong customer mix
including: Significant
Contract Coverage
with
High Quality
Counterparties
(1)
PVEP Phu Quy Petroleum Operating Co. Ltd. is a joint venture interest between
PetroVietnam Exploration Production Corp. and Total E&P Vietnam. Company
Highlights 5
Level of efficiency is exceptional for newly-constructed jackup rigs upon
commencement of operations Total, ENI, Petrobras, ONGC, Petronas Cargali,
PTT Thailand, Pearl Energy, Bowleven, Foxtrot International,
Phu
Quy
(1)
,
and
Salamander. |
 Successful construction management arrangements for ultra-deepwater
drillships, including completed
Aker
drillships
and
SeaDragon
semisubmersible
projects
and
ongoing
Dalian
Developer
project.
Provided Vantage with significant engineering expertise and experience in Korean,
Chinese and Singaporean shipyards.
Management team with extensive experience; average of 29 years in the drilling
industry Includes international and domestic public company experience with
industry-leading peers involving numerous acquisitions and debt and
equity financings. Experienced operating personnel.
Construction
Supervision and
Management
Arrangements
Experienced
Management and
Operational Team
Company Highlights (Cont’d)
6 |
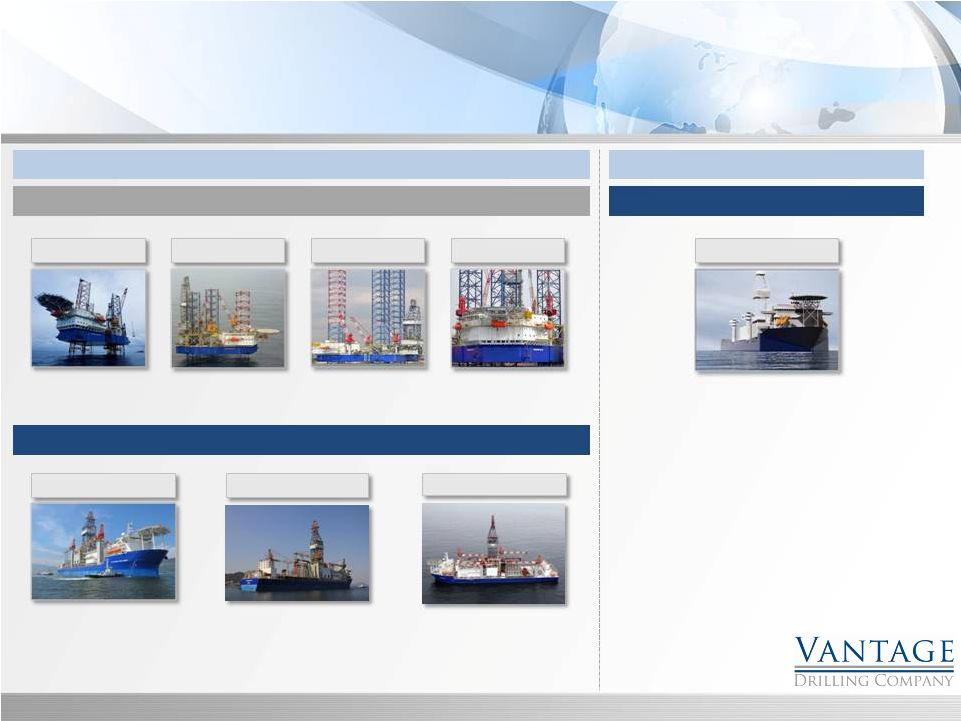 Owned Assets
•
Delivered On-Time, On-
Budget -
December 2008
•
Hired by Financial Institution to provide shipyard oversight
following bid process
•
Largest drillship in the world currently under construction
•
Vessel will include oil storage and multi-purpose
capabilities
•
Delivery Q1 2013
•
Company owned newbuild project
•
Leverages shipyard experience
•
Favorable costs and delivery
schedule
•
Delivery Q2 2013
Tungsten Explorer
Premium Owned Fleet with a Proven Operational
Track Record
•
2 Successful newbuild at
DSME
•
Delivery April 2012
Construction Management Projects
Dalian Developer
Newbuild Ultra-Premium Marine Pacific Class 375 Jackups
Emerald Driller
Sapphire Driller
Aquamarine Driller
Topaz Driller
Platinum Explorer
Ultra-Deepwater 12,000 ft Drillships
•
Delivered On-Time, On-
Budget -
November 2010
•
Delivered On-Time, On-
Budget -
July 2009
•
Delivered On-Time, On-
Budget -
December 2009
•
Delivered On-Time, On-
Budget -
September 2009
Titanium Explorer
Ultra-Deepwater Drillship
7
nd |
 Business Strategy
Capitalize on Customer
Demand for High-
Specification Units
•
Customer demand for new high-specification units supported by:
Need for rigs well-suited for drilling through deep and complex formations and
drilling horizontally Enhanced efficiency providing faster drilling and
moving times Improved safety features and lower downtime for
maintenance Expand Deepwater
Exposure
•
Technological developments have made ultra-deepwater exploration more feasible
and cost-effective in recent years
•
Water-depth capability and equipping of Vantage's ultra-deepwater drilling
units is attractive for customers Will provide significant advantages in
obtaining long-term ultra-deepwater drilling contracts in the future
Focus on Long-term
Contracts
•
Long-term
drillship
contracts
for
Platinum
Explorer
(5
years)
and
Titanium
Explorer
(8
years)
•
Jackups operating on contracts with average 14-month terms (average 12 months
remaining backlog) •
$2.8 billion in contract backlog mitigates cyclical oil and gas industry
risk Expand Key Industry
Relationships
•
Focused on expanding relationships with national oil companies, major oil
companies, large independents and super-regionals
•
Will lead to longer-term contracts to build backlog
•
Strong
existing
relationships
have
contributed
to
large
existing
backlog
and
repeat
business
with
customers
Pursue Acquisition
Opportunities
•
Growth through acquisitions of assets and other offshore drilling companies
•
Current construction management contracts provide potential acquisition
targets 8 |
 Strong
Customer Relationships Key Customers
9 |
 •
Faster drilling times
•
Faster moving times
•
Increased volumes of consumable liquids and
drilling fluids
•
Reduced boat runs and non-productive time
•
Improved pipe handling and offline capability
•
Fast preloading time for all tanks
•
75’
x 30’
cantilever reach substantially greater
than the industry average
•
Pipe decks allow increased storage capacity
•
Premium drilling package:
•
3 x 2200HP mud pumps
•
Integrated diverter system
•
18-¾’’
BOP system and 4 rams
•
High-capacity,
high
efficiency
–
5
x
CAT
3516
B
Diesel engines
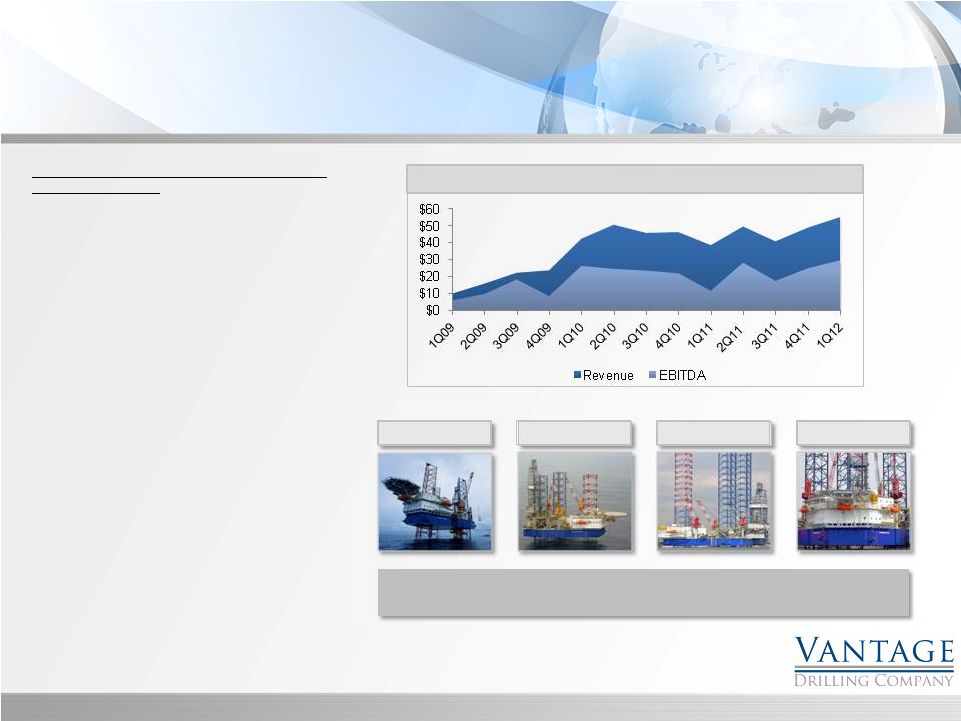
Quarterly Financial Performance
Ultra-Premium Jackup Fleet
World class assets achieving world class performance
Fleet productive time approximately 99% since inception
Emerald Driller
Sapphire Driller
Aquamarine Driller
Topaz Driller
Increased Operational Efficiency and Improved
Technical Capability:
10 |
 Fleet
Status – Average
Drilling
Revenue/Day
(1)
11
Average drilling revenue per day is based on the total estimated revenue divided by the minimum number
of days committed in a contract. Unless otherwise noted, the total revenue includes any
mobilization and demobilization fees and other contractual revenues associated with the drilling
services. The drilling revenue per day includes the achievement of the 12.5% bonus opportunity, but excludes
mobilization revenues and revenue escalations included in the contract.
(1)
(2) |
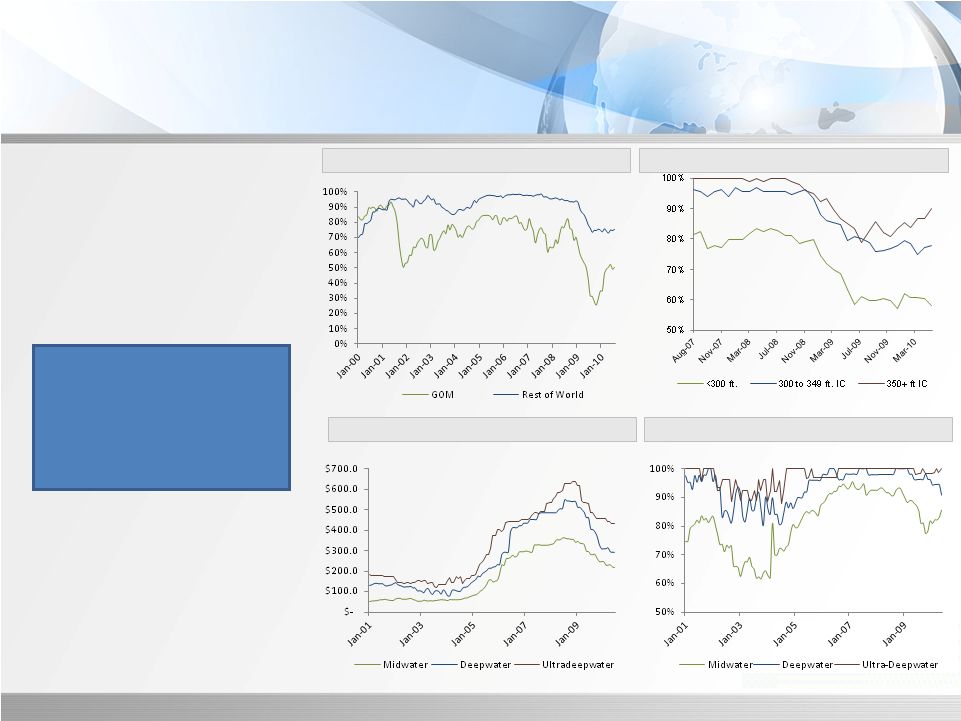 •
Premium jackups (350’
+ IC rigs)
and ultra-deepwater floater have
historically maintained
significantly higher utilization
levels
Source: Riglogix; ODS-PetroData.
Premium Asset Advantage
12
Recent leading edge
dayrates have
reached $170K for
jackups and $650 for
deepwater floaters
International vs. GOM Jackup Utilization
Global Jackup Utilization
Historical Floater Dayrates ($Thousands)
Historical Floater Utilization |
 Capabilities
and
age
–
The
current
worldwide
fleet
is
comprised
mostly
of
older,
inefficient
rigs
Age
is
a
factor
–
Demand
is
increasing
for
high-specification
jackups.
Many
customers
are
implementing
age
restrictions and new high-specification requirements.
Source: ODS-Petrodata
Global Jackup Fleet Distribution
Profile of Global Jackup Fleet
13
Despite 126 newbuild deliveries since 2003, majority of worldwide
jackup fleet remains older than 25 years
300'+ IC
151
300' IC
131
<250' IC
65
250' IC
57
300'+ IS
9
MC
40
<300' IS
15
MS
18
22%
of
today’s
jackups
are
mat-supported
and/or
have
less
than
200ft
of
water
depth
capability
68% of today’s jackups are 25 years or older
As of March 2012 a total of 85 rigs were either ready stacked, cold stacked, or in
an accommodation mode without contract How many will not return to
service? Age
Rigs
%
%
300+
200-299
<200
25 years or older
325
68%
58%
152
119
54
5 to 24 years
64
13%
11%
59
1
4
0 to 4 years
90
19%
16%
80
6
4
479
100%
291
126
62
2012 Deliveries
26
5%
24
2
0
2013 Deliveries
38
7%
37
1
0
2014 Deliveries
15
3%
13
2
0
558
100%
365
131
62
Age of Jackup Fleet
Water Depth (feet) |
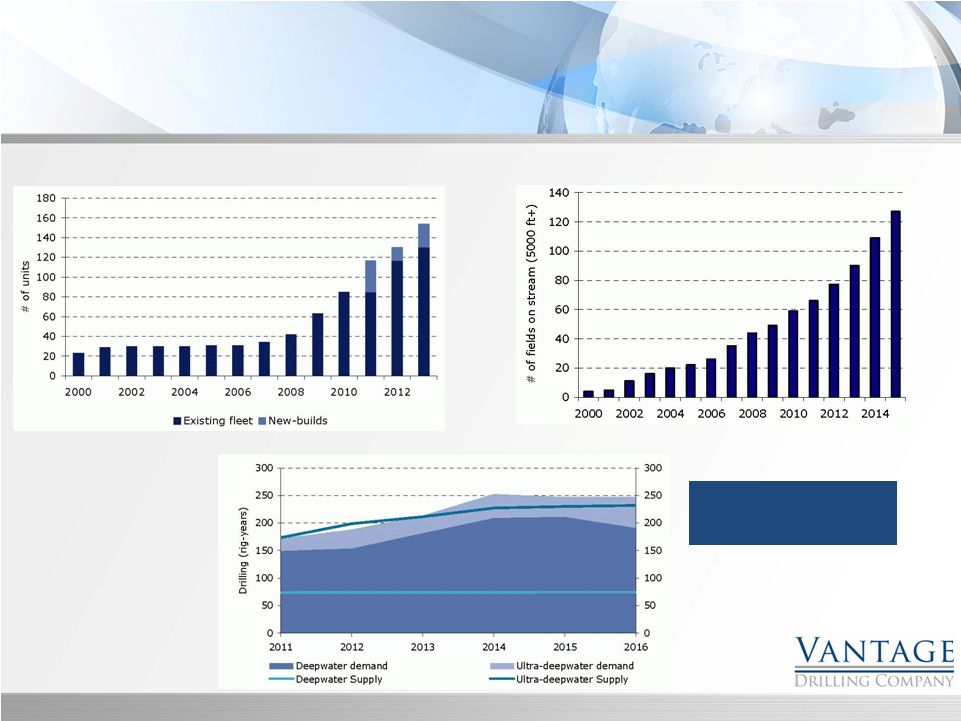 Ultra-Deepwater Rig Supply is Increasing Significantly
Deepwater Exploration is a Young, Rapidly Growing Market
Demand is Likely to Exceed Rig Supply Despite Newbuilds
Source: ODS-Petrodata, DnB NOR
Global Deepwater Market
14
Recent fixtures
>$650,000 per day |
  Balance Sheet
($Millions)
Financial Overview
15
December 31,
December 31,
March 31,
2010
2011
2012
Cash and cash equivalents
120.4
$
110.0
$
56.5
$
Restricted cash
29.0
7.0
5.4
Trade receivables
50.2
100.9
113.6
Inventory
19.8
24.4
25.7
Prepaid expenses and other current assets
11.5
16.9
17.4
230.9
259.3
218.5
Property and equipment, net
1,718.1
1,805.1
1,795.5
Investment in joint venture
-
-
-
Other assets
54.2
58.2
55.7
2,003.2
$
2,122.5
$
2,069.6
$
Accounts payable and accrued liabilities
107.5
$
148.1
$
99.4
$
Short-term debt
8.6
-
-
Current maturities of
long-term debt -
-
-
116.1
148.1
99.4
Long–term debt
1,103.5
1,246.4
1,248.4
Other long term liabilities
13.5
29.8
24.5
Shareholders' Equity
Paid-in capital
854.8
860.8
863.0
Retained Earnings
(84.7)
(162.6)
(165.8)
Accumulated other comprehensive loss
-
-
-
Total shareholders’
equity 770.2
698.2
697.2
2,003.2
$
2,122.5
$
2,069.6
$
Outstanding shares
289.7
291.2
291.6
Book value per share
2.66
$
2.40
$
2.39
$
Long-term
Debt matures
in 2015
First Call
option
February
2013 |
 EBITDA
Low
6.5x
Today’s
Peer Avg.
7.8x
Historical
Peer Avg.
11.6x
$350 million
$1.30
$3.70
$5.43
$400 million
$2.41
$5.16
$9.41
$450 million
$3.53
$6.62
$11.40
Implied Values –
EV/EBITDA
Source: Jefferies
Price to Book Value
Key Drivers Near Term –
•
Achieve high productive time on Platinum Explorer
•
Improving dayrate contract fixtures on jackups
•
Commencement of operations in US GOM for Titanium Explorer
•
Contract for the Tungsten Explorer
16
Significant Upside Valuation Potential |
 Historical Financial Information
($ Millions)
Financial Overview
17
Achieved record Revenue and
Adjusted EBITDA in 1 Quarter 2012
st |
 Reconciliation of Net Income (Loss) to Adjusted EBITDA
($Millions)
Appendix
18
Fiscal Quarter Ended,
6/30/2009
9/30/2009
12/31/2009
3/31/2010
6/30/2010
9/30/2010
12/31/2010
3/31/2011
6/30/2011
9/30/2011
12/31/2011
3/31/2012
Net income (loss)
4.0
$
6.8
$
(4.3)
$
6.0
$
(7.0)
$
(33.6)
$
(13.0)
$
(18.7)
$
(40.1)
$
(11.9)
$
(7.3)
$
(1.2)
$
Interest expense, net
1.3
1.9
4.2
8.0
13.3
13.9
14.1
41.5
39.3
37.1
37.5
36.8
Income tax provision (benefit)
0.9
1.1
(0.6)
2.3
8.4
2.8
5.5
2.9
7.8
2.0
(1.2)
5.8
Depreciation
2.1
3.2
4.3
7.5
8.4
8.8
8.8
16.1
16.0
16.0
16.4
16.6
Loss on debt extinguishment
-
-
-
-
-
24.0
-
-
25.2
-
-
-
Loss on acquisition of subsidiary
-
-
-
-
-
3.8
-
-
-
-
-
-
EBITDA
8.3
$
13.0
$
3.6
$
23.8
$
23.1
$
19.7
$
15.4
$
41.9
$
48.2
$
43.2
$
45.4
$
58.0
$
Share-based compensation expense
1.2
1.2
1.4
1.5
1.5
1.6
1.5
0.9
1.5
1.6
1.9
2.3
Adjusted EBITDA
9.5
$
14.2
$
5.0
$
25.3
$
24.6
$
21.3
$
16.9
$
42.8
$
49.7
$
44.8
$
47.3
$
60.3
$ |