Attached files
| file | filename |
|---|---|
| 8-K - FORM 8-K - Expedia Group, Inc. | d371592d8k.htm |
 INVESTOR
PRESENTATION
June 2012
Exhibit 99.1 |
 2
Safe Harbor
Litigation Reform Act of 1995. These statements are not guarantees of future
performance. These forward-looking statements are based on
management’s expectations as of June 25, 2012 and assumptions which are inherently subject to uncertainties, risks and
changes in circumstances that are difficult to predict. The use of words such as
"intends" and “expects,” among others, generally identify
forward-looking statements. However, these words are not the exclusive means of identifying such statements. In addition,
any statements that refer to expectations, projections or other characterizations of
future events or circumstances are forward- looking statements and may
include statements relating to future revenues, expenses, margins, profitability, net income / (loss),
earnings per share and other measures of results of operations and the prospects for
future growth of Expedia, Inc.’s business. Actual results and the timing
and outcome of events may differ materially from those expressed or implied in the forward-looking statements
for a variety of reasons, including, among others: competitive risks; declines or
disruptions in the travel industry; changes in our relationships and
contractual agreements with travel suppliers or travel distribution partners; increases in the costs of maintaining and
enhancing our brand awareness; changes in search engine algorithms and dynamics; our
inability to adapt to technological developments or to maintain our existing
technologies; our ability to expand successfully in international markets; changes in senior
management; volatility in our stock price; changing laws, rules and regulations and
legal uncertainties relating to our business; unfavorable new, or adverse
application of or failure to comply with existing, laws, rules or regulations; adverse outcomes in legal
proceedings to which we are party; provisions in certain credit card processing
agreements that could adversely impact our liquidity and financial positions;
fluctuations in our effective tax rate; liquidity constraints or our inability to access the capital markets when
necessary; risks related to our long term indebtedness; fluctuations in foreign
exchange rates; risks related to the failure of counterparties to perform on
financial obligations; potential liabilities resulting from our processing, storage, use and disclosure of
personal data; the integration of current and acquired businesses; the risk that our
intellectual property is not protected from copying or use by others,
including competitors; risks related to interruption or lack of redundancy in our information systems; and other risks
detailed in our public filings with the SEC, including our annual report on Form
10-K for the year ended December 31, 2011. Except as required by
law, we undertake no obligation to update any forward-looking or other statements in this presentation, whether as a
result of new information, future events or otherwise.
Appendices. These measures are intended to supplement, not substitute for, GAAP
comparable measures. Investors are urged to consider carefully the
comparable GAAP measures and reconciliations.
sources as well as from research reports prepared for other purposes. We have not
independently verified the data obtained from these sources and cannot assure
you of the data’s accuracy or completeness.
© 2012 Expedia, Inc. All rights reserved. CST: 2029030-50
Forward-Looking
Statements.
This
presentation
contains
"forward-looking
statements"
within
the
meaning
of
the
Private
Securities
Non-GAAP
Measures.
Reconciliations
to
GAAP
measures
of
non-GAAP
measures
included
in
this
presentation
are
included
in
the
Industry
/
Market
Data.
Industry
and
market
data
used
in
this
presentation
have
been
obtained
from
industry
publications
and
Trademarks
&
Logos.
Trademarks
and
logos
are
the
property
of
their
respective
owners. |
 3
Investment Highlights
A Growth
Company
Global
Global
Leader
Leader
in
in
~$1
~$1
Trillion Market
Trillion Market
with
with
Strong Offline-to-Online Trends
Strong Offline-to-Online Trends
Significant Growth Opportunities Across Geographies
Significant Growth Opportunities Across Geographies
Rapid Expansion in Highly Fragmented Hotel Industry
Rapid Expansion in Highly Fragmented Hotel Industry
Technology Platform Investment and
Technology Platform Investment and
Innovation Driving Higher Conversion
Innovation Driving Higher Conversion
Success in New Distribution Channels, e.g. Mobile
Success in New Distribution Channels, e.g. Mobile
Powerful Free Cash Flow Generation
Powerful Free Cash Flow Generation |
 The
Largest Travel Company in the World Mutually
Beneficial
Supply
Agreements
Value to
Travelers
Scale Enables
Virtuous Circle
Diverse Demand:
Geography AND Travel Type
1
Source: comScore Worldwide Average Monthly Unique Visitor data, Full year 2011
Massive
Massive
Depth and
Depth and
Breadth of
Breadth of
~150,000
Hotels in
200+
Countries
300+
Airlines
2.6 Million
2.6 Million
Packages
Unmatched
Unmatched
Volume and
Volume and
Diversity of
Diversity of
Global Travel
Global Travel
60 Million
Unique Visitors
1
Travelers in
~70 Countries
Corporate and
Leisure Travel;
Online and
Offline
SUPPLY
SUPPLY
DEMAND
DEMAND
4 |
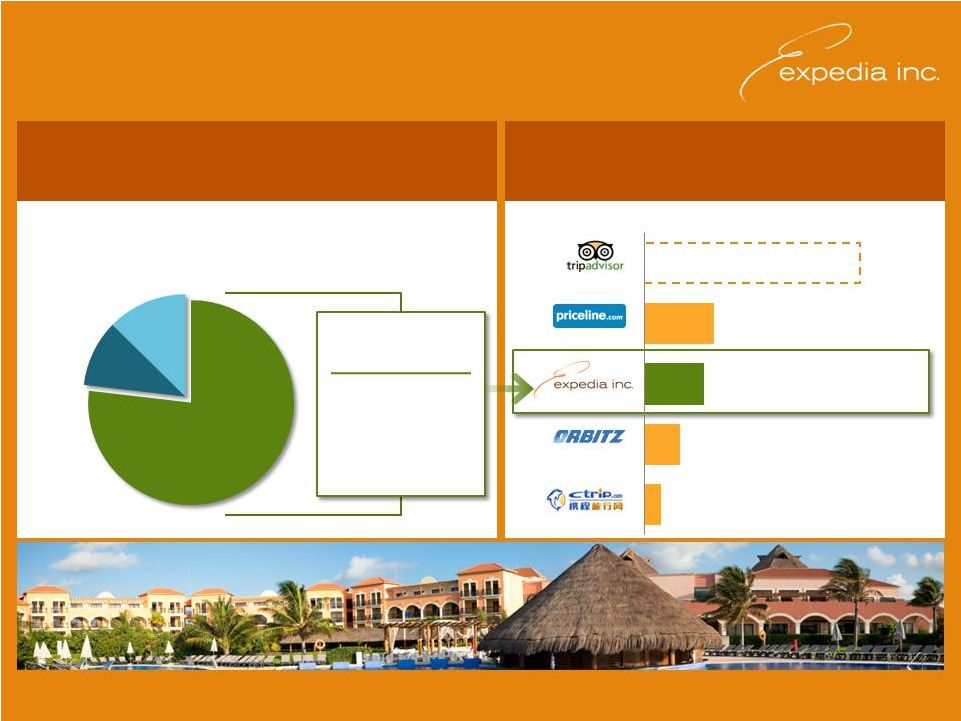
 A
Leader in Global Corporate Travel
Established Brands with Global Reach
#1
Online Travel Agency
“Expedia Inside”
Private Label Solutions
Brand Strength in
EVERY
Solid Foothold in Emerging Markets
A Leading Hotel
Specialist Globally
76 Sites in
67 Countries
10,000 Affiliates in
33 Countries
Presence in
50+ Countries
30 Sites in
30 Countries
5
Trusted Brands
Trusted Brands
Established Market |
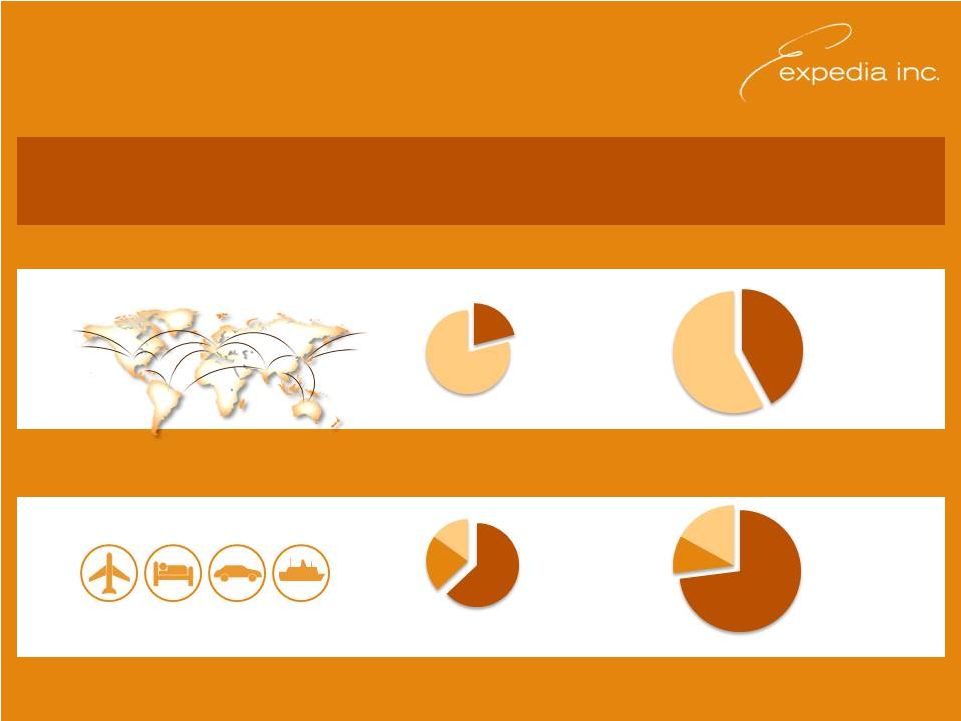 Business Mix Transformation
Positions Us for Growth
Revenue
Revenue
5 Years Ago
5 Years Ago
Revenue
Revenue
TTM 3/31/12
TTM 3/31/12
Hotels
63%
Other
Hotels
73%
Other
Air
10%
Air
22%
International
24%
Domestic
International
42%
Domestic
Note: 5 Years Ago = 2005 Revenues
6
PRODUCT
GEOGRAPHY |
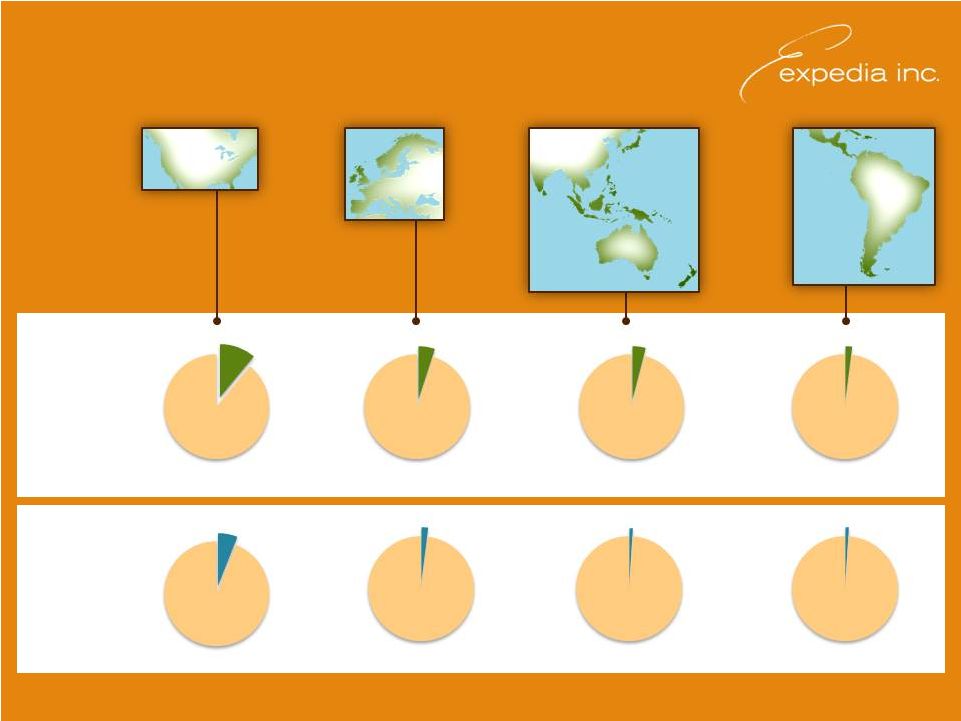 Expedia
4%
Other
Expedia
5%
Other
Expedia
11%
Other
Expedia
2%
Other
ONLINE
TRAVEL
SEGMENT
58%
21%
42%
24%
% of Total
Travel Market
Expedia Well-Positioned to Capture
Significant Global Growth Opportunity
Sources: PhoCusWright estimates and Expedia data
Note:
EXPE
share
of
travel
market
defined
by
TTM
gross
bookings
as
of
March
31,
2012.
APAC
data
includes
gross
bookings
from
AirAsia
joint
venture
Expedia Share:
Expedia
6%
Other
Expedia
0.3%
Expedia
2%
Expedia
1%
Other
Other
$293B
$68B
$313B
$290B
UNITED
STATES
EUROPE
ASIA
PACIFIC
LATIN
AMERICA
Other
7
2012 TOTAL
TRAVEL
MARKET |
 8
Expedia
Expedia
®
Has Scale in Hotels …
Has Scale in Hotels …
Number of Hotels3
Rapidly Expanding in
Fragmented Hotel Market
1
Other includes Car, Advertising, Destination Services, Insurance, Cruise, Agency
Packages, and Other 2
Sources: Smith Travel Research and Expedia data
3
Hotel data for TripAdvisor, Priceline, Orbitz and Ctrip.com obtained from respective
company websites …
…
And Significant Room for
And Significant Room for
Additional Growth
Additional Growth
Hotels
Hotels
73%
73%
$3.5B
TTM 1Q 2012
Revenues
Air
Other¹
39,000
85,000
150,000
235,000
570,000
~150k Hotels in
200+ Countries
Single Largest
Booker of
Rooms in US
…
But Still Only
~5%
Share
2
Number
of
Hotels
3
Global Team
Working to Sign
Up New Hotels |
 Technology Investment
Positions Us for Growth
CUSTOMIZED
Front-End
Technology
for
Rapid
Innovation
and Powerful Analytics …
Improving Conversion
9
10,000
Affiliates
UNIFIED
Customer Operations Technology UNIFIED Transactional Infrastructure: Financials / Order Management /
Inventory Management |
 Industry Leading Mobile, Social and Deal
Initiatives Drive Traffic and Revenue
50-70%
of Mobile Bookings
of Mobile Bookings
Completed within
Completed within
One Day
of Travel / Stay
of Travel / Stay
in App Development
Leading Travel
App Developer
in App Success
#1 Free iPhone
Travel Apps in
40+
Countries
PC-Connected
Users
24 x 7
Mobile Users
Unique Supply Deal and
Unique Supply Deal and
Value Proposition to
Value Proposition to
Customers:
Customers:
40-50% Off
Just for Mobile
Just for Mobile
The World Is
The World Is
Changing …
Changing …
Opening Up Significant
Opening Up Significant
Opportunity in Travel
Opportunity in Travel
…
…
Expedia
Expedia
Leads the Way
Leads the Way
1
Source: AppAnnie
10
in Deals
1 |
 11
Expedia’s Significant Competitive Moats
SCALE and BREADTH
SCALE and BREADTH
Global Scale Across Multiple Travel Brands and Product Offerings
Global Scale Across Multiple Travel Brands and Product Offerings
DIVERSE DEMAND
DIVERSE DEMAND
Multiple Sources
Multiple Sources
Leisure
Leisure
Corporate
Corporate
Call Centers
Call Centers
Traditional Travel Agency
Traditional Travel Agency
Online
Online
SUPPLY
SUPPLY
Global Travel Supply Footprint and
Global Travel Supply Footprint and
Deeper Supplier Relationships
Deeper Supplier Relationships
TECHNOLOGY PLATFORM
TECHNOLOGY PLATFORM
Investment in Technology to
Investment in Technology to
Drive Conversion and Bookings
Drive Conversion and Bookings |
 12
Large User Base With Multiple Growth Vectors
Large User Base With Multiple Growth Vectors
Key Financial Highlights
High Quality Diversified Revenue Streams
High Quality Diversified Revenue Streams
Consistent, Robust Cash Flow Generation and Strong EPS Growth
Consistent, Robust Cash Flow Generation and Strong EPS Growth
Strong Balance Sheet Allows Ample Value-Add Opportunities
Strong Balance Sheet Allows Ample Value-Add Opportunities
Investing Now to Support Future Growth |
 13
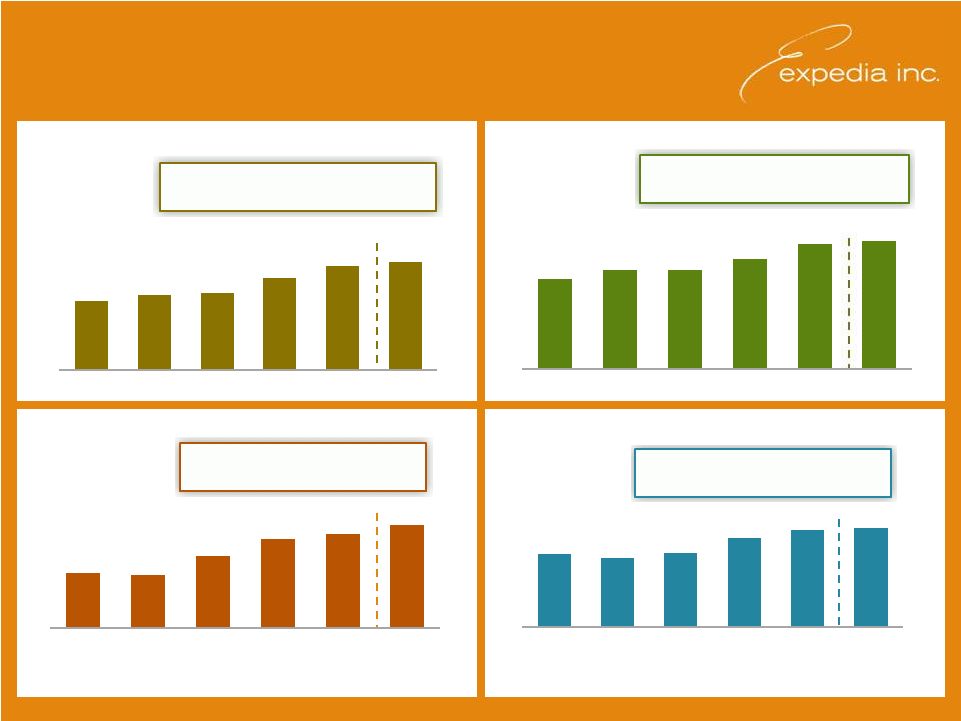
Improving Financial Results
ADJUSTED EBITDA
1
ADJUSTED EPS
2,3
$ Millions
2
See Appendix B for Non-GAAP to GAAP Reconciliation
3
Adj. EPS is EPS for Expedia, Inc. considering TripAdvisor on a discontinued
operations basis $ Billions
1
See Appendix A for Non-GAAP to GAAP Reconciliation
GROSS BOOKINGS
$ Billions
World’s Largest Travel Company
’07-’10 CAGR: 3.9%
TTM
1Q12
Y-o-Y
Growth:
7.1%
’07-’10 CAGR: 6.7%
TTM
1Q12
Y-o-Y
Growth:
16.5%
$624
$621
$662
$700
$711
$731
2007
2008
2009
2010
2011
TTM 1Q12
$2.08
$1.97
$2.10
$2.53
$2.75
$2.83
2007
2008
2009
2010
2011
TTM 1Q12
$2.5
$2.7
$2.7
$3.0
$3.4
$3.5
2007
2008
2009
2010
2011
TTM 1Q12
$20
$21
$22
$26
$29
$30
2007
2008
2009
2010
2011
TTM 1Q12
REVENUE
’07-’10 CAGR :
6.1%
TTM 1Q12 Y-o-Y Growth: 13.6% |
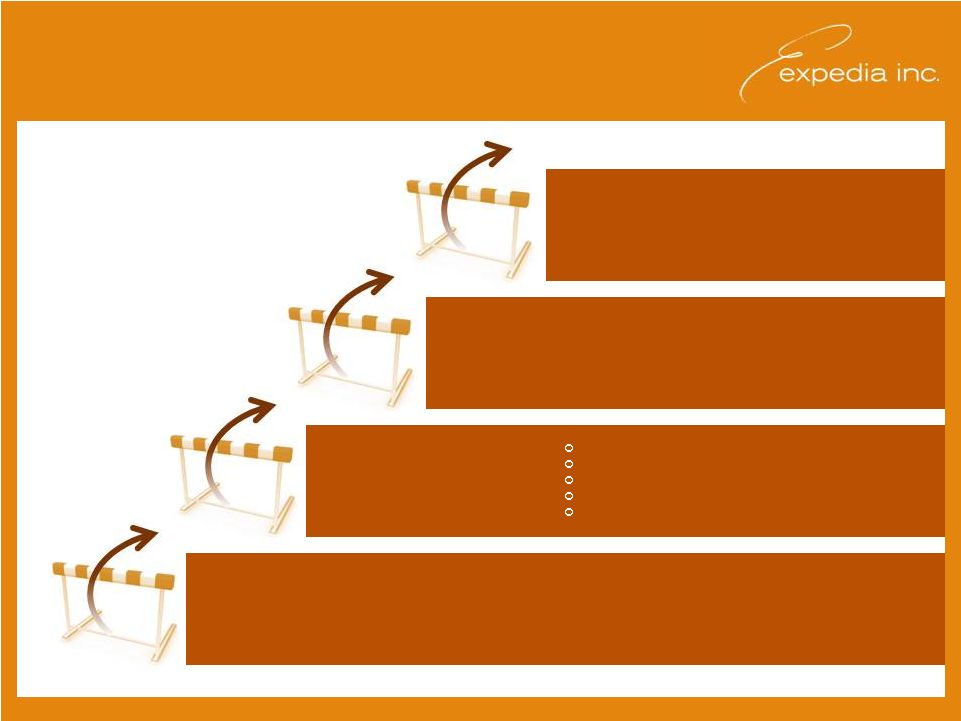
 14
The Three Stages of Expedia Growth
1
Represents 2007 –
2010 CAGR
2
See Appendix A for Non-GAAP to GAAP Reconciliation
Revenue Growth
Modest:
6.1% Growth
Accelerating
Continuing
Line Item Trajectory
(% of Revenues)
Cost of Revenue
22.5%
Flat as
% of Revenue
Declining
%
Revenue
Selling and Marketing
40.3%
Increasing as
% of Revenue
Flat to Slightly
Increasing as
% of Revenue
Technology
and Content
9.8%
Increasing as
% of Revenue
Flat or Declining
%
Revenue
G&A
7.6%
Declining
% of Revenue
Declining
%
of Revenue
as
of
as
of
as
as
1
2
STAGE 1
2010
STAGE 2
2011
2012
STAGE 3
2013
-
Adjusted
EBITDA Margin
23.1%
Slightly Decreasing as
% of Revenue
Increasing as
% of Revenue |
 15
Summary
Global Leader in ~$1 Trillion Market with
Global Leader in ~$1 Trillion Market with
Strong Offline-to-Online Trends
Strong Offline-to-Online Trends
Significant Growth Opportunities Across Geographies
Significant Growth Opportunities Across Geographies
Rapid Expansion in Highly Fragmented Hotel Industry
Rapid Expansion in Highly Fragmented Hotel Industry
Technology Platform Investment and
Technology Platform Investment and
Innovation Driving Higher Conversion
Innovation Driving Higher Conversion
Success in New Distribution Channels, e.g. Mobile
Success in New Distribution Channels, e.g. Mobile
Powerful Free Cash Flow Generation
Powerful Free Cash Flow Generation
A Growth
Company |
 16
APPENDICES
16 |
 17
Definitions
related to certain subsidiary equity plans; (2) acquisition-related impacts,
including (i) amortization of intangible assets and goodwill and intangible
asset impairment, and (ii) gains (losses) recognized on changes in the value of contingent consideration arrangements;
(3) certain infrequently occurring items, including restructuring; (4) items included
in Legal reserves, occupancy tax and other, which includes reserves for
potential settlement of issues related to hotel occupancy taxes, related court decisions and final settlements,
and charges incurred, if any, for monies that may be required to be paid in advance
of litigation in certain occupancy tax proceedings; (5) gains (losses)
realized on revenue hedging activities that are included in other, net; and (6) depreciation.
The above items are excluded from our Adjusted EBITDA measure because these items are
noncash in nature, or because the amount and timing of these items is
unpredictable, not driven by core operating results and renders comparisons with prior periods
and competitors less meaningful. We believe Adjusted EBITDA is a useful measure for
analysts and investors to evaluate our future on- going performance as this
measure allows a more meaningful comparison of our performance and projected cash earnings with our
historical results from prior periods and to the results of our competitors.
Moreover, our management uses this measure internally to evaluate the
performance of our business as a whole and our individual business segments. In addition, we believe that by excluding
certain items, such as stock-based compensation and acquisition-related
impacts, Adjusted EBITDA corresponds more closely to the cash operating income
generated from our business and allows investors to gain an understanding of the factors and trends affecting
the ongoing cash earnings capabilities of our business, from which capital
investments are made and debt is serviced. Adjusted
from options and warrants per the treasury stock method and include all shares
relating to RSUs in shares outstanding for Adjusted EPS. This differs from the
GAAP method for including RSUs, which treats them on a treasury method basis. Shares outstanding for Adjusted
EPS purposes are therefore higher than shares outstanding for GAAP EPS purposes. We
believe Adjusted EPS is useful to investors because it represents, on a per
share basis, Expedia’s consolidated results, taking into account depreciation, which we believe is an
ongoing cost of doing business, as well as other items which are not allocated to the
operating businesses such as interest expense, taxes, foreign exchange gains
or losses, and minority interest, but excluding the effects of certain expenses not directly tied to the
core operations of our businesses. Adjusted Net Income and Adjusted EPS have similar
limitations as Adjusted EBITDA. In addition, Adjusted Net Income does not
include all items that affect our net income / (loss) and net income / (loss) per share for the period.
Therefore, we think it is important to evaluate these measures along with our
consolidated statements of operations. Adjusted
EBITDA
is
defined
as
operating
income
plus:
(1)
stock-based
compensation
expense,
including
compensation
expense
EPS
is
defined
as
Adjusted
Net
Income
divided
by
adjusted
weighted
average
shares
outstanding,
which
include
dilution |
 $
Millions 2007
2008
2009
2010
2011
TTM
3/31/2012
Adjusted EBITDA
$624
$621
$662
$700
$711
$731
Depreciation
(57)
(72)
(93)
(106)
(133)
(138)
Amortization of Intangible Assets
(68)
(58)
(24)
(23)
(22)
(20)
Impairment of Goodwill
-
(2,480)
-
-
-
-
Impairment of Intangible and Other Long-Lived Assets
-
(234)
-
-
-
-
Legal Reserves , Occupancy Tax and Other
(1)
(1)
(68)
(23)
(21)
(18)
Stock-Based Compensation
(60)
(56)
(56)
(53)
(64)
(66)
Restructuring Charges
-
-
(34)
-
-
-
Realized Loss on Revenue Hedges
-
-
11
4
8
4
Operating Income (Loss)
$437
$(2,281)
$398
$501
$480
$493
Total Other Expense, Net
(32)
(66)
(78)
(75)
(78)
(73)
Income (Loss) from Continuing Operations before Income Taxes
405
(2,347)
320
426
402
420
Provision for Income Taxes
(166)
3
(102)
(120)
(76)
(78)
Income (Loss) from Continuing Operations
239
(2,343)
218
306
326
342
Discontinued Operations, Net of Taxes
55
(177)
85
120
148
78
Net Income (Loss)
294
(2,521)
304
426
475
420
Net (Income) Loss Attributable to Noncontrolling Interests
2
3
(4)
(4)
(2)
(3)
Net Income (Loss) Attributable to Expedia, Inc.
$296
$(2,518)
$300
$422
$472
$417
Non-GAAP / GAAP Reconciliation
Appendix A: Adjusted EBITDA
Note: Numbers may not sum due to rounding
18 |
 $
Thousands 2007
2008
2009
2010
2011
TTM
3/31/2012
Net Income / (Loss) attributable to Expedia, Inc.
$295,864
$(2,517,763)
$299,526
$421,500
$472,294
$416,974
Discontinued operations, net of taxes
(54,502)
177,366
(85,561)
(119,885)
(148,148)
(78,046)
Stock-Based Compensation
59,948
55,731
55,756
52,507
63,847
66,000
Amortization of Intangibles
68,367
58,275
23,875
22,514
21,925
19,513
Restructuring Charges
-
-
34,168
-
-
-
Noncontrolling Investment Basis Adjustment
-
-
5,158
-
-
-
Legal Reserves, Occupancy Tax and Other
1,276
1.051
67,999
22,692
20,855
18,221
Foreign Currency Loss on U.S. Dollar Cash Balances Held by eLong
8,642
8,586
128
2,711
2,690
2,207
Impairment of Goodwill
-
2,480,470
-
-
-
-
Impairment of Intangible and Other Long-Lived Assets
-
233,900
-
-
-
-
Federal Excise Tax Refunds
(12,058)
-
-
-
-
-
(Gain) / Loss on Derivative Instruments Assumed at Spin-Off
5,748
(4,600)
38
-
-
-
Amort. of Intangible Assets as Part of Equity Method Investments
2,324
2,593
458
-
-
-
Unrealized (Gain) / Loss on Revenue Hedges
-
-
(1,033)
4,898
(4,479)
(2,964)
Noncontrolling Interests
(4,515)
(3,837)
(1,343)
(2,877)
(3,135)
(2,932)
Provision for Income Taxes
(38,290)
(195,678)
(86,395)
(34,449)
(41,362)
(40,451)
Adjusted Net Income
$332,804
$296,094
$312,774
$369,611
$384,487
398,522
GAAP Diluted Weighted Average Shares Outstanding
157,117
143,084
146,071
144,014
138,702
139,306
Additional Restricted Stock Units
3,119
6,886
3,183
1,889
1,331
1,694
Adjusted Weighted Average Shares Outstanding
160,236
149,970
149,254
145,903
140,033
141,000
Adjusted Earnings from Continued Operations Per Share
$2.08
$1.97
$2.10
$2.53
$2.75
$2.83
Non-GAAP / GAAP Reconciliation
Appendix B: Adjusted EPS Reconciliation
Note: Numbers may not sum due to rounding |
 $
Thousands 2010
Cost of Revenue
$685
Stock-Based Compensation
(2)
Cost of Revenue (excludes Stock-Based Compensation)
$683
Selling and Marketing
$1,235
Stock-Based Compensation
(12)
Selling and Marketing (excludes Stock-Based Compensation)
$1,223
Technology and Content
$309
Stock-Based Compensation
(12)
Technology and Content (excludes Stock-Based Compensation)
$297
G&A
$259
Stock-Based Compensation
(27)
G&A (excludes Stock-Based Compensation)
$232
Non-GAAP / GAAP Reconciliation
Appendix C: Non-GAAP Expense Items
Non-GAAP Cost of Revenue, Selling and Marketing, Technology and Content and
General and Administrative Expenses Excluding Stock-Based Compensation
Note: Numbers may not sum due to rounding |