Attached files
| file | filename |
|---|---|
| EX-23.1 - CONSENT OF KPMG LLP - MacDermid Group Inc. | d327158dex231.htm |
| EX-23.2 - CONSENT OF KPMG LLP - MacDermid Group Inc. | d327158dex232.htm |
Table of Contents
As filed with the Securities and Exchange Commission on June 22, 2012.
Registration No. 333-175473
UNITED STATES
SECURITIES AND EXCHANGE COMMISSION
Washington, D.C. 20549
Amendment No. 8
to
Form S-1
REGISTRATION STATEMENT
UNDER
THE SECURITIES ACT OF 1933
MacDermid Group, Inc.
(Exact name of registrant as specified in its charter)
| Delaware | 2890 | 45-2568333 | ||
| (State or other jurisdiction of incorporation or organization) |
(Primary Standard Industrial Classification Code Number) |
(I.R.S. Employer Identification Number) |
1401 Blake Street
Denver, Colorado 80202
(720) 479-3060
(Address, including zip code, and telephone number, including area code, of registrant’s principal executive offices)
Daniel H. Leever
Chairman and Chief Executive Officer
1401 Blake Street
Denver, Colorado 80202
(720) 479-3060
(Name, address, including zip code, and telephone number, including area code, of agent for service)
Copies to:
| Craig F. Arcella Kris F. Heinzelman Cravath, Swaine & Moore LLP Worldwide Plaza 825 Eighth Avenue New York, New York 10019-7475 (212) 474-1000 Fax: (212) 474-3700 |
Peter M. Labonski Keith L. Halverstam Latham & Watkins LLP 885 Third Avenue New York, New York 10022-4834 (212) 906-1200 Fax: (212) 751-4864 |
Approximate date of commencement of proposed sale to the public: As soon as practicable after the effective date of this Registration Statement.
If any of the securities being registered on this Form are to be offered on a delayed or continuous basis pursuant to Rule 415 under the Securities Act of 1933, check the following box. ¨
If this Form is filed to register additional securities for an offering pursuant to Rule 462(b) under the Securities Act, please check the following box and list the Securities Act registration statement number of the earlier effective registration statement for the same offering. ¨
If this Form is a post-effective amendment filed pursuant to Rule 462(c) under the Securities Act, check the following box and list the Securities Act registration statement number of the earlier effective registration statement for the same offering. ¨
If this Form is a post-effective amendment filed pursuant to Rule 462(d) under the Securities Act, check the following box and list the Securities Act registration number of the earlier effective registration statement for the same offering. ¨
Indicate by check mark whether the registrant is a large accelerated filer, an accelerated filer, a non-accelerated filer, or a smaller reporting company.
| Large accelerated filer | ¨ | Accelerated filer | ¨ | |||
| Non-accelerated filer | x | Smaller reporting company | ¨ |
CALCULATION OF REGISTRATION FEE
|
| ||||||||
| Title of Each Class of Securities to be Registered |
Amount to be registered |
Proposed maximum offering price per share |
Proposed aggregate offering price(1)(2) |
Amount of registration fees(3) | ||||
| Common Stock, $0.01 par value per share |
$200,000,000 | $23,220 | ||||||
|
| ||||||||
|
| ||||||||
| (1) | Estimated solely for the purpose of calculating the registration fee pursuant to Rule 457(o) under the Securities Act of 1933. |
| (2) | Does not include shares that the underwriters have the option to purchase to cover over-allotments. See “Underwriting”. |
| (3) | Previously paid. |
The Registrant hereby amends this Registration Statement on such date or dates as may be necessary to delay its effective date until the Registrant shall file a further amendment which specifically states that this Registration Statement shall thereafter become effective in accordance with Section 8(a) of the Securities Act of 1933 or until the Registration Statement shall become effective on such date as the Commission, acting pursuant to said Section 8(a), may determine.
Table of Contents
EXPLANATORY NOTE
This Registration Statement on Form S-1 (this “Registration Statement”) is being filed by MacDermid Group, Inc., a newly formed Delaware corporation, in connection with a proposed registered public offering of shares of its common stock (the “Offering”). Prior to the completion of the Offering, MacDermid Group, Inc. is a direct, wholly owned subsidiary of MacDermid Holdings, LLC, which, prior to the completion of the Offering, is the holding company parent for MacDermid, Incorporated, the main U.S. operating entity for the MacDermid business and the direct or indirect parent entity of all the MacDermid operating companies.
In connection with, and immediately prior to the completion of, the Offering, MacDermid Holdings, LLC and the MacDermid, Incorporated Profit Sharing and Employee Savings Plan, which is the existing minority stockholder of MacDermid, Incorporated, will exchange the capital stock of MacDermid, Incorporated for the common stock of MacDermid Group, Inc., and MacDermid Holdings, LLC will liquidate and distribute the shares of MacDermid Group, Inc. then held by it to the holders of its membership interests. Immediately following completion of the Offering, the common stock of the registrant will be owned by (1) the entities and persons who purchase the common stock of the registrant pursuant to the Offering, (2) the MacDermid, Incorporated Profit Sharing and Employee Savings Plan and (3) the entities and persons that, immediately prior to the completion of the reorganization transactions described above, own membership units in MacDermid Holdings, LLC, which include certain affiliates and funds of Court Square Capital Partners and Weston Presidio, Daniel H. Leever, the chairman and chief executive officer of MacDermid, Incorporated, and certain other current and former members of the management of the MacDermid business.
See “The Corporate Reorganization” in the prospectus that forms a part of this Registration Statement for additional information regarding the corporate structure of the MacDermid entities.
Table of Contents
The information in this prospectus is not complete and may be changed. We may not sell these securities until the registration statement filed with the Securities and Exchange Commission is effective. This prospectus is not an offer to sell these securities and it is not soliciting an offer to buy these securities in any state where the offer or sale is not permitted.
SUBJECT TO COMPLETION, DATED JUNE 22, 2012
Shares

MacDermid Group, Inc.
Common Stock
This is the initial public offering of our common stock. We are selling shares of common stock. Prior to this offering, there has been no public market for our common stock. The initial public offering price of our common stock is expected to be between $ and $ per share. We have applied to list our common stock on the New York Stock Exchange under the symbol “MRD”.
Prior to the completion of this offering, the existing stockholders of MacDermid, Incorporated will exchange the capital stock of that entity for our common stock, and our parent entity will liquidate and distribute the shares of our common stock it then holds to the holders of its membership interests. These transactions will result in our holding all of the outstanding capital stock of MacDermid, Incorporated, the main U.S. operating entity for the MacDermid business and the direct or indirect parent entity of all the MacDermid operating companies. See “The Corporate Reorganization” for further information.
The underwriters have a 30-day option to purchase a maximum of additional shares to cover over-allotments of shares.
We are an “emerging growth company” as defined under the federal securities laws and, as such, may elect to comply with certain reduced public company reporting requirements for future filings. Investing in our common stock involves risks. See “Risk Factors” beginning on page 18.
| Price to Public |
Underwriting |
Proceeds, before | ||||
| Per Share |
$ | $ | $ | |||
| Total |
$ | $ | $ |
Delivery of the shares of our common stock will be made on or about , 2012.
Neither the Securities and Exchange Commission nor any state securities commission has approved or disapproved of these securities or determined if this prospectus is truthful or complete. Any representation to the contrary is a criminal offense.
| Credit Suisse | Morgan Stanley | Deutsche Bank Securities |
Lazard Capital Markets
| Stifel Nicolaus Weisel | Oppenheimer & Co. | RBC Capital Markets |
The date of this prospectus is , 2012.
Table of Contents

Table of Contents
| 1 | ||||
| 18 | ||||
| 37 | ||||
| 39 | ||||
| 40 | ||||
| 41 | ||||
| 42 | ||||
| 44 | ||||
| 45 | ||||
| MANAGEMENT’S DISCUSSION AND ANALYSIS OF FINANCIAL CONDITION AND RESULTS OF OPERATIONS |
48 | |||
| 90 | ||||
| 104 | ||||
| 110 | ||||
| 117 | ||||
| 121 | ||||
| 122 | ||||
| DESCRIPTION OF CERTAIN INDEBTEDNESS OF MACDERMID , INCORPORATED |
126 | |||
| 130 | ||||
| MATERIAL U.S. FEDERAL INCOME AND ESTATE TAX CONSIDERATIONS FOR NON-U.S. STOCKHOLDERS |
132 | |||
| 135 | ||||
| 139 | ||||
| 139 | ||||
| 139 | ||||
| F-1 |
We have not authorized anyone to provide any information or to make any representations other than those contained in this prospectus. We take no responsibility for, and can provide no assurance as to the reliability of, any other information that others may give you.
Dealer Prospectus Delivery Obligation
Until , 2012 (the 25th day after the date of this prospectus), all dealers that effect transactions in these securities, whether or not participating in this offering, may be required to deliver a prospectus. This is in addition to the dealers’ obligation to deliver a prospectus when acting as underwriters and with respect to their unsold allotments or subscriptions.
The principal executive offices of MacDermid Group, Inc. are located at 1401 Blake Street, Denver, Colorado 80202, and the telephone number at this address is (720) 479-3060. Our website address is www.macdermid.com. Information on, or accessible through, our website is not a part of, and will not be deemed to be incorporated into, this prospectus or the registration statement of which this prospectus forms a part. Investors should not rely on any such information in deciding whether to purchase our common stock.
i
Table of Contents
The following summary highlights certain information contained elsewhere in this prospectus. It does not contain all of the information that may be important to you in making an investment decision. You should read this entire prospectus carefully, especially the risks of investing in our common stock discussed under “Risk Factors” and the financial data and related notes included elsewhere in this prospectus, before making a decision to invest in our common stock.
Our Company
We are a global producer of high technology specialty chemical products and provider of technical services with a proven track record of success and innovation spanning our 90-year history. Our business involves the manufacture of a broad range of specialty chemicals, which we create by blending raw materials, and the incorporation of these chemicals into multi-step technological processes. These specialty chemicals and processes together encompass the products we sell to our customers in the electronics, metal and plastic plating, graphic arts, and offshore oil production and drilling industries. We refer to our products as “dynamic chemistries” due to their delicate chemical compositions, which are frequently altered during customer use. Our dynamic chemistries are used in a wide variety of attractive niche markets, and based on 2011 net sales, we believe that the majority of our operations hold leading positions in the product markets they serve, including, with respect to Electronic Solutions and Industrial Solutions, the number one or number two market share positions in the product markets they serve.
We generate revenue through the manufacture and sale of our dynamic chemistries and by providing highly technical post-sale service to our customers through our extensive global network of specially trained service personnel. Our personnel work closely with our customers to ensure that the chemical composition and function of our dynamic chemistries are maintained as intended. Among the more than 3,500 customers that we served as of December 31, 2011 are some of the world’s preeminent companies, such as LG, Molex, Samsung, FIAT, Ford, GM, Stanley Black & Decker and major companies in the offshore oil and gas industries. We believe that we are able to service our customers and attract new customers successfully through our extensive global network of 14 manufacturing sites and 21 technical service facilities, including 8 research and development centers, in 24 countries.
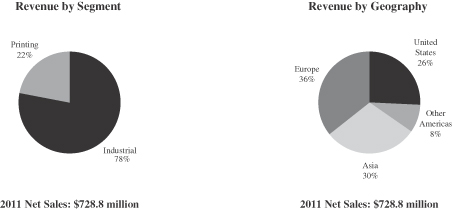
For the 12 months ended December 31, 2011, we generated net sales, operating profit, net income attributable to MacDermid, Incorporated and Adjusted EBITDA of $728.8 million, $55.9 million, $1.0 million and $151.7 million, respectively, and for the three months ended March 31, 2012, we generated net sales, operating profit, net income attributable to MacDermid, Incorporated and Adjusted EBITDA of $182.2 million, $27.1 million, $4.9 million and $38.5 million, respectively. For a reconciliation of net income (loss) attributable to MacDermid, Incorporated to Adjusted EBITDA, see “—Summary Consolidated Financial Data” and the footnotes contained therein.
We dedicate extensive resources to research and development and highly technical, post-sale customer service, while limiting our investments in fixed assets and capital expenditures. We refer to this approach as our “asset-lite, high-touch” business model, which emphasizes the “bookends” of our operations—innovation and technical service. As of March 31, 2012, approximately 1,000 of the approximately 2,100 people we employed were research and development chemists and experienced technical sales and service personnel. We believe that our business model enables us to focus on high growth market opportunities, maintain high margins and a high return on invested capital, and generate stable and strong cash flows. Given that our annual capital expenditures have been consistently less than 2% of our annual net sales, we believe that our cash conversion rate (the proportion of our profits converted into cash flow) is higher than a majority of the companies in our sector.
Our businesses are benefiting from global growth trends in many of our end markets, including the increasing use of electronic devices such as mobile phones and computers, growth in worldwide automotive production and increasing oil production from offshore, sub-sea wells. In addition, over the last several years, we have increased
1
Table of Contents
our focus on growth in emerging markets. In 2011, approximately 37% of our net sales, approximately 37% of our gross profit and approximately 41% of our Adjusted EBITDA was generated in Asia (predominately in the greater China region) and Brazil as compared with approximately 36% of our net sales, approximately 36% of our gross profit and approximately 45% of our Adjusted EBITDA in 2009 in the same regions. We believe that we are also effectively expanding the existing market for our dynamic chemistries by developing new applications within our existing markets. These new applications include: surface coatings for solar panels, plated antennas for smart mobile devices, flexographic plates for printing consumer packaging materials, decorative components for automobile interiors and control system fluids used to prevent oil from seeping from ocean floor valves.
On April 12, 2007, MacDermid, Incorporated, the direct or indirect parent entity of all the MacDermid operating companies and a publicly traded company since 1966, was acquired by a group led by our chairman and chief executive officer, Daniel H. Leever and certain funds of Court Square Capital Partners and Weston Presidio. In connection with that acquisition, the common stock of MacDermid, Incorporated ceased to be listed on the New York Stock Exchange.
Our Businesses
We report our business in two operating segments: an Industrial segment and a Printing segment. In the fiscal year ended December 31, 2011, our Industrial and Printing segments generated net sales of $568.6 million and $160.2 million, respectively. For the three months ended March 31, 2012, our Industrial and Printing segments generated net sales of $140.5 million and $41.7 million, respectively.
Industrial—The Industrial segment supplies technological solutions and dynamic chemistries used for finishing metals and non-metallic surfaces for automotive and other industrial applications, electro-plating metal surfaces, manufacturing circuit boards and other electronic devices for the electronics industry, fluids for the offshore oil and gas markets and specialty coated industrial films. As the regional sales mix in this segment has shifted over the past several years from more industrialized nations towards emerging markets, such as Asia and South America, we have invested significantly in these regions, including developing state-of-the-art facilities in Suzhou, China, and São Paulo, Brazil, to better serve our customers there. We have over 600 personnel and three manufacturing facilities in Asia and remain focused on further increasing our presence in the region.
The Industrial segment is composed of the following three businesses:
Electronic Solutions. We believe we are one of the leading global suppliers of chemical compounds to the printed circuit board fabrication industry based on our 2011 net sales. In this business, we design and formulate a complete line of proprietary “wet” dynamic chemistries that our customers use to process the surface of the printed circuit boards and other electronic components they manufacture. Our product portfolio in this business is focused on niches such as final finishes, through hole metallization and circuit formation, in which we are a small cost to the overall finished product, but a critical component for maintaining the products’ performance. Growth in this business is driven by demand in telecommunication, wireless devices and computers, and the increasing use of electronics in automobiles.
Industrial Solutions. We believe that we have a leading position worldwide in industrial metal and plastic finishing chemistries based on 2011 net sales. In this business, our dynamic chemistries are used for finishing, cleaning and providing surface coatings for a broad range of metal and non-metal surfaces. These coatings may have functional uses, such as improving wear and tear or providing corrosion resistance for appliance parts, or decorative uses, such as providing gloss finishes to components used in automotive interiors. As of December 31, 2011, we manufactured more than 1,000 chemical compounds for these surface coating applications, including cleaning, activating, polishing, electro and electroless plating, phosphatizing, stripping and coating, anti-tarnishing and rust inhibiting for metal and plastic surfaces. Growth in this business is primarily driven by increased world-wide automobile production and demand for appliances, computers and general engineering hardware.
2
Table of Contents
Offshore Solutions. We produce water-based hydraulic control fluids for major oil companies and drilling contractors for offshore deep water production and drilling applications. Production fluids are used in the control systems that open and close critical valves for the deep water oil extraction and transportation process. Drilling fluids are used in control systems to operate valves on the ocean floor. We believe there is significant growth potential for this business as the oil and gas industry continues to grow, as evidenced by the $66.5 billion of capital that is forecasted to be spent globally by deep oil and gas producers from 2011 through 2016, a 109% increase over the prior five-year period, and as oil is produced from new sub-sea wells.
Printing—Through the Printing segment, we supply an extensive line of flexographic plates that are used in the commercial packaging and commercial printing industries. We manufacture photopolymers used to produce printing plates for transferring images onto commercial packaging, including packaging for consumer food products, pet food bags, corrugated boxes, labels and beverage containers. In addition, we also produce photopolymer printing plates for the flexographic and letterpress newspaper and publications markets. Our products are used to improve print quality and printing productivity. The growth in this segment is driven by consumer demand and advertising.
Our Competitive Strengths
We believe that the following are our key competitive strengths:
Leading Market Position in Attractive Niche Markets. We believe, based on our 2011 net sales, that a majority of our operations hold leading positions in the product markets they serve, including the number one or number two market share positions held by Electronic Solutions and Industrial Solutions in the product markets they serve. We also believe that the combination of our global presence, history of innovation, process know-how, strong commitment to research and development, dedication to customer service and broad range of proprietary products distinguishes us from our competitors, allowing us to maintain our leading market share positions. Furthermore, we believe the diversity of the niche markets we serve will enable us to continue our growth throughout economic cycles and mitigate the impact of a downturn in any single market.
Proprietary Technology and Service Oriented Business Model. Our commitment to technological innovation and our extensive intellectual property portfolio of over 750 issued patents enables us to develop our cutting-edge products. In order to continue to provide innovative products and highly technical service to our customers, we place a premium on maintaining a specialized and qualified employee base. Our global sales and service personnel possess extensive knowledge of and experience in our local markets. For instance, our technical management team serving our Asian markets has, on average, over 20 years of experience, including decades of joint product development with our key customers located in the greater China region. We believe that our proprietary technology, extensive industry experience and customer service-focused business model are difficult for our competitors to replicate. As a result, and in order to avoid the transition risks that go along with switching suppliers, customers elect not to switch from our products to those of our competitors. Switching suppliers generally does not make sense for our customers from a cost-benefit standpoint: the cost of our products is low relative to the potential cost savings, as switching expenses (including conducting expensive trials to ensure quality assurance and compliance with regulatory requirements, industry standards and internal protocols) can be significant.
The key role our products play in improving the efficacy of our customers’ manufacturing processes and reducing their total costs, combined with our extensive experience in local markets, our focus on highly technical customer service and the significant customer switching risks and costs inherent in our industry, have enabled us to establish and maintain our long-term customer relationships. We leverage these close relationships to identify opportunities for new products and position our portfolio of products within the ever-changing business environment.
3
Table of Contents
Track Record of Targeted Growth. We have a demonstrated history of achieving targeted growth by expanding into new, fast-growing geographic markets, generating growth in our higher margin businesses and enhancing our product offerings by drawing on our core competencies to extend our existing technologies into adjacent markets. We believe that the experience and knowledge gained through our history of innovation and track record of successfully entering new markets enables us to identify and capitalize on future growth opportunities.
| • | We have, for example, grown our presence in emerging markets (specifically Asia (predominately in the greater China region) and Brazil), as demonstrated by the increase in net sales in these markets to 37% of total net sales in 2011 as compared to 36% of total net sales in 2009. We have updated facilities and increased headcount to expand our operations in the greater China region, which is now home to three state-of-the-art facilities and 600 employees. We are focused on continuing to increase our presence in emerging markets. |
| • | We generated 78% of our 2011 net sales from our higher growth, higher margin Industrial segment, compared to 61% of our net sales in 2005. |
| • | We have significantly expanded our Offshore Solutions business over the last six years, representing a 2005-2011 net sales compound annual growth rate of over 12%. |
Strong Free Cash Flow Generation. Our high gross profit margins, combined with the low capital expenditure requirements and low fixed cost structure that result from our “asset-lite, high-touch” business model, allow us to generate strong free cash flow through all economic cycles. Our fixed asset base is modern and well-maintained and, accordingly, requires low, and often discretionary, capital expenditures. Our fixed manufacturing costs during 2011 were approximately 11% of our 2011 net sales, and our maintenance capital expenditures, which are capital expenditures made to upgrade our existing assets, during 2011 were approximately 0.6% of our 2011 net sales. Our business model has allowed us to generate free cash flow even during economic downturns, including the global economic downturn that began in 2008. For example, in the year ended December 31, 2009, we generated $49.0 million in net cash flows provided by operating activities, and we used $6.5 million for capital expenditures and received $2.6 million of proceeds from the disposition of fixed assets.
Our key proprietary technology, service oriented business model and the high costs our customers would incur to switch suppliers have allowed us to achieve stable, industry-leading margins throughout our history and have protected our market share. The following chart highlights the stability of our margins since 1995:
Stable Financial Performance Through Economic Cycles
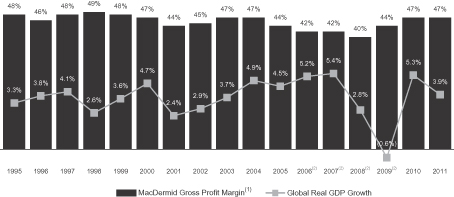
| (1) | Gross profit is defined as net sales minus cost of sales. The percentages represent gross profit margin, which is defined as gross profit divided by net sales. Gross profit for years 1995 to 2000 is for fiscal years ending March 31. |
| (2) | Gross profit margins are net of discontinued operations. |
4
Table of Contents
Customer, Product, Application, End-Market and Geographic Diversity. We offer a broad range of products and services to diverse end markets, ranging from electronics to printing to offshore oil drilling. As of December 31, 2011, we served more than 3,500 customers globally, with no single customer accounting for more than 3% of our 2011 net sales. We have a significant presence in the rapidly growing Asian and Brazilian markets, with approximately $269 million in 2011 net sales to customers in those regions. In addition, each of our product lines serves numerous and often unrelated end markets. Our customer, product and geographic diversity help to mitigate the effects of any adverse event affecting a specific industry, end market or region.
Limited Raw Material Concentration and Low Exposure to Energy Prices. We use in excess of 1,000 chemicals as raw materials in the manufacture of our proprietary products, with no single raw material representing more than 3% of our cost of sales in 2011. Further, the raw materials that are of greatest importance to our global operations are, in most cases, obtainable from multiple sources worldwide. In addition, energy costs, which have historically been volatile, only represented approximately 2% of our cost of sales in 2011.
Experienced Management Team with Significant Equity Investment. Our senior management team is led by Daniel H. Leever, our chairman and chief executive officer, who has approximately 31 years of experience with the MacDermid business and has been our chief executive officer since 1990. Our senior management team comprised of our executive officers and our divisional business managers has, on average, 29 years of industry experience and 18 years of experience with our company. Our management has been responsible for successfully implementing a number of strategic initiatives designed to enhance growth, improve productivity, reduce costs and expand margins. We believe that our employee ownership, stemming from our history as an employee-owned company including through our profit sharing and employee savings plan, and use of a variable compensation structure has allowed us to maintain throughout our history an “owner mentality” among our workforce that has proven instrumental to our success.
Our Business Strategy
Our business strategy is focused on maximizing cash flow through our “asset-lite, high-touch” business model with continued emphasis on the “bookends” of our operations—innovation and technical service. Building on our competitive strengths, we intend to continue to grow our business, improve profitability and strengthen our balance sheet by pursuing the following integrated strategies:
Build Our Core Businesses. We believe that we can capitalize on our technical capabilities, sophisticated process know-how, strong customer relationships and deep industry knowledge to enhance growth and generate significant free cash flow.
| • | Extend Product Breadth: We intend to extend many of our product offerings through the development of new applications for our existing products in our existing markets. For example, we are extending our |
5
Table of Contents
| capabilities for films used in in-mold decoration for high-end automotive interiors to exteriors and other applications. We are also leveraging our capabilities in plating technology in printed circuits and automotive applications to meet the emerging technological and environmental needs of our customers. |
| • | Continue to Grow Internationally with Our Customers: We intend to continue to grow internationally by expanding our product sales to our existing multinational customers as they penetrate emerging regions. We continue to make investments, especially in technical staff, in high-growth markets such as the greater China region and Brazil in order to better service our customers. |
Leverage our Capabilities to Grow into New Markets and Applications. Building on our core competencies in product innovation, applications development and technical services, we intend to expand into new high-growth markets and extend our existing technologies to develop new products for new applications in markets that are adjacent to those we currently serve. Examples of our initiatives include:
| • | Plating for Solar Cell Metallization: We are developing a chemistry solution using light-induced, electroless silver technology to enhance the conductivity and reduce the usage of screened silver paste on solar cells that will result in a higher manufacturing yield from such solar cells at a lower cost to our customers. In the longer term, we believe that we can extend our technology to create a new way of manufacturing crystalline silicon solar cells and eliminate the need for silver paste. |
| • | Plating for Molded Interconnect Devices: We are extending our “plating on plastics” technology into antenna manufacturing for smartphones. We believe that our technology results in a higher manufacturing yield and lower cost to our customers. We believe that we increased our market share in this product in 2011. |
| • | Light-Emitting Diode (LED) Lighting Market: We are developing products for thermal management systems and using silver as a wire-bondable and reflective finish option to enhance energy conversion into light. |
| • | High Value PET Recycling: As worldwide demand for recycled polyethylene terephthalate (PET) grows, we are leveraging our strong position in Europe for specialized cleaners and defoamers that are used in recycling plastic products made of PET to expand that business globally, especially in emerging markets such as the greater China region and South America. Our specialized cleaners and defoamers enable recycled PET to be used in higher value applications such as bottle resin. |
| • | Digital Flexographic Printing: We have developed an innovative LUX® process, which uses a flat top dot processing technology that significantly increases the quality and consistency of the printed image from a flexographic printing plate in a manner that is more efficient and cost effective for our customers. |
| • | Metals: We believe the metals industry presents an opportunity to introduce new products, and extend existing products, in an adjacent market. We define the metals industry as flat-rolled steel producers and processors, aluminum producers (including can making), and tube and pipe extruding. We have been successful at penetrating the steel market with our tin plating chemistries, including cleaners and passivates. We have hired specialists in rolling lubricants and metal pre-treatment with the expectation of rapid expansion of our business in this market. We believe the addressable market for metals is over $750 million. |
Maintain Our Technology Leadership Position. Our continued success in product innovation and applications development is a result of our focused commitment to technology research and development. This commitment has historically allowed us to sustain and enhance growth and profitability and further penetrate our target markets, including our existing customer base. Because the highly technical service we provide to our customers is an integral part of their successful use of our products, our service personnel become well acquainted with our customers. These close customer relationships enable us to identify and forecast the needs of our customers and draw upon our intellectual property portfolio and technological expertise to create new products.
6
Table of Contents
Continue to Pursue Operational Efficiencies. We consistently focus on opportunities to reduce operating expenses through facility optimization, product and raw material rationalization and by maintaining a relatively low fixed cost structure that supports our growth strategy. In 2009, during the economic crisis, we permanently reduced costs by over $40 million annually by closing certain manufacturing facilities and executing a series of operational restructuring initiatives that streamlined our organizational structure and reduced our workforce in our manufacturing and general and administrative functions. These cost reductions resulted in an increase in our Adjusted EBITDA margin for 2011 by over 48.1% compared to 2009. Net income attributable to MacDermid, Incorporated was $1.0 million in 2011 compared to a net loss attributable to MacDermid, Incorporated of $82.8 million in 2009. For a reconciliation of net income (loss) attributable to MacDermid, Incorporated to Adjusted EBITDA, see “—Summary Consolidated Financial Data” and the footnotes contained therein. Our operational restructuring initiatives were primarily responsible for an increase in our gross profit margin percentage from 43.8% for the year ended December 31, 2009 to 46.7% for the year ended December 31, 2011, representing a 6.6% increase.
Maximize Cash Flow. Our ability to maintain strong cash flows results from our business model and growth strategies. Historically, we have been able to generate significant cash flow as a result of the low capital expenditure requirements and low fixed cost structure that result from our “asset-lite, high-touch” business model and by focusing on growing our higher margin businesses. We intend to continue to focus on maximizing our cash flow because it enables us to further invest in our business, reduce our debt and provide value to our stockholders.
Focus on Human Capital. The success of our business depends on our ability to continue to capitalize on our technical capabilities, unique process know-how, strong customer relationships and industry knowledge. Our technical expertise and history of innovation reflect the specialized and highly skilled nature of our research and development personnel. Our strong customer relationships and familiarity with our local markets result from the work of our highly talented and experienced sales and service personnel. As such, we intend to continue to focus on attracting, retaining and developing the best human talent across all levels of our organization, which is key to our ability to successfully operate and grow our business.
Risks Related to Our Business
Investing in our common stock involves substantial risk, and our ability to successfully operate our business is subject to numerous risks, including those that are generally associated with our industry. Any of the risks set forth in this prospectus under the heading “Risk Factors” may limit our ability to successfully execute our business strategy. Some of the principal challenges or risks facing the company include, among others:
| • | Our products are sold in industries that are sensitive to general economic conditions. If there are delays or reductions in the purchasing of our customers’ products as a result of economic downturns, demand for our products and services would decline, and our net sales would be adversely affected. |
| • | Our business model is focused on limiting investments in fixed assets and capital expenditures. However, the markets for our proprietary technology and our customers’ needs are frequently changing, which makes it difficult for us to forecast the need for increases in capital expenditures and assets. If we do elect to increase capital expenditures, but such expenditures and any costs incurred as a result of a more capital-intensive asset base are not offset by increases in net sales, our business and financial condition may be harmed. |
| • | Our industry is intensely competitive, and some of our competitors may have greater financial, technical and marketing resources than we do and may devote greater resources to promoting and selling certain products. If we do not develop and deploy new cost effective products, processes and technologies on a timely basis and adapt to changes in our industry and the global economy, our reputation may be harmed, we may lose customers and our market share may decline. |
7
Table of Contents
| • | We have substantial international operations, and our operational success depends on our ability to adapt to and prevail in different legal, regulatory, economic, social and political conditions. Further, the success of our business in emerging markets requires us to respond effectively to rapid changes in conditions in these countries. |
| • | Our proprietary technology is critically important to our business, and the failure of our patents, applicable intellectual property law or our confidentiality agreements to protect our intellectual property and other proprietary information could significantly harm our ability to compete in our industry and could materially adversely affect our business and results of operations. |
| • | Our business is subject to various governmental regulations and laws, compliance with which may cause us to incur significant expenses, and if we fail to maintain satisfactory compliance with certain regulations, we could be subject to civil or criminal penalties. |
| • | We are focused on research and development and on highly technical customer service and, accordingly, we rely on our ability to attract and retain skilled employees. The departure of certain key personnel could have an adverse impact on our operations, including, for example, as a result of customers choosing to follow a regional manager to one of our competitors. |
| • | We have a substantial amount of indebtedness, which could adversely affect our financial position. |
In addition to the foregoing, you should carefully consider all of the information set forth in this prospectus and, in particular, should evaluate the specific risks set forth in this prospectus under the heading “Risk Factors” in deciding whether to invest in our common stock.
8
Table of Contents
Corporate Information
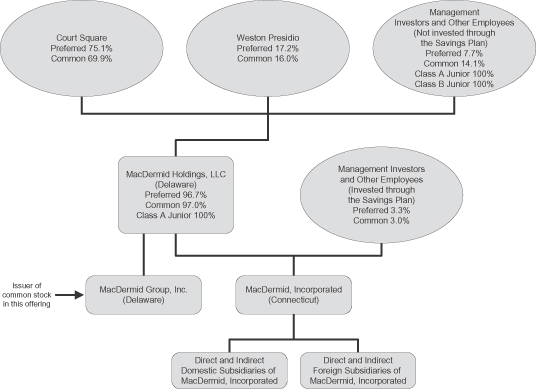
MacDermid Group, Inc. was incorporated in Delaware on June 17, 2011. In connection with, and immediately prior to the completion of, this offering, the existing shareholders of MacDermid, Incorporated will exchange the capital stock of MacDermid, Incorporated for the common stock of MacDermid Group, Inc., and MacDermid Holdings, LLC will liquidate and distribute the shares of MacDermid Group, Inc. then held by it to the holders of its membership interests. Prior to the completion of this offering, MacDermid Group, Inc. is a direct, wholly owned subsidiary of MacDermid Holdings, LLC and has no material assets. The diagram below illustrates our corporate structure immediately prior to the consummation of this offering and reflects actual ownership as of March 31, 2012, giving effect to the cancellation of all treasury shares.
9
Table of Contents
Following the completion of this offering, MacDermid Group, Inc. will be a holding company with no material assets other than its direct 100% ownership interest in MacDermid, Incorporated, which is the main U.S. operating entity for the MacDermid business and the direct or indirect parent entity of all the MacDermid operating companies. The diagram below illustrates our corporate structure immediately following completion of this offering (and assumes a public offering price of $ (the midpoint of the range set forth on the cover of this prospectus)):

Please refer to “The Corporate Reorganization” for additional information about the corporate structure of the MacDermid entities.
Assuming a public offering price of $ (the midpoint of the range set forth on the cover of this prospectus), immediately following the completion of this offering, Court Square will own % and Weston Presidio will own % of our common stock, or % and % of our common stock, respectively, if the underwriters exercise their over-allotment option in full. Accordingly, we will be a “controlled company” within the meaning of the New York Stock Exchange corporate governance standards. As our largest stockholder, Court Square will exercise significant influence over all matters requiring stockholder approval, and Court Square and Weston Presidio collectively will control all matters requiring stockholder approval, including the election of directors, amendment of our certificate of incorporation and approval of significant corporate transactions.
MacDermid, Incorporated
MacDermid, Incorporated, the main U.S. operating entity for the MacDermid business and the direct or indirect parent entity of all the MacDermid operating companies, was established in Waterbury, Connecticut in 1922. On May 9, 1966, shares of MacDermid, Incorporated common stock were registered for trading. From June 22, 1966 to February 8, 1971, the shares traded on the over-the-counter system of trading and from February 8, 1971, when the NASDAQ stock exchange began trading, to February 25, 1998, the shares traded on
10
Table of Contents
the NASDAQ stock exchange. From February 26, 1998 to April 12, 2007, shares of MacDermid, Incorporated traded on the New York Stock Exchange under the symbol “MRD”. On April 12, 2007, MacDermid, Incorporated was acquired by MDI Holdings, LLC, an entity formed by Court Square, Weston Presidio and Daniel H. Leever, our chairman and chief executive officer. MDI Holdings, LLC was the predecessor entity to MacDermid Holdings, LLC.
Principal Stockholders
Court Square Capital Partners
Court Square Capital Partners was formed in 2006 when the entire investment team of Citigroup Venture Capital spun out to form a new entity. Court Square Capital Partners manages investment funds with over $5 billion of assets, including Court Square Capital Partners I, LP and Court Square Capital Partners II, LP. Since 1969, Court Square Capital Partners and its predecessor, Citigroup Venture Capital, have closed over 250 transactions, including investments in Southern Graphics, Fairchild Semiconductor, Intersil, Euramax, Polyfibron Technologies, Triumph Group, Worldspan, Mohawk Carpet, Plantronics and York International. Court Square Capital Partners has a long standing relationship with the company. Joseph M. Silvestri, a managing partner of Court Square Capital Partners II, L.P., has been a director of MacDermid, Incorporated since 1999.
Assuming a public offering price of $ (the midpoint of the range set forth on the cover of this prospectus), immediately following the completion of this offering, Court Square will own approximately %, or % if the underwriters exercise their over-allotment option in full, of the aggregate outstanding common stock of MacDermid Group, Inc.
Weston Presidio
Weston Presidio, founded in 1991, is a private equity firm that has managed five investment funds aggregating over $3.3 billion of assets. The firm focuses its investment activities on growth companies in the consumer, business services and industrial growth sectors. With offices in Boston and San Francisco, Weston Presidio targets middle-market opportunities primarily in the United States. Assuming a public offering price of $ (the midpoint of the range set forth on the cover of this prospectus), immediately following the completion of this offering, Weston Presidio will own approximately %, or % if the underwriters exercise their over-allotment option in full, of the aggregate outstanding common stock of MacDermid Group, Inc.
Our Stockholder Philosophy
In addition to our long heritage of innovation and product leadership, we believe that certain principles dictate our relationship with our stockholders. Chief among these core business principles are the following:
| • | We believe our relationship with our employees is fundamental to our ability to compete effectively. Much of our ability to compete revolves around our employees’ ability to invent new products and supply sales and service support to our customers. Approximately 50% of our employees are involved in these functions. As a result, we believe it is imperative that we continue policies that reward long tenure. |
| • | We develop new products and enter adjacent markets often involving multiyear horizons. We are committed to pursuing these opportunities even if short-term results are affected. |
| • | We focus on building intrinsic value. We place emphasis on strategic growth in targeted focus areas. We measure intrinsic value, the present value of future cash flows, on a per share basis. We believe important factors in our ability to maintain and increase intrinsic value are relatively high margins and a low cost structure. |
| • | We are dedicated to maintaining a conservative investment approach and our belief that the return of capital through stock repurchases and dividends can be the most attractive use of capital. |
11
Table of Contents
| • | We are committed to high standards of personal and corporate ethics and responsibility. |
| • | We hold a conviction that frequent, candid and reliable communications by our management are key to a successful relationship with our stockholders. We believe that, given the complex and unpredictable nature of the factors that drive demand for our products, it is not in the best interests of our stockholders for us to provide quarterly or annual “guidance” regarding future operating results. |
We believe that the relationship between our company and our stockholders should be a partnership between like-minded parties, who are committed to these core principles while working toward a common goal. We hope that the individuals and entities purchasing our common stock in this offering will consider their investment in our common stock as a significant part of their long-term investment portfolio. Ideally, our stockholders will be individuals and entities that:
| • | recognize that investing in our common stock is tantamount to acquiring a portion of our business and, accordingly, develop and maintain a comprehensive understanding of our company and the characteristics that differentiate us from our competitors; and |
| • | desire an active role in exercising their rights as stockholders, including by voting their shares of common stock at our stockholder meetings and by reaching out to our management team when questions about our company or its operations arise. |
Terms Used in This Prospectus
Except where the context otherwise requires or where otherwise indicated, all references herein to (a) the “company”, “we”, “us” and “our” refer to, prior to the completion of this offering, MacDermid, Incorporated and its consolidated subsidiaries and, after the completion of this offering, MacDermid Group, Inc. and its consolidated subsidiaries (which will include MacDermid, Incorporated); (b) “Court Square” refer to the affiliates and funds of Court Square Capital Partners that, prior to the completion of this offering, hold membership interests in MacDermid Holdings, LLC and, following the completion of this offering, will own common stock of MacDermid Group, Inc.; and (c) “Weston Presidio” refer to Weston Presidio V, L.P. and its affiliates that, prior to the completion of this offering, hold membership interests in MacDermid Holdings, LLC, and, following the completion of this offering, will own common stock of MacDermid Group, Inc. References herein to “MacDermid Holdings, LLC”, “MacDermid Group, Inc.” and “MacDermid, Incorporated” refer only to each such entity and not to any of its subsidiaries.
Industry and Market Data
We obtained the industry, market and competitive position data described or referred to throughout this prospectus from our own internal estimates and research as well as from industry and general publications and research, surveys and studies conducted by third parties. Prismark Partners LLC is the primary source for our third-party data and forecasts relating to our Electronic Solutions business.
Industry publications, studies and surveys generally state that they have been obtained from sources believed to be reliable. While we believe our internal company estimates and research are reliable and the market definitions are appropriate, neither such research nor these definitions have been verified by any independent source.
MacDermid®, LUX® and the MacDermid logo are our trademarks. Brand names, trademarks, service marks and trade names of other companies and organizations used in this prospectus are for informational purposes only and may be the property of their respective owners.
12
Table of Contents
THE OFFERING
| Common stock offered by us |
shares |
| Common stock to be outstanding after this offering |
shares |
| Over-allotment option |
The underwriters have an option to purchase a maximum of additional shares of common stock from us to cover over-allotments. The underwriters could exercise this option at any time within 30 days from the date of this prospectus. |
| Use of proceeds |
We intend to use the net proceeds from this offering to repay, redeem or repurchase a portion of MacDermid, Incorporated’s outstanding indebtedness and to pay certain fees and expenses as set forth under “Use of Proceeds”. |
| Dividend policy |
We intend to pay quarterly cash dividends in an amount equal to $ per share following completion of this offering. Whether we will do so, however, and the timing and amount of those dividends, will be subject to approval and declaration by our board of directors and will depend on a variety of factors, including the financial results, cash requirements and financial condition of the company, our ability to pay dividends under the agreement governing our senior secured credit facilities, the indenture governing our senior subordinated notes and any other applicable contracts, and other factors deemed relevant by our board of directors. |
| Because MacDermid Group, Inc. is a holding company, its cash flow and ability to pay dividends are dependent upon the financial results and cash flows of MacDermid, Incorporated and its subsidiaries and the distribution or other payment of cash to MacDermid Group, Inc. in the form of dividends or otherwise. |
| Risk factors |
Investing in our common stock involves a high degree if risk. See “Risk Factors” for a discussion of factors you should carefully consider before deciding to invest in our common stock. |
| Proposed New York Stock Exchange symbol |
“MRD” |
Unless otherwise indicated, the number of shares of common stock that will be outstanding after this offering:
| • | assumes the consummation of the Corporate Reorganization, which will be a condition to the consummation of this offering; |
| • | excludes approximately shares of our common stock that will be reserved for issuance under our compensation plans following the Corporate Reorganization; |
| • | assumes no exercise of the underwriters’ over-allotment option to purchase additional shares of our common stock; and |
| • | assumes the initial offering price will be $ per share (the midpoint of the range set forth on the cover of this prospectus). |
13
Table of Contents
SUMMARY CONSOLIDATED FINANCIAL DATA
MacDermid Group, Inc. was incorporated in Delaware on June 17, 2011. Prior to the completion of this offering, MacDermid Group, Inc. will have no material assets. Following the completion of this offering, MacDermid Group, Inc. will own all of the outstanding capital stock of MacDermid, Incorporated, which is the main U.S. operating entity for the MacDermid business and the direct or indirect parent entity of all the MacDermid operating companies, and the consolidated financial statements of MacDermid Group, Inc. will reflect the assets, liabilities and results of operations of MacDermid, Incorporated and its subsidiaries. Accordingly, the following table sets forth the summary consolidated financial data of MacDermid, Incorporated and its subsidiaries for the years ended December 31, 2011, 2010 and 2009 and as of December 31, 2011 and 2010, which have been derived from the audited financial statements included elsewhere in this prospectus. The following table also presents the summary consolidated financial data of MacDermid, Incorporated and its subsidiaries for the three months ended March 31, 2012 and 2011 and as of March 31, 2012, which have been derived from the unaudited financial statements included elsewhere in this prospectus. The unaudited financial statements have been prepared on the same basis as the audited financial statements and, in the opinion of our management, include all adjustments, including normal recurring adjustments, necessary for a fair presentation in all material respects of the information set forth therein. Results for any historical period are not necessarily indicative of results for any future period.
This summary consolidated financial data should be read in conjunction with, and is qualified by reference to, “Use of Proceeds”, “Capitalization”, “Management’s Discussion and Analysis of Financial Condition and Results of Operations” and the consolidated financial statements and notes thereto included elsewhere in this prospectus.
| Year ended December 31, | Three months ended March 31, |
|||||||||||||||||||
| 2011 | 2010 | 2009 | 2012 | 2011 | ||||||||||||||||
| (amounts in thousands) | (unaudited) | |||||||||||||||||||
| Statement of Operations Data: |
||||||||||||||||||||
| Net sales |
$ | 728,773 | $ | 694,333 | $ | 594,153 | $ | 182,195 | $ | 178,521 | ||||||||||
| Cost of sales |
388,298 | 371,223 | 333,963 | 95,884 | 94,980 | |||||||||||||||
|
|
|
|
|
|
|
|
|
|
|
|||||||||||
| Gross profit |
340,475 | 323,110 | 260,190 | 86,311 | 83,541 | |||||||||||||||
| Operating expenses: |
||||||||||||||||||||
| Selling, technical and administrative |
185,649 | 179,786 | 156,508 | 45,746 | 45,629 | |||||||||||||||
| Research and development |
22,966 | 21,005 | 20,103 | 6,718 | 5,359 | |||||||||||||||
| Amortization |
28,578 | 29,694 | 29,868 | 6,655 | 7,362 | |||||||||||||||
| Restructuring(1) |
896 | 6,234 | 4,228 | 114 | (181 | ) | ||||||||||||||
| Impairment charges(2) |
46,438 | — | 68,692 | — | — | |||||||||||||||
|
|
|
|
|
|
|
|
|
|
|
|||||||||||
| Total operating expenses |
284,527 | 236,719 | 279,399 | 59,233 | 58,169 | |||||||||||||||
|
|
|
|
|
|
|
|
|
|
|
|||||||||||
| Operating profit (loss) |
55,948 | 86,391 | (19,209 | ) | 27,078 | 25,372 | ||||||||||||||
| Other income (expense): |
||||||||||||||||||||
| Interest income |
500 | 696 | 458 | 175 | 108 | |||||||||||||||
| Interest expense(3) |
(54,554 | ) | (56,196 | ) | (60,740 | ) | (13,556 | ) | (14,088 | ) | ||||||||||
| Miscellaneous income (expense)(4) |
9,412 | 15,106 | (5,020 | ) | (4,353 | ) | (16,172 | ) | ||||||||||||
|
|
|
|
|
|
|
|
|
|
|
|||||||||||
| Income (loss) from continuing operations before income taxes, non-controlling interest and accumulated payment-in-kind dividend on cumulative preferred shares |
11,306 | 45,997 | (84,511 | ) | 9,344 | (4,780 | ) | |||||||||||||
| Income tax (expense) benefit(3) |
(9,953 | ) | (21,723 | ) | 6,427 | (4,366 | ) | (1,145 | ) | |||||||||||
|
|
|
|
|
|
|
|
|
|
|
|||||||||||
| Income (loss) from continuing operations |
1,353 | 24,274 | (78,084 | ) | 4,978 | (5,925 | ) | |||||||||||||
| (Loss) income from discontinued operations, net of tax(5) |
— | — | (4,448 | ) | — | — | ||||||||||||||
|
|
|
|
|
|
|
|
|
|
|
|||||||||||
| Income (loss) from continuing operations |
1,353 | 24,274 | (82,532 | ) | 4,978 | (5,925 | ) | |||||||||||||
| Less net income attributable to the non-controlling interest |
(366 | ) | (343 | ) | (295 | ) | (91 | ) | (88 | ) | ||||||||||
|
|
|
|
|
|
|
|
|
|
|
|||||||||||
| Net income (loss) attributable to MacDermid, Incorporated |
987 | 23,931 | (82,827 | ) | 4,887 | (6,013 | ) | |||||||||||||
| Accrued payment-in-kind dividend on cumulative preferred shares |
(40,847 | ) | (37,361 | ) | (34,124 | ) | (10,788 | ) | (9,874 | ) | ||||||||||
|
|
|
|
|
|
|
|
|
|
|
|||||||||||
| Net (loss) attributable to common shares |
$ | (39,860 | ) | $ | (13,430 | ) | $ | (116,951 | ) | $ |
(5,901 |
) |
$ | (15,887 | ) | |||||
|
|
|
|
|
|
|
|
|
|
|
|||||||||||
14
Table of Contents
| Year ended December 31, | Three months ended March 31, |
|||||||||||||||||||
| 2011 | 2010 | 2009 | 2012 | 2011 | ||||||||||||||||
| (amounts in thousands, except share and per share amounts) | (unaudited) | |||||||||||||||||||
| Other Data: |
||||||||||||||||||||
| EBITDA(6)(8) (unaudited) |
$ | 112,239 | $ | 148,394 | $ | 19,291 | $ | 33,958 | $ | 20,675 | ||||||||||
| Adjusted EBITDA(7)(8) (unaudited) |
$ | 151,723 | $ | 138,443 | $ | 102,463 | $ | 38,533 | $ | 37,165 | ||||||||||
| Net (loss) attributable to MacDermid, Incorporated per share(9) |
||||||||||||||||||||
| Basic: |
||||||||||||||||||||
| (Loss) from continuing operations |
$ | (4.01 | ) | $ | (1.35 | ) | $ | (11.30 | ) | $ | (0.59 | ) | $ | (1.60 | ) | |||||
| (Loss) from discontinued operations |
$ | — | $ | — | $ | (0.45 | ) | $ | — | $ | — | |||||||||
| Net loss |
$ | (4.01 | ) | $ | (1.35 | ) | $ | (11.75 | ) | $ | (0.59 | ) | $ | (1.60 | ) | |||||
| Diluted: |
||||||||||||||||||||
| (Loss) from continuing operations |
$ | (4.01 | ) | $ | (1.35 | ) | $ | (11.30 | ) | $ | (0.59 | ) | $ | (1.60 | ) | |||||
| (Loss) from discontinued operations |
$ | — | $ | — | $ | (0.45 | ) | $ | — | $ | — | |||||||||
| Net loss |
$ | (4.01 | ) | $ | (1.35 | ) | $ | (11.75 | ) | $ | (0.59 | ) | $ | (1.60 | ) | |||||
| Weighted Average Shares Outstanding |
||||||||||||||||||||
| Basic |
9,942,777 | 9,932,862 | 9,951,799 | 9,946,419 | 9,932,132 | |||||||||||||||
| Diluted |
9,942,777 | 9,932,862 | 9,951,799 | 9,946,419 | 9,932,132 | |||||||||||||||
| Pro forma net income per share(10) (unaudited) |
||||||||||||||||||||
| Basic and diluted |
$ | 0.03 | $ | 0.16 | ||||||||||||||||
| Pro forma weighted average number of common shares outstanding (unaudited) |
||||||||||||||||||||
| Basic |
31,387,359 | 31,387,539 | ||||||||||||||||||
| Diluted |
31,509,558 | 31,509,558 | ||||||||||||||||||
| As of March 31, 2012 | ||||
| (unaudited) | ||||
| (amounts in thousands) | ||||
| Balance Sheet Data: |
||||
| Cash and cash equivalents |
$ | 109,311 | ||
| Total assets |
$ | 1,232,981 | ||
| Current installments of long-term debt and capital lease obligations and short-term notes payable |
$ | 11,024 | ||
| Long-term debt and capital lease obligations (excluding current portion) |
$ | 719,412 | ||
| Total debt and capital lease obligations and short-term notes payable |
$ | 730,436 | ||
| Total stockholders’ equity |
$ | 252,865 | ||
| (1) | Charges in the three months ended March 31, 2012 and 2011 and the years ended December 31, 2011, 2010 and 2009 relate to amounts recorded in connection with our operational restructuring initiatives. For a detailed description of these operational restructuring initiatives, see the discussion in “Management’s Discussion and Analysis of Financial Condition and Results of Operations”, Note 20 to our audited financial statements and Note 14 to our unaudited financial statements included in this prospectus. |
| (2) | In 2011, we recorded impairment charges of $46.4 million related to a write down of our customer list intangible assets to their estimated fair value as determined in accordance with ASC 360 “Property, Plant and Equipment” (“ASC 360”). In 2009, we recorded (i) impairment charges of $41.2 million related to a write down of our goodwill balance to its estimated fair value as determined in accordance with ASC 350 “Intangibles—Goodwill and Other” (“ASC 350”), (ii) an impairment charge of $26.1 million related to a write down of an indefinite-lived purchased intangible asset to its estimated fair value as determined in accordance with ASC 350, (iii) an impairment charge of $0.2 million related to a write down of a finite-lived purchased intangible asset to its estimated fair value as determined in accordance with ASC 360 and (iv) an impairment charge of $1.2 million related to a write down of equipment to its estimated fair value as determined in accordance with ASC 360. For a detailed description of these impairment charges, see “Management’s Discussion and Analysis of Financial Condition and Results of Operations” and Note 5 to our audited financial statements included in this prospectus. |
| (3) | Primarily reflects interest expense associated with our long-term debt for periods after the acquisition of MacDermid, Incorporated by MDI Holdings, LLC in 2007. Giving pro forma effect to (i) the sale by us of shares of our common stock in this offering at an assumed initial offering price of $ per share (the midpoint of the range set forth on the cover of this prospectus) after deducting the estimated underwriting discounts and commissions and estimated offering expenses payable by us and (ii) the application of the net proceeds therefrom as described in “Use of Proceeds”, and assuming such proceeds had been so applied on January 1, 2011, interest expense for the year ended December 31, 2011 and the three months ended March 31, 2012 would have been $ million and $ million, respectively, and income tax (expense) benefit for the year ended December 31, 2011 and the three months ended March 31, 2012 would have been $ million and $ million, respectively. See “Use of Proceeds”. |
| (4) | Represents remeasurement (gain) loss on foreign denominated debt as a result of changes in foreign exchange rates. For a detailed description of these remeasurement gains/losses, see the discussion of our miscellaneous (expense) income in “Management’s Discussion and Analysis of Financial Condition and Results of Operations”, Note 17 to our audited financial statements and Note 13 to our unaudited financial statements included in this prospectus. |
| (5) | Reflects loss (gain) from discontinued operations related to the sale of our Offset Printing Blankets business (“Offset”) in 2008. All operating results exclude amounts associated with discontinued operations. |
15
Table of Contents
| (6) | EBITDA represents net (loss) income attributable to MacDermid, Incorporated before interest, taxes, depreciation and amortization. EBITDA is a non-U.S. GAAP measure. We present EBITDA because it is used by management to evaluate operating performance. We consider EBITDA an important supplemental measure of our performance because the calculation adjusts for items that we believe are not indicative of our core operating performance. Our management uses EBITDA to evaluate the operating performance of our business, to aid in period-to-period comparability, for planning and forecasting purposes and to measure results against forecasts. We believe EBITDA is also useful to investors because it is a measure frequently used by securities analysts, investors and others in the evaluation of companies. |
We also use EBITDA because the 9.5% senior subordinated notes due 2017 of MacDermid, Incorporated (the “Senior Subordinated Notes”) and MacDermid, Incorporated’s senior secured credit facilities (the “Credit Facilities”) rely on EBITDA (with additional adjustments) to measure our ability to, among other things, incur additional indebtedness and to make payments, including dividends, that are subject to restrictions under our debt agreements.
EBITDA has limitations as an analytical tool, and it does not represent, and should not be considered an alternative to, net (loss) income or operating (loss) earnings as those terms are defined by U.S. GAAP. Some of these limitations are:
| • | EBITDA does not reflect our cash expenditures, or future requirements, for capital expenditures; |
| • | EBITDA does not reflect changes in, or cash requirements for, our working capital needs; |
| • | EBITDA does not reflect the significant interest expense, or the cash requirements necessary to service interest or principal payments, on our debt; and |
| • | although depreciation and amortization are non-cash charges, the assets being depreciated and amortized will often have to be replaced in the future, and EBITDA does not reflect any cash requirements for such replacements. |
We compensate for these limitations by relying primarily on our GAAP results and using EBITDA only supplementally. See the consolidated statements of cash flows included in the consolidated financial statements of MacDermid, Incorporated included elsewhere in this prospectus. Please see footnote (8) below for a reconciliation of net income (loss) attributable to MacDermid, Incorporated to EBITDA.
| (7) | We present Adjusted EBITDA as a further supplemental measure of our performance. We use Adjusted EBITDA to compare our operating performance over various reporting periods because we believe it provides the most meaningful view of our ongoing operations since it removes from our operating results the impact of items that do not reflect our core operating performance. We believe Adjusted EBITDA is helpful to investors and other interested parties because it provides such persons with the same information that our management uses internally for purposes of assessing our operating performance. |
We prepare Adjusted EBITDA by adjusting EBITDA to eliminate the impact of a number of items. We explain how each adjustment is derived in the subsequent footnote. Potential investors are encouraged to evaluate each adjustment for supplemental analysis. As an analytical tool, Adjusted EBITDA is subject to all the limitations applicable to EBITDA. In addition, other companies in our industry may calculate Adjusted EBITDA differently than we do, limiting its usefulness as a comparative measure. In evaluating Adjusted EBITDA, you should also be aware that in the future we may incur expenses similar to the adjustments in this presentation. Our presentation of Adjusted EBITDA should not be construed as an inference that our future results will be unaffected by unusual items.
| (8) | We reconcile net income (loss) attributable to MacDermid, Incorporated to EBITDA and Adjusted EBITDA as follows: |
| Year ended December 31, | Three months ended March 31, |
|||||||||||||||||||
| 2011 | 2010 | 2009 | 2012 | 2011 | ||||||||||||||||
| (amounts in thousands) | (unaudited) | |||||||||||||||||||
| Net income (loss) attributable to MacDermid, Incorporated |
$ | 987 | $ | 23,931 | $ | (82,827 | ) | $ | 4,887 | $ | (6,013 | ) | ||||||||
| Provision (benefit) for income taxes |
9,953 | 21,723 | (6,427 | ) | 4,366 | 1,145 | ||||||||||||||
| Interest expense |
54,554 | 56,196 | 60,740 | 13,556 | 14,088 | |||||||||||||||
| Depreciation expense |
18,167 | 16,850 | 17,937 | 4,494 | 4,093 | |||||||||||||||
| Amortization expense |
28,578 | 29,694 | 29,868 | 6,655 | 7,362 | |||||||||||||||
|
|
|
|
|
|
|
|
|
|
|
|||||||||||
| EBITDA (unaudited) |
$ | 112,239 | $ | 148,394 | $ | 19,291 | $ | 33,958 | $ | 20,675 | ||||||||||
| Remeasurement adjustment on foreign denominated debt(a) |
$ | (9,156 | ) | $ | (17,395 | ) | $ | 5,067 | $ | 4,316 | $ | 16,448 | ||||||||
| Equity compensation expense(b) |
727 | 389 | 337 | 98 | 98 | |||||||||||||||
| Restructuring expense(c) |
896 | 6,234 | 4,228 | 114 | (181 | ) | ||||||||||||||
| Impairment charges(d) |
46,438 | — | 68,692 | — | — | |||||||||||||||
| Inventory write-down(e) |
— | 423 | — | — | — | |||||||||||||||
| (Loss) income from discontinued operations, net of tax(f) |
— | — | 4,448 | — | — | |||||||||||||||
| Sponsor management fees(g) |
579 | 398 | 400 | 47 | 125 | |||||||||||||||
|
|
|
|
|
|
|
|
|
|
|
|||||||||||
| Adjusted EBITDA (unaudited) |
$ | 151,723 | $ | 138,443 | $ | 102,463 | $ | 38,533 | $ | 37,165 | ||||||||||
|
|
|
|
|
|
|
|
|
|
|
|||||||||||
16
Table of Contents
| (a) | Represents remeasurement (gain) loss on foreign denominated debt as a result of changes in foreign exchange rates. Please refer to “Management’s Discussion and Analysis of Financial Condition and Results of Operations”, Note 17 to our audited financial statements and Note 13 to our unaudited financial statements included in this prospectus for an additional discussion of these gains/losses. |
| (b) | Reflects non-cash stock compensation expense per ASC 718 “Compensation—Stock Compensation”. |
| (c) | Reflects (i) for the three months ended March 31, 2012, charges related to headcount reductions in our Industrial segment and revisions to accruals related to restructuring, (ii) for the three months ended March 31, 2011, the reversal of charges related to accrued benefits no longer due to employees in our Industrial Europe operations and the reversal of estimated legal costs that were no longer required at our corporate business unit, (iii) in the year ended December 31, 2011, charges related to headcount reductions in our Industrial segment, the reversal of charges related to accrued benefits no longer due to employees in our Industrial Europe operations and the reversal of estimated legal costs that were no longer required at our corporate business unit, (iv) in the year ended December 31, 2010, charges related to headcount reductions in our Industrial segment, charges for lease termination cost and long-term asset write-down expense in our Industrial Europe operations and (v) in the year ended December 31, 2009, charges related to headcount reductions in our Industrial segment and charges related to the moving of certain manufacturing facilities. Please refer to “Management’s Discussion and Analysis of Financial Condition and Results of Operations”, Note 20 to our audited financial statements and Note 14 to our unaudited financial statements included in this prospectus for an additional discussion of such charges. |
| (d) | Reflects impairment charges of goodwill and intangible assets. Please refer to “Management’s Discussion and Analysis of Financial Condition and Results of Operations” and Note 5 to our audited financial statements included in this prospectus for an additional discussion of such charges. |
| (e) | Reflects inventory that was written off due to our exit from the dry film business in the first quarter of 2010. Please refer to “Management’s Discussion and Analysis of Financial Condition and Results of Operations” for an additional discussion of such costs. |
| (f) | Reflects loss (gain) from discontinued operations related to the sale of Offset in 2008 and the sale of our ColorSpan printing business in 2007. |
| (g) | Reflects management fees paid to Court Square and Weston Presidio pursuant to certain advisory agreements. We will pay fees, as described in “Use of Proceeds”, to Court Square and Weston Presidio in connection with the termination of the advisory agreements and the consummation of this offering; however, following the consummation of this offering, we will no longer pay management fees to Court Square or Weston Presidio. |
| (9) | The net loss per share attributable to MacDermid, Incorporated does not give effect to the Exchange, the effect of which is to reflect (i) the effective conversion of MacDermid, Incorporated’s cumulative preferred stock, including the accumulated payment in kind dividend with respect to such preferred stock at the time of the offering, into common stock of MacDermid Group, Inc. and (ii) the effective payment of a stock preference, in the form of MacDermid Group, Inc. common stock, in respect of MacDermid, Incorporated’s common stock, in each case, in accordance with our applicable governing documents. For further information related to our earnings per share calculations, please refer to Notes 2 and 23 to our audited financial statements and Notes 2 and 17 to our unaudited financial statements included in this prospectus. |
| (10) | The pro forma net income per share gives effect to the Exchange, the effect of which is to reflect (i) the effective conversion of MacDermid, Incorporated’s cumulative preferred stock, including the accumulated payment in kind dividend with respect to such preferred stock at the time of the offering, into common stock of MacDermid Group, Inc. and (ii) the effective payment of a stock preference, in the form of MacDermid Group, Inc. common stock, in respect of MacDermid, Incorporated’s common stock, in each case, in accordance with our applicable governing documents. For further information related to our pro forma net income per share calculations, please refer to Notes 2 and 23 to our audited financial statements and Notes 2 and 17 to our unaudited financial statements included in this prospectus. |
17
Table of Contents
Investing in our common stock involves a high degree of risk. You should carefully consider the risks and uncertainties described below, together with all of the other information in this prospectus, including the financial statements and related notes included elsewhere in this prospectus, before making an investment decision. If any of the following risks are realized, our business, financial condition, results of operations and prospects could be materially and adversely affected. In that event, the trading price of our common stock could decline and you could lose part or all of your investment.
Risks Related to Our Business and Industry
Conditions in the global economy may directly adversely affect our net sales, gross profit and financial condition and may result in delays or reductions in our spending that could have a material adverse effect on our results of operations, prospects and stock price.
Our products are sold in industries that are sensitive to changes in general economic conditions, including the construction, automotive and electronic manufacturing industries. Accordingly, our net sales, gross profit and financial condition depend significantly on general economic conditions and the demand for our specialty chemical products and services in the markets in which we compete. Delays or reductions in our customers’ chemical products purchasing that result from economic downturns would reduce demand for our products and services and could, consequently, have a material adverse effect on our results of operations, prospects and stock price.
During the recent global economic downturn, decreased global automotive demand and production cuts in the automotive markets, as well as reduced demand in the industrial and commercial packaging market, negatively impacted our results of operations, leading to decreased net sales and declines in gross profit margins and growth rates as well as lower factory utilization compared to peak levels. In addition, our customers’ financial difficulties during the most recent recession resulted in additions to reserves in our receivables portfolio. Although the effects of the recent global downturn on our business appear to be easing, we cannot assure you that this trend will continue. If the global recession continues or worsens, or if the global economy experiences future downturns, our net sales, gross profit and financial condition could be materially adversely affected. Uncertainty about future economic conditions also makes it difficult for us to forecast operating results and, as a result, to make decisions about potential investments and to plan effectively for future periods.
Our net sales and gross profit have varied depending on our product, customer and geographic mix for any given period, which makes it difficult to forecast future operating results.
Our net sales and gross profit vary among our products and services, and customer groups and markets, and therefore may be different in future periods from historic or current periods. Overall gross profit margins in any given period are dependent in large part on the product, customer and geographic mix reflected in that period’s net sales. Market trends, competitive pressures, commoditization of products, increased component or shipping costs, regulatory conditions and other factors may result in reductions in revenue or pressure on the gross profit margins of certain segments in a given period. Given the nature of our business, the impact of these factors on our business and results of operations will likely vary from period to period and from product to product. For example, a change in market trends that results in a decline in demand for products or businesses that are then high margin will have a disproportionately greater adverse effect on our profits for that period. The varying nature of our product, customer and geographic mix between periods therefore has materially impacted our net sales and gross profit between periods during certain recessionary times, such as in 2001 and 2007, and may lead to difficulties in measuring the potential impact of market, regulatory and other factors on our business. As a result, we may be challenged in our ability to forecast our future operating results. Further, business acquisitions and divestitures can compound the difficulty in making comparisons between prior, current and future periods because acquisitions and divestitures, which are not ordinary course events, also affect our gross profit margins and our overall operating results.
18
Table of Contents
Our future business initiatives may require capital expenditures that exceed management estimates, which could adversely affect our business, financial condition and results of operations.
Our “asset-lite, high-touch” business model is focused on limiting our investments in fixed assets and capital expenditures. Although we are dedicated to our business model, the markets for our proprietary technology and the needs of our customers are frequently changing, which makes it difficult for us to forecast the need for increases in capital expenditures and assets. In the future, we may be required to expend significantly greater capital, and maintain a greater number of fixed assets, to meet our customers’ needs and capitalize on new opportunities for growth in our businesses. However, we cannot assure you that any decision to increase spending and diverge from our business model will be successful. Further, if increases in spending on capital expenditures or costs incurred as a result of a more capital-intensive asset base are not offset by increases in net sales, our business, financial condition and results of operations could be materially and adversely affected.
We face intense competition, and our failure to compete successfully may have an adverse effect on our net sales, gross profit and financial condition.
Our industry is highly competitive, and most of our product lines compete against product lines from at least two competitors. We encounter competition from numerous and varied competitors in all areas of our business; however, our most significant competitors are Atotech (a division of Total), DuPont, Enthone (a division of Cookson Group plc) and Rohm and Haas (a division of Dow Chemical). Further, in our Industrial segment, our products compete not only with similar products manufactured by our competitors, but also against a variety of chemical and non-chemical alternatives provided by our competitors. Industry consolidation may result in larger, more homogeneous and potentially stronger competitors in the markets in which we compete.
We compete primarily on the basis of quality, technology, performance, reliability, brand, reputation, range of products and services, and service and support. We expect our competitors to continue to develop and introduce new products and to enhance their existing products, which could cause a decline in market acceptance of our products. Our competitors may also improve their manufacturing processes or expand their manufacturing capacity, which could make it more difficult or expensive for us to compete successfully. In addition, our competitors could enter into exclusive arrangements with our existing or potential customers or suppliers, which could limit our ability, or make it significantly more expensive, to acquire necessary raw materials or to generate sales.
Some of our competitors may have greater financial, technical and marketing resources than we do and may be able to devote greater resources to promoting and selling certain products. Unlike many of our competitors who specialize in a single or limited number of product lines, we have a portfolio of businesses and must allocate resources across those businesses. As a result, we may invest less in certain of our businesses than our competitors in those businesses invest, and our competitors may therefore have greater financial, technical and marketing resources available to them with respect to those businesses.
Some of our competitors may also incur fewer expenses than we do in creating, marketing and selling certain products and may face fewer risks in introducing new products to the market. This circumstance results from the nature of our business model, which is based on providing innovative and high quality products and therefore may require that we spend a proportionately greater amount on research and development than some of our competitors. If our pricing and other factors are not sufficiently competitive, or if there is an adverse reaction to our product decisions, we may lose market share in certain areas, which could adversely affect our net sales, gross profit and our prospects. Further, because many of our competitors are small divisions of large, international businesses, these competitors may have access to greater resources then we do and may therefore be better able to withstand a change in conditions within our industry and throughout the economy as a whole.
If we do not compete successfully by developing and deploying new cost effective products, processes and technologies on a timely basis and by adapting to changes in our industry and the global economy, our net sales, gross profit and financial condition could be adversely affected.
19
Table of Contents
Our substantial international operations subject us to risks not faced by domestic competitors, including unfavorable political, regulatory, labor, tax and economic conditions in other countries that could adversely affect our business, financial condition and results of operations.
Currently, we operate, or others operate on our behalf, facilities in 23 countries, in addition to our operations in the United States. We expect sales from international markets to represent an increasing portion of our net sales. Accordingly, our business is subject to risks related to the different legal, political, social and regulatory requirements and economic conditions of many jurisdictions. Risks inherent in our international operations include the following:
| • | agreements and intellectual property rights may be difficult to enforce and receivables difficult to collect through a foreign country’s legal system; |
| • | foreign customers may have increased credit risk and different financial conditions, which may necessitate longer payment cycles or result in increased bad debt write-offs or additions to reserves related to our foreign receivables; |
| • | foreign countries may impose additional withholding taxes or otherwise tax our foreign income, impose tariffs or adopt other restrictions on foreign trade or investment, including currency exchange controls; |
| • | foreign exchange controls may delay, restrict or prohibit the repatriation of funds, and any restrictions on the repatriation of funds may result in adverse tax consequences and tax inefficiencies; |
| • | U.S. export licenses may be difficult to obtain; |
| • | there may be delays and interruptions in transportation of our products; |
| • | fluctuations in exchange rates may affect product demand and may adversely affect the profitability in U.S. Dollars of products and services provided by us in markets where payment for our products and services is made in currencies other than the U.S. Dollar; |
| • | general economic conditions in the countries in which we operate, including fluctuations in gross domestic product, interest rates, market demand, labor costs and other factors beyond our control, could have an adverse effect on our net sales in those countries; |
| • | our results of operations in a particular country could be affected by political or economic instability on a country-specific or global level from various causes, including the possibility of hyperinflationary conditions, natural disasters and terrorist activities and the response to such conditions and events; |
| • | we may experience difficulties in staffing and managing multi-national operations, including the possibility of labor disputes abroad; |
| • | unexpected adverse changes in foreign laws or regulatory requirements may occur, including environmental, health and safety laws and laws and regulations affecting export and import duties and quotas; |
| • | compliance with a variety of foreign laws and regulations may be difficult; |
| • | we may be subject to the risks of divergent business expectations resulting from cultural incompatibility; and |
| • | overlap of different tax structures may subject us to additional taxes. |
Our business in emerging markets requires us to respond to rapid changes in market conditions in these countries. Our overall success as a global business depends, in part, upon our ability to succeed in different legal, regulatory, economic, social and political conditions. We cannot assure you that we will succeed in developing and implementing policies and strategies which will be effective in each location where we do business. Furthermore, any of the foregoing factors or any combination thereof could have a material adverse effect on our business, financial condition and results of operations.
20
Table of Contents
We are exposed to fluctuations in foreign exchange rates, which may adversely affect our operating results and may significantly affect the comparability of our results between financial periods.
The results of operations and financial condition of each foreign operating subsidiary of MacDermid, Incorporated are reported in the relevant local currency and then translated to U.S. Dollars for inclusion in our consolidated financial statements. Exchange rates between these currencies and the U.S. Dollar in recent years have fluctuated significantly and are likely to continue to do so in the future. For the year ended December 31, 2011, approximately 69% of our net sales were denominated in currencies other than the U.S. Dollar and, for the three months ended March 31, 2012, approximately 67% of our net sales were also so denominated. These foreign currencies included predominantly the Euro, British Pound Sterling, Hong Kong Dollar, Chinese Yuan, Japanese Yen and Brazilian Real. A depreciation of these currencies against the U.S. Dollar will decrease the U.S. Dollar equivalent of the amounts derived from operations reported in these foreign currencies and an appreciation of these currencies will result in a corresponding increase in such amounts. From time to time we may engage in exchange rate hedging activities in an effort to mitigate the impact of exchange rate fluctuations. For example, during 2009, 2010, 2011 and 2012, one of our subsidiaries in the United Kingdom entered into agreements with a financial institution to hedge against the risk of a stronger British Pound Sterling. We cannot, however, assure you that this arrangement or any other exchange rate hedging arrangements we may enter into from time to time will be effective. If our hedging activities are not effective or if additional hedging transactions are not available, changes in currency exchange rates may have a more significant impact on our results of operations.
Because we do not manage our foreign currency exposure in a manner that would eliminate the effects of changes in foreign exchange rates on our net sales, cash flows and fair values of assets and liabilities, our financial performance can be positively or negatively impacted by changes in foreign exchange rates in any given reporting period. Significant changes in the value of the Euro, Japanese Yen, Hong Kong Dollar or British Pound Sterling relative to the U.S. Dollar could also have an adverse effect on our ability to meet interest and principal payments on any Euro and Japanese Yen, denominated debt outstanding, including borrowings in Euros under our Credit Facilities, and U.S. Dollar-denominated debt, including the Senior Subordinated Notes and U.S. Dollar-based borrowings under the Credit Facilities. In addition, currency fluctuations may affect the comparability of our results of operations between financial periods.
Besides currency translation risks, we incur currency transaction risk whenever one of our operating subsidiaries enters into either a purchase or a sales transaction using a different currency from the currency in which it records revenues. Given the volatility of exchange rates, we cannot assure you that we will be able to effectively manage our currency transaction or translation risks or that any volatility in currency exchange rates will not have an adverse effect on our financial condition or results of operations.
Changes in our customers’ products and processes can reduce the demand for our specialty chemicals.
Our specialty chemicals are used for a broad range of applications by our customers. Changes, including technological changes, in our customers’ products or processes may make our specialty chemicals unnecessary, which would reduce the demand for those chemicals. We have had, and may continue to have, customers that find alternative materials or processes and therefore no longer require our products.
We generally do not have long-term contracts with the customers in our Industrial segment, and the loss of customers in that segment could adversely affect our overall sales and profitability.
With some exceptions, our relationships with the customers in our Industrial segment are based primarily upon individual sales orders. As such, our customers in the businesses that comprise our Industrial segment could cease buying our products from us at any time, for any reason, with little or no recourse. If multiple customers within those businesses elected not to purchase products from us, our business prospects, financial condition and results of operations could be adversely affected.
21
Table of Contents
Our net sales, gross profit and financial condition could be reduced by decreases in the average selling prices of products in the specialty chemicals industry.
Decreases in the average selling prices of our products may have a material adverse effect on our net sales, gross profit and financial condition. Our ability to maintain or increase our gross profit margin will continue to be dependent, in large part, upon our ability to offset decreases in average selling prices by improving production efficiency or by shifting to higher margin chemical products. We have also elected to discontinue selling certain products as a result of sustained material decreases in the selling price of our products and our inability to effectively offset such decrease through shifts in our operations. If we are unable to respond effectively to decreases in the average selling prices of our products in the future, our net sales, gross profit and financial condition could be materially and adversely affected. Further, while we may elect to discontinue businesses that are significantly affected by such price decreases, we cannot assure you that any such discontinuation will mitigate the related declines in our financial condition.
Increases in costs or reductions in the supplies of specialty and commodity chemicals we use in our manufacturing process could materially and adversely affect our results of operations.
We use a variety of specialty and commodity chemicals in our manufacturing processes. Our manufacturing operations depend upon obtaining adequate supplies of raw materials on a timely basis. These raw materials are generally available from numerous independent suppliers, and we typically purchase our major raw materials on a contract or as needed basis from outside sources. The availability and prices of raw materials may be subject to curtailment or change due to, among other things, the financial stability of our suppliers, suppliers’ allocations to other purchasers, interruptions in production by suppliers, new laws or regulations, changes in exchange rates and worldwide price levels. Further, we cannot assure you that, as our supply contracts expire, we will be able to renew them or, or if they are terminated, that we will be able to obtain replacement supply agreements on terms favorable to us. Our results of operations could be adversely affected if we are unable to obtain adequate supplies of raw materials in a timely manner or if the costs of raw materials increase significantly.
From time to time, suppliers may extend lead times, limit supplies or increase prices due to capacity constraints or other factors. In addition, some of the raw materials that we use are derived from petrochemical-based feedstocks, and there have been historical periods of rapid and significant upward and downward movements in the prices of these feedstocks. While we selectively pass on changes in the prices of raw materials to our customers from time to time, there has historically been a time delay between increased raw material prices and our ability to increase the prices of our products. Further, we cannot always pass on these price increases due to competitive pricing pressure. Any limitation on, or delay in, our ability to pass on any price increases could have an adverse effect on our results of operations.
We may incur material costs relating to environmental and health and safety requirements or liabilities.
As a manufacturer and distributor of specialty chemicals and systems, we are subject to extensive U.S. and foreign laws and regulations relating to environmental protection and worker health and safety, including those governing discharges of pollutants into the air and water, the management and disposal of hazardous substances and wastes, the cleanup of contaminated properties and occupational safety and health matters. We could incur significant costs, including cleanup costs, fines and sanctions and third-party claims for property or natural resource damage or personal injuries as a result of past or future violations of, or liabilities under, such laws and regulations.
Liability under some environmental laws relating to contaminated sites can be imposed retroactively, regardless of fault or the legality of the activities that gave rise to the contamination. Some of our manufacturing facilities have an extended history of chemical manufacturing operations or other industrial activities, and contaminants have been detected at some of our sites, and at a small number of offsite disposal locations. Although we do not anticipate that we will be materially affected by environmental remediation costs, or any
22
Table of Contents
related claims, at any such sites, the ultimate costs are difficult to accurately predict and the discovery of additional contaminants or the imposition of additional cleanup obligations at these or other sites could result in significant additional costs.
In addition, we have incurred, and will continue to incur, significant costs and capital expenditures in complying with environmental, health and safety laws and regulations. Future events, such as changes in or more rigorous enforcement of environmental laws and regulations, could require us to make additional expenditures, modify or curtail our operations or install pollution control equipment.
Global climate change legislation could negatively impact our results of operations or limit our ability to operate our businesses.
We operate production facilities in several countries. In many of the countries in which we operate, legislation has been passed, or proposed legislation is being considered, to limit greenhouse gases through various means, including emissions credits. To date, the requirements of such legislation have not had a material adverse effect on our results of operations. New or additional greenhouse gas regulation in the jurisdictions in which we operate, however, could negatively impact our future results from operations through increased costs of production. We may be unable to pass such increased costs onto our customers, which may decrease our gross profit and results of operations. In addition, the potential impacts of climate change regulation on our customers is highly uncertain and may adversely affect our business.
We may be unable to respond effectively to technological changes in our industry, which could reduce the demand for our products and adversely affect our results of operations.
Our future business success will depend upon our ability to maintain and enhance our technological capabilities, develop and market products and applications that meet changing customer needs and successfully anticipate or respond to technological changes on a cost effective and timely basis. Our inability to anticipate, respond to or utilize changing technologies could have an adverse effect on our business, financial condition or results of operations.
Our substantial indebtedness may adversely affect our cash flow and our ability to operate our business and fulfill our obligations under our indebtedness.
As of March 31, 2012, we had $350.0 million of Senior Subordinated Notes outstanding, $220.4 million of indebtedness outstanding under our $360.0 million tranche B term loan credit facility denominated in U.S. Dollars (the “Tranche B Facility”), $151.0 million of indebtedness outstanding under our $250.0 million tranche C term loan credit facility denominated in Euros (the “Tranche C Facility” and, together with the Tranche B Facility, the “Term Loan Facilities”) and $8.0 million of Japanese senior secured bank debt. We intend to use $ million and $ million of the net proceeds from this offering to prepay indebtedness outstanding under the Term Loan Facilities and to redeem $ million aggregate principal amount of outstanding Senior Subordinated Notes, respectively. Assuming that the amount of net proceeds that we receive from this offering is $ and after giving effect to our intended use of proceeds from this offering, as of March 31, 2012, we would have had approximately $ million of total indebtedness outstanding, including $ million of secured indebtedness outstanding under the Tranche B Facility and Tranche C Facility and $ million of outstanding Senior Subordinated Notes.
Our substantial indebtedness could have important consequences to you. For example, it could:
| • | require us to dedicate a substantial portion of our cash flow from operations to payments on our indebtedness, thereby reducing the availability of our cash flow to fund working capital, capital expenditures, dividends, research and development efforts and other general corporate purposes; |
| • | increase the amount of our interest expense, because certain of our borrowings may be at variable rates of interest, which, if interest rates increase, would result in higher interest expense; |
23
Table of Contents
| • | increase our vulnerability to general adverse economic and industry conditions; |
| • | limit our flexibility in planning for, or reacting to, changes in our business and the industry in which we operate; |
| • | limit our ability to make strategic acquisitions, introduce new technologies or exploit business opportunities; and |
| • | place us at a competitive disadvantage compared to our competitors that have less indebtedness. |
If we cannot generate sufficient cash flow from operations to service our debt, we may need to refinance our debt, dispose of assets or issue equity to obtain necessary funds. We do not know whether we will be able to take any such actions on a timely basis, on terms satisfactory to us or at all. We are not dependent on the proceeds of this offering to meet any obligations under our indebtedness.
In addition, the credit agreement governing the Credit Facilities and the indenture governing the Senior Subordinated Notes contain covenants that restrict our operations. These covenants restrict, among other things, our ability to incur additional debt, grant liens, pay cash dividends, redeem our common stock, make certain investments and engage in certain merger, consolidation or asset sale transactions. These restrictions could limit our ability to plan for or react to market conditions, meet extraordinary capital needs or otherwise take actions that we believe are in the best interest of the company. Further, a failure by us to comply with any of these covenants and restrictions could result in an event of default that, if not waived or cured, could result in the acceleration of all or a substantial portion of the outstanding indebtedness thereunder.
Our ability to borrow under our revolving credit facility depends on our level of indebtedness and our financial performance, and any deterioration in our results of operations or increase in our indebtedness could therefore have a material adverse effect on our liquidity.
A deterioration in our results of operations or an increase in our indebtedness may limit our access to borrowings under the revolving credit facility that is part of our Credit Facilities (the “Revolving Credit Facility”). Under the terms of the credit agreement governing the Credit Facilities, we are subject to certain financial maintenance covenants if our borrowings under the Revolving Credit Facility exceed $10.0 million for ten or more days in any fiscal quarter.
Our ability to comply with these financial maintenance covenants depends, in part, on our financial performance and may be affected by events beyond our control. Any material deviations from our operating forecasts could require us to seek waivers or amendments of these covenants, alternative sources of financing or reductions in expenditures. We may not be able to obtain such waivers, amendments or alternative financings, or if we obtain them, they may not be on terms favorable to us.
Despite the restrictions set forth in the agreements governing our existing indebtedness, we may be able to incur substantial additional indebtedness in the future. Increases in the aggregate amount of our indebtedness may also result in our being unable to comply with the financial maintenance covenants, and our inability to borrow under our Revolving Credit Facility as a result of such non-compliance could have an adverse effect on our cash flow and liquidity.
Our business and results of operations could be adversely affected if we fail to protect our intellectual property rights.
Our success depends to a significant degree upon our ability to protect and preserve our intellectual property rights and the rights to our proprietary processes, methods, compounds and other technology. Failure to protect our existing intellectual property rights may result in the loss of valuable technologies or in our having to pay other companies for infringing on their intellectual property rights. We rely on confidentiality agreements and
24
Table of Contents
patent, trade secret, trademark and copyright law as well as judicial enforcement of all of the foregoing to protect such technologies and intellectual property rights. In addition, some of our technologies are not covered by any patent or patent application.
We may be unable to prevent third parties from using our intellectual property and other proprietary information without our authorization or from independently developing intellectual property and other proprietary information that is similar to ours, particularly in countries where the laws do not protect our proprietary rights to the same degree as in the United States. The use of our intellectual property and other proprietary information by others could reduce or eliminate any competitive advantages we have developed, cause us to lose sales or otherwise harm our business. If it becomes necessary for us to litigate to protect these rights, any proceedings could be burdensome and costly, and we may not prevail.
Our patents also may not provide us with any competitive advantage and may be challenged by third parties. Further, our competitors may attempt to design around our patents. Our competitors may also already hold or have applied for patents in the United States or abroad that, if enforced or issued, could prevail over our patent rights or otherwise limit our ability to manufacture or sell one or more of our products in the United States or abroad. With respect to our pending patent applications, we may not be successful in securing patents for these claims. Our failure to secure these patents may limit our ability to protect inventions that these applications were intended to cover. In addition, the expiration of a patent can result in increased competition with consequent erosion of profit margins.
Competitors or other parties may, from time to time, assert issued patents or other intellectual property rights against us. If we are legally determined to infringe or violate the intellectual property rights of another party, we may have to pay damages, stop the infringing use, or attempt to obtain a license agreement with the owner of such intellectual property. Further, even if we are successful in defending our rights, such litigation could be burdensome and costly.
In some cases, we rely upon unpatented proprietary manufacturing expertise, continuing technological innovation and other trade secrets to develop and maintain our competitive position. While we generally enter into confidentiality agreements with our employees and third parties to protect our intellectual property, our confidentiality agreements could be breached and may not provide meaningful protection for our trade secrets or proprietary manufacturing expertise. In addition, adequate remedies may not be available in the event of unauthorized use or disclosure of our trade secrets or manufacturing expertise. Violations by others of our confidentiality agreements and the loss of employees who have specialized knowledge and expertise could harm our competitive position and cause our sales and operating results to decline as a result of increased competition.
In addition, we rely on both registered and unregistered trademarks to protect our name and brands. Failure by us to adequately maintain the quality of our products and services associated with our trademarks or any loss to the distinctiveness of our trademarks may cause us to lose certain trademark protection, which could result in the loss of goodwill and brand recognition in relation to our name and products. In addition, successful third-party challenges to the use of any of our trademarks may require us to rebrand our business or certain products or services associated therewith.
The failure of our patents, applicable intellectual property law or our confidentiality agreements to protect our intellectual property and other proprietary information, including our processes, apparatuses, technology, trade secrets, tradenames and proprietary manufacturing expertise, methods and compounds, could have a material adverse effect on our competitive advantages and could have a material adverse effect on our business, results of operations and stock price.
25
Table of Contents
We may experience claims that our products infringe the intellectual property rights of others, which may cause us to incur unexpected costs or prevent us from selling our products.
We continually seek to improve our business processes and develop new products and applications. Many of our competitors have a substantial amount of intellectual property that we must continually monitor to avoid infringement. Although it is our policy and intention not to infringe third-party intellectual property, we cannot guarantee that we will not experience claims that our processes and products infringe issued patents (whether present or future) or other intellectual property rights belonging to others. For example, we are currently a defendant in a patent infringement claim, which has been vigorously opposed by us, relating to technology that is important to us, although we do not expect this claim to have a material adverse effect on our business, financial conditions, results of operations or reputation. From time to time, we oppose patent applications that we consider overbroad or otherwise invalid in order to maintain the ability to operate freely in our various business lines without the risk of being sued for patent infringement. If, however, patents are subsequently issued on any such applications by other parties, or if patents belonging to others already exist that cover our products, processes or technologies, we could experience claims for infringement or have to take other remedial or curative actions to continue our manufacturing and sales activities with respect to one or more products. Such actions could include payment of damages, stopping the use, obtaining licenses from these parties or substantially re-engineering our products or processes in order to avoid infringement. We may not be able to obtain the necessary licenses on acceptable terms, or at all, or be able to re-engineer our products successfully. Moreover, if we are sued for infringement and lose, we could be required to pay substantial damages or be enjoined from using or selling the infringing products or technology. Further, intellectual property litigation is expensive and time-consuming, regardless of the merits of any claim, and could divert our management’s attention from operating our business.
We may not be able to consummate future acquisitions or successfully integrate acquisitions into our business, which could result in unanticipated expenses and losses.
We have made acquisitions of businesses in the past and may do so from time to time in the future. Consummating acquisitions of related businesses, or our failure to integrate such businesses successfully into our existing businesses, could result in unanticipated expenses and losses. Furthermore, we may not be able to realize any of the anticipated benefits from the acquisitions.
In connection with potential future acquisitions, the process of integrating acquired operations into our existing operations may result in unforeseen operating difficulties and may require significant financial resources that would otherwise be available for the ongoing development or expansion of existing operations. Some of the risks associated with acquisitions include:
| • | unexpected losses of key employees or customers of the acquired company; |
| • | conforming the acquired company’s standards, processes, procedures and controls with our operations; |
| • | coordinating new product and process development; |
| • | hiring additional management and other critical personnel; |
| • | negotiating with labor unions; and |
| • | increasing the scope, geographic diversity and complexity of our operations. |
In addition, we may encounter unforeseen obstacles or costs in the integration of businesses we may acquire. Also, the presence of one or more material liabilities of an acquired company that are unknown to us at the time of acquisition may have a material adverse effect on our financial condition or results of operations.
26
Table of Contents
Chemical manufacturing is inherently hazardous and could result in accidents that disrupt our operations or expose us to significant losses or liabilities.
The hazards associated with chemical manufacturing and the related storage and transportation of raw materials, products and wastes are inherent in our operations. These hazards could lead to an interruption or suspension of operations and have an adverse effect on the productivity and profitability of a particular manufacturing facility or on our business as a whole. These potential risks include:
| • | pipeline and storage tank leaks and ruptures; |
| • | explosions and fires; |
| • | inclement weather and natural disasters; |
| • | terrorist attacks; |
| • | mechanical failure; |
| • | unscheduled downtime; |
| • | labor difficulties; |
| • | transportation interruptions; and |
| • | chemical spills and other discharges or releases of toxic or hazardous substances or gases. |
These hazards may result in personal injury and loss of life, damage to property and contamination of the environment, which may result in a suspension of operations and the imposition of civil or criminal fines, penalties and other sanctions, cleanup costs and claims by governmental entities or third parties. We are dependent on the continued operation of our production facilities, and the loss or shutdown of operations over an extended period at our Morristown, Tennessee facility, which is our only Printing segment sheet production facility, or any of our other major operating facilities could have a material adverse effect on our financial condition and results of operations. We are not fully insured against all potential hazards incidental to our business.
Our Offshore Solutions business is subject to the hazards inherent in the offshore oil production and drilling industry, and we may incur substantial liabilities or losses as a result of these hazards.
In our Offshore Solutions business, we produce water-based hydraulic control fluids for major oil companies and drilling contractors to be used for potentially hazardous offshore deep water production and drilling applications. Offshore deep water oil production and drilling are subject to hazards that include blowouts, explosions, fires, collisions, capsizing, sinking and damage or loss to pipeline, subsea or other facilities from severe weather conditions. These hazards could result in personal injury and loss of life, severe damage to or destruction of property and equipment, pollution or environmental damage and suspension of operations. A catastrophic occurrence at a location where our products are used may expose us to substantial liability for personal injury, wrongful death, product liability or commercial claims. To the extent available, we maintain insurance coverage that we believe is customary in our industry. Such insurance does not, however, provide coverage for all liabilities, and we cannot assure you that our insurance coverage will be adequate to cover claims that may arise or that we will be able to maintain adequate insurance at rates we consider reasonable. The occurrence of a significant offshore deep water oil production or drilling event that results in liability to us that is not fully insured could materially and adversely affect our results of operations and financial condition.
Compliance with government regulations, or penalties for non-compliance, could prevent or increase the cost of the development, distribution and sale of our products.
We, our business, our products and our customers’ products are subject to regulation by many U.S. and non-U.S. supranational, national, federal, state and local governmental authorities. These regulations include
27
Table of Contents
customs and international trade laws, export control, antitrust laws, environmental requirements and zoning and occupancy laws that regulate manufacturers generally or govern the importation, promotion and sale of our products, the operation of our factories and warehouse facilities and our relationship with our customers, suppliers and competitors. Our products and manufacturing processes are also subject to ongoing reviews by certain governmental authorities.
New laws and regulations may be introduced, or existing laws and regulations may be changed or may become subject to new interpretations, that could result in additional compliance costs, seizures, confiscations, recalls, monetary fines or delays that could affect us or our customers. These effects could prevent or inhibit the development, distribution and sale of our products and may harm our reputation. In addition, changes in federal and state minimum wage laws and other laws relating to employee benefits could cause us to incur additional wage and benefit costs, which could negatively impact our profitability. Further, if any of the regulations to which we are subject were violated by our management, employees, suppliers, buying agents or trading companies, the costs of certain goods could increase, or we could experience delays in shipments of our goods, be subject to fines or penalties, or suffer reputational harm, which could reduce demand for our products, hurt our business and negatively impact our results of operations and stock price.
Further, in some circumstances, before we may sell some of our products, governmental authorities must approve these products, our manufacturing processes and facilities. In order to obtain regulatory approval of certain new products, we must, among other things, demonstrate to the relevant authority that the product is safe and effective for its intended uses and that we are capable of manufacturing the product in accordance with current regulations. The approval process can be costly, time consuming and subject to unanticipated and significant delays. We cannot assure you that approvals will be granted to us on a timely basis, or at all. Any delay in obtaining, or any failure to obtain or maintain, these approvals would adversely affect our ability to introduce new products and to generate revenue from those products.
We are exposed to intangible asset risk.
We have recorded intangible assets, including goodwill in connection with business acquisitions. Goodwill represents the excess of the purchase price over the fair value of the identifiable net assets of an acquired business. We do not amortize goodwill and other intangible assets that have indefinite useful lives; rather, goodwill and other intangible assets with indefinite useful lives are tested for impairment periodically. Indefinite-lived intangible assets are reviewed for potential impairment on an annual basis by comparing the estimated fair value of the indefinite-lived intangible assets to their carrying value. Goodwill is tested for impairment at the reporting unit level annually, or when events or changes in circumstances indicate that goodwill might be impaired. Our annual test for goodwill impairment is performed as of April 1st of each year.
As a result of our annual and other periodic evaluations, we may determine that our intangible asset values need to be written down to their fair values. For example, during 2011, we recorded impairment charges of $46.4 million related to the customer list intangible assets in our Industrial Asia operations. During 2009, we recorded an impairment charge of $41.2 million related to our goodwill balance. We also recorded impairment charges in 2009 of $26.1 million related to a corporate tradename, $1.2 million in our Printing segment to write down the value of certain equipment and $0.2 million for a customer list intangible asset in our Industrial Europe operations related to a strategic business decision to exit a certain market. If, as a result of our annual and other periodic evaluations, we determine that our intangible asset values need to be written down to their fair values, such write-downs could result in material charges that could be adverse to our operating results and financial position.
Our business may be adversely affected if we lose the services of key personnel or if we are unable to attract and retain additional key personnel.
Our business involves complex operations and therefore demands a management team and employee workforce that is knowledgeable and expert in many areas necessary for our operations. For example, Daniel H. Leever, our chairman and chief executive officer, joined the MacDermid business in 1982. In 1990, he
28
Table of Contents
was appointed president and chief executive officer and, in 1998, he became chairman of our board of directors (the “Board”). As a result of his extensive experience with our company and his high level of familiarity with our business, systems and processes, the loss of his service would cause disruptions in our business. Further, the process of attracting and retaining a suitable replacement for Mr. Leever or for other key personnel whose services we may lose would result in transition costs and would divert the attention of other members of our senior management from our existing operations. We do not maintain key person insurance on Mr. Leever.
Our relationship with our employees could deteriorate, and certain key employees could leave the company, which could adversely affect our business and our results of operations.
As a company focused on manufacturing and highly technical customer service, we rely on our ability to attract and retain skilled employees, including our specialized research and development and sales and service personnel, to maintain our efficient production processes, to drive innovation in our product offerings and to maintain our deep customer relationships. As of March 31, 2012, we employed approximately 2,100 full-time employees, approximately 1,000 of whom were members of our research and development and sales and service teams. The departure of a significant number of our highly skilled employees or of one or more employees who hold key regional management positions could have an adverse impact on our operations, including as a result of customers choosing to follow a regional manager to one of our competitors. Further, although we have historically maintained a good relationship with our employees, our U.S. employees could unionize or any of our employees could engage in a strike, work stoppage or other slowdown that would adversely affect our operations and could result in higher labor costs, which could adversely affect our business and results of operations.
In addition, many of our full-time employees are employed outside the United States. In certain jurisdictions where we operate, labor and employment laws are relatively stringent and, in many cases, grant significant job protection to certain employees, including rights on termination of employment. In addition, in certain countries where we operate, our employees are members of unions or are represented by a works council as required by law. We are often required to consult and seek the consent or advice of these unions and/or works councils. These laws, coupled with the requirement to consult with the relevant unions or works councils, could adversely affect our flexibility in managing costs and responding to market changes and could limit our ability to access the skilled employees on which our business depends.
Business disruptions could seriously harm our net sales and increase our costs and expenses.
Our worldwide operations could be subject to extraordinary events, including natural disasters, political disruptions, terrorist attacks, acts of war and other business disruptions, which could seriously harm our net sales and increase our costs and expenses. Some areas, including parts of the East Coast and Midwest of the United States, have previously experienced, and may in the future experience, major power shortages and blackouts, significant floods and strong tornadoes and other storms. These blackouts, floods and storms could cause disruptions to our operations or the operations of our suppliers, distributors, resellers or customers. Similar losses and interruptions could also be caused by earthquakes, telecommunications failures, water shortages, tsunamis, typhoons, fires, extreme weather conditions, medical epidemics and other natural or manmade disasters for which we are predominantly self-insured.
Our productivity initiatives, including the operational restructuring transactions that we consummated during the recent global economic downturn, may not prove beneficial to us.
We have undertaken and may continue to undertake productivity initiatives, including organizational restructurings, to improve performance and generate cost savings. For example, as a result of the recent downturn in global economic conditions, beginning in 2008, we began executing a series of operational restructuring initiatives that streamlined our organizational structure. These actions have reduced our workforce in our manufacturing, research and development, selling and technical and general and administrative functions. As of March 31, 2012, with the exception of finalizing certain operational restructuring programs in our Industrial Europe operations, we had completed the majority of the operational restructuring actions we have planned. However, we cannot assure you that the assumptions underlying our decisions as to which reductions and
29
Table of Contents
eliminations to make as part of these operational restructuring initiatives will prove to be correct and, accordingly, we may determine that we have reduced or eliminated resources that are necessary to, or desirable for, our business. Any reduction or elimination of resources made in error could adversely affect our ability to operate or grow our business and may negatively impact our results of operations.
We are subject to litigation that could have an adverse effect upon our business, financial condition or results of operations.
We are a defendant in numerous lawsuits that result from, and are incidental to, the conduct of our business. These suits concern issues including product liability, contract disputes, labor-related matters, patent infringement, environmental proceedings, property damage and personal injury matters. For example, we are currently a defendant in a patent infringement claim, which has been vigorously opposed by us, relating to technology that is important to us, although we do not expect this claim to have a material adverse effect on our business, financial conditions, results of operations or reputation. The ultimate resolution of such claims, proceedings, and lawsuits is inherently unpredictable and, as a result, our estimates of liability, if any, are subject to change and actual results may materially differ from our estimates. If there is an unfavorable resolution of a matter, our reputation may be harmed and there could be a material adverse effect on our business, financial condition or results of operations. Moreover, we cannot assure you that we will have any or adequate insurance coverage to protect us from any adverse resolution.
We may be liable for damages based on product liability claims brought against our customers in our end use markets, and any successful claim for damages could have a material adverse effect on our financial condition or results of operations.
Many of our products provide critical performance attributes to our customers’ products that are sold to consumers who could potentially bring product liability suits related to such products. Our sale of these products therefore involves the risk of product liability claims. If a person were to bring a product liability suit against one of our customers, this customer may attempt to seek contribution from us. A person may also bring a product liability claim directly against us. A successful product liability claim or series of claims against us in excess of our insurance coverage for payments, for which we are not otherwise indemnified, could have a material adverse effect on our financial condition or results of operations. While we endeavor to protect ourselves from such claims and exposures in our contractual negotiations, we cannot assure you that our efforts in this regard will ultimately protect us from any such claims.
Risks Related to this Offering and Ownership of Our Common Stock
After this offering, Court Square and Weston Presidio will maintain substantial control over us, which will limit your ability to influence corporate matters and may result in actions that you do not believe are in our interests or your interests.
Assuming a public offering price of $ (the midpoint of the range set forth on the cover of this prospectus), immediately following the completion of this offering, Court Square will own % and Weston Presidio will own % of our common stock, or % and % of our common stock, respectively, if the underwriters exercise their over-allotment option in full. As our largest stockholder, Court Square will exercise significant influence over all matters requiring stockholder approval, and Court Square and Weston Presidio collectively will control all matters requiring stockholder approval, including the election of directors, amendment of our certificate of incorporation and approval of significant corporate transactions. In addition, pursuant to the amended and restated securityholders’ agreement (the “Securityholders’ Agreement”) we will enter into with Court Square, Weston Presidio, Daniel H. Leever and our other historical management investors in connection with this offering, until Court Square and Weston Presidio cease to own at least 7.5% of our outstanding common stock, each of Court Square and Weston Presidio will have the right to designate individuals for nomination to our Board. Pursuant to the Securityholders’ Agreement, the other securityholders party thereto are required to vote for the election of such designated nominees. The number of individuals each of Court Square and Weston Presidio is entitled to designate for nomination by our Board is dependent on the amount of our common stock then owned by such entity.
30
Table of Contents
Further, the Securityholders’ Agreement will provide that, so long as Court Square owns at least 25% of our issued and outstanding common shares, certain actions by us or our subsidiaries will require the approval of at least a majority of the Court Square director designees (in addition to any other vote by our Board or stockholders). The actions requiring Court Square approval include certain change of control transactions, the acquisition or sale of any assets or operations with a value in excess of $50.0 million, any appointment or dismissal of our chief executive officer, any changes in the size of the Board and any amendment to our certificate of incorporation or by-laws. Also, the Securityholders’ Agreement will provide that, so long as Court Square owns at least 7.5% of our issued and outstanding common shares, our Board shall not authorize the issuance of any preferred stock of the Company without the approval of Court Square. Subject to certain exceptions, so long as Court Square owns at least 25% of our issued and outstanding common shares, a quorum sufficient for action by our Board must include a majority of the Court Square director designees. For more information on the rights of Court Square and Weston Presidio under the Securityholders’ Agreement, see “Certain Relationships and Related Party Transactions—Relationship with Court Square and Weston Presidio—Securityholders’ Agreement”.
In addition, our certificate of incorporation and by-laws contain certain provisions that give Court Square and Weston Presidio the ability to exercise significant influence over corporate matters. For more information on the rights of Court Square and Weston Presidio contained in our governing documents, see “Description of Capital Stock”.
The rights and significant ownership of Court Square and Weston Presidio may delay, deter or prevent acts that may be favored by our other stockholders, including a change of control of us. The interests of Court Square and Weston Presidio may not always coincide with our interests or those of our other stockholders, and Court Square and Weston Presidio may seek to cause us to take courses of action that, in their judgment, could enhance their investment in us, but which might involve risks to our other stockholders or adversely affect us or our other stockholders, including investors in this offering.
Further, Court Square and Weston Presidio are in the business of making investments in companies and may from time to time acquire and hold interests in businesses that compete directly or indirectly with us. Neither Court Square nor Weston Presidio currently holds interests in any business that competes directly or indirectly with us. Court Square and Weston Presidio may also pursue acquisition opportunities that are complementary to our business and, as a result, those acquisition opportunities may not be available to us.
So long as Court Square and Weston Presidio or their affiliates or associates have these contractual rights or continue to own a significant amount of our common stock, even if such amount is, in the aggregate, less than 50%, they will have significant influence over our business.
There is no existing market for our common stock, and we do not know if one will develop to provide you with adequate liquidity.
Prior to this offering, there has been no public market for shares of our common stock. We cannot predict the extent to which investor interest in our company will lead to the development of a trading market on the New York Stock Exchange (the “NYSE”) or otherwise, or how liquid that market might become. If an active market does not develop, you may have difficulty selling any shares of our common stock that you purchase in this offering. The initial public offering price for the shares of our common stock will be determined by negotiations between us and the representatives of the underwriters, and may not be indicative of prices that will prevail in the open market following this offering. If our common stock price decreases after this offering, you could lose a significant part or all of your investment.
Our stock price may fluctuate significantly following this offering.
The market price of our common stock may be influenced by many factors, some of which are beyond our control, including those described under “—Risks Related to Our Business and Industry” and the following:
| • | investors’ perceptions of our prospects; |
31
Table of Contents
| • | strategic actions by us or our competitors; |
| • | changes or trends in our industry; |
| • | announcements by us or our competitors of significant contracts, acquisitions, joint ventures or capital commitments; |
| • | additions or departures of key personnel; |
| • | the failure of securities analysts to cover our common stock after this offering or changes in financial estimates by analysts; |
| • | variations in our quarterly results of operations; |
| • | future sales of our common stock or other securities, including sales by Court Square and Weston Presidio; and |
| • | investor perceptions of the investment opportunity associated with our common stock relative to other investment alternatives. |
As a result of these factors, investors in our common stock may not be able to resell their shares at or above the initial offering price. These broad market and industry factors may materially reduce the market price of our common stock, regardless of our operating performance. In addition, price volatility may be greater if the trading volume of our common stock is low.
We will face new challenges, increased costs and administrative responsibilities as an independent public company, particularly after we are no longer an “emerging growth company”.
As a public company with listed equity securities, we will need to comply with certain laws, regulations and requirements, including certain provisions of the Sarbanes-Oxley Act of 2002, certain regulations of the Securities and Exchange Commission (the “SEC”) and certain of the NYSE requirements applicable to public companies. Complying with these statutes, regulations and requirements will occupy a significant amount of the time of our Board and management and will significantly increase our costs and expenses.
We will need to:
| • | institute a more comprehensive compliance framework; |
| • | update, evaluate and maintain a system of internal controls over financial reporting in compliance with the requirements of Section 404 of the Sarbanes-Oxley Act of 2002 and the related rules and regulations of the SEC; |
| • | prepare and distribute periodic public reports in compliance with our obligations under the federal securities laws; |
| • | revise our existing internal policies, such as those relating to disclosure controls and procedures and insider trading; |
| • | comply with SEC rules and guidelines requiring registrants to provide their financial statements in interactive data format using eXtensible Business Reporting Language (“XBRL”); |
| • | involve and retain to a greater degree outside counsel and accountants in the above activities; and |
| • | enhance our investor relations function. |
However, for as long as we remain an “emerging growth company” as defined in the Jumpstart Our Business Startups Act of 2012, we intend to take advantage of certain exemptions from various reporting requirements that are applicable to other public companies that are not “emerging growth companies” including, but not limited to, not being required to comply with the auditor attestation requirements of Section 404 of the Sarbanes-Oxley Act of 2002, reduced disclosure obligations regarding executive compensation in our periodic
32
Table of Contents
reports and proxy statements, and exemptions from the requirements of holding a nonbinding advisory vote on executive compensation and shareholder approval of any golden parachute payments not previously approved. We intend to take advantage of these reporting exemptions until we are no longer an “emerging growth company.”
We will remain an “emerging growth company” for up to five years, although we would cease to be an “emerging growth company” as of December 31 of a particular year if (1) we had gross revenue of $1 billion or more in such year, (2) the market value of our common stock that is held by non-affiliates exceeds $700 million as of June 30 in such year or (3) at any point in such year, we would have issued more than $1 billion of non-convertible debt during the three-year period prior thereto.
In addition, we also expect that being a public company subject to these rules and regulations will make it more expensive for us to obtain director and officer liability insurance, and we may be required to accept reduced coverage or incur substantially higher costs to obtain coverage. These factors could also make it more difficult for us to attract and retain qualified executive officers and members of our Board, particularly to serve on our audit committee.
Failure to establish and maintain effective internal controls in accordance with Section 404 of the Sarbanes-Oxley Act of 2002 could have a material adverse effect on our business and stock price.
As a public company, we will be required to document and test our internal control procedures in order to satisfy the requirements of Section 404 of the Sarbanes-Oxley Act of 2002, which will require, beginning with our Annual Report on Form 10-K for the year ending December 31, 2013, annual management assessments of the effectiveness of our internal control over financial reporting. Additionally, as of the later of the filing of such Annual Report and the date we are no longer an “emerging growth company” as defined in the Jumpstart Our Business Startups Act of 2012, Section 404 of the Sarbanes-Oxley Act of 2002 will require a report by our independent registered public accounting firm that addresses the effectiveness of our internal control over financial reporting. We will remain an “emerging growth company” for up to five years, although we would cease to be an “emerging growth company” as of December 31 of a particular year if (1) we had gross revenue of $1 billion or more in such year, (2) the market value of our common stock that is held by non-affiliates exceeds $700 million as of June 30 in such year or (3) at any point in such year, we would have issued more than $1 billion of non-convertible debt during the three-year period prior thereto. During the course of our testing, we may identify deficiencies that we may not be able to remediate in time to meet our deadline for compliance with Section 404.
Testing and maintaining internal control can divert our management’s attention from other matters that are important to the operation of our business. We also expect the regulations to increase our legal and financial compliance costs, make it more difficult to attract and retain qualified executive officers and members of our Board, particularly to serve on our audit committee, and make some activities more difficult, time consuming and costly. We may not be able to conclude on an ongoing basis that we have effective internal control over financial reporting in accordance with Section 404 and, when applicable to us, our independent registered public accounting firm may not be able or willing to issue an unqualified report on the effectiveness of our internal control over financial reporting. If we conclude that our internal control over financial reporting is not effective, we cannot be certain as to the timing of completion of our evaluation, testing and remediation actions or their effect on our operations because there is presently no precedent available by which to measure compliance adequacy.
In connection with the audit of the financial statements of MacDermid, Incorporated for the year ended December 31, 2008, our independent registered public accountants identified three material weaknesses in our system of internal control over financial reporting. A material weakness is a deficiency, or combination of deficiencies in internal control over financial reporting, that results in a reasonable possibility that a material misstatement of our annual or interim financial statements will not be prevented or detected on a timely basis. We took remedial measures related to these matters and we believe that the material weaknesses have been resolved. Since the 2008 fiscal year, we are not aware of any material weaknesses in our internal control over financial reporting.
33
Table of Contents
If additional material weaknesses or any significant deficiencies are identified in the future, our independent auditors are unable to provide us with an unqualified report upon being required to do so by Section 404 or we are required to restate our financial statements, we may fail to meet our public reporting obligations and investors could lose confidence in our reported financial information, which could have a negative effect on the trading price of our stock.
We are an “emerging growth company” and our election to delay adoption of new or revised accounting standards applicable to public companies may result in our financial statements not being comparable to those of other public companies. As a result of this and other reduced disclosure and governance requirements applicable to “emerging growth companies”, our common stock may be less attractive to investors.
We are an “emerging growth company”, as defined in the Jumpstart Our Business Startups Act of 2012, and we intend to take advantage of certain exemptions from various reporting requirements that are applicable to other public companies that are not “emerging growth companies” including, but not limited to, not being required to comply with the auditor attestation requirements of Section 404 of the Sarbanes-Oxley Act of 2002, reduced disclosure obligations regarding executive compensation in our periodic reports and proxy statements, and exemptions from the requirements of holding a nonbinding advisory vote on executive compensation and shareholder approval of any golden parachute payments not previously approved. In addition, Section 107 of the Jumpstart Our Business Startups Act of 2012 also provides that an “emerging growth company” can take advantage of the extended transition period provided in Section 7(a)(2)(B) of the Securities Act of 1933 (as amended, the “Securities Act”) for complying with new or revised accounting standards. In other words, an “emerging growth company” can delay the adoption of certain accounting standards until those standards would otherwise apply to private companies. We are electing to delay such adoption of new or revised accounting standards, and as a result, we may choose not to comply with new or revised accounting standards on the relevant dates on which adoption of such standards is required for public companies other than “emerging growth companies”. As a result of such election, our financial statements may not be comparable to the financial statements of companies that comply with public company effective dates of such new or revised accounting standards. We cannot predict if investors will find our common stock less attractive because we will rely on these exemptions. If some investors find our common stock less attractive as a result, there may be a less active trading market for our common stock and our stock price may be more volatile.
We will be a “controlled company” within the meaning of the NYSE rules and, as a result, will qualify for, and intend to rely on, exemptions from certain corporate governance requirements.
Upon completion of this offering, Court Square and Weston Presidio collectively will control a majority of our voting common stock. As a result, we will be a “controlled company” within the meaning of NYSE corporate governance standards. Under NYSE rules, a company of which more than 50% of the voting power is held by an individual, group or another company is a “controlled company” and may elect not to comply with certain NYSE corporate governance requirements, including:
| • | the requirement that a majority of our Board consists of independent directors; |
| • | the requirement that we have a nominating and corporate governance committee that is composed entirely of independent directors with a written charter addressing the committee’s purpose and responsibilities; |
| • | the requirement that we have a compensation committee that is composed entirely of independent directors with a written charter addressing the committee’s purpose and responsibilities; and |
| • | the requirement for an annual performance evaluation of the nominating and corporate governance committee and compensation committee. |
Following this offering, we intend to utilize the “controlled company” exemptions from the NYSE corporate governance requirements. As a result, we will not have a majority of independent directors nor will our nominating and corporate governance committee and compensation committee consist entirely of independent directors.
34
Table of Contents
Further, we will not be required to have an annual performance evaluation of the nominating and corporate governance committee and compensation committee. Accordingly, you will not have the same protections afforded to stockholders of companies that are subject to all of the NYSE’s corporate governance requirements.
You will incur immediate and substantial dilution as a result of this offering.
The initial public offering price per share of our common stock is substantially higher than the net tangible book value per share of our outstanding common stock immediately after this offering. As a result, you will pay a price per share that substantially exceeds the tangible book value per share, which is determined by dividing the total tangible assets of MacDermid, Incorporated and its consolidated subsidiaries less the total liabilities of MacDermid, Incorporated and its consolidated subsidiaries by the number of shares of our common stock outstanding. Based on the issuance and sale of million shares of common stock by us at an assumed initial public offering price of $ per share (the midpoint of the range set forth on the cover of this prospectus), you will incur immediate dilution of approximately $ in the net tangible book value per share if you purchase shares in this offering. See “Dilution”.
Future sales, or the perception of future sales, of our common stock may depress the price of our common stock.
The market price of our common stock could decline significantly as a result of sales of a large number of shares of our common stock in the market after this offering, including shares that might be offered for sale by Court Square and Weston Presidio. These sales, or the perception that these sales might occur, could depress the market price of our common stock. These sales, or the possibility that these sales may occur, also might make it more difficult for us to sell equity securities in the future at a time and at a price that we deem appropriate.
Upon completion of this offering, we will have shares of common stock outstanding. The shares of common stock offered in this offering will be freely tradable without restriction under the Securities Act, except for any shares of common stock that may be held or acquired by our directors, executive officers or other affiliates, the sale of which will be restricted under the Securities Act.
After this offering, Court Square will have the right, subject to certain conditions, to require us to file registration statements registering additional sales of shares of common stock and Court Square, Weston Presidio and the other securityholders party to the Securityholders’ Agreement will have the right to require us to include sales of shares of common stock in registration statements that we may file for ourselves or Court Square. In order to exercise these registration rights, the holder must be permitted to sell shares of its common stock under applicable lock-up restrictions described below. Subject to compliance with applicable lock-up restrictions and restrictions under the Securityholders’ Agreement (both of which may be waived), shares of common stock sold under these registration statements can be freely sold in the public market. In the event such registration rights are exercised and a large number of shares of common stock are sold in the public market, such sales could reduce the trading price of our common stock. These sales also could impede our ability to raise future capital. See “Shares Eligible for Future Sale—Registration Rights”.
In connection with this offering, Court Square, Weston Presidio, Daniel H. Leever and certain of our other officers and directors have each agreed to lock-up restrictions, meaning that they and their permitted transferees will not be permitted to sell any shares of our common stock for 180 days after the date of this prospectus, subject to certain exceptions, without the prior consent of Credit Suisse Securities (USA) LLC, Morgan Stanley & Co. LLC and Deutsche Bank Securities Inc. Although we have been advised that there is no present intention to do so, Credit Suisse Securities (USA) LLC, Morgan Stanley & Co. LLC and Deutsche Bank Securities Inc. may, in their sole discretion, release all or any portion of the shares of our common stock from the restrictions in any of the lock-up agreements described above. See “Underwriting”.
Also in the future, we may issue shares of our common stock in connection with investments or acquisitions. The amount of shares of our common stock issued in connection with an investment or acquisition could constitute a material portion of our then outstanding shares of our common stock.
35
Table of Contents
Anti-takeover provisions in our charter documents could discourage, delay or prevent a change of control of our company and may result in an entrenchment of management and diminish the value of our common stock.
Several provisions of our certificate of incorporation and by-laws could make it difficult for our stockholders to change the composition of our Board, preventing them from changing the composition of management. In addition, the same provisions may discourage, delay or prevent a merger or acquisition that our stockholders may consider favorable. See “Description of Capital Stock”.
These provisions include:
| • | authorizing our Board to issue “blank check” preferred stock without stockholder approval; |
| • | prohibiting cumulative voting in the election of directors; |
| • | limiting the persons who may call special meetings of stockholders; |
| • | prohibiting amendments (i) to certain specified provisions of our by-laws at any time when Court Square owns greater than 7.5% in voting power of our issued and outstanding capital stock and (ii) to any provision of our by-laws when Court Square owns greater than 25.0% in voting power of our issued and outstanding capital stock, in each case unless Court Square votes all shares held by it in favor of such amendment; |
| • | prohibiting stockholders from acting by written consent after Court Square and Weston Presidio cease to own more than 50% of the total voting power of our shares; and |
| • | establishing advance notice requirements for nominations for election to our Board or for proposing matters that can be acted on by stockholders at stockholder meetings. |
These anti-takeover provisions could impede the ability of our common stockholders to benefit from a change of control and, as a result, could materially adversely affect the market price of our common stock and your ability to realize any potential change of control premium.
We cannot assure you that we will declare dividends or have the available cash to make dividend payments.
We intend to pay quarterly cash dividends in an amount equal to $ per share following the completion of this offering. Whether we will do so, however, and the timing and amount of those dividends, will be subject to approval and declaration by our Board and will depend upon on a variety of factors, including the financial results, cash requirements and financial condition of the company, our ability to pay dividends under the credit agreement governing the Credit Facilities, the indenture governing the Senior Subordinated Notes and any other applicable contracts, and other factors deemed relevant by our Board. Any dividends declared and paid will not be cumulative.
Because MacDermid Group, Inc. is a holding company with no material assets (other than, following completion of the Corporate Reorganization, the equity interests of MacDermid, Incorporated), its cash flow and ability to pay dividends will be dependent upon the financial results and cash flows of MacDermid, Incorporated and its subsidiaries and the distribution or other payment of cash to MacDermid Group, Inc. in the form of dividends or otherwise. MacDermid, Incorporated is a separate and distinct legal entity from us and has no obligation to make any funds available to us.
If securities or industry analysts do not publish research or publish inaccurate or unfavorable research about our business, our stock price and trading volume could decline.
The trading market for our common stock will depend in part on the research and reports that securities or industry analysts publish about us or our business. If no securities or industry analysts cover our company, the trading price for our common stock would be negatively impacted. If one or more of the analysts who covers us downgrades our common stock or publishes inaccurate or unfavorable research about our business, our stock price would likely decline. If one or more of these analysts ceases coverage of us or fails to publish reports on us regularly, demand for our common stock could decrease, which could cause our stock price and trading volume to decline.
36
Table of Contents
INFORMATION REGARDING FORWARD-LOOKING STATEMENTS
This prospectus includes forward-looking statements within the meaning of the federal securities laws. These statements relate to, among other items, net sales, earnings, revenue, gross profit, profitability, financial conditions, results of operations, cash flows, capital expenditures and other financial matters. These statements also relate to our business strategy, goals and expectations concerning our market position and future operations. Statements that are not historical facts, including statements about our beliefs and expectations, are forward-looking statements. Forward-looking statements are often characterized by the use of words such as “believe”, “expect”, “anticipate”, “estimate”, “intend”, “plan”, “target”, “likely”, “may”, “will”, “would”, “could”, “predict”, “project”, and similar expressions or phrases, or the negative of those expressions or phrases.
Although we believe that we have a reasonable basis for the assumptions underlying the forward-looking statements contained in this prospectus, we caution you that our assumptions could be incorrect and the forward-looking statements based on these assumptions could be inaccurate. Further, these forward-looking statements are based on our projections of the future and involve known and unknown risks and uncertainties and other factors that may cause our actual results of operations, level of activity, performance, achievements or industry results to differ materially from our historical results or from any future results, performance or achievements suggested or implied by the forward-looking statements in this prospectus. The sections in this prospectus entitled “Risk Factors”, “Management’s Discussion and Analysis of Financial Condition and Results of Operations” and “Business” discuss some of the factors that could contribute to these differences, including risks related to:
| • | conditions in the global economy; |
| • | the variability of our operating results between periods and the resulting difficulty in forecasting future results; |
| • | the need for increased spending on capital expenditures to meet customer demand and pursue growth opportunities; |
| • | our ability to compete successfully within our industry; |
| • | our substantial international operations; |
| • | fluctuations in foreign currency exchange rates; |
| • | changes in our customers’ products and processes; |
| • | the fact that we do not enter into long-term contracts with certain of our customers and the potential loss of those customers; |
| • | decreases in the average selling prices of products in our industry; |
| • | increases in the cost, or reductions in the supply, of the specialty and commodity chemicals used in our manufacturing processes; |
| • | costs related to compliance with health, safety and environmental laws and regulations, including global climate change legislation; |
| • | our ability to maintain and enhance our technological capabilities and to respond effectively to technological changes in our industry; |
| • | our substantial level of indebtedness and the effect of restrictions on our operations set forth in the documents that govern such indebtedness; |
| • | our compliance with certain financial maintenance covenants in our revolving credit facility and the effect on our liquidity of any failure to comply with such covenants; |
| • | our ability to protect our intellectual property, on which our business is substantially dependent, and our success in avoiding infringing the intellectual property rights of others; |
37
Table of Contents
| • | acquisitions of other businesses and our ability to integrate acquired operations into our operations; |
| • | the inherently hazardous nature of chemical manufacturing and the offshore oil production and drilling industry; |
| • | the costs of complying with government regulations and obtaining regulatory approval of our products; |
| • | risks related to the evaluation of our intangible asset values and the possibility of write-downs; |
| • | the loss of the services of key personnel; |
| • | our relationship with our employees; |
| • | disruptions in our operations or the operations of our suppliers, distributors, resellers or customers as a result of extraordinary events; |
| • | our ability to realize a benefit from our productivity initiatives; and |
| • | our role as a defendant in litigation that results from our business, including costs related to any damages we may be required to pay as a result of product liability claims brought against our customers. |
Because these and other unknown or unpredictable factors could adversely affect our results, our anticipated results or developments may not be realized or, even if substantially realized, they may not have the expected consequences to, or effects on, our business. Given these uncertainties, prospective investors are cautioned not to place undue reliance on any forward-looking statements in this prospectus. Forward-looking statements speak only as of the date they are made, and, except as required by law, we undertake no obligation to update or revise them publicly in light of new information or future events. All forward-looking statements attributable to us or persons acting on our behalf are expressly qualified in their entirety by this cautionary statement.
38
Table of Contents
We estimate that the net proceeds from the sale of shares of our common stock in this offering will be approximately $ million, assuming an initial public offering price of $ per share (the midpoint of the range set forth on the cover of this prospectus), after deducting estimated underwriting discounts and commissions and estimated offering expenses payable by us. Our net proceeds will increase by approximately $ million if the underwriters’ over-allotment option is exercised in full. Each $1.00 increase (decrease) in the assumed initial public offering price per share would increase (decrease) the net proceeds to us from this offering by $ million, assuming that the number of shares offered by us, as set forth on the cover of this prospectus, remains the same and after deducting the estimated underwriting discounts and commissions and estimated offering expenses payable by us.
We expect to use the net proceeds from this offering to prepay $ million of indebtedness under the Term Loan Facilities, to use $ million to repurchase or redeem $ aggregate principal amount of our outstanding Senior Subordinated Notes and to make payments to Court Square and Weston Presidio in connection with the termination of the advisory agreements and the consummation of this offering as described under “Certain Relationships and Related Party Transactions—Relationship with Court Square and Weston Presidio—Advisory Agreement” in the amount of $ million and $ million, respectively. We expect that any increase (decrease) in the net proceeds to us from this offering resulting from an increase (decrease) in the assumed initial public offering price per share will be allocated 50% to the amounts used to prepay indebtedness under the Term Loan Facilities and 50% to the amounts used to repurchase or redeem our Senior Subordinated Notes.
After giving effect to the prepayment of $ million of indebtedness under the Term Loan Facilities, we will have $ million of senior secured indebtedness outstanding under the Term Loan Facilities and $ million of availability under the Revolving Credit Facility. After giving effect to the use of $ million to repurchase or redeem a portion of our outstanding Senior Subordinated Notes, we will have $ million aggregate principal amount of Senior Subordinated Notes outstanding.
As of March 31, 2012, the weighted average interest rate for the three months ended March 31, 2012, applicable to the Tranche B Facility and Tranche C Facility, both of which mature on April 12, 2014, was 2.33% and 3.07%, respectively. The Senior Subordinated Notes bear interest at a rate of 9.50% per annum and mature on April 15, 2017.
None of Court Square, Weston Presidio or our other affiliates holds indebtedness under the Credit Facilities or our Senior Subordinated Notes. Accordingly, other than as a result of the payments to Court Square and Weston Presidio in connection with the termination of the advisory agreements, as described above, none of Court Square, Weston Presidio or our other affiliates will receive any of the net proceeds from this offering.
Affiliates of Credit Suisse Securities (USA) LLC are lenders under our senior secured credit facilities, which include our Term Loan Facilities. Based on amounts outstanding as of March 31, 2012 and assuming the above repayments, such affiliates would receive approximately $ from this offering upon any repayment of a portion of the borrowings outstanding under our Term Loan Facilities. See “Underwriting”.
39
Table of Contents
We intend to pay quarterly cash dividends in an amount equal to $ per share following completion of this offering. Whether we will do so, however, and the timing and amount of those dividends, will be subject to approval and declaration by our Board and will depend on a variety of factors, including the financial results, cash requirements and financial condition of the company, our ability to pay dividends under the credit agreement governing the Credit Facilities, the indenture governing the Senior Subordinated Notes and any other applicable contracts, and other factors deemed relevant by our Board.
Since MacDermid Group, Inc. is a holding company, its cash flow and ability to pay dividends are dependent upon the financial results and cash flows of MacDermid, Incorporated and its subsidiaries and the distribution or other payment of cash to MacDermid Group, Inc. in the form of dividends or otherwise.
40
Table of Contents
The following table sets forth our cash and cash equivalents and capitalization as of March 31, 2012, on:
| • | an actual basis, to reflect the cash and cash equivalents and capitalization of MacDermid, Incorporated and its consolidated subsidiaries as of March 31, 2012; and |
| • | an as adjusted basis, to reflect (1) the sale by us of shares of our common stock in this offering at an assumed initial offering price of $ per share (the midpoint of the range set forth on the cover of this prospectus) after deducting the estimated underwriting discounts and commissions and estimated offering expenses payable by us, (2) the application of the net proceeds therefrom as described in “Use of Proceeds” and (3) the consummation of the Corporate Reorganization, which will be a condition to the consummation of this offering. |
You should read this table in conjunction with “Use of Proceeds”, “Selected Consolidated Financial Information”, “Management’s Discussion and Analysis of Financial Condition and Results of Operations” and the audited and unaudited financial statements and related notes included elsewhere in this prospectus.
| As of March 31, 2012 | ||||||||
| Actual | As Adjusted(1) | |||||||
| (in thousands, except share and per share data) | (unaudited) | |||||||
| Cash and cash equivalents(1) |
$ | 109,311 | $ | |||||
|
|
|
|
|
|||||
| Debt: |
||||||||
| Credit Facilities(2) |
$ | 371,346 | $ | |||||
| Senior Subordinated Notes |
350,000 | |||||||
| Other bank facilities(3) |
9,090 | |||||||
|
|
|
|
|
|||||
| Total debt(1) |
730,436 | |||||||
|
|
|
|
|
|||||
| Stockholders’ equity: |
||||||||
| Cumulative preferred shares, 316,000 shares authorized and issued; 315,254 shares outstanding including cumulative dividends of $175,237 (Actual) |
491,237 | |||||||
| Common shares, $5.00 par value per share, 50,000,000 shares authorized, 9,946,140 shares issued and outstanding (Actual) |
50,000 | |||||||
| Common Stock, $0.01 par value per share, shares authorized, shares issued and outstanding (As adjusted) |
||||||||
| Additional paid-in capital |
2,254 | |||||||
| Accumulated deficit |
(280,359 | ) | ||||||
| Accumulated other comprehensive loss |
(9,261 | ) | ||||||
| Common and preferred shares in treasury, 746 preferred and 53,860 common (Actual) |
(1,006 | ) | ||||||
|
|
|
|
|
|||||
| Total stockholders’ equity(1) |
252,865 | |||||||
|
|
|
|
|
|||||
| Total capitalization |
$ | 983,301 | $ | |||||
|
|
|
|
|
|||||
| (1) | Assumes the net proceeds from this offering to us are $ million and reflects the use of the net proceeds to prepay $ million of indebtedness under the Term Loan Facilities, to use $ million to repurchase or redeem $ million aggregate principal amount of our outstanding Senior Subordinated Notes and to pay $ million to Court Square and $ million to Weston Presidio in connection with the termination of the advisory agreements and the consummation of this offering. A $1.00 increase (decrease) in the assumed initial public offering price of $ per share (the midpoint of the range set forth on the cover of this prospectus) would increase (decrease) the net proceeds to us by $ million, assuming the number of shares offered by us, as set forth on the cover of this prospectus, remains the same and after deducting underwriting discounts and commissions and estimated offering expenses payable by us, and would increase (decrease) our total debt by $ million and decrease (increase) our total stockholders’ equity by $ million. See “Use of Proceeds”. |
| (2) | As of March 31, 2012, $46.1 million was available to MacDermid, Incorporated under the Revolving Credit Facility. |
| (3) | Includes $8.0 million of Japanese Yen denominated debt and $1.1 million of capital lease obligations. |
41
Table of Contents
MacDermid Group, Inc. was incorporated in Delaware on June 17, 2011, in anticipation of this offering. MacDermid Group, Inc. is a direct, wholly owned subsidiary of MacDermid Holdings, LLC.
In anticipation of this offering, MacDermid Holdings, LLC and its subsidiaries will engage in a reorganization (the “Corporate Reorganization”), pursuant to which (1) MacDermid, Incorporated will effect a reverse stock split of MacDermid, Incorporated’s common stock and junior stock, (2) MacDermid Holdings, LLC and the MacDermid, Incorporated Profit Sharing and Employee Savings Plan (the “Savings Plan”), who comprise the existing stockholders of MacDermid, Incorporated, will exchange their shares of preferred stock, common stock and junior stock of MacDermid, Incorporated for the common stock of MacDermid Group, Inc. (such exchange, the “Exchange”) and (3) MacDermid Holdings, LLC will liquidate and distribute the shares of MacDermid Group, Inc. then held by it to the holders of its membership interests (which include preferred, common and junior membership interests). The diagram below illustrates our corporate structure immediately prior to the consummation of this offering and reflects actual ownership as of March 31, 2012, giving effect to the cancellation of all treasury shares.
The number of shares of the common stock of MacDermid Group, Inc. to be received by the existing holders of the membership interests of MacDermid Holdings, LLC and by the Savings Plan will be determined in accordance with the provisions of the limited liability company operating agreement of MacDermid Holdings, LLC and the governing documents of MacDermid, Incorporated. The effectiveness of the Corporate Reorganization is a condition to the consummation of this offering.
42
Table of Contents
Following the completion of the Corporate Reorganization, MacDermid Group, Inc. will own 100% of MacDermid, Incorporated. The MacDermid business will continue to be conducted through MacDermid, Incorporated and its domestic and foreign subsidiaries.
The diagram below illustrates our corporate structure immediately following consummation of this offering (and assumes a public offering price of $ (the midpoint of the range set forth on the cover of this prospectus)):
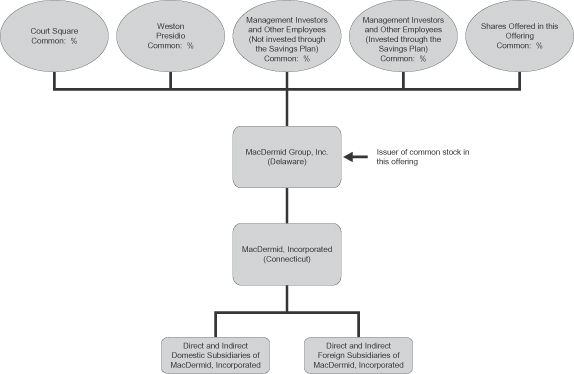
Please refer to “Principal Stockholders” for additional information on the ownership of MacDermid Group, Inc. following the completion of this offering.
43
Table of Contents
If you invest in our common shares, your interest will be diluted to the extent of the difference between the initial public offering price and the adjusted net tangible book value per share of the common stock of MacDermid Group, Inc. immediately after this offering. Net tangible book value per share is determined by dividing the total tangible assets of MacDermid Group, Inc. less its total liabilities by the number of shares of its common stock outstanding. The historical as adjusted net tangible book value, as of March 31, 2012, giving effect to the Corporate Reorganization and before giving effect to this offering, was $ , or $ per share.
After giving effect to (1) the sale of the shares of common stock of MacDermid Group, Inc. at an assumed initial public offering price of $ per share (the midpoint of the range set forth on the cover of this prospectus) and (2) the application of the estimated net proceeds from this offering as described in “Use of Proceeds”, after deducting the estimated underwriting discounts and commissions and estimated offering expenses payable by MacDermid Group, Inc., the as adjusted net tangible book value as of March 31, 2012, would have been $ , or $ per share. This estimate represents an immediate increase in net tangible book value of $ per share of common stock to Court Square, Weston Presidio and the other historical equity investors in MacDermid, Incorporated and the Savings Plan (collectively, the “Historical Equity Investors”) and an immediate dilution in net tangible book value of $ per share to investors purchasing shares of common stock of MacDermid Group, Inc. in this offering.
The following table illustrates this dilution on a per share basis:
| Assumed initial public offering price per share |
$ | |||||||
| Historical as adjusted net tangible book value per share as of March 31, 2012 before giving effect to this offering |
$ | |||||||
| Increase in historical as adjusted net tangible book value per share attributable to this offering |
$ | |||||||
| As adjusted net tangible book value per share after giving effect to this offering |
$ | |||||||
| Dilution per share to new investors |
$ |
A $1.00 increase (decrease) in the assumed initial public offering price per share would increase (decrease) the as adjusted net tangible book value after this offering by approximately $ , and the as adjusted net tangible book value per share after this offering by $ per share. It would also increase (decrease) the dilution per share to investors in this offering by $ per share, assuming the number of shares offered by MacDermid Group, Inc. under this prospectus remains the same and after deducting the estimated underwriting discounts and commissions and estimated offering expenses payable by us. The information discussed above is illustrative only and will adjust based on the actual initial public offering price and other terms of this offering determined at pricing.
The following table sets forth, on the same as adjusted basis as of March 31, 2012, (1) the number of shares of common stock of MacDermid Group, Inc. purchased from MacDermid Group, Inc., (2) the average price per share paid by the Historical Equity Investors before this offering and (3) the average price paid by investors participating in this offering, before deducting the estimated underwriting discounts and commissions and estimated offering expenses.
| Shares Purchased | Total Consideration | |||||||||||||||||
| Number | Percent of Outstanding Shares (after this offering and consummation of the Corporate Reorganization) |
Amount | Percent | Average Price per Share |
||||||||||||||
| Historical Equity Investors |
% | $ | % | $ | ||||||||||||||
| Investors in this offering |
% | $ | % | $ | ||||||||||||||
| Total |
% | $ | % | $ | ||||||||||||||
If the underwriters’ over-allotment option is exercised in full, (1) the as adjusted net tangible book value per share of common stock would be approximately $ and (2) dilution to new investors in as adjusted net tangible book value per share of common stock would be reduced to $ , or $ per share.
44
Table of Contents
SELECTED CONSOLIDATED FINANCIAL INFORMATION
The following selected consolidated financial data should be read together with “Management’s Discussion and Analysis of Financial Condition and Results of Operations” and the audited and unaudited consolidated financial statements and related notes included elsewhere in this prospectus.
We prepare our financial statements in accordance with U.S. GAAP. Our results for any historical period are not necessarily indicative of our results for any future period. You should read this selected financial data in conjunction with “Management’s Discussion and Analysis of Financial Condition and Results of Operations” and our consolidated financial statements and related notes included elsewhere in this prospectus.
MacDermid Group, Inc. was incorporated in Delaware on June 17, 2011. Prior to the completion of this offering, MacDermid Group, Inc. will have no material assets. Following the completion of this offering, MacDermid Group, Inc. will own all of the outstanding capital stock of MacDermid, Incorporated, which is the main U.S. operating entity for the MacDermid business and the direct or indirect parent entity of all the MacDermid operating companies, and the consolidated financial statements of MacDermid Group, Inc. will reflect the assets, liabilities and results of operations of MacDermid, Incorporated and its subsidiaries. Accordingly, in the first table that follows, we present the selected balance sheet data for MacDermid Group, Inc. as of March 31, 2012 and December 31, 2011 and, in the second table set forth below, we present the selected consolidated financial data for MacDermid, Incorporated and its subsidiaries for the periods set forth in the table.
The following table sets forth the selected balance sheet data of MacDermid Group, Inc. as of March 31, 2012 and December 31, 2011, which have been derived from the audited balance sheet (December 31, 2011 amounts) and unaudited balance sheet (March 31, 2012 amounts) included elsewhere in this prospectus.
| As
of March 31, 2012 (unaudited) |
As of December 31, 2011 |
|||||||
| MacDermid Group, Inc. Balance Sheet Data: |
||||||||
| Cash and cash equivalents |
$ | 100 | $ | 100 | ||||
| Total assets |
100 | 100 | ||||||
| Total equity |
100 | 100 | ||||||
In the table below, the selected consolidated statements of operations data for the years ended December 31, 2011, 2010 and 2009 and the selected consolidated balance sheet data as of December 31, 2011 and 2010 represent those of MacDermid, Incorporated as the successor entity following the acquisition of MacDermid, Incorporated by a group led by our chairman and chief executive officer, Daniel H. Leever, Court Square and Weston Presidio (the “Acquisition”) and have been derived from the audited financial statements of MacDermid, Incorporated included elsewhere in this prospectus.
45
Table of Contents
The selected consolidated historical financial data for the three months ended March 31, 2012 and 2011 and as of March 31, 2012 and 2011 have been derived from the unaudited condensed consolidated financial statements of MacDermid, Incorporated, which are included elsewhere in this prospectus. The unaudited financial statements have been prepared on the same basis as the audited financial statements and, in the opinion of our management, include all adjustments, including normal recurring adjustments, necessary for a fair presentation in all material respects of the information set forth therein. Results of operations for the interim periods are not necessarily indicative of the results that might be expected for any other interim period or for an entire year.
| (amounts in thousands, except share and per share data) |
Year ended December 31, | Three months ended March 31, |
||||||||||||||||||
| 2011 | 2010 | 2009 | 2012 | 2011 | ||||||||||||||||
| (unaudited) | ||||||||||||||||||||
| Statement of Operations Data: |
||||||||||||||||||||
| Net sales |
$ | 728,773 | $ | 694,333 | $ | 594,153 | $ | 182,195 | $ | 178,521 | ||||||||||
| Cost of sales |
388,298 | 371,223 | 333,963 | 95,884 | 94,980 | |||||||||||||||
|
|
|
|
|
|
|
|
|
|
|
|||||||||||
| Gross profit |
340,475 | 323,110 | 260,190 | 86,311 | 83,541 | |||||||||||||||
| Operating expenses: |
||||||||||||||||||||
| Selling, technical and administrative |
185,649 | 179,786 | 156,508 | 45,746 | 45,629 | |||||||||||||||
| Research and development |
22,966 | 21,005 | 20,103 | 6,718 | 5,359 | |||||||||||||||
| Amortization |
28,578 | 29,694 | 29,868 | 6,655 | 7,362 | |||||||||||||||
| Restructuring(1) |
896 | 6,234 | 4,228 | 114 | (181 | ) | ||||||||||||||
| Impairment charges(2) |
46,438 | — | 68,692 | — | — | |||||||||||||||
|
|
|
|
|
|
|
|
|
|
|
|||||||||||
| Total operating expenses |
284,527 | 236,719 | 279,399 | 59,233 | 58,169 | |||||||||||||||
| Operating profit (loss) |
55,948 | 86,391 | (19,209 | ) | 27,078 | 25,372 | ||||||||||||||
| Other income (expense): |
||||||||||||||||||||
| Interest income |
500 | 696 | 458 | 175 | 108 | |||||||||||||||
| Interest expense(3) |
(54,554 | ) | (56,196 | ) | (60,740 | ) | (13,556 | ) | (14,088 | ) | ||||||||||
| Miscellaneous income (expense)(4) |
9,412 | 15,106 | (5,020 | ) | (4,353 | ) | (16,172 | ) | ||||||||||||
|
|
|
|
|
|
|
|
|
|
|
|||||||||||
| Income (loss) from continuing operations before income taxes, non-controlling interest and accumulated payment-in-kind dividend on cumulative preferred shares |
11,306 | 45,997 | (84,511 | ) | 9,344 | (4,780 | ) | |||||||||||||
| Income tax (expense) benefit |
(9,953 | ) | (21,723 | ) | 6,427 | (4,366 | ) | (1,145 | ) | |||||||||||
|
|
|
|
|
|
|
|
|
|
|
|||||||||||
| Income (loss) from continuing operations |
1,353 | 24,274 | (78,084 | ) | 4,978 | (5,925 | ) | |||||||||||||
| (Loss) income from discontinued operations, net of tax(5) |
— | — | (4,448 | ) | — | — | ||||||||||||||
|
|
|
|
|
|
|
|
|
|
|
|||||||||||
| Income (loss) from continuing operations |
1,353 | 24,274 | (82,532 | ) | 4,978 | (5,925 | ) | |||||||||||||
| Less net income attributable to the non-controlling interest |
(366 | ) | (343 | ) | (295 | ) | (91 | ) | (88 | ) | ||||||||||
|
|
|
|
|
|
|
|
|
|
|
|||||||||||
| Net income (loss) attributable to MacDermid, Incorporated |
987 | 23,931 | (82,827 | ) | 4,887 | (6,013 | ) | |||||||||||||
| Accrued payment-in-kind dividend on cumulative preferred shares |
(40,847 | ) | (37,361 | ) | (34,124 | ) | (10,788 | ) | (9,874 | ) | ||||||||||
|
|
|
|
|
|
|
|
|
|
|
|||||||||||
| Net (loss) attributable to common shares |
$ | (39,860 | ) | $ | (13,430 | ) | $ | (116,951 | ) | $ | (5,901 | ) | $ | (15,887 | ) | |||||
|
|
|
|
|
|
|
|
|
|
|
|||||||||||
| Statement of Operations Data: |
||||||||||||||||||||
| Net (loss) attributable to MacDermid, Incorporated per share(6) |
||||||||||||||||||||
| Basic: |
||||||||||||||||||||
| (Loss) from continuing operations |
$ | (4.01 | ) | $ | (1.35 | ) | $ | (11.30 | ) | $ | (0.59 | ) | $ | (1.60 | ) | |||||
| (Loss) from discontinued operations(5) |
$ | — | $ | — | $ | (0.45 | ) | $ | — | $ | — | |||||||||
| Net loss |
$ | (4.01 | ) | $ | (1.35 | ) | $ | (11.75 | ) | $ | (0.59 | ) | $ | (1.60 | ) | |||||
| Diluted: |
||||||||||||||||||||
| (Loss) from continuing operations |
$ | (4.01 | ) | $ | (1.35 | ) | $ | (11.30 | ) | $ | (0.59 | ) | $ | (1.60 | ) | |||||
| (Loss) from discontinued operations(5) |
$ | — | $ | — | $ | (0.45 | ) | $ | — | $ | — | |||||||||
| Net loss |
$ | (4.01 | ) | $ | (1.35 | ) | $ | (11.75 | ) | $ | (0.59 | ) | $ | (1.60 | ) | |||||
| Weighted average shares Outstanding |
||||||||||||||||||||
| Basic |
9,942,777 | 9,932,862 | 9,951,799 | 9,946,419 | 9,932,132 | |||||||||||||||
| Diluted |
9,942,777 | 9,932,862 | 9,951,799 | 9,946,419 | 9,932,132 | |||||||||||||||
| Pro forma income per share(7) (unaudited) |
||||||||||||||||||||
| Basic and diluted |
$ | 0.03 | $ | 0.16 | ||||||||||||||||
| Pro forma weighted average number of common shares outstanding (unaudited) |
||||||||||||||||||||
| Basic |
31,387,359 | 31,387,359 | ||||||||||||||||||
| Diluted |
31,509,558 | 31,509,558 | ||||||||||||||||||
| Balance Sheet Data (End of Period): |
||||||||||||||||||||
| Cash and cash equivalents |
$ | 113,452 | $ | 106,740 | $ | 85,496 | $ | 109,311 | $ | 88,454 | ||||||||||
| Total assets |
$ | 1,221,418 | $ | 1,314,789 | $ | 1,307,206 | $ | 1,232,981 | $ | 1,311,010 | ||||||||||
| Total debt and capital lease obligations |
$ | 744,372 | $ | 784,612 | $ | 821,023 | $ | 730,436 | $ | 767,792 | ||||||||||
| Total equity |
$ | 241,806 | $ | 259,209 | $ | 216,304 | $ | 252,934 | $ | 269,338 | ||||||||||
46
Table of Contents
| (1) | Charges in the three months ended March 31, 2012 and 2011 and the years ended December 31, 2011, 2010 and 2009 relate to amounts recorded in connection with our operational restructuring initiatives. For a detailed description of these operational restructuring initiatives, see the discussion in “Management’s Discussion and Analysis of Financial Condition and Results of Operations”, Note 20 to our audited financial statements and Note 14 to our unaudited financial statements included in this prospectus. |
| (2) | In 2011, we recorded impairment charges of $46.4 million related to a write down of our customer list intangible assets to their estimated fair value as determined in accordance with ASC 360. In 2009, we recorded (i) impairment charges of $41.2 million related to a write down of our goodwill balance to its estimated fair value as determined in accordance with ASC 350, (ii) an impairment charge of $26.1 million related to a write down of an indefinite-lived purchased intangible asset to its estimated fair value as determined in accordance with ASC 350, (iii) an impairment charge of $0.2 million related to a write down of a finite-lived purchased intangible asset to its estimated fair value as determined in accordance with ASC 360 and (iv) an impairment charge of $1.2 million related to a write down of equipment to its estimated fair value as determined in accordance with ASC 360. For a detailed description of these impairment charges, see “Management’s Discussion and Analysis of Financial Condition and Results of Operations” and Note 5 to our audited financial statements included in this prospectus. |
| (3) | Primarily reflects interest expense associated with our long-term debt for periods after the Acquisition. |
| (4) | Represents remeasurement (gain) loss on foreign denominated debt as a result of changes in foreign exchange rates. For a detailed description of these remeasurement gains/losses charges, see the discussion of our miscellaneous (expense) income in “Management’s Discussion and Analysis of Financial Condition and Results of Operations”, Note 17 to our audited financial statements and Note 13 to our unaudited financial statements included in this prospectus. |
| (5) | Reflects loss (gain) from discontinued operations related to the sale of Offset in 2008 and the sale of our ColorSpan printing business in 2007. All operating results exclude amounts associated with discontinued operations. |
| (6) | The net loss per share attributable to MacDermid, Incorporated does not give effect to the Exchange, the effect of which is to reflect (i) the effective conversion of MacDermid, Incorporated’s cumulative preferred stock, including the accumulated payment in kind dividend with respect to such preferred stock at the time of the offering, into common stock of MacDermid Group, Inc. and (ii) the effective payment of a stock preference, in the form of MacDermid Group, Inc. common stock, in respect of MacDermid, Incorporated’s common stock, in each case, in accordance with our applicable governing documents. For further information related to our earnings per share calculations, please refer to Notes 2 and 23 to our audited financial statements and Notes 2 and 17 to our unaudited financial statements included in this prospectus. |
| (7) | The pro forma net income per share gives effect to the Exchange, the effect of which is to reflect (i) the effective conversion of MacDermid, Incorporated’s cumulative preferred stock, including the accumulated payment in kind dividend with respect to such preferred stock at the time of the offering, into common stock of MacDermid Group, Inc. and (ii) the effective payment of a stock preference, in the form of MacDermid Group, Inc. common stock, in respect of MacDermid, Incorporated’s common stock, in each case, in accordance with our applicable governing documents. For further information related to our pro forma net income per share calculations, please refer to Notes 2 and 23 to our audited financial statements and Notes 2 and 17 to our unaudited financial statements included in this prospectus. |
47
Table of Contents
MANAGEMENT’S DISCUSSION AND ANALYSIS OF FINANCIAL CONDITION AND RESULTS OF OPERATIONS
The following is a discussion and analysis of the financial position and results of operations for MacDermid, Incorporated and its consolidated subsidiaries for each of the three years ended December 31, 2011, 2010 and 2009, and the three months ended March 31, 2012 and 2011. You should read the following discussion of our results of operations and financial condition together with “Selected Consolidated Financial Information” and the audited consolidated financial statements and related notes of MacDermid, Incorporated and its consolidated subsidiaries included elsewhere in this prospectus. This discussion contains forward looking statements and involves numerous risks and uncertainties, including, but not limited to, those described under the heading “Risk Factors”. Actual results may differ materially from those contained in any forward-looking statements. In this “Management’s Discussion and Analysis of Financial Condition and Results of Operations”, references to the “company”, “we”, “us” and “our” refer to MacDermid, Incorporated and its consolidated subsidiaries.
Overview
Our Business and its Competitive Strengths
We are a global producer of high technology specialty chemical products and provider of technical services. Our business involves the manufacture of a broad range of specialty chemicals, which we create by blending raw materials, and the incorporation of these chemicals into multi-step technological processes. We refer to our products as “dynamic chemistries” due to their delicate chemical compositions, which are frequently altered during customer use.
We generate revenue through the manufacture and sale of our dynamic chemistries to customers in the electronics, metal and plastic plating, graphic arts, and offshore oil production and drilling industries, and by providing highly technical, post-sale service to our customers to ensure that the chemical composition and function of our dynamic chemistries are maintained as intended. We recognize the revenue from the sale of our products upon shipment to our customers. In the year ended December 31, 2011 and in the three months ended March 31, 2012, we generated net sales of $728.8 million and $182.2 million, respectively. We believe, based on our 2011 net sales, that a majority of our operations hold leading positions in the product markets they serve, including the number one or number two market share positions held by Electronic Solutions and Industrial Solutions in the product markets they serve.
We believe several key differentiating elements of our business have enabled us to focus on high growth opportunities, maintain high margins and a high return on invested capital, and generate stable and strong cash flows. Through our “asset-lite, high-touch” business model, we dedicate extensive resources to research and development and our highly technical, post-sale customer service, while limiting our investments in fixed assets and capital expenditures. Our capital expenditures for the year ended December 31, 2011 and the three months ended March 31, 2012 were $8.7 million and $1.5 million, respectively, accounting for 1.2% and 0.8% of our net sales during the corresponding period, respectively.
We believe our proprietary technology, extensive industry experience and customer service-focused business model are difficult for our competitors to replicate. In addition, we believe the expense to our customers of changing processes or suppliers is relatively high compared to the potential cost savings. As a result, our customers are disincentivized from switching to our competitors’ products. As of December 31, 2011, we served more than 3,500 customers worldwide through our global network of 14 manufacturing sites, 21 technical service facilities, including 8 research and development centers, in 24 countries. Our international reach, coupled with our local presence, enables us to meet the global and local needs of our customers. We leverage our close customer relationships to execute our growth strategies by working with our customers to identify opportunities for new products, which we develop by drawing upon our significant intellectual property portfolio and technical expertise.
48
Table of Contents
The products we create, which are manufactured from over 1,000 raw materials, are used by our customers in numerous and diverse end markets. The diversity of our materials and suppliers, our end markets, our products, our product applications, our customer base and the range of geographic regions in which we operate helps to mitigate the effects of any adverse event affecting a particular raw material or a specific end market or region. In many of the regions in which we operate, we are able to increase our prices in response to increases in our costs. For example, during the second half of 2010, we experienced increases in the prices of certain raw materials used in our products, most notably the prices of gold, silver and palladium. To partially offset these increases in raw material costs, we implemented product surcharges and selective price increases. Although our cost of sales increased by 11.2% to $371.2 million in the year ended December 31, 2010 as compared to $334.0 million in the same period in 2009, our gross profit from these sales increased by 24.2% from 2009 to 2010. The increase in our cost of sales was due to an increase in our costs of raw materials, an increase in variable compensation due to increased sales and the elimination of temporary cost reductions made in 2009 due to the economic downturn.
Our Operational Structure
We manage and report our business in two operating segments: an Industrial segment and a Printing segment. In the fiscal year ended December 31, 2011, our Industrial and Printing segments generated net sales of $568.6 million and $160.2 million, respectively. For the three months ended March 31, 2012, our Industrial and Printing segments generated net sales of $140.5 million and $41.7 million, respectively.
The Industrial segment is composed of three businesses that share manufacturing facilities and administrative resources. In our Electronic Solutions business, we design and formulate a complete line of proprietary “wet” dynamic chemistries that our customers use to coat or “plate” the surface of the printed circuit boards and other electronic components they manufacture. In our Industrial Solutions business, we provide dynamic chemistries for finishing, cleaning and providing surface coatings for a broad range of metal and non-metal surfaces. Through our Offshore Solutions business, we produce water-based hydraulic control fluids for major oil companies and drilling contractors for offshore deep water production and drilling applications.
We further divide each of these three businesses into three geographic regions: Asia, Europe and the Americas (which includes North America and South America). Our operations in Europe and the Americas are dominated by our Industrial Solutions business, and our operations in Asia are dominated by our Electronic Solutions business.
The Printing segment represents one business and is further subdivided into three geographic regions: Asia, Europe and the Americas. Our operations in the Printing segment are predominately in the Americas, although we intend to expand further into Europe and Asia. Through our Printing segment, we supply an extensive line of flexographic plates that are used in the commercial packaging and commercial printing industries. Over the last three years, we have shifted our business mix to refocus this segment on high innovation, higher cash flow businesses by divesting two capital intensive, lower growth businesses.
Because our businesses within the Industrial segment share facilities and resources and our business in the Printing segment is distinct from each of the businesses within the Industrial segment, we make decisions about how to manage our operations by reference to each segment and not with respect to the underlying businesses or geographic regions that comprise each segment.
The Acquisition
On April 12, 2007, MacDermid, Incorporated, which had been a publicly traded company since 1966, was acquired by a group led by our chairman and chief executive officer, Daniel H. Leever, Court Square and Weston Presidio. In connection with the Acquisition, MacDermid, Incorporated incurred significant indebtedness under our Credit Facilities and the Senior Subordinated Notes. The purchase price paid in connection with the Acquisition was allocated to the acquired assets and assumed liabilities at their fair value. The purchase accounting adjustments (1) increased the carrying value of our property, plant and equipment, (2) established
49
Table of Contents
intangible assets for our tradenames, customer lists and developed technology and (3) established goodwill related to the difference between the purchase price and the fair value of the assets and liabilities as of the Acquisition date. Subsequent to the Acquisition, interest expense and non-cash depreciation and amortization charges significantly increased. During 2009, we recorded impairment charges of $68.7 million to reduce the goodwill asset, customer lists, tradename and equipment assets established at the time of the Acquisition. During 2011, we recorded impairment charges of $46.4 million related to a write down of a portion of the customer list intangible assets of our Industrial Asia reporting unit established at the time of the Acquisition.
Outlook
In both of our segments, we continue to invest significant resources in research and development and in our intellectual property. We focus on growing revenues and generating cash from operations in order to build stockholder value. Specifically, we plan to improve revenue growth over the longer term by focusing on:
| • | utilizing our technical capabilities, strong customer relationships, proprietary know how and knowledge of our industry to extend the breadth of our product offerings and to continue to grow internationally as our existing multinational customers penetrate into emerging regions; |
| • | capitalizing on our core competencies and developing new applications for our core processes to expand into high-growth markets that are adjacent to the markets we currently serve; |
| • | maintaining our focus on investing in technology and research and development; |
| • | leveraging our existing customer relationships to identify new product opportunities and develop new technologies; |
| • | reducing operating expenses through facility optimization, product and raw material rationalization and by maintaining a relatively fixed cost structure that supports increasing revenues as our strategies are successful; |
| • | maximizing cash flow to further invest in our business and reduce our indebtedness; and |
| • | attracting and retaining highly skilled employees who can serve our customers effectively. |
As part of our efforts to expand our businesses globally, we also intend to selectively pursue strategic acquisitions, where and when appropriate, to expand or complement our existing operations. For example, in February 2012, we acquired 95% of the outstanding equity of a chemical business in Brazil for a total purchase price of $10.7 million. We believe this acquisition complements our existing service and product offerings in Brazil. We expect that any future acquisitions will be consistent with our core businesses, will strengthen our relationships with our customers, and will enhance our existing products and technological capabilities or lower our operating costs.
Our ability to increase revenues in the future will depend, in part, on our success in penetrating our competitors’ markets, developing new and improved products, managing our raw material costs and leveraging our existing customer base across all product lines. We also continually evaluate ways to lower our operating costs, including by realigning existing manufacturing capacities, closing facilities, discontinuing certain operations or taking other similar actions.
Certain Key Conditions that Affect our Operations
Our industry is complex, competitive and global, and our products are sold into diverse, international markets, which expose us to certain risks, including certain trends or conditions that may materially affect our business. The trends and conditions that have the most significant impact on our business include those related to the global economy and our industry, our competitive landscape and foreign currency exposure.
50
Table of Contents
Global Economic and Industry Conditions
Our products are sold in industries that are sensitive to changes in general economic conditions. Accordingly, our net sales, gross profit and financial condition depend significantly on general economic conditions and the impact of these conditions on demand for our dynamic chemistries and services in the markets in which we compete. Our business is particularly impacted by demand for chemistry products utilized in the automotive, printed circuit board, offshore oil production and commercial packaging industries. In 2009, decreased global automotive demand and production cuts in the automotive markets as well as reduced demand in the industrial and commercial packaging market negatively impacted our net sales and profitability. Beginning in 2010, we experienced increased demand for our Industrial products that continued in 2011.
Beginning in 2008, we began executing a series of operational restructuring initiatives that streamlined our organizational structure and reduced our workforce in our manufacturing, research and development, selling and technical and general and administrative functions. As of March 31, 2012, with the exception of finalizing certain operational restructuring programs in our Industrial Europe operations, we had completed the majority of these operational restructuring actions.
Our net sales of $694.3 million for the year ended December 31, 2010 were 16.9% greater than our net sales for the year ended December 31, 2009. As a result, in 2010 we selectively increased our headcount and our capital expenditures to meet the required increase in production. Our net sales of $728.8 million for the year ended December 31, 2011 were 5.0% greater than our net sales for the year ended December 31, 2010. We are currently experiencing more balance in our customer demand and inventory levels, and we expect that overall market conditions will continue to return to a more normalized level, although we cannot assure you that they will do so.
Our businesses are also significantly influenced by trends and characteristics in the specialty chemical industry and the printing industry. These industries are cyclical and subject to constant and rapid technological change, product obsolescence, price erosion, evolving standards, short product life-cycles, raw material price fluctuations and changes in product supply and demand.
The specialty chemical industry is currently being affected by globalization and a shift in our customers’ businesses out of traditional geographic markets and into high-growth, emerging markets. In 2010 and 2011, operations in our Industrial segment continued to experience growth. Our Industrial Asia operations experienced sales growth of 24.3% for the year ended December 31, 2010 compared to the same period in 2009. We also experienced sales growth of 16.6% in our Industrial Americas operations and 16.4% in our Industrial Europe operations for the year ended December 31, 2010 compared to the same period in 2009. We experienced sales growth of 6.6% in our Industrial Americas operations and 12.8% in our Industrial Europe operations for the year ended December 31, 2011 compared to the same period in 2010.
The printing industry is currently characterized by markets with more potential sellers than buyers, which reflects, in part, the newspaper closures and consolidations that have occurred during the past three years. We have experienced modest sales growth for our Printing segment during the year ended December 31, 2011 compared to the same period in 2010, driven by a shift to higher margin product offerings and the reduction or elimination of lower margin product offerings. Our sale of newspaper plates has been adversely impacted by recent newspaper closures and consolidations as well as a decrease in capital spending by the end market customer base.
Net sales in future periods will depend, among other factors, upon a continued general improvement in global economic conditions, our ability to meet unscheduled or temporary changes in demand, and our ability to penetrate new markets with strategic product initiatives in specific targeted markets.
51
Table of Contents
Our Competitive Landscape
Our industry is highly competitive, and most of our product lines compete against product lines from two or more competitors. In our Industrial segment, our products compete not only with similar products manufactured by our competitors, but also against a variety of chemical and non-chemical alternatives provided by our competitors.
New competitive products and processes or changes in the pricing policies of our competitors could materially affect demand for and pricing of our products, which could have a significant impact on our financial results. In addition, some of our competitors have greater financial, technical and marketing resources than we do and may be able to devote greater resources to promoting and selling certain products. Unlike many of our competitors who specialize in a single or limited number of product lines, we have a portfolio of businesses and must allocate resources across those businesses. Additionally, because many of our competitors are small divisions of large, international businesses, they may have access to greater resources than we do and may therefore be better able to withstand a change in conditions within our industry and throughout the economy as a whole. Although we face significant competition from specialty chemical companies and divisions of all shapes and sizes, we believe our business model enables us to retain the leading positions held by a majority of our operations in the product markets they serve, including the number one or number two market share positions held by Electronic Solutions and Industrial Solutions in the product markets they serve.
Foreign Currency Exposure
For the years ended December 31, 2011, 2010 and 2009, approximately 69%, 68% and 67% of our net sales were denominated in currencies other than the U.S. Dollar, respectively. For the three months ended March 31, 2012 and 2011, approximately 67% and 68% of our net sales were denominated in currencies other than the U.S. Dollar, respectively. These currencies are predominantly the Euro, British Pound Sterling, Hong Kong Dollar, Chinese Yuan, Japanese Yen and Brazilian Real. We do not manage our foreign currency exposure in a manner that eliminates the effects of changes in foreign exchange rates on our net sales, cash flows or the fair values of our assets and liabilities. Therefore, our financial performance is positively or negatively impacted by changes in foreign exchange rates in any given reporting period. For most currencies, we are a net receiver of the foreign currency and therefore benefit from a weaker U.S. Dollar and are adversely affected by a stronger U.S. Dollar relative to the foreign currency.
For the year ended December 31, 2011, net sales were positively impacted as the U.S. Dollar weakened against the Euro, British Pound Sterling, Chinese Yuan, Brazil Real and Japanese Yen when compared to 2010. However, the absolute impact on our 2011 net sales was not material.
Selected Statement of Operations Items
Net Sales
Revenue is generated from the sale of our specialty chemicals products and processes to our customers. Our net sales represent revenues generated by our total sales offset by the effect of any rebates and credits for products that are returned to us. We recognize revenue, including freight charged to customers, when our products are shipped to or received by our customers in accordance with the terms of the applicable sales agreement, when title and risk of loss have been transferred, collectability is probable and pricing is fixed or determinable. Sales arrangements may include right of inspection, acceptance provisions and transfer of title, in which case revenue is deferred until these provisions are satisfied.
52
Table of Contents
Cost of Sales
Cost of sales consists primarily of raw material costs and related purchasing and receiving costs used in the manufacturing process, direct salary and wages and related fringe benefits, packaging costs, shipping and handling costs, plant overhead and other costs associated with the manufacture and distribution of our products.
Gross Profit
Our gross profit is significantly influenced by our raw material prices and our absorption rate. Our absorption rate refers only to our manufacturing facilities and is based on the capacity of the manufacturing facilities. As absorption rates increase, there is more operating leverage because fixed manufacturing costs are spread over higher output. Our gross profit margins are also significantly influenced by our raw material costs. Our gross profit margins have improved by approximately 12.3% since the first quarter of 2009 to 47.4% in the first quarter of 2012 due in large part to our operational restructuring programs and improved inventory management.
Selling, Technical and Administrative Expenses
Selling, technical and administrative expenses consist primarily of personnel and travel costs, advertising and marketing expenses, administrative expenses associated with accounting, finance, legal, human resources and risk management and overhead associated with these functions. Selling expenses consist primarily of compensation and associated costs for sales and marketing personnel, costs of advertising, trade shows and corporate marketing. Technical expenses consist primarily of compensation and associated costs for technical support personnel who support our products. General and administrative expense consists primarily of compensation and associated costs for executive management, finance, legal and other administrative personnel, outside professional fees and other corporate expenses.
Research and Development Expenses
Research and development expenses are expensed as incurred and include the cost of activities attributable to development and pre-production efforts associated with designing, developing and testing new or significantly enhanced products or process and packaging technology. These costs consist primarily of compensation and associated costs for our engineers engaged in the design and development of our products and technologies.
Other Operating Expenses
Amortization expense reflects the charges incurred to amortize our finite-lived intangible assets, such as developed technology and customer lists, which are amortized on a straight-line basis over their estimated useful lives. The estimated useful lives of the assets are currently ten years for developed technology and range between three and 21 years for customer lists.
Our operational restructuring expenses are related to the series of operational restructuring initiatives described above that we undertook beginning in 2008 as a result of the downturn in global economic conditions. As of March 31, 2012, with the exception of finalizing some operational restructuring programs in our Industrial Europe operations, we had completed the majority of these operational restructuring actions.
We do not amortize goodwill or other intangible assets that have indefinite useful lives; rather, goodwill and other intangible assets with indefinite lives are tested for impairment. Expenses for impairment charges are related to the write down of our goodwill balances and to our intangible assets balances. See “—Significant Accounting Policies and Critical Estimates” below for additional information.
53
Table of Contents
Other Income (Expense)
Our interest income reflects the interest we receive on our investments, including those other than cash that are held on a short- and long-term maturity basis. Our interest expense reflects the interest we pay on our outstanding indebtedness. Our miscellaneous (expense) income results primarily from currency-related gains and losses that relate to our indebtedness that is denominated in currencies other than the U.S. Dollar, as discussed above.
Results of Operations
The following table summarizes certain information relating to our operating results that has been derived from our consolidated financial statements.
| Statement of Operations Data: | Year ended December 31, | Three months ended March 31, |
||||||||||||||||||
| (amounts in thousands) | 2011 | 2010 | 2009 | 2012 | 2011 | |||||||||||||||
| (unaudited) | ||||||||||||||||||||
| Net sales |
$ | 728,773 | $ | 694,333 | $ | 594,153 | $ | 182,195 | $ | 178,521 | ||||||||||
| Cost of sales |
388,298 | 371,223 | 333,963 | 95,884 | 94,980 | |||||||||||||||
|
|
|
|
|
|
|
|
|
|
|
|||||||||||
| Gross profit |
340,475 | 323,110 | 260,190 | 86,311 | 83,541 | |||||||||||||||
| Operating expenses: |
||||||||||||||||||||
| Selling, technical and administrative |
185,649 | 179,786 | 156,508 | 45,746 | 45,629 | |||||||||||||||
| Research and development |
22,966 | 21,005 | 20,103 | 6,718 | 5,359 | |||||||||||||||
| Amortization |
28,578 | 29,694 | 29,868 | 6,655 | 7,362 | |||||||||||||||
| Restructuring(1) |
896 | 6,234 | 4,228 | 114 | (181 | ) | ||||||||||||||
| Impairment charges(2) |
46,438 | — | 68,692 | — | — | |||||||||||||||
|
|
|
|
|
|
|
|
|
|
|
|||||||||||
| Total operating expenses |
284,527 | 236,719 | 279,399 | 59,233 | 58,169 | |||||||||||||||
| Operating profit (loss) |
55,948 | 86,391 | (19,209 | ) | 27,078 | 25,372 | ||||||||||||||
| Other income (expense): |
||||||||||||||||||||
| Interest income |
500 | 696 | 458 | 175 | 108 | |||||||||||||||
| Interest expense(3) |
(54,554 | ) | (56,196 | ) | (60,740 | ) | (13,556 | ) | (14,088 | ) | ||||||||||
| Miscellaneous income (expense)(4) |
9,412 | 15,106 | (5,020 | ) | (4,353 | ) | (16,172 | ) | ||||||||||||
|
|
|
|
|
|
|
|
|
|
|
|||||||||||
| Income (loss) from continuing operations before income taxes, non-controlling interest and accumulated payment-in-kind dividend on cumulative preferred shares |
11,306 | 45,997 | (84,511 | ) | 9,344 | (4,780 | ) | |||||||||||||
| Income tax (expense) benefit |
(9,953 | ) | (21,723 | ) | 6,427 | (4,366 | ) | (1,145 | ) | |||||||||||
|
|
|
|
|
|
|
|
|
|
|
|||||||||||
| Income (loss) from continuing operations |
1,353 | 24,274 | (78,084 | ) | 4,978 | (5,925 | ) | |||||||||||||
| (Loss) from discontinued operations, net of tax(5) |
— | — | (4,448 | ) | — | — | ||||||||||||||
|
|
|
|
|
|
|
|
|
|
|
|||||||||||
| Net income (loss) |
1,353 | 24,274 | (82,532 | ) | 4,978 | (5,925 | ) | |||||||||||||
| Less net income attributable to the non-controlling interest |
(366 | ) | (343 | ) | (295 | ) | (91 | ) | (88 | ) | ||||||||||
|
|
|
|
|
|
|
|
|
|
|
|||||||||||
| Net income (loss) attributable to MacDermid, Incorporated |
$ | 987 | $ | 23,931 | $ | (82,827 | ) | $ | 4,887 | $ | (6,013 | ) | ||||||||
|
|
|
|
|
|
|
|
|
|
|
|||||||||||
| (1) | Charges in the three months ended March 31, 2012 and 2011 and the years ended December 31, 2011, 2010 and 2009 relate to amounts recorded in connection with our operational restructuring initiatives. For a detailed description of these operational restructuring initiatives, see the discussion below, under the headings “Operational Restructuring Expenses”, Note 20 to our audited financial statements and Note 14 to our unaudited financial statements included in this prospectus. |
54
Table of Contents
| (2) | In 2011, we recorded impairment charges of $46.4 million related to a write down of our customer list intangible assets to their estimated fair value as determined in accordance with ASC 360. In 2009, we recorded (i) impairment charges of $41.2 million related to a write down of our goodwill balance to its estimated fair value as determined in accordance with ASC 350, (ii) an impairment charge of $26.1 million related to a write down of an indefinite-lived purchased intangible asset to its estimated fair value as determined in accordance with ASC 350, (iii) an impairment charge of $0.2 million related to a write down of a finite-lived purchased intangible asset to its estimated fair value as determined in accordance with ASC 360 and (iv) an impairment charge of $1.2 million related to a write down of equipment to its estimated fair value as determined in accordance with ASC 360. For a detailed description of these impairment charges, see the discussion under the headings “Impairment Charges” below and Note 5 to our audited financial statements included in this prospectus. |
| (3) | Primarily reflects interest expense associated with our long-term debt for periods after the Acquisition. |
| (4) | Represents remeasurement (gain) loss on foreign denominated debt as a result of changes in foreign exchange rates. For a detailed description of these remeasurement gains/losses charges, see the discussion under the headings “Miscellaneous (Expense) Income” in this section below, Note 17 to our audited financial statements and Note 13 to our unaudited financial statements included in this prospectus. |
| (5) | Reflects loss (gain) from discontinued operations related to the sale of Offset in 2008 and the sale of our ColorSpan printing business in 2007. All operating results exclude amounts associated with discontinued operations. |
The following table summarizes certain information relating to our operating results as a percentage of total revenues and has been derived from the financial information presented above. We believe this presentation is useful to investors in comparing historical results. Certain amounts in the table may not sum due to the rounding of individual components.
| Year ended December 31, | Three months ended March 31, |
|||||||||||||||||||
| 2011 | 2010 | 2009 | 2012 | 2011 | ||||||||||||||||
| Net sales |
100.0 | % | 100.0 | % | 100.0 | % | 100.0 | % | 100.0 | % | ||||||||||
| Cost of sales |
53.3 | % | 53.5 | % | 56.2 | % | 52.6 | % | 53.2 | % | ||||||||||
| Gross profit |
46.7 | % | 46.5 | % | 43.8 | % | 47.4 | % | 46.8 | % | ||||||||||
| Operating expenses: |
||||||||||||||||||||
| Selling, technical and administrative |
25.5 | % | 25.9 | % | 26.3 | % | 25.1 | % | 25.6 | % | ||||||||||
| Research and development |
3.2 | % | 3.0 | % | 3.4 | % | 3.7 | % | 3.0 | % | ||||||||||
| Amortization |
3.9 | % | 4.3 | % | 5.0 | % | 3.7 | % | 4.1 | % | ||||||||||
| Restructuring |
0.1 | % | 0.9 | % | 0.7 | % | 0.1 | % | -0.1 | % | ||||||||||
| Impairment charges |
6.4 | % | * | 11.6 | % | * | * | |||||||||||||
| Total operating expenses |
39.0 | % | 34.1 | % | 47.0 | % | 32.5 | % | 32.6 | % | ||||||||||
| Operating profit (loss) |
7.7 | % | 12.4 | % | -3.2 | % | 14.9 | % | 14.2 | % | ||||||||||
| Other income (expense): |
||||||||||||||||||||
| Interest income |
0.1 | % | 0.1 | % | 0.1 | % | 0.1 | % | 0.1 | % | ||||||||||
| Interest expense |
-7.5 | % | -8.1 | % | -10.2 | % | -7.4 | % | -7.9 | % | ||||||||||
| Miscellaneous (expense) income |
1.3 | % | 2.2 | % | -0.8 | % | -2.4 | % | -9.1 | % | ||||||||||
| Income (loss) from continuing operations before income taxes, non-controlling interest and accumulated payment-in-kind dividend on cumulative preferred shares |
1.6 | % | 6.6 | % | -14.2 | % | 5.1 | % | -2.7 | % | ||||||||||
| Income tax (expense) benefit |
-1.4 | % | -3.1 | % | 1.1 | % | -2.4 | % | -0.6 | % | ||||||||||
| Income (loss) from continuing operations |
0.2 | % | 3.5 | % | -13.1 | % | 2.7 | % | -3.3 | % | ||||||||||
| (Loss) from discontinued operations, net of tax |
* | * | -0.7 | % | * | * | ||||||||||||||
| Net income (loss) |
0.2 | % | 3.5 | % | -13.9 | % | 2.7 | % | -3.3 | % | ||||||||||
| Less net income attributable to the non-controlling interest |
-0.1 | * | * | * | * | |||||||||||||||
| Net income (loss) attributable to MacDermid, Incorporated |
0.1 | % | 3.5 | % | -13.9 | % | 2.7 | % | -3.4 | % | ||||||||||
| * | Not meaningful. |
55
Table of Contents
Three Months Ended March 31, 2012 Compared to Three Months Ended March 31, 2011
Net Sales
Our net sales of $182.2 million for the three months ended March 31, 2012 increased by $3.7 million, or 2.1%, compared to the same period in 2011. Our net sales for the three months ended March 31, 2012 were negatively impacted by $1.6 million due to the increase in value of the U.S. Dollar during the three months ended March 31, 2012 compared to the same period in 2011. We believe that net sales of products that we have identified as new products, which represent opportunities to enter markets adjacent to those we currently serve, was $13.9 million for the three months ended March 31, 2012, compared to $12.3 million for the same period in 2011. Our Industrial segment net sales for the three months ended March 31, 2012 were flat compared to the same period in 2011, primarily attributable to an increase of $6.3 million in our Offshore Solutions business offset by a decrease of $2.5 million in our Industrial Solutions business and a decrease of $3.8 million in our Electronic Solutions business. The 38.7% increase in net sales in our Offshore Solutions business was primarily due to increased customer demand. The 9.6% decrease in net sales in our Electronics Solutions business was primarily due to lower sales in Asia as we exited certain lower margin product markets in 2011. Our Printing segment had higher net sales for the three months ended March 31, 2012 of $3.6 million, or 9.6%, compared to the same period in 2011.
Our Industrial Americas operations had the largest increase in net sales among the operations in our Industrial segment for the three months ended March 31, 2012, of $5.3 million, or 13.4%, due to higher offshore product sales of $3.1 million as a result of increased customer demand, higher sales of $1.6 million in the Industrial Americas operations due to higher sales of our industrial products and $0.8 million of sales related to an acquisition of a company in Brazil which closed in February 2012. Our Industrial Europe operations had higher net sales of $0.4 million, or 0.7% for the three months ended March 31, 2012 compared to the same period in 2011. Our sales for the three months ended March 31, 2012 were adversely impacted by the U.S. Dollar increasing in value against both the Euro (4.2%) and the British Pound Sterling (1.9%) for the three months ended March 31, 2012 compared to the same period in 2011. The increase in value of the U.S. Dollar for the three months ended March 31, 2012 was offset by increased industrial product sales in Germany and Italy within our Industrial Europe operations, in each case compared to the same period in 2011. Our Industrial Asia operations had lower sales of $5.7 million, or 11.3%, for the three months ended March 31, 2012 compared to the same period in 2011 due to our exit of certain lower margin product markets in 2011.
Our Printing Asia operations had lower net sales for the three months ended March 31, 2012, of $0.1 million, or 1.4%, compared to the same period in 2011, due to decreased sales of lower margin analog plates relative to higher margin digital plates in Asia. Our Printing Americas operations reported higher net sales levels for the three months ended March 31, 2012 of $1.4 million, or 6.5%, compared to the same period in 2011 due to stronger customer demand for digital printing sheets and the introduction of new products. This increase primarily reflected a gain in market share as a result of customers switching to our LUX® process. Our Printing Europe operations had higher net sales for the three months ended March 31, 2012 of $2.3 million, or 19.2%, compared to the same period in 2011 primarily because of increased customer orders and new product sales, offset by a weaker Euro as compared to the U.S. Dollar for the three months ended March 31, 2012 compared to the same period in 2011.
Changes in our product mix and the average selling prices of our products did not have a material impact on our net sales for the three months ended March 31, 2012 compared to the same period in 2011.
Gross Profit
For the three months ended March 31, 2012, our gross profit increased $2.8 million, or 3.3%, compared to the same period in 2011. Our gross profit for the three months ended March 31, 2012 was negatively impacted by $0.9 million due to the increase in value of the U.S. Dollar during the three months ended March 31, 2012 compared to the same period in 2011. The increase was attributable to higher net sales, offset by increased raw material costs. As a percentage of net sales, gross profit for the three months ended March 31, 2012 was 47.4%,
56
Table of Contents
as compared to 46.8% for the same period in 2011. The increase in gross profit percentage was primarily due to higher sales for the three months ended March 31, 2012 as compared to the same period in 2011. Changes in our product mix and the average selling prices of our products did not have a material impact on our gross profit for the three months ended March 31, 2012 compared to the same period in 2011.
Selling, Technical and Administrative Expenses
Our selling, technical and administrative expenses increased $0.1 million, or 0.3%, for the three months ended March 31, 2012 compared to the same period in 2011. This increase was primarily the result of higher selling expenses associated with our higher sales for the three months ended March 31, 2012 as compared to the same period in 2011, an increase in salary expenses for the three months ended March 31, 2012 as compared to the same period in 2011 and higher corporate bonus expense of $0.5 million recorded for the three months ended March 31, 2012 compared to the same period in 2011, offset by a decrease in travel expense and lower selling, technical and administrative expenses in our Industrial Asia operations for the three months ended March 31, 2012 compared to the same period in 2011. As a percentage of our net sales, our selling, technical and administrative expenses were 25.1% for the three months ended March 31, 2012 compared to 25.6% for the same period in 2011. This decrease is primarily due to the increase in net sales for the three months ended March 31, 2012 compared to the same period in 2011.
Research and Development Expenses
Our research and development expenses for the three months ended March 31, 2012 increased $1.4 million, or 25.4%, from the same period in 2011. This increase was primarily due to increased research and development activity during the three months ended March 31, 2012 compared to the same period in 2011. As a percentage of our net sales, our research and development expenses were 3.7% for the three months ended March 31, 2012, as compared to 3.0% for the same period in 2011. The increase is due to higher product development costs for the three months ended March 31, 2012, as compared to the same period in 2011.
Amortization Expenses for Finite-Lived Purchased Intangible Assets
Amortization expenses for finite-lived purchased intangible assets related to developed technology and customer lists for the three months ended March 31, 2012 decreased by $0.7 million, or 9.6%, compared to the same period in 2011. This decrease is due to lower amortization expense recorded for the three months ended March 31, 2012 subsequent to the impairment charge recorded in 2011.
Operational Restructuring Expenses
During the three months ended March 31, 2012, we recorded $0.1 million of restructuring expense. We recorded $0.2 million related to the elimination of three positions in our Industrial Europe operations. Additionally, we reversed $(0.1) million related to accrued benefits and costs in our Industrial and Printing Europe operations as the amounts were no longer due to employees, and we reversed certain lease termination costs and estimated legal costs that were no longer required. As of March 31, 2012, we have accrued restructuring costs of $1.2 million for headcount reductions that are anticipated to be paid out by December 31, 2012. We anticipate that these headcount reductions will have annual cash cost savings of approximately $0.3 million going forward. Actual cash cost savings to be realized depend on the timing of payments and many other factors, some of which are beyond our control, and could differ materially from our estimates. We anticipate recognizing the estimated cash cost savings once all the payments have been finalized related to these restructuring initiatives.
During the three months ended March 31, 2011, we recorded $(0.2) million of restructuring expense. We reversed $(0.1) million related to accrued benefits in our Industrial Europe operations as the amounts were no longer due to employees and $(0.1) million related to accrued estimated legal costs that were no longer required.
57
Table of Contents
Interest Expense
Interest expense for the three months ended March 31, 2012 decreased by $0.5 million, or 3.8%, compared to the same period in 2011 due to lower debt balances outstanding during the three months ended March 31, 2012 compared to the same period in 2011.
Miscellaneous (Expense) Income
Miscellaneous expense for the three months ended March 31, 2012 was $4.4 million compared to $16.2 million of miscellaneous expense recorded during the same period in 2011. This difference was due primarily to a remeasurement charge on our Euro denominated debt. For the three months ended March 31, 2012, we recorded a remeasurement loss of $4.4 million on our Euro denominated debt due to the fluctuation of the Euro compared to the U.S. Dollar. The Euro increased in value against the U.S. Dollar by 3.0% from December 31, 2011 to March 31, 2012. For the three months ended March 31, 2011, we recorded a remeasurement loss of $10.1 million on our Euro denominated debt as the Euro increased in value by 6.0% against the U.S. Dollar from December 31, 2010 to March 31, 2011. For the three months ended March 31, 2012, we recorded a remeasurement gain of $0.1 million on our foreign denominated intercompany loans compared to a remeasurement loss of $6.3 million recorded for the same period in 2011. For the three months ended March 31, 2012, we recorded a loss on settlement of foreign currency derivative contracts of less than $0.1 million compared to a gain of $0.3 million for the three months ended March 31, 2011.
Income Tax Expense
For the three months ended March 31, 2012, our effective tax rate was 46.7% versus (24.0%) for the same period in 2011. Earnings before tax and discrete items increased by $4.2 million during the three months ended March 31, 2012 compared to the same period in 2011 whereas tax expense increased $3.2 million for the three months ended March 31, 2012 compared to the same period in 2011. This increase in income tax expense was a result of the earnings mix of our entities within taxing jurisdictions and foreign exchange gains and losses. Foreign exchange gains and losses are treated as discrete items in determining our estimated annual tax rate. Foreign exchange gains and losses are considered discrete items because of the difficulty in estimating their full-year impact on our estimated annual tax rate. Foreign exchange losses decreased by $10.0 million for the three months ended March 31, 2012 compared to the same period in 2011, resulting in an overall loss of $4.5 million for the three months ended March 31, 2012 with a corresponding increase in income tax expense of $1.3 million during the three months ended March 31, 2012 compared to the same period in 2011. Finally, the tax impact of other discrete items decreased $0.5 million for the three months ended March 31, 2012 compared to the same period in 2011. Foreign exchange gain/loss will occur in the future, although it is extremely difficult to estimate the amount of the future impact.
Segment Reporting
The following discussion breaks down our net sales and operating profit by operating segment for the three months ended March 31, 2012 compared to the same period in 2011.
Industrial—Net sales were flat for the three months ended March 31, 2012 as compared to the same period in 2011. Net sales for the three months ended March 31, 2012 were negatively impacted by $1.2 million due to the increase in value of the U.S. Dollar during the three months ended March 31, 2012 compared to the same period in 2011. Our Industrial Americas operations experienced the highest net sales growth among the operations in our Industrial segment for the three months ended March 31, 2012 of $5.3 million, or 13.4%, due to higher offshore product sales of $3.1 million as the result of increased customer demand, $1.6 million of higher sales of our industrial products and $0.8 million of sales attributable to an acquisition of a company in Brazil that was completed in the three months ended March 31, 2012. Our Industrial Europe operations had higher net sales of $0.4 million, or 0.7%, for the three months ended March 31, 2012 compared to the same period in 2011. Our sales for the three months ended March 31, 2012 were adversely impacted by the U.S. Dollar increasing in value
58
Table of Contents
against both the Euro (4.2%) and the British Pound Sterling (1.9%) for the three months ended March 31, 2012 compared to the same period in 2011. The increase in value of the U.S. Dollar for the three months ended March 31, 2012 was offset by increased industrial product sales in Germany and Italy within our Industrial Europe operations, in each case compared to the same period in 2011. Our Industrial Asia operations had lower sales of $5.7 million, or 11.3%, for the three months ended March 31, 2012 compared to the same period in 2011 due to our exit of certain lower margin product markets in 2011.
Operating profit for our Industrial segment for the three months ended March 31, 2012 increased by $1.0 million, or 5.0%, as compared to the same period in 2011. This increase is primarily attributable to higher sales levels for the three months ended March 31, 2012 compared to the same period in 2011. Our Industrial operating profit for was negatively impacted by $0.7 million for the three months ended March 31, 2012 due to the decrease in value of the U.S. Dollar during the three months ended March 31, 2012 compared to the same period in 2011.
| Three months ended March 31, |
2012 to 2011 % Change |
|||||||||||
| (amounts in thousands) | 2012 | 2011 | ||||||||||
| Favorable (Unfavorable) |
||||||||||||
| Industrial |
||||||||||||
| Net sales |
$ | 140,466 | $ | 140,435 | 0.0 | % | ||||||
| Operating profit |
$ | 20,744 | $ | 19,747 | 5.0 | % | ||||||
Printing—Net sales increased by $3.6 million, or 9.6%, for the three months ended March 31, 2012 as compared to the same period in 2011. Net sales for the three months ended March 31, 2011 were negatively impacted by $0.4 million due to the increase in value of the U.S. Dollar during the three months ended March 31, 2012 compared to the same period in 2011. Our Printing Europe operations had higher sales for the three months ended March 31, 2012 of $2.3 million, or 19.2%, compared to the same period in 2011 primarily because of increased customer orders and new product sales, offset by a weaker Euro as compared to the U.S. Dollar. Our Printing Americas operations reported higher net sales levels for the three months ended March 31, 2012 of $1.4 million, or 6.5%, compared to the same period in 2011 due to stronger customer demand for digital printing sheets and the introduction of new products. This increase primarily reflects a gain in market share as a result of customers switching to our LUX® process. Our Printing Asia operations had lower net sales for the three months ended March 31, 2012 of $0.1 million, or 1.4%, compared to the same period in 2011 because of lower sales of non-proprietary products in the three months ended March 31, 2012 compared to the same period in 2011.
Operating profit for our Printing segment for the three months ended March 31, 2012 was $0.7 million, or 12.6%, higher than the same period in 2011. Operating profit increased primarily because of the increase in net sales in our Printing Americas and Europe operations, as discussed above, and the introduction of higher margin products in 2011 in those operations, and was offset by the decrease in net sales in our Printing Asia operations, for the reasons discussed above. Our Printing segment operating profit for the three months ended March 31, 2012 was negatively impacted by $0.2 million due to the increase in value of the U.S. Dollar during the three months ended March 31, 2012 compared to the same period in 2011.
| Three months ended March 31, |
2012 to 2011 % Change |
|||||||||||
| (amounts in thousands) | 2012 | 2011 | ||||||||||
| Favorable (Unfavorable) |
||||||||||||
| Printing |
||||||||||||
| Net sales |
$ | 41,729 | $ | 38,086 | 9.6 | % | ||||||
| Operating profit |
$ | 6,334 | $ | 5,625 | 12.6 | % | ||||||
59
Table of Contents
Year Ended December 31, 2011 Compared to Year Ended December 31, 2010
Net Sales
Our net sales of $728.8 million for the year ended December 31, 2011 increased by $34.4 million, or 5.0%, compared to the same period in 2010. Our net sales for the year ended December 31, 2011 were positively impacted by $25.4 million due to the decrease in value of the U.S. Dollar during the year ended December 31, 2011 compared to the same period in 2010. We believe that net sales of products that we have identified as new products, which represent opportunities to enter markets adjacent to those we currently serve, was $56.0 million for the year ended December 31, 2011, compared to $35.6 million for the same period in 2010. Our Industrial segment had higher net sales for the year ended December 31, 2011 of $32.6 million, or 6.1%, compared to the same period in 2010, primarily attributable to an increase of $20.3 million in our Industrial Solutions business and an increase of $5.3 million in our Electronic Solutions business. The 6.3% increase in net sales in our Industrial Solutions business was due primarily to increased product sales in Europe as a result of the impact on our customers of increased demand in the automotive industry, and the 3.4% increase in net sales in our Electronic Solutions business was primarily due to increased customer demand for electronic products. Our Printing segment had higher net sales for the year ended December 31, 2011 of $1.8 million, or 1.1%, compared to the same period in 2010.
Our Industrial Europe operations had the largest increase in net sales among the operations in our Industrial segment for the year ended December 31, 2011, of $23.1 million, or 12.8%, due to an increase in our industrial product sales and both a stronger British Pound Sterling and Euro as compared to the U.S. Dollar for the majority of the year ended December 31, 2011 compared to the same period in 2010. Approximately 59% of the increase in net sales was attributable to the increase in industrial product sales, and the remaining approximately 41% of the increase in net sales was due to the stronger British Pound Sterling and Euro. Within our Industrial Europe operations, the increase in industrial product sales resulted primarily from increased volume within our existing customer base in the United Kingdom, Germany, Benelux and Central Europe, primarily due to the impact on our customers of increased demand in the automotive industry. In Italy, France and the United Kingdom, we gained new market share with respect to various products within our Industrial Solutions business. Net sales also increased in our Industrial Americas operations for the year ended December 31, 2011, compared to the same period in 2010, because of increased customer demand for industrial and electronic products. This increased demand resulted primarily from increased production in the automobile industry. While net sales in our Industrial Americas operations reflected increased sales to existing customers, we also gained market share in our Industrial Americas operations as a result of new customers in Brazil.
Our Printing Asia operations had lower net sales for the year ended December 31, 2011, of $3.7 million, or 17.7%, compared to the same period in 2010, due to the expiration of a consignment distribution sales agreement of Offset products in 2010, pursuant to which we had agreed to provide transition services to the buyer of Offset, and decreased sales of lower margin analog plates relative to higher margin digital plates in Asia. Our Printing Americas operations reported higher net sales levels for the year ended December 31, 2011 of $1.7 million, or 2.0%, compared to the same period in 2010 due to stronger customer demand for digital printing sheets and the introduction of new products. This increase primarily reflects a gain in market share as a result of customers switching to our LUX® process. Our Printing Europe operations had higher net sales for the year ended December 31, 2011 of $3.8 million, or 7.3%, compared to the same period in 2010 primarily because of increased customer orders, new product sales and a stronger Euro as compared to the U.S. Dollar for the majority of the year ended December 31, 2011 compared to the same period in 2010.
Changes in our product mix and the average selling prices of our products did not have a material impact on our net sales for the year ended December 31, 2011 compared to the same period in 2010.
60
Table of Contents
Gross Profit
For the year ended December 31, 2011, our gross profit increased $17.4 million, or 5.4%, compared to the same period in 2010. Our gross profit for the year ended December 31, 2011 was positively impacted by $11.5 million due to the decrease in value of the U.S. Dollar during the year ended December 31, 2011 compared to the same period in 2010. The remainder of the increase was attributable to higher net sales, offset by increased raw material costs. As a percentage of net sales, gross profit for the year ended December 31, 2011 was 46.7%, as compared to 46.5% for the same period in 2010. The increase in gross profit percentage was primarily due to slightly higher product sales prices offset by higher raw material costs for the year ended December 31, 2011 as compared to the same period in 2010. Changes in our product mix and the average selling prices of our products did not have a material impact on our gross profit for the year ended December 31, 2011 compared to the same period in 2010.
Selling, Technical and Administrative Expenses
Our selling, technical and administrative expenses increased $5.9 million, or 3.3%, for the year ended December 31, 2011 compared to the same period in 2010. This increase was primarily the result of higher selling expenses associated with our higher sales for the year ended December 31, 2011 as compared to the same period in 2010 and an increase in salary expenses for the year ended December 31, 2011 as compared to the same period in 2010, offset by lower corporate bonus expense of $2.9 million recorded for the year ended December 31, 2011 compared to the same period in 2010. As a percentage of our net sales, our selling, technical and administrative expenses were 25.5% for the year ended December 31, 2011, compared to 25.9% for the same period in 2010. This decrease is primarily due to the increase in net sales for the year ended December 31, 2011 compared to the same period in 2010.
Research and Development Expenses
Our research and development expenses for the year ended December 31, 2011 increased $2.0 million, or 9.3%, from the same period in 2010. This increase was primarily due to additional investments made to support certain strategic projects during the year ended December 31, 2011, as compared to the same period in 2010. As a percentage of our net sales, our research and development expenses were 3.2% for the year ended December 31, 2011, as compared to 3.0% for the same period in 2010. The increase is due to higher salary expense for the year ended December 31, 2011, as compared to the same period in 2010.
Amortization Expenses for Finite-Lived Purchased Intangible Assets
Amortization expenses for finite-lived purchased intangible assets related to developed technology and customer lists for the year ended December 31, 2011 decreased by $1.1 million, or 3.8%, compared to the same period in 2010. This decrease is due to the $46.1 million impairment charge related to a portion of our customer list intangible assets in our Industrial Asia reporting unit recorded in 2011 and a portion of our customer list intangible assets being fully amortized in 2011.
Operational Restructuring Expenses
During the year ended December 31, 2011, we recorded $0.9 million of operational restructuring expenses. We recorded $0.9 million related to the elimination of four positions in our Industrial Europe operations and $0.2 million related to the elimination of seven positions in our Industrial Asia operations. We also reversed $(0.2) million of operational restructuring charges related to accrued benefits in our Industrial Europe operations as the amounts were no longer due to employees and for estimated legal costs that were no longer required. As of December 31, 2011, we have accrued operational restructuring costs of $1.2 million that are anticipated to be paid out by December 31, 2012. We anticipate that these headcount reductions will have annual cash cost savings of approximately $0.5 million going forward. Actual cash cost savings to be realized depend on the timing of
61
Table of Contents
payments and many other factors, some of which are beyond our control, and could differ materially from our estimates. We anticipate recognizing the estimated cash cost savings once all the payments have been finalized related to these restructuring initiatives in our results of operations and cash flows.
During the year ended December 31, 2010, we recorded $6.2 million of operational restructuring expenses. We recorded $3.3 million related to the elimination of 39 positions in our Industrial segment operations. We also recorded operational restructuring expenses of $0.4 million related to lease termination cost, and long term asset write down expense of $2.4 million, equipment disposal expense of $0.2 million and other miscellaneous costs of $0.1 million in our Industrial segment operations. We also reversed $(0.2) million of operational restructuring charges related to accrued benefits in our Industrial segment operations as the amounts were no longer due to employees. We believe we have recognized $5.0 million, the full amount of the anticipated annual cost savings related to our 2010 headcount reductions, in our results of operations for the year ended December 31, 2011. We have recognized the cash cost savings from these restructuring initiatives subsequent to December 31, 2010 in our results of operations and cash flows, and we anticipate that we will continue to recognize approximately $5.0 million of annual cash cost savings going forward.
Impairment Charges
During the year ended December 31, 2011, we recorded $46.4 million of impairment charges related to a write down of the customer list intangible assets in our Industrial Asia reporting unit. The main factors causing the impairment charges of $46.4 million were the reluctance of our customers to accept price increases on such products, our reluctance to continue selling such products, which require technical support, at low margin levels and increased pricing pressure from competitors.
During the year ended December 31, 2010, there were no impairment charges recorded.
Interest Expense
Interest expense for the year ended December 31, 2011 decreased by $1.6 million, or 2.9%, compared to the same period in 2010 due to lower debt balances outstanding during the year ended December 31, 2011 compared to the same period in 2010.
Miscellaneous Income
Miscellaneous income for the year ended December 31, 2011 was $9.4 million compared to the $15.1 million of miscellaneous income recorded during the same period in 2010. This difference was due primarily to a remeasurement charge on our Euro denominated debt. For the year ended December 31, 2011, we recorded a remeasurement gain of $4.1 million on our Euro denominated debt, due to the fluctuation of the Euro compared to the U.S. Dollar. Although the change in the value of the Euro to the U.S. Dollar from December 31, 2010 to December 31, 2011 was a decrease of 3.1%, the Euro was stronger against the U.S. Dollar for the first half of 2011. Specifically, the Euro appreciated in value by 8.5% against the U.S. Dollar during the period from December 31, 2010 to June 30, 2011 and declined in value by 10.6% against the U.S. Dollar during the period from June 30, 2011 to December 31, 2011. For the year ended December 31, 2010, we recorded a remeasurement gain of $11.0 million on our Euro denominated debt as the Euro decreased in value by 6.6% against the U.S. Dollar from December 31, 2009 to December 31, 2010. For the year ended December 31, 2011, we recorded a remeasurement gain of $5.1 million on our foreign denominated intercompany loans compared to a remeasurement gain of $6.4 million recorded for the same period in 2010. For the year ended December 31, 2011, we recorded a gain on settled foreign currency hedges of $0.6 million compared to a loss of $1.3 million for the same period in 2010. For the year ended December 31, 2011, we recorded $0.2 million of foreign exchange losses compared to $1.0 million of foreign exchange losses for the same period in 2010.
62
Table of Contents
Income Tax Expense
For the year ended December 31, 2011, our effective tax rate was 88.0%. We are a U.S. based company with a statutory income tax rate of 35%. However, we operate in 23 foreign countries, which have tax rates that are different from the U.S. statutory tax rate. Our 2011 annual effective tax rate differed from the U.S. statutory rate of 35% in 2011 due to: (1) the imposition of taxes in different tax jurisdictions combined with the earnings mix in these taxing jurisdictions, (2) the impact of tax rate changes in certain taxing jurisdictions during 2011 which resulted in a change to accumulated deferred tax balances and a tax benefit to the 2011 tax rate, (3) the recognition of taxes on certain foreign earnings because management anticipates that such earnings will be repatriated in the future and (4) the effect of valuation allowances. The foreign tax rate differential is a benefit of $1.5 million. This item is a result of different tax rates applied to foreign pre-tax income as well as the impact of repatriating income from overseas locations, net of allowed foreign tax credits. There were several tax rate changes instituted in 2011 which resulted in a tax benefit of $0.9 million. We also recognized a deferred tax charge of $1.2 million for foreign earnings that may be repatriated in the future. For the year ended December 31, 2011, we had a charge of $6.7 million for increases to our valuation allowances. Each one of these factors impacting our 2011 effective tax rate will likely also impact the tax rate in the future, although it is extremely difficult to estimate the amount of their future impact.
In 2010, our effective tax rate was 47.2%. Our annual effective tax rate differed from the U.S. statutory rate of 35% in 2010 due to: (1) the imposition of taxes in different tax jurisdictions combined with the earnings mix in these taxing jurisdictions, (2) the recognition of taxes on certain foreign earnings because management anticipates that such earnings will be repatriated in the future, (3) the effect of uncertain tax positions and (4) the effect of valuation allowances. The foreign tax rate differential is a benefit of $0.7 million. This item is a result of different tax rates applied to foreign pre-tax income as well as the impact of repatriating income from overseas locations, net of allowed foreign tax credits. Our 2010 income tax expense also includes a reserve of approximately $5.6 million for uncertain tax benefits which significantly increased the 2010 effective tax rate. We also recognized a deferred tax charge of $0.9 million for foreign earnings that may be repatriated in the future. For the year ended December 31, 2010, we had a charge of $1.7 million for increases to our valuation allowances. Each one of these factors impacting our 2010 effective tax rate will likely also impact the tax rate in the future, although it is extremely difficult to estimate the amount of their future impact.
Segment Reporting
The following discussion breaks down our net sales and operating profit by operating segment for the year ended December 31, 2011 compared to the same period in 2010.
Industrial—Net sales increased by $32.6 million, or 6.1%, for the year ended December 31, 2011 as compared to the same period in 2010. Net sales for the year ended December 31, 2011 were positively impacted by $21.5 million due to the decrease in value of the U.S. Dollar during the year ended December 31, 2011 compared to the same period in 2010. Our Industrial Europe operations experienced the highest net sales growth among the operations in our Industrial segment for the year ended December 31, 2011 of $23.1 million, or 12.8%, due to an increase in our industrial product sales and both a stronger British Pound Sterling and Euro against the U.S. Dollar for the majority of the year ended December 31, 2011 compared to the same period in 2010. Approximately 59% of the increase in net sales was attributable to the increase in industrial product sales, and the remaining approximately 41% of the increase was due to the stronger British Pound Sterling and Euro. Within our Industrial Europe operations, the increase in industrial product sales resulted primarily from increased volume within our existing customer base in the United Kingdom, Germany, Benelux and Central Europe, primarily due to the impact on our customers of increased demand in the automotive industry. In Italy, France and the United Kingdom, we gained new market share with respect to various products within our Industrial Solutions business. Net sales also increased in our Industrial Americas operations for the year ended December 31, 2011, compared to the same period in 2010, because of increased customer demand for industrial and electronic products. This increased demand resulted primarily from increased production in the automobile
63
Table of Contents
industry. While net sales in our Industrial Americas operations reflected increased sales to existing customers, we also gained market share in our Industrial Americas operations as a result of new customers in Brazil.
Operating profit for our Industrial segment for the year ended December 31, 2011 decreased by $34.7 million, or 53.4%, as compared to the same period in 2010. This decrease is primarily attributable to the $46.4 million of impairment charges related to a write down of the customer list intangible assets in our Industrial Asia reporting unit recorded during the year ended December 31, 2011 and also reflects increased raw material costs. Offsetting these impairment charges are an increase in net sales in our Industrial Americas and Europe operations for the reasons discussed above and lower operating costs as a result of previous restructuring programs. Our Industrial operating profit was positively impacted by $3.4 million for the year ended December 31, 2011 due to the decrease in value of the U.S. Dollar during the year ended December 31, 2011 compared to the same period in 2010.
| Year ended December 31, |
2011 to 2010 % Change |
|||||||||||
| (amounts in thousands) |
2011 | 2010 | ||||||||||
| Favorable |
||||||||||||
| Industrial |
||||||||||||
| Net sales |
$ | 568,578 | $ | 535,945 | 6.1 | % | ||||||
| Operating profit |
$ | 30,331 | $ | 65,053 | -53.4 | % | ||||||
Printing—Net sales increased by $1.8 million, or 1.1%, for the year ended December 31, 2011 as compared to the same period in 2010. Net sales for the year ended December 31, 2011 were positively impacted by $3.9 million due to the decrease in value of the U.S. Dollar during the year ended December 31, 2011 compared to the same period in 2010. Our Printing Europe operations had higher sales for the year ended December 31, 2011 of $3.8 million, or 7.3%, compared to the same period in 2010 primarily because of increased customer orders, new product sales and a stronger Euro as compared to the U.S. Dollar for the majority of the year ended December 31, 2011 compared to the same period in 2010. Our Printing Americas operations reported higher net sales levels for the year ended December 31, 2011 of $1.7 million, or 2.0%, compared to the same period in 2010 due to stronger customer demand for digital printing sheets and the introduction of new products. This increase primarily reflects a gain in market share as a result of customers switching to our LUX® process. Our Printing Asia operations had lower net sales for the year ended December 31, 2011 of $3.7 million, or 17.7%, compared to the same period in 2010 because of the expiration of a consignment distribution sales agreement of Offset products in 2010, pursuant to which we had agreed to provide transition services to the buyer of Offset, and decreased sales of lower margin analog plates relative to higher margin digital plates in Asia.
Operating profit for our Printing segment for the year ended December 31, 2011 was $4.3 million, or 20.1%, higher than the same period in 2010. Our Printing segment operating profit for the year ended December 31, 2011 was positively impacted by $1.0 million due to the decrease in value of the U.S. Dollar during the year ended December 31, 2011 compared to the same period in 2010. Operating profit increased primarily because of the increase in net sales in our Printing Americas and Europe operations, as discussed above, and the introduction of higher margin products in 2011 in those operations and was offset by the decrease in net sales in our Printing Asia operations, for the reasons discussed above.
| Year ended December 31, |
2011 to 2010 % Change |
|||||||||||
| (amounts in thousands) | 2011 | 2010 | ||||||||||
| Favorable (Unfavorable) |
||||||||||||
| Printing |
||||||||||||
| Net sales |
$ | 160,195 | $ | 158,388 | 1.1 | % | ||||||
| Operating profit |
$ | 25,617 | $ | 21,338 | 20.1 | % | ||||||
64
Table of Contents
Year Ended December 31, 2010 Compared to Year Ended December 31, 2009
Net Sales
Our net sales of $694.3 million for the year ended December 31, 2010 increased by $100.2 million, or 16.9%, compared to the same period in 2009. Our net sales for the year ended December 31, 2010, were positively impacted by $3.4 million due to the decrease in value of the U.S. Dollar during the year ended December 31, 2010 compared to the same period in 2009. We believe that net sales of products that we have identified as new products, which represent opportunities to enter markets adjacent to those we currently serve, was $35.6 million for the year ended December 31, 2010, compared to $12.2 million for the same period in 2009.
Our Industrial segment had higher net sales for the year ended December 31, 2010 of $86.9 million, or 19.3%, compared to the same period in 2009, primarily attributable to an increase of $58.5 million in our Industrial Solutions business and an increase of $20.3 million in our Electronic Solutions business. The 22.3% increase in net sales in our Industrial Solutions business was due primarily to improved economic conditions, resulting in increased demand for our products used in the automotive sector, and the 15.2% increase in net sales in our Electronic Solutions business was primarily due to increased customer demand for our products used in the consumer and industrial electronic sectors. Our Printing segment had higher net sales for the year ended December 31, 2010 of $13.3 million, or 9.2%. Our 2010 net sales were positively impacted as economic conditions improved during the year, and we experienced higher demand for our industrial products used in the automotive sector and our electronic products used in consumer and industrial electronic products. Our Industrial Asia operations experienced the highest net sales growth among the operations in our Industrial segment for the year ended December 31, 2010 of $39.6 million, or 24.3%, due to an increase in both electronic and industrial product sales and a weaker U.S. Dollar against Asian currencies. Approximately 89% of the growth in net sales was attributable to the increase in product sales, with the remaining 11% due to the weaker U.S. Dollar. Net sales also increased in our Industrial Americas and Europe operations for the year ended December 31, 2010 compared to the same period in 2009 because of increased customer demand for industrial and electronic products. Increased customer demand for these products resulted primarily from improvements in the global economy and the resulting impact on demand for our customers’ end products. Our Printing Americas operations had higher net sales for the year ended December 31, 2010 of $9.8 million, or 13.1%, compared to the same period in 2009, due to higher demand for our digital printing sheets utilized in commercial printing. Our Printing Asia and Europe operations also had higher net sales levels for the year ended December 31, 2010 compared to 2009 due to stronger customer demand for digital printing sheets. Increased customer demand for digital printing sheets corresponded to our conversion from an analog to a digital model in connection with our LUX® process in the third quarter of 2010.
Changes in our product mix and the average selling prices of our products did not have a material impact on our net sales for the year ended December 31, 2010 compared to the same period in 2009.
Gross Profit
For the year ended December 31, 2010, our gross profit increased $62.9 million, or 24.2%, compared to the same period in 2009. Our gross profit for the year ended December 31, 2010 was positively impacted by $1.9 million due to the decrease in value of the U.S. Dollar during the year ended December 31, 2010 compared to the same period in 2009. As a percentage of net sales, gross profit for the year ended December 31, 2010 was 46.5% compared to 43.8% in 2009. The overall increase was attributable to higher net sales, which was offset by increased raw material costs. The increase in gross profit as a percentage of sales from 2009 to 2010 was also positively impacted by the operational restructuring programs discussed above, which significantly decreased our manufacturing costs in 2009 and were effective for a full year in 2010. As discussed above, we have experienced higher raw material costs used in the manufacturing process in certain products, which adversely impacted our gross profit percentage. Changes in our product mix and the average selling prices of our products did not have a material impact on our gross profit for the year ended December 31, 2010 compared to the same period in 2009.
65
Table of Contents
Selling, Technical and Administrative Expenses
Our selling, technical and administrative expenses increased $23.3 million, or 14.9%, for the year ended December 31, 2010, compared to the same period in 2009. This increase was primarily the result of higher selling expenses associated with our higher 2010 sales compared to 2009 and increased bonus expense of $8.1 million recorded in 2010 compared to 2009. As a percentage of our net sales, our selling, technical and administrative expenses were 25.9% for the year ended December 31, 2010, which was lower than the 2009 percentage of 26.3%. The decrease of 0.4% was primarily attributable to the higher net sales in 2010 compared to 2009.
Research and Development Expenses
Our research and development expenses increased $0.9 million, or 4.5%, for the year ended December 31, 2010, compared to the same period in 2009. This increase was primarily due to an increase in salary expenses in the third quarter of 2010 that resulted from the termination of the salary reduction measures that we implemented in 2008 and a slight increase in the headcount of personnel from 2009 to 2010. As a percentage of our net sales, our research and development expenses were 3.0% for the year ended December 31, 2010, which was lower than the 2009 percentage of 3.4%. The decrease of 0.4% was primarily attributable to the higher net sales in 2010 compared to 2009.
Amortization Expenses for Finite-Lived Purchased Intangible Assets
Amortization expenses for finite-lived purchased intangible assets related to developed technology and customer lists for the year ended December 31, 2010 decreased by $0.2 million, or 0.6%, compared to the same period in 2009. This decrease is associated with a portion of our customer lists being fully amortized during 2010.
Operational Restructuring Expenses
During the year ended December 31, 2010, we recorded $6.2 million of operational restructuring expenses. We recorded $3.3 million related to the elimination of 39 positions in our Industrial segment operations. We also recorded operational restructuring expenses of $0.4 million related to lease termination cost, and long term asset write down expense of $2.4 million, equipment disposal expense of $0.2 million and other miscellaneous costs of $0.1 million in our Industrial segment operations. We also reversed $(0.2) million of operational restructuring charges related to accrued benefits in our Industrial segment operations as the amounts were no longer due to employees. We have recognized the cash cost savings from these restructuring initiatives subsequent to December 31, 2010 in our results of operations and cash flows, and we anticipate that we will continue to recognize approximately $5.0 million of annual cash cost savings going forward.
During the year ended December 31, 2009, we recorded $3.0 million of operational restructuring expense in our Industrial segment operations related to the elimination of 134 positions and $0.6 million in our Printing segment operations related to the elimination of 41 positions. During this same period, we recorded a $0.1 million charge to operational restructuring related to other miscellaneous costs associated with the operational restructuring program in our Industrial segment operations and $0.8 million of facility costs in our Industrial segment operations related to moving a manufacturing facility in the United Kingdom. During the year ended December 31, 2009, we reversed operational restructuring expenses of $0.3 million for 2008 operational restructuring programs in our Printing segment operations. We believe we have recognized $5.3 million, the full amount of the anticipated annual cost savings related to our 2009 headcount reductions, in our results of operations for the year ended December 31, 2010. We have recognized the cash cost savings from these restructuring initiatives subsequent to December 31, 2009 in our results of operations and cash flows, and we anticipate that we will continue to recognize approximately $5.3 million of annual cash cost savings going forward.
66
Table of Contents
Impairment Charges
We did not record any impairment charges during the year ended December 31, 2010 compared to impairment charges of $68.7 million recorded during the year ended December 31, 2009. The impairment charges recorded during the year ended December 31, 2009, were primarily related to goodwill and intangible assets established in connection with the Acquisition. During the year ended December 31, 2009, we recorded an impairment charge of $41.2 million related to our goodwill balance. The main factor causing the impairment charge of $41.2 million was lower sales and profits generated by our Industrial segment due to the worldwide economic recession in both 2008 and 2009. This impairment charge was recorded in our Industrial segment to write down the goodwill balances in those operations to their estimated fair values in connection with our annual impairment testing of goodwill and intangible assets. Our estimated sales and profits utilized in our 2009 goodwill impairment testing, which are based on actual results for the twelve month period preceding the goodwill impairment testing date of April 1, 2009, were lower than the estimated sales and profits utilized in our 2008 impairment testing because our sales as of April 1, 2008, the date of our 2008 goodwill impairment testing, did not suggest that an economic recession was forthcoming. The worldwide economic recession, which impacted our business in the twelve month period following our April 1, 2008 goodwill impairment testing, significantly impacted the estimated sales and profits utilized in our April 1, 2009 goodwill impairment testing. We also recorded an impairment charge during the year ended December 31, 2009 of $26.1 million related to a corporate tradename to record the tradename intangible asset at its estimated fair value. The primary driver of the impairment charge recorded in 2009 related to our indefinite-lived purchased intangible assets was lower net sales levels because of the global economic recession and therefore lower profitability. The global economic recession resulted in weakening conditions in the industrial and electronic end markets the company served, which resulted in lower profitability on a consolidated basis resulting in the $26.1 million impairment charge recorded in 2009. The corporate tradename is not allocated to either of our reportable segments and is presented in the corporate assets in our total assets table in our segment reporting footnote to our consolidated financial statements. We also recorded a $0.2 million impairment charge during the year ended December 31, 2009 for a customer list intangible asset in our Industrial segment related to a strategic business decision to exit a certain market. Finally, we recorded an impairment charge of $1.2 million during the year ended December 31, 2009 in our Printing segment to write down the value of certain equipment to its estimated fair value.
Interest Expense
Interest expense for the year ended December 31, 2010 decreased by $4.5 million, or 7.5%, compared to the same period in 2009 due to lower debt balances outstanding during 2010 compared to 2009, and lower interest rates in 2010 compared to 2009 on our floating rate debt.
Miscellaneous (Expense) Income
Miscellaneous income for the year ended December 31, 2010 was $15.1 million compared to $5.0 million of miscellaneous expense recorded during the same period in 2009. This difference was due primarily to the remeasurement charge on our Euro denominated debt. For the year ended December 31, 2010, we recorded a remeasurement gain of $11.0 million on our Euro denominated debt, due to the 7.3% decrease in the value of the Euro compared to the U.S. Dollar from December 31, 2009 to December 31, 2010. For the year ended December 31, 2009, we recorded a remeasurement loss of $4.2 million on our Euro denominated debt, due to the 2.5% increase in the value of the Euro compared to the U.S. Dollar from December 31, 2008 to December 31, 2009. For the year ended December 31, 2010, we recorded a remeasurement gain of $6.4 million on our foreign denominated intercompany loans compared to a remeasurement loss of $0.9 million recorded for the same period in 2010. For the year ended December 31, 2010, we recorded a loss of $1.3 million on settled foreign currency hedges compared to a gain of $1.4 million for the same period in 2009. For the year ended December 31, 2010, we recorded $1.0 million of foreign exchange losses compared to $1.9 million of foreign exchange losses for the same period in 2009.
67
Table of Contents
Income Tax Expense
For the year ended December 31, 2010, our effective tax rate was 47.2%. We are a U.S. based company with a statutory income tax rate of 35%. However, we operate in 23 foreign countries, which have tax rates that are different from the U.S. statutory tax rate. Our 2010 annual effective tax rate differed from the U.S. statutory rate of 35% in 2010 due to: (1) the imposition of taxes in different tax jurisdictions combined with the earnings mix in these taxing jurisdictions, (2) the recognition of taxes on certain foreign earnings because management anticipates that such earnings will be repatriated in the future, (3) the effect of uncertain tax positions and (4) the effect of valuation allowances. The foreign tax rate differential is a benefit of $0.7 million. This item is a result of different tax rates applied to foreign pre-tax income as well as the impact of repatriating income from overseas locations, net of allowed foreign tax credits. Our 2010 income tax expense also includes a reserve of approximately $5.6 million for uncertain tax benefits which significantly increased the 2010 effective tax rate. We also recognized a deferred tax charge of $0.9 million for foreign earnings that may be repatriated in the future. For the year ended December 31, 2010 we had a charge of $1.7 million for increases to our valuation allowances. Each one of these factors impacting our 2010 effective tax rate will likely also impact the tax rate in the future, although it is extremely difficult to estimate the amount of their future impact.
In 2009, our effective tax rate was a benefit of 7.6%. Our annual effective tax rate differed from the U.S. statutory tax rate of 35% in 2009 due to (1) the imposition of taxes at different tax jurisdictions combined with the earnings mix in these taxing jurisdictions, (2) the impact of tax rate changes in certain taxing jurisdictions during 2009 which resulted in a change to accumulated deferred tax balances and a tax benefit to the 2009 tax rate, (3) the impact of reconciliations from prior years tax returns which resulted in a benefit to the 2009 tax rate, (4) the effect of goodwill impairment charges, (5) the effect of valuation allowances and (6) the effect of uncertain tax positions. The foreign tax rate differential is an expense of $9.6 million. This item is a result of different tax rates applied to foreign pre-tax income as well as the impact of repatriating income from overseas locations, net of allowed foreign tax credits. There were several tax rate changes instituted in 2009 which resulted in a tax benefit of $2.3 million as well as a return to provision reconciliation which produced a $2.6 million tax benefit. In 2009, we incurred significant charges for goodwill and intangible assets impairments which were not tax deductible and resulted in a reduction of the tax benefit by approximately $11.1 million. We also incurred a benefit of $8.4 million for the reversal of valuation allowances. Finally, during the year ended December 31, 2009, we also incurred a tax charge of approximately $12.6 million for uncertain tax positions. We cannot predict the likelihood of further changes to the statutory tax rates, return to provision reconciliation benefit and further impairment charges. All the other items impacting our 2009 tax rate will also occur in the future, although it is extremely difficult to estimate the amount of their future impact.
Segment Reporting
The following discussion breaks down our net sales and operating profit by operating segments for the year ended December 31, 2010 compared to the same period in 2009.
Industrial—Net sales increased by $86.9 million, or 19.3%, for the year ended December 31, 2010 as compared to the same period in 2009. Net sales for the year ended December 31, 2010, were positively impacted by $3.0 million due to the decrease in value of the U.S. Dollar during the year ended December 31, 2010 compared to the same period in 2009. Our 2010 Industrial net sales were also positively impacted as economic conditions improved during the year, and we experienced higher demand for our industrial products used in the automotive sector and our electronic products used in the consumer and industrial electronic sectors. Our Industrial Asia operations experienced the largest net sales increase among the operations in our Industrial segment for 2010 of $39.6 million, or 24.3%, due to an increase in both electronic and industrial product sales and a weaker U.S. Dollar against Asian currencies. Approximately 89% of the growth in net sales was attributable to the increase in product sales, with the remaining 11% due to the weaker U.S. Dollar. Net sales also increased in our Industrial Americas and Europe operations for 2010 compared to 2009, because of increased customer demand for industrial and electronic products. Increased customer demand for these products resulted primarily from improvements in the global economy and the resulting impacts on demand for our customers’ end products.
68
Table of Contents
Operating profit for the year ended December 31, 2010 for the Industrial segment increased by $98.0 million, or 297.5%, as compared to the same period in 2009. The increase in operating profit was due to the increase in net sales in all of our Industrial operations for the reasons discussed above as well as the $67.5 million of impairment charges for goodwill, customer lists and tradenames recorded during the year ended December 31, 2009. Our Industrial operating profit for the year ended December 31, 2010 compared to the same period in 2009 was positively impacted by $0.1 million due to the decrease in value of the U.S. Dollar during the year ended December 31, 2010 compared to the same period in 2009. Depreciation and amortization in our Industrial segment decreased by $1.1 million, or 2.7%, for the year ended December 31, 2010 compared to the same period in 2009. The decrease was primarily attributable to a lower base of depreciable assets in our Industrial Europe operations due to equipment write-downs recorded in 2010.
| Year ended December 31, |
2009 to 2010 % Change |
|||||||||||
| (amounts in thousands) | 2010 | 2009 | ||||||||||
| Favorable (Unfavorable) |
||||||||||||
| Industrial |
||||||||||||
| Net sales |
$ | 535,945 | $ | 449,059 | 19.3 | % | ||||||
| Operating profit (loss) |
$ | 65,053 | $ | (32,930 | ) | 297.5 | % | |||||
Printing—Net sales increased by $13.3 million, or 9.2%, for the year ended December 31, 2010 as compared to the same period in 2009. Net sales for the year ended December 31, 2010, were positively impacted by $0.3 million due to the decrease in value of the U.S. Dollar during the year ended December 31, 2010 compared to the same period in 2009. Our Printing Americas operations had higher net sales for 2010 of $9.8 million, or 13.1%, compared to 2009, due to higher demand for our digital printing sheets utilized in commercial printing. Our Printing Asia and Europe operations also reported higher sales levels for 2010 compared to 2009 due to stronger customer demand for digital printing sheets. These increases in net sales relating to customer demand for digital printing sheets resulted primarily from our conversion from an analog to a digital model in connection with our LUX® process in the third quarter of 2010.
Operating profit for the year ended December 31, 2010 increased by $7.6 million, or 55.5%, compared to 2009. The increase in operating profit was due to the increase in net sales in all of our Printing operations for the reasons discussed above as well as lower operating costs as a result of previous restructuring programs and a $1.2 million equipment impairment charge recorded in 2009 not present in 2010. Our Printing segment operating profit for the year ended December 31, 2010 compared to the same period in 2009 was not materially impacted by the decrease in value of the U.S. Dollar during the ended December 31, 2010 compared to the same period in 2009.
| Year ended December 31, |
2009 to 2010 % Change |
|||||||||||
| (amounts in thousands) | 2010 | 2009 | ||||||||||
| Favorable (Unfavorable) |
||||||||||||
| Printing |
||||||||||||
| Net sales |
$ | 158,388 | $ | 145,094 | 9.2 | % | ||||||
| Operating profit |
$ | 21,338 | $ | 13,721 | 55.5 | % | ||||||
Operational Restructuring
We have executed a series of operational restructuring initiatives since the Acquisition to streamline our cost structure and consolidate our global manufacturing activities. These actions have reduced our workforce in our manufacturing, research and development and sales, technical and administrative functions.
At each reporting date, we evaluate our accruals for operational restructuring activities, which consist primarily of termination benefits (principally severance payments), to ensure that our accruals are still appropriate. In certain circumstances, accruals are no longer required because of efficiencies in carrying out our initiative or because employees previously identified for separation resigned unexpectedly and did not receive
69
Table of Contents
severance or were redeployed due to circumstances not foreseen when the original plans were initiated. We reverse accruals to operational restructuring expense when it is determined they are no longer required.
The following table displays the activity from December 31, 2011 to March 31, 2012 of our costs related to our operational restructuring initiatives:
| Three months ended March
31, 2012 |
As of March 31, 2012 | |||||||||||||||||||||||
| Balance, December 31, 2011 |
Charges to Expense |
Cash Payments |
Non-Cash adjustments |
Total costs and adjustments |
Total expected costs & adjustments |
|||||||||||||||||||
| (amounts in thousands) (unaudited) |
||||||||||||||||||||||||
| Printing Segment |
||||||||||||||||||||||||
| Severance and other benefits |
$ | 12 | $ | (12 | ) | $ | — | $ | — | $ | (12 | ) | $ | — | ||||||||||
| Site clean-up costs |
8 | (8 | ) | — | — | (8 | ) | — | ||||||||||||||||
|
|
|
|
|
|
|
|
|
|
|
|
|
|||||||||||||
| Subtotal Printing Segment |
20 | (20 | ) | — | — | (20 | ) | — | ||||||||||||||||
|
|
|
|
|
|
|
|
|
|
|
|
|
|||||||||||||
| Industrial Segment |
||||||||||||||||||||||||
| Severance and other benefits |
1,012 | 179 | (190 | ) | 29 | 18 | 1,030 | |||||||||||||||||
| Other |
215 | (45 | ) | (10 | ) | 5 | (50 | ) | 165 | |||||||||||||||
|
|
|
|
|
|
|
|
|
|
|
|
|
|||||||||||||
| Subtotal Industrial Segment |
1,227 | 134 | (200 | ) | 34 | (32 | ) | 1,195 | ||||||||||||||||
|
|
|
|
|
|
|
|
|
|
|
|
|
|||||||||||||
| Total |
$ | 1,247 | $ | 114 | $ | (200 | ) | $ | 34 | $ | (52 | ) | $ | 1,195 | ||||||||||
|
|
|
|
|
|
|
|
|
|
|
|
|
|||||||||||||
The $0.2 million of cash payments set forth above reflects cash payments made to employees separated as part of our operational restructuring programs from 2011. As of March 31, 2012, we had accrued operational restructuring costs of $1.2 million that are anticipated to be paid out within the succeeding nine months.
Liquidity and Capital Resources
Our primary source of liquidity is cash generated from operations. Our primary uses of cash are raw material purchases, salary expense, capital expenditures and debt service obligations. We believe that our cash and cash equivalent balance and cash generated from operations will be sufficient to meet our working capital needs, capital expenditures and other business requirements for at least the next twelve months. From time to time there are various legal proceedings pending against us; however, we believe that the resolution of these claims, to the extent not covered by insurance, will not, individually or in the aggregate, have a material adverse effect on our liquidity. At March 31, 2012, we had $109.3 million in cash and cash equivalents.
Although we have not historically done so, if appropriate, we may borrow cash under our Revolving Credit Facility. At March 31, 2012, we had approximately $46.1 million of availability under our Revolving Credit Facility. While we believe we have sufficient liquidity and capital resources to meet our current operating requirements, if our cash flows from operations are less than we expect or if we require funds to pursue additional expansion activities that we may elect to pursue, we may need to incur additional debt, issue additional equity securities or sell or monetize existing assets. We cannot, however, assure you that future funding will be available on terms favorable to us or at all. The restrictions in our existing debt instruments may also limit our ability to incur additional debt or sell assets; however, we are currently able to borrow up to the entire amount of our availability under our Revolving Credit Facility despite these restrictions.
Of the $109.3 million of cash and cash equivalents at March 31, 2012, $36.3 million was held by our foreign subsidiaries. The majority of the cash held by our foreign subsidiaries is generally available for the ongoing needs of our operations. The laws of certain countries may limit our ability to utilize cash resources held in those countries for operations in other countries. However, these laws are not likely to impact our liquidity in any material way. The operations of each foreign subsidiary generally fund such subsidiary’s capital requirements. In the event that other foreign operations or operations within the United States require additional cash, we may
70
Table of Contents
transfer cash between and among subsidiaries as needed so long as such transfers are in accordance with law. As of March 31, 2012, we had the ability to repatriate $16.1 million of cash at our discretion from the foreign subsidiaries and branches while the remaining balance of $20.2 million was held at subsidiaries in which earnings are considered permanently reinvested. Repatriation of some of these funds could be subject to delay and could have potential tax consequences, principally with respect to withholding taxes paid in foreign jurisdictions. If cash is repatriated from jurisdictions in which earnings are considered permanently reinvested we will be required to accrue and pay U.S income taxes on such repatriations.
As market conditions warrant, we may from time to time repurchase debt securities issued by us in privately negotiated or open-market transactions, by tender offer or otherwise, or issue new debt in order to refinance or prepay amounts outstanding under the Credit Facilities or the Senior Subordinated Notes or for other permitted purposes.
Operating Activities
We generated cash flows from operating activities of $19.9 million for the three months ended March 31, 2012, compared to $9.9 million for the same period in 2011. The increase in cash flow provided by operations for the three months ended March 31, 2012 was primarily attributable to an increase in earnings of $10.9 million, a $(12.1) million decrease in remeasurement charges on foreign denominated debt, an increase of deferred income taxes of $1.9 million, a decrease of accounts receivable of $(1.8) million, an increase in inventories of $5.7 million, a decrease in accounts payable of $(5.1) million, an increase in accrued expenses of $8.4 million and an increase in income tax balances of $2.0 million. The $(12.1) million decrease in remeasurement charges on foreign debt related to the remeasurement charges we record on our foreign denominated debt based upon the exchange rate of the U.S. Dollar to the Euro. The increase of $1.9 million in deferred tax balances was due to change in the deferred tax balances associated with the Euro denominated debt. The decrease of $(1.8) million in accounts receivable is due to higher sales levels for the three months ended March 31, 2012 compared to the same period in 2011, offset by improved receivable collections in the three months ended March 31, 2012 compared to the same period in 2011. The increase in inventories of $5.7 million is due to improved inventory management for the three months ended March 31, 2012 compared to the same period in 2011. The decrease in accounts payable of $(5.1) million is due to lower inventory purchases made in the three months ended March 31, 2012 compared to the same period in 2011. The increase in accrued expenses of $8.4 million is due primarily to higher bonus payments made in the three months ended March 31, 2011 compared to the same period in 2012. The increase in income tax balances of $2.0 million is due to recording higher income taxes payable in the three months ended March 31, 2012 compared to the same period in 2011 based upon earnings offset by higher income tax payments in the three months ended March 31, 2012 compared to 2011.
We generated cash flows from operating activities of $49.7 million for the year ended December 31, 2011, compared to $56.1 million for the same period in 2010. The decrease in cash flow provided by operations, for the year ended December 31, 2011 was primarily attributable to a decrease in earnings of $(22.9) million, a $46.4 million increase in impairment charges, a $8.2 million increase in remeasurement charges on foreign denominated debt, a decrease of deferred income taxes of $(9.8) million, a decrease in accounts payable of $(8.7) million, a decrease in accrued expenses of $(7.5) million and a decrease in income tax balances of $(9.4) million. The $8.2 million increase in remeasurement charges on foreign debt related to the remeasurement charges we record on our foreign denominated debt based upon the exchange rate of the U.S. Dollar to the Euro. The decrease of $(9.8) million in deferred tax balances was primarily due to change in the deferred tax balances associated with the Euro denominated debt and the $46.4 million of impairment charges related to a write down of the customer list intangible assets in our Industrial Asia reporting unit recorded in the year ended December 31, 2011. The $(8.7) million decrease in accounts payable was attributable to inventory build up in the third quarter of 2010 to meet customer orders. The $(7.5) million decrease in accrued expenses is due to higher bonus payments made in the year ended December 31, 2011 compared to the same period in 2010. The decrease in income tax balances of $(9.4) million is due to recording higher income taxes payable in 2010 based upon earnings and higher income tax payments in 2011 compared to 2010.
71
Table of Contents
We generated cash flows from continuing operating activities of $56.1 million for the year ended December 31, 2010 compared to $48.4 million for the same period in 2009. The increase in cash flow provided by operations for the year ended December 31, 2010 as compared to the same period in 2009 was primarily attributable to a $106.8 million increase in net income from 2010 compared to 2009, a $29.4 million increase in deferred income tax balances, a $68.7 million decrease to impairment charges recorded in 2009 and a $22.5 million decrease in remeasurement charges on foreign denominated debt.
We review accounts receivable on a consolidated basis on a business-by-business level. These quarterly reviews focus primarily on the seasonality and collectability of our accounts receivable. As a result of these reviews, we determined that the composition of our accounts receivable did not change in any material respect during (1) the three months ended March 31, 2012, compared to the same period in 2011, (2) the year ended December 31, 2011 compared to the year ended December 31, 2010 or (3) the year ended December 31, 2010 compared to the year ended December 31, 2009. Our management uses days sales outstanding (“DSO”) to measure how efficiently we manage the billing and collection of our accounts receivable. We calculate DSO by dividing the product of 360 and our accounts receivable balance by our annualized net sales. At March 31, 2012 and December 31, 2011, DSO was 72 days and 66 days, respectively.
The primary components of our inventory are finished goods, raw materials and supplies and equipment. We review our inventories quarterly on a consolidated basis on a business-by-business level for obsolescence and to evaluate the appropriateness of the composition of our inventory at any given time. Our management uses days in inventory (“DII”) to calculate our efficiency at realizing inventories. We calculate DII by dividing the product of 360 and our inventory balance, net of reserves, by our annualized cost of sales, excluding any intercompany sales. At March 31, 2012 and December 31, 2011, DII was 73 days and 70 days, respectively. Our products generally have shelf lives that exceed one year.
Investing Activities
Our net cash flows (used in) investing activities for the three months ended March 31, 2012 was $(6.5) million compared to $(1.5) million for the same period in 2011. The increase was attributable to the acquisition of a company in Brazil that closed in the three months ended March 31, 2012 for approximately $5.1 million.
Our net cash flows (used in) investing activities for the year ended December 31, 2011 was $(3.5) million compared to $(8.9) million for the same period in 2010. The decrease of $5.5 million was attributable to $3.3 million of proceeds from the sale of business units, $0.3 million of proceeds from the sale of assets, capital expenditures of $(8.7) million, the purchase of equity securities of $(0.8) million and the redemption of a certificate of deposit of $2.5 million during the year ended December 31, 2011, compared to capital expenditures of $(7.5) million, $1.1 million of proceeds from the sale of assets and the purchase of a certificate of deposit of $(2.5) million during the year ended December 31, 2010.
Our net cash flows (used in) investing activities for the year ended December 31, 2010 was $(8.9) million compared to $(3.9) million for the same period in 2009. The increase of $5.0 million was attributable to higher capital expenditures of $1.0 million for the year ended December 31, 2010 compared to the same period in 2009, lower proceeds received from assets sales of $1.5 million for the year ended December 31, 2010 compared to the same period in 2009 and a certificate of deposit purchase of $2.5 million during the year ended December 31, 2010.
Financing Activities
Our net cash flows (used in) financing activities for the three months ended March 31, 2012 was $(17.9) million compared to $(26.9) million for the same period in 2011. The increase in net cash flows (used in) financing activities of $9.0 million was due to lower payments of long-term debt during the three months ended March 31, 2012 of $9.5 million compared to the same period in 2011. The decrease in long-term debt payments was due to a $24.2 million mandatory excess cash flow payment based upon our 2010 operating results made
72
Table of Contents
during the first quarter 2011, compared to a $14.6 million mandatory excess cash flow payment based upon our 2011 operating results made during the same time period in 2012. The credit agreement governing our Credit Facilities requires an excess cash flow payment equal to 50% of our “excess cash flow” (as defined in the credit agreement) following each fiscal year less the aggregate amount of all voluntary prepayments during such fiscal year (but only 25% thereof if, on the date of the prepayment, our consolidated leverage ratio is less than 5.00 to 1.00 but greater than or equal to 4.00 to 1.00, and, alternatively, zero percent thereof if, on such date, the consolidated leverage ratio is less than 4.00 to 1.00). To the extent that we have excess cash flow in the future requiring a mandatory excess cash flow payment to the lenders under our Credit Facilities, we intend to make such payments in compliance with the credit agreement. We also had a decrease in short term borrowings of $0.5 million for the three months ended March 31, 2012 compared to the same period in 2011.
Our net cash flows (used in) financing activities for the year ended December 31, 2011 was $(37.8) million compared to $(26.6) million for the same period in 2010. The increase in net cash flows (used in) financing activities of $(11.2) million was due to higher payments of long-term debt during the year ended December 31, 2011 of $(10.4) million compared to the same period in 2010. The increase in long-term debt payments was due to a $24.2 million mandatory excess cash flow payment based upon our 2010 operating results made during the first quarter of 2011, compared to a $15.7 million mandatory excess cash flow payment based upon our 2009 operating results made during the same time period in 2010. We also had a decrease in short term borrowings of $(1.9) million and proceeds from capital leases of $1.3 million for the year ended December 31, 2011 compared to the same period in 2010.
Our net cash flows (used in) financing activities for the year ended December 31, 2010 was $(26.6) million compared to $(54.4) million for the same period in 2009. The decrease in net cash flows (used in) financing activities of $27.8 million was due to higher payments of long-term debt during the year ended December 31, 2009, of $34.1 million compared to the same period in 2010. Our payments of long-term debt for the year ended December 31, 2010 included a $15.7 million mandatory excess cash flow payment based upon our 2009 operating results, compared to a $8.6 million mandatory excess cash flow payment made during the year ended December 31, 2009, based upon our 2008 operating results. During the year ended December 31, 2009, we also made a debt payment on our long-term debt of $33.0 million related to the sale of our Offset business which was finalized in May 2009. During the year ended December 31, 2010 our payments of our Japanese Yen denominated debt was $5.7 million compared to $12.6 million for the same period in 2009. During the year ended December 31, 2009, one of our Japanese business units borrowed $5.6 million of long-term debt denominated in Japanese Yen. There were not any similar long-term borrowings for the year ended December 31, 2010.
Credit Facilities, Japanese Debt and Senior Subordinated Notes
As of March 31, 2012, the Credit Facilities consist of (1) our $360.0 million Tranche B Facility (denominated in U.S. Dollars), (2) our $250.0 million Tranche C Facility (denominated in Euros), and (3) our $50.0 million Revolving Credit Facility denominated in U.S. Dollars. A portion of the Revolving Credit Facility not in excess of $15.0 million is available for the issuance of letters of credit. Separate and apart from the Credit Facilities, we also had Japanese senior secured bank debt denominated in Japanese Yen.
As of March 31, 2012, we had $350.0 million of Senior Subordinated Notes outstanding, $220.4 million of indebtedness outstanding under the Tranche B Facility, $151.0 million of indebtedness outstanding under the Tranche C Facility and $8.0 million of Japanese debt. During the years ended December 31, 2011, 2010 and 2009 and the three months ended March 31, 2012, there were no borrowings under our $50.0 million Revolving Credit Facility. We had letters of credit outstanding of $3.9 million at March 31, 2012. The letters of credit reduce the borrowings available under the Revolving Credit Facility. Assuming that the amount of net proceeds that we receive from this offering is $ million and after giving effect to our intended use of proceeds as described in “Use of Proceeds”, as of March 31, 2012, we would have had approximately $ million of total indebtedness
73
Table of Contents
outstanding, including $ million aggregate principal amount of Senior Subordinated Notes outstanding, $ million of indebtedness outstanding under the Tranche B Facility, $ million of indebtedness outstanding under the Tranche C Facility and $8.0 million of Japanese debt.
The borrower under the Credit Facilities and the issuer of the Senior Subordinated Notes is MacDermid, Incorporated. Upon consummation of this offering, MacDermid Group, Inc. and its wholly owned domestic subsidiaries will unconditionally guarantee all obligations under the Credit Facilities. The wholly owned domestic subsidiaries of MacDermid, Incorporated unconditionally guarantee all obligations under the Senior Subordinated Notes. Each of the notes representing our Japanese debt is secured by the assets of MacDermid Japan.
The Credit Facilities and the Senior Subordinated Notes contain various covenants including limitations on additional indebtedness, dividends and other distributions, entry into new lines of business, use of loan proceeds, capital expenditures, restricted payments, restrictions on liens, transactions with affiliates, amendments to organizational documents, accounting changes, sale and leaseback transactions and dispositions. In addition, the Revolving Credit Facility requires us to comply with certain financial covenants, including consolidated leverage and interest coverage ratios and limitations on capital expenditures if our funding under the Revolving Credit Facility exceeds $10.0 million for ten or more consecutive days in any fiscal quarter. As of March 31, 2012 and December 31, 2011, we were in compliance with the debt covenants contained in the Credit Facilities and the Senior Subordinated Notes.
For additional information about our Credit Facilities, Senior Subordinated Notes and Japanese debt, please see “Description of Certain Indebtedness of MacDermid, Incorporated”.
Other Debt Facilities
We carry various short-term debt facilities worldwide which are used to fund short-term cash needs as the need arises. As of March 31, 2012 and December 31, 2011, there was $0 outstanding under these other debt facilities. We also have various overdraft facilities available. At March 31, 2012 and December 31, 2011, the capacity under these overdraft facilities was $23.4 million and $22.8 million, respectively. As of March 31, 2012, these overdraft lines bore interest rates ranging from 1.0% to 6.3%.
Hedging Transactions
In June 2007, we entered into an interest rate swap agreement (the “swap”) to hedge interest rate fluctuations under the Tranche B Facility. The swap helped mitigate interest rate fluctuations on our floating rate U.S. Dollar denominated debt. The swap was at a fixed rate of 5.40%, a notional amount of $170.0 million and matured on June 30, 2010. We also entered into an interest rate collar agreement (the “collar”) in June 2007. The collar helps protect our floating rate U.S. Dollar denominated debt. The collar has a floor of 5.20% and a ceiling of 6.25%, a notional amount of $100.0 million and covers the period from June 30, 2010 through June 30, 2012.
We conduct a significant portion of our business in currencies other than the U.S. Dollar, the currency in which the consolidated financial statements are reported. Correspondingly, our operating results could be affected by foreign currency exchange rate volatility relative to the U.S. Dollar. One of our business units in the United Kingdom uses the British Pound Sterling as its functional currency for paying labor and other operating costs, while approximately 25% of its revenues are denominated in U.S. Dollars. To hedge against the risk of a stronger British Pound Sterling, we contracted in 2012, 2011, 2010 and 2009, on behalf of our foreign business unit, with a financial institution to deliver U.S. Dollars at a fixed British Pound Sterling rate and to receive British Pound Sterling in exchange for the U.S. Dollar. We did not pay up-front premiums to obtain the hedge.
74
Table of Contents
The following table summarizes derivative instrument amounts as of March 31, 2012, by currency and the portion of the asset that settles within the next twelve months related to foreign currency derivatives.
| Local Currency Amount |
U.S. Dollar Amount |
Percentage Settled Within One Year |
Settlement Date | |||||||||||
| Derivative Assets (amounts in thousands) |
||||||||||||||
| British Pound Sterling |
£3,105 | $ | 5,000 | 100 | % | June 29, 2012 | ||||||||
| British Pound Sterling |
£3,148 | $ | 5,000 | 100 | % | September 27, 2012 | ||||||||
| British Pound Sterling |
£2,572 | $ | 4,000 | 100 | % | December 19, 2012 | ||||||||
|
|
|
|||||||||||||
| $ | 14,000 | |||||||||||||
|
|
|
|||||||||||||
Fair Value
The following table presents the carrying value and estimated fair value of our Tranche B Facility, Tranche C Facility and the Senior Subordinated Notes:
| March 31, 2012 | December 31, 2011 | |||||||||||||||
| (amounts in thousands) | Carrying Value | Fair Value | Carrying Value | Fair Value | ||||||||||||
| Tranche B Facility, Tranche C Facility and Senior Subordinated Notes debt including current portion |
$ | 721,346 | $ | 732,909 | $ | 733,097 | $ | 727,883 | ||||||||
|
|
|
|
|
|
|
|
|
|||||||||
The fair value was determined based upon quoted market prices. Since considerable judgment is required in interpreting market information, the fair value of the Tranche B Facility, Tranche C Facility and the Senior Subordinated Notes indebtedness is not necessarily the amount which could be realized in a current market exchange.
Contractual Obligations
We own most of our major manufacturing facilities, but we do lease certain office, manufacturing factories and warehouse space and land, as well as other equipment primarily under non-cancelable operating leases.
Summarized in the table below are our obligations and commitments to make future payments in connection with our debt and minimum lease payment obligations (net of minimum sublease income) as of December 31, 2011. Actual amounts are as of December 31, 2011 without giving effect to the use of proceeds from this offering. As adjusted amounts are as of December 31, 2011 after giving effect to our intended use of proceeds as described in “Use of Proceeds”.
| (amounts in thousands) | Payment Due by Period | |||||||||||||||||||||||||||||||||||||||||||||||||||||||
| 2012 | 2013 | 2014 | 2015 | 2016 | 2017 and Thereafter |
Total | ||||||||||||||||||||||||||||||||||||||||||||||||||
| (Actual) |
(As |
(Actual) |
(As |
(Actual) |
(As |
(Actual) |
(As |
(Actual) |
(As |
(Actual) |
(As |
(Actual) |
(As |
|||||||||||||||||||||||||||||||||||||||||||
| Debt obligations (including short-term debt)(1) |
$ | 25,601 | $ | $ | 9,702 | $ | $ | 357,902 | $ | $ | — | $ | $ | — | $ | $ | 350,000 | $ | $ | 743,205 | $ | |||||||||||||||||||||||||||||||||||
| Capital lease obligations(2) |
540 | 317 | 218 | 90 | 2 | — | 1,167 | |||||||||||||||||||||||||||||||||||||||||||||||||
| Operating leases(3) |
9,851 | 5,774 | 3,932 | 2,820 | 2,593 | 20,595 | 45,565 | |||||||||||||||||||||||||||||||||||||||||||||||||
| Interest payments(4) |
45,829 | 43,124 | 34,613 | 33,252 | 33,250 | 9,292 | 199,360 | |||||||||||||||||||||||||||||||||||||||||||||||||
| Expected pension funding payments(5) |
8,051 | 7,663 | 7,663 | 7,663 | 7,663 | — | 38,703 | |||||||||||||||||||||||||||||||||||||||||||||||||
|
|
|
|
|
|
|
|
|
|
|
|
|
|
|
|
|
|
|
|
|
|
|
|
|
|
|
|
|
|||||||||||||||||||||||||||||
| Total cash contractual obligations |
$ | 89,872 | $ | $ | 66,580 | $ | $ | 404,328 | $ | $ | 43,825 | $ | $ | 43,508 | $ | $ | 379,887 | $ | $ | 1,028,000 | $ | |||||||||||||||||||||||||||||||||||
|
|
|
|
|
|
|
|
|
|
|
|
|
|
|
|
|
|
|
|
|
|
|
|
|
|
|
|
|
|||||||||||||||||||||||||||||
75
Table of Contents
| (1) | Reflects the principal payments on the Credit Facilities and the Senior Subordinated Notes and Japanese debt. December 31, 2011 exchange rates were utilized to estimate U.S. Dollar payments for Tranche C Facility debt and Japanese debt interest payments. 2012 amounts include excess cash flow payments made in March 2012 on debt under the Tranche B Facility and the Tranche C Facility. |
| (2) | Excludes interest on capital lease obligations of $1.2 million at December 31, 2011. |
| (3) | Amounts are net of sublease income on operating leases of approximately $0.1 million in 2012, $0.1 million in 2013 and $0.1 million in 2014. |
| (4) | Amounts are based on currently applicable interest rates in the case of variable interest rate debt. December 31, 2011 exchange rates were utilized to estimate U.S. Dollar payments for Tranche C Facility debt and Japanese debt interest payments. The amounts also include estimated payments required under an interest rate collar agreement, which expires in 2012. |
| (5) | Amounts are based upon our expected future pension funding payments in the U.S. and the United Kingdom for 2012 through 2016. As the funded status of our pension plans in the U.S. and the United Kingdom will vary, obligations for expected pension funding payments after 2016 cannot be reasonably estimated and are not included in the table. |
As of December 31, 2011, we had reserves of $18.8 million recorded for uncertain tax positions, including interest and penalties. We do not include this amount in our long-term contractual obligations table because of the difficulty in making reasonably reliable estimates of the timing of cash settlements, if any, with the respective taxing authorities.
Capital Expenditures
We expect to spend approximately $10.0 million over the course of 2012 for capital expenditures, and $8.5 million from March 31, 2012 through the remainder of 2012 related to our expected capital expenditures. We expect to use cash generated from our operations and cash on hand to fund our capital expenditures. The general purposes of our capital expenditures are to support our investment and expansion plans relating to product development and sales and to ensure compliance with environmental health and safety laws and initiatives. We estimate that we spend approximately $1.0 million annually on environmental, health and safety capital expenditures. We do not expect this amount to increase materially in the future.
Off-Balance Sheet Arrangements
We use customary off-balance sheet arrangements, such as operating leases and letters of credit, to finance our business. None of these arrangements has or is reasonably likely to have a current or future effect on our financial condition, changes in financial condition, revenues or expenses, results of operations, liquidity, capital expenditures or capital resources that is material to investors.
Significant Accounting Policies and Critical Estimates
The preparation of our financial statements requires management to make estimates and assumptions that affect the reported amounts of assets and liabilities and the disclosure of contingent assets and liabilities at the date of the financial statements, as well as the reported amounts of net sales and expenses during the reporting period.
Our management must undertake decisions that impact the reported amounts and related disclosures. Such decisions include the selection of the appropriate accounting principles to be applied and also assumptions upon which accounting estimates are based. The company applies judgment based on its understanding and analysis of the relevant circumstances to reach these decisions. By their nature, these judgments are subject to an inherent degree of uncertainty. Accordingly, actual results could differ significantly from the estimates applied. Significant items subject to such estimates and assumptions include the useful lives of fixed assets; allowances for doubtful accounts and sales returns, deferred tax assets, inventory, inventory valuation, share-based compensation, reserves for employee benefit obligations, environmental liabilities, income tax uncertainties and other contingencies.
Our management believes the following accounting policies to be those most important to the portrayal of our financial condition and those that require the most subjective judgment:
| • | valuation of long-lived assets; |
76
Table of Contents
| • | operational restructuring activities; |
| • | accounting for income taxes; |
| • | inventory valuation methodology; |
| • | product sales and revenue recognition; |
| • | purchase accounting, goodwill and intangible assets; and |
| • | employee benefits and pension obligations. |
If actual results differ significantly from management’s estimates and projections, there could be a material negative impact on our financial statements.
Valuation of Long-Lived Assets
The net book values of our tangible and intangible long-lived assets at March 31, 2012, December 31, 2011 and December 31, 2010 were as follows:
| As of | ||||||||||||
| (amounts in thousands) | March 31, 2012 | December 31, 2011 | December 31, 2010 | |||||||||
| Property, plant and equipment |
$ | 97,410 | $ | 96,916 | $ | 105,371 | ||||||
| Goodwill |
480,988 | 474,581 | 477,483 | |||||||||
| Intangibles |
268,977 | 274,105 | 349,569 | |||||||||
|
|
|
|
|
|
|
|||||||
| Total Net Book Value |
$ | 847,375 | $ | 845,602 | $ | 932,423 | ||||||
|
|
|
|
|
|
|
|||||||
We assess the impairment of long-lived assets, which include goodwill, indefinite-lived purchased intangible assets, finite-lived purchased intangible assets and property, plant and equipment, whenever events or changes in circumstances indicate that the carrying value may not be recoverable. During the year ended December 31, 2009, we concluded that indicators of impairment existed related to our goodwill, indefinite-lived purchased intangible assets and property, plant and equipment. During the year ended December 31, 2011, we concluded that indicators of impairment existed related to our identifiable intangible assets. The impairment charges we took related to these indicators of impairment are discussed below.
Identifiable Intangible Assets
Indefinite-lived intangible assets are reviewed for potential impairment on an annual basis by comparing the estimated fair value of the indefinite-lived purchased intangible assets to the carrying value. Our annual test for intangible asset impairment is performed as of April 1st of each year. In addition to our annual test for impairment, we also test for impairment when events or circumstances indicate that these identifiable intangible assets may be impaired. We test our corporate tradename for impairment at the consolidated level because it is operated as a single asset and relies upon our consolidated financial results and cash flows. Our other tradenames are not combined for impairment testing because they generate cash flows independently and are reviewed at the level each such tradename is recorded. The estimated fair value of these intangible assets is determined using the “relief from royalty” method, which is described below. An impairment charge is recognized when the estimated fair value of an indefinite-lived intangible asset is less than the carrying value.
Finite-lived intangible assets such as developed technology and customer lists are amortized on a straight-line basis over their estimated useful lives, which are currently ten years for developed technology and range between three and 21 years for customer lists. If circumstances require a long-lived asset group to be tested for possible impairment, we first determine whether the estimated undiscounted future cash flows expected to result from the use of the asset plus net proceeds expected from disposition of the asset, if any, are less than the
77
Table of Contents
carrying value of the asset. When an impairment is identified, the carrying amount of the asset is reduced to its estimated fair value based on a discounted cash flow approach or, when available and appropriate, based on comparable market values.
When applying the “relief from royalty” method, the cash flows expected to be generated by the intangible asset are discounted to their present value equivalent using an appropriate weighted average cost of capital (“WACC”) for the respective asset being valued. The WACC we utilize is prepared by an outside valuation expert based upon our industry average.
The valuations of our customer lists and developed technology intangible assets are based on estimated undiscounted cash flows, which incorporate our long-term net sales projections as a key assumption. The long-term net sales projections utilized in the valuation of our customer lists and developed technology intangible assets are based upon current customers, new strategic products and potential sales growth based on historical experience and current expectations. The undiscounted net cash flows expected to be generated by the customer lists and developed technology intangible assets are then compared to their respective carry values to determine if impairment exists.
We use the “relief from royalty” method to value the tradename intangible asset. Our net sales projection is a key assumption. We apply a royalty rate to the projected net sales. The royalty rate is based on market royalty rates and royalties we pay to outside parties. The resulting royalty savings are reduced by income taxes resulting from the annual royalty savings at a market participant corporate income tax rate to arrive at the after-tax royalty savings associated with owning the tradenames. Finally, the present value of the estimated annual after-tax royalty savings for each year is used to estimate the fair value of the tradenames.
During 2009, we recorded an impairment charge related to our indefinite-lived purchased intangible assets based upon our annual impairment review. We hired an independent valuation firm to assist management with determining the fair value of the indefinite-lived purchased intangible assets. Our management concluded that the estimated direct cash flows associated with the applicable intangible assets using a “relief from royalty” methodology associated with revenues projected to be generated from these intangible assets were less than the carrying value of the intangible assets. Because of lower net sales, primarily from our industrial and electronic products, due to the global economic recession, we experienced lower estimated cash flows utilized in the “relief from royalty” methodology on a consolidated basis. Our impairment analysis of our indefinite-lived purchased intangible assets indicated that our corporate tradename (“MacDermid”) was therefore impaired by $26.1 million, and we accordingly recorded an impairment charge of $26.1 million related to this tradename during 2009. After recording the impairment charge of $26.1 million in 2009, the value of the corporate tradename was $50.2 million.
The primary driver of the impairment charge recorded in 2009 related to our indefinite-lived purchased intangible assets was lower net sales levels because of the global economic recession and therefore lower profitability. The global economic recession resulted in weakening conditions in the industrial and electronic end markets we serve, which resulted in lower profitability on a consolidated basis. The corporate tradename is not allocated to either of our reportable segments and is presented in the corporate assets in our total assets table in our segment reporting footnote to our consolidated financial statements. As of April 1, 2010, the corporate tradename had a headroom cushion of approximately $27.2 million. As of April 1, 2011, the corporate tradename had a headroom cushion of approximately $34.7 million. As of April 1, 2012, the corporate tradename had a headroom cushion of approximately $38.6 million.
For our annual impairment testing related to our indefinite-lived purchased intangible assets performed as of April 1, 2010, 2011 and 2012 we utilized the “relief from royalty” methodology. We apply a royalty rate to the projected net sales. The royalty rate is based on product profitability, industry and markets served, tradename protection factors, and perceived licensing value. The resulting royalty savings are reduced by income taxes resulting from the annual royalty savings at a market participant corporate income tax rate to arrive at the after-tax royalty savings associated with owning the tradenames. Finally, the present values of the estimated
78
Table of Contents
annual after-tax royalty savings for each year in the projection period are utilized to estimate the fair value of the tradenames. The estimates utilized in the April 1, 2010, 2011 and 2012 impairment testing of our indefinite-lived purchased intangible assets were not materially different from our historical results for the base periods in either impairment testing year as of April 1, 2010, 2011 and 2012.
The primary assumptions in each of these calculations are net sales, growth rates and the WACC utilized to discount the resulting cash flows. Our assumptions concerning net sales are impacted by global and local economic conditions in the various markets we serve. Our assumptions related to net sales, growth rates and WACC contain certain uncertainties related to sales growth, economic growth, future product development and cost estimates that could differ from historical results and materially impact our estimates utilized in the impairment testing of our indefinite-lived purchased intangible assets and the results of our impairment testing of our indefinite-lived purchased intangible assets.
During 2009, we also recorded an impairment charge of $0.2 million related to customer list intangible assets in our Industrial segment because of the loss of sales to outside customers.
During 2011, we recorded $46.4 million of impairment charges related to a write down of the customer list intangible assets in our Industrial Asia reporting unit to their estimated fair values. We concluded that certain indicators were present suggesting a potential impairment of the customer list intangible assets of our Industrial Asia reporting unit. The indicators of this potential impairment included:
| • | Recent reductions in gross profit margins of certain products; |
| • | Increases in raw material prices used in our manufacturing process that were difficult to pass along to customers; |
| • | Increased pricing pressure for certain of our products from competitors; and |
| • | Customers reluctance to accept product price increases and our reluctance to continue selling certain products, which require technical support, at low margin levels. |
Based upon the above indicators we evaluated our customer list intangible assets for potential impairment. In accordance with ASC 360, a long-lived asset (asset group) shall be tested for recoverability whenever events or changes in circumstances indicate that a long-lived asset (asset group) may not be recoverable. Under ASC 360, impairment is defined as the condition that exists when the carrying amounts of a long-lived asset (asset group) exceeds its fair value. We utilized an “income approach” method to test our Industrial Asia customer list intangible assets for impairment. In step one of our testing, we compared the carrying amounts of our Industrial Asia customer list intangible assets to the undiscounted cash flows expected to be generated from the use and eventual disposition of the customer list intangible assets over their remaining useful lives. Four of our businesses in our Industrial Asia reporting unit passed the first step of our testing procedures, with significant headroom. Two of our businesses in our Industrial Asia reporting unit failed the first step of our testing procedures; therefore, we performed the second step of impairment testing. In the second step of our testing procedures, the estimated fair value of the Industrial Asia customer list intangible assets was determined by estimating the after-tax cash flows attributable to the assets and then discounting these cash flows to a present value using a risk-adjusted discount rate. The cash flow model utilized in the customer list intangible asset impairment test involves significant judgments related to future growth rates, discount rates and tax rates, among other considerations. Our step-two testing procedures indicated that the customer list intangible assets of two of our businesses in our Industrial Asia reporting unit were impaired because the carrying value of these assets exceeded their estimated fair value by $46.4 million.
During the year ended December 31, 2010 and the three months ended March 31, 2012 and 2011, we did not record any impairment charges related to indefinite-lived purchased intangible assets or any identifiable intangible assets.
79
Table of Contents
We determine the fair value of our intangible assets in accordance with ASC Topic 820, “Fair Value Measurements and Disclosures”. Our impairment evaluation of identifiable intangible assets and property, plant and equipment includes an analysis of estimated future undiscounted net cash flows expected to be generated by the assets over their remaining estimated useful lives. If the estimated future undiscounted net cash flows are insufficient to recover the carrying value of the assets over the remaining estimated useful lives, we record an impairment charge in the amount by which the carrying value of the assets exceeds the fair value. We determine fair value based on either market quotes, if available, or estimated discounted cash flows using a discount rate commensurate with the risk inherent in our current business model for the specific asset being valued.
Goodwill
Goodwill represents the excess of the purchase price over the fair value of the identifiable net assets of an acquired business. Goodwill is tested for impairment at the reporting unit level annually, or when events or changes in circumstances indicate that goodwill might be impaired. For goodwill, a two-step impairment test is performed at the reporting unit level. In the first step of impairment testing, the fair value of each reporting unit is compared to its carrying value. The fair value of each reporting unit is determined based on the present value of estimated discounted future cash flows. The estimated discounted cash flows are prepared based upon our estimated cash flows at the reporting unit level for the twelve months ended preceding the date of our impairment testing. The estimated cash flows utilized in our goodwill impairment testing differ from our actual consolidated cash flows due to exclusion of non-recurring charges and differences in U.S. income tax expense items and U.S. deferred tax balances which are estimated at the reporting unit level. The cash flow model utilized in the goodwill impairment test involves significant judgments related to future growth rates, discount rates and tax rates, among other considerations. If the fair value of a reporting unit exceeds the carrying value of the net assets assigned to that reporting unit, goodwill is not impaired and no further testing is performed. If the carrying value of the net assets assigned to that reporting unit exceeds the fair value of that reporting unit, then the second step of the impairment test must be performed to determine the implied fair value of the reporting unit’s goodwill. If the carrying value of the reporting unit’s goodwill exceeds its implied fair value, an impairment charge is recorded equal to the difference. Our annual test for goodwill impairment is performed as of April 1st of each year.
During 2009, we recorded an impairment charge related to goodwill based upon our annual impairment review. The first step of the impairment testing indicated that the carrying values of the Industrial Americas and Asia reporting units exceeded their fair values as of the testing date. Because the first step indicated a potential impairment, we performed the second step by comparing the implied value of the goodwill as calculated in a hypothetical purchase transaction to the book value of the goodwill as of the testing date. The second step of the impairment testing indicated that the book values of the Industrial Americas and Asia reporting units’ goodwill exceeded the implied fair values of that goodwill. The implied fair values were determined by reviewing the current assets and liabilities; property, plant and equipment; and other identifiable intangible assets (both those recorded and not recorded) to determine the appropriate fair values of the reporting units’ assets and liabilities in a hypothetical purchase transaction. We utilized a report prepared by an independent valuation expert to assist management in determining the fair values of the Industrial segment land, building and intangible assets balances to utilize in step two of the goodwill impairment test. The fair values of the Industrial segment’s assets and liabilities were then compared to the book values of the Industrial segment’s assets and liabilities to determine an implied value of the reporting units’ goodwill.
The primary driver of the goodwill impairment charge recorded in 2009 was lower estimated discounted cash flows utilized in our April 1, 2009 goodwill impairment testing procedures. Our business was significantly impacted by the global economic recession of 2008 and 2009, and our financial performance was adversely impacted. We experienced lower sales and therefore lower profitability, which caused our estimated discounted cash flows to be significantly lower. The WACC we utilized in our April 1, 2009 impairment testing procedures also significantly increased over the previous year because of increased market risk due to worsening conditions
80
Table of Contents
in the global economy, which has a direct impact on reducing our estimated discounted cash flows. The combination of these items utilized in our April 1, 2009 goodwill impairment testing procedures significantly lowered the implied fair value of our Industrial Americas and Asia reporting units’ goodwill balances.
As a result of these lower implied fair values, impairment charges of approximately $14.6 million (Industrial Americas reporting unit) and $26.6 million (Industrial Asia reporting unit) were recorded during 2009. The $14.6 million goodwill impairment charge recorded in our Industrial Americas reporting unit was due primarily to lower sales levels associated with our industrial products in the automotive market. The $26.6 million goodwill impairment charge recorded in our Industrial Asia reporting unit was due primarily to lower sales levels associated with our electronic products. The carrying value of the Industrial Americas’ goodwill was $112.0 million before the 2009 goodwill impairment charge and was $97.4 million subsequent to the 2009 goodwill impairment charge. The carrying value of the Industrial Asia reporting unit’s goodwill was $241.6 million before the 2009 goodwill impairment charge and was $215.0 million subsequent to the 2009 goodwill impairment charge. As of April 1, 2009, we had four reporting units that have been allocated goodwill.
As of April 1, 2010, we had four reporting units that have been allocated goodwill. As of April 1, 2010, no reporting units had lower estimated fair values than carrying values in the first step of our goodwill impairment evaluation; therefore no further testing was performed and no goodwill impairment charges were recorded. As of April 1, 2010, the estimated fair value of all of our reporting units substantially exceeded their carrying value due to the economic recovery that we experienced in 2009 and 2010, due to higher sales levels, lower costs levels incurred as a result of our operational restructuring programs and increased profitability when comparing the estimated discounted cash flow used in our April 1, 2010 goodwill impairment testing procedures to the estimated discounted cash flows used in our April 1, 2009 goodwill impairment testing procedures. The estimated discounted cash flows utilized in our April 1, 2010 goodwill impairment testing procedures were prepared based upon our estimated cash flows at the reporting unit level for the 12 months preceding the date of our impairment testing. The estimated cash flows utilized in our goodwill impairment testing differ from our actual consolidated cash flows due to exclusion of non-recurring charges utilized in our estimated cash flows, differences in U.S. income tax expense items and U.S. deferred tax balances which are estimated at the reporting unit level and are not materially different from our actual cash flows.
As of April 1, 2011, we had four reporting units that have been allocated goodwill. As of April 1, 2011, no reporting units had lower estimated fair values than carrying values in the first step of our goodwill impairment evaluation; therefore no further testing was performed and no goodwill impairment charges were recorded. As of April 1, 2011, the estimated fair value of all of our reporting units substantially exceed their carrying value due to the continuation of the economic recovery that we experienced in 2010 and 2011, the lower costs we incurred as a result of our operational restructuring programs and the introduction of new products in 2010 and 2011. The estimated discounted cash flows utilized in our April 1, 2011 goodwill impairment testing procedures were prepared based upon our estimated cash flows at the reporting unit level for the 12 months preceding the date of our impairment testing. The estimated cash flows utilized in our goodwill impairment testing differ from our actual consolidated cash flows due to exclusion of non-recurring charges utilized in our estimated cash flows, differences in U.S. income tax expense items and U.S. deferred tax balances which are estimated at the reporting unit level and are not materially different from our actual cash flows.
As of April 1, 2012, we had four reporting units that have been allocated goodwill. As of April 1, 2012, no reporting units had lower estimated fair values than carrying values in the first step of our goodwill impairment evaluation; therefore no further testing was performed and no goodwill impairment charges were recorded. As of April 1, 2012, the estimated fair value of all of our reporting units substantially exceed their carrying value due to the continuation of the economic recovery that we experienced in 2010 and 2011, the lower costs we incurred as a result of our operational restructuring programs and the introduction of new products in 2010 and 2011. The estimated discounted cash flows utilized in our April 1, 2012 goodwill impairment testing procedures were prepared based upon our estimated cash flows at the reporting unit level for the 12 months preceding the date of our impairment testing. The estimated cash flows utilized in our goodwill impairment testing differ from our
81
Table of Contents
actual consolidated cash flows due to exclusion of non-recurring charges utilized in our estimated cash flows, differences in U.S. income tax expense items and U.S. deferred tax balances which are estimated at the reporting unit level and are not materially different from our actual cash flows.
During the years ended December 31, 2011 and 2010 and the three months ended March 31, 2012 and 2011, we did not record any goodwill impairment charges.
Property, Plant and Equipment
We evaluate property, plant and equipment (“PP&E”) for impairment whenever events or changes in circumstances indicate the carrying value of an asset may not be recoverable. If circumstances require a long-lived asset group to be tested for possible impairment, we first determine whether the estimated undiscounted future cash flows expected to result from the use of the asset plus net proceeds expected from disposition of the asset, if any, are less than the carrying value of the asset. When an impairment is identified, the carrying amount of the asset is reduced to its estimated fair value based on a discounted cash flow approach or, when available and appropriate, based on comparable market values. Major factors that influence our cash flow analysis are our estimates for future net sales and expenses associated with the use of the asset. Different estimates could have a significant impact on the results of our evaluation. If, as a result of our analysis, we determine that our PP&E has been impaired, we will recognize an impairment charge in the period in which the impairment is determined. Any such impairment charge could be significant and could have a material negative effect on our results of operations.
During 2009, the carrying value of equipment at a certain business unit in our Printing Americas operations was evaluated due to softening business conditions. This evaluation indicated that the carrying values of certain equipment were not recoverable, as the expected undiscounted future cash flows to be generated by them were less than their carrying values. The related impairment charge was measured based on the amount by which the asset carrying values exceeded fair value. The asset fair value was based on estimates of prices for similar assets. As a result of the above evaluation, we recorded a $1.2 million asset impairment charge in 2009. During the years ended December 31, 2011 and 2010 and the three months ended March 31, 2012 and 2011, we did not record any PP&E impairment charges, other than amounts recorded in connection with operational restructuring, which are discussed below. During the years ended December 31, 2011, 2010 and 2009, we recorded various non-cash asset impairment charges for PP&E of $0, $2.4 million and $1.2 million, respectively, in impairment and operational restructuring expense. During the three months ended March 31, 2012, we did not record any impairment charges related to our PP&E. During the years ended December 31, 2011, 2010 and 2009, we recorded repairs and maintenance expense related to our PP&E of $6.8 million, $6.6 million and $5.0 million, respectively. During the three months ended March 31, 2012 and 2011, we recorded repairs and maintenance expense related to our PP&E of $1.7 million and $1.5 million, respectively.
Continued pressure on our forecasted product shipments in the future due to the current global macroeconomic environment, loss of one or more significant customers, loss of market share, rising raw material prices or lack of growth in the industries into which our products are sold or an inability to ensure our cost structure is aligned to associated decreases in net sales could result in further impairment charges. If, as a result of our analysis, we determine that our goodwill, indefinite-lived intangible assets, identifiable intangible assets or other long-lived assets have been impaired, we will recognize an impairment charge in the period in which the impairment is determined. As of April 1, 2012 (the date of our 2012 annual impairment test) and December 31, 2011, we determined that no further indicators of impairment existed with regard to our goodwill, intangible assets and PP&E balances.
Operational Restructuring Activities
We have executed a series of operational restructuring initiatives since the Acquisition to streamline our cost structure and consolidate our global manufacturing activities. These actions have reduced our workforce in our manufacturing, research and development and sales technical and administrative functions.
82
Table of Contents
At each reporting date, we evaluate our accruals for operational restructuring activities, which consist primarily of termination benefits (principally severance payments), to ensure that our accruals are still appropriate. In certain circumstances, accruals are no longer required because of efficiencies in carrying out our initiative or because employees previously identified for separation resigned unexpectedly and did not receive severance or were redeployed due to circumstances not foreseen when the original plans were initiated. We reverse accruals to operational restructuring expense when it is determined they are no longer required.
Accounting for Income Taxes
We recognize deferred tax assets and liabilities based on the differences between the financial statement bases and the tax bases of assets, liabilities, net operating losses and tax credit carry-forwards. A valuation allowance is required to be recognized to reduce the recorded deferred tax asset to the amount that will more likely than not be realized. We consider the impact of deferred tax liabilities and also analyze estimated future taxable income by jurisdiction, including foreign source income for U.S. federal tax purposes and state taxable income, to determine potential utilization of state and foreign net operating losses, foreign tax credit, research and development credits and state tax credit carry forwards. We also include in our analysis a review of any tax reserves recorded, which if utilized under audit or review of the tax authorities, would allow for utilization of any net operating losses or credits.
The valuation allowance of $34.5 million recorded as of December 31, 2011 would reverse in whole or in part if significant taxable income was recognized in various states or foreign jurisdictions in which operating losses have been historically recorded or if we incurred significant foreign sourced U.S. taxable income which also had very low foreign tax associated with it. Finally, we could reverse a portion of the valuation allowance if we incurred a significant increase in U.S. domestic taxable income. Alternatively, if certain tax reserves recorded on the financial statements are no longer required then it is likely that we would need to adjust our valuation allowance by as much as $6.8 million. Some of our uncertain tax positions, if not sustained, would allow us to absorb tax credit carryovers that have a valuation allowance against them. Alternatively, realizing the tax benefits of some of our uncertain tax positions could further limit our ability to absorb tax credit carryovers for which a valuation allowance has not been established.
In assessing whether deferred tax assets will be realized, we consider whether it is more likely than not that some portion or all of the deferred tax assets will not be realized. The ultimate realization of deferred tax assets is dependent upon the generation of future taxable income during the periods in which those temporary differences become deductible. We consider the scheduled reversal of deferred tax liabilities, projected future taxable income, tax planning strategies and expiration dates of certain deferred tax assets in making this assessment.
Valuation allowances of $34.5 million have been recorded as of December 31, 2011. The valuation allowances reflect our assessment that it is more likely than not that certain deferred tax assets for state and foreign net operating losses, foreign tax credits, research and development credits and state tax credit carry-forwards will not be realized.
We have reserved for taxes, interest and penalties that may become due in future years as a result of audit assessments by the tax authorities. Although we believe that the positions reflected on the filed tax returns are supported, we still have established reserves recognizing that the tax authorities may challenge certain positions, which then may not be fully sustained. We review the tax positions on a quarterly basis and update and adjust the reserves taking into account lapses of statutes of limitations, proposed tax assessments from the tax authorities, settlement of tax audits with the tax authorities, identification of new issues as they arise and the issuance of any new tax regulations, laws or judicial settlements that may impact the tax reserves.
We consider many factors when estimating and evaluating tax positions and tax benefits. The first step in evaluating the tax position for recognition is to determine the amount of evidence that supports a favorable conclusion for the tax position upon audit. In order to recognize the tax position, we must determine whether it is more likely than not that the position is sustainable. The next requirement is to measure the tax benefit as the
83
Table of Contents
largest amount that has a more than 50% chance of being realized upon final settlement. The more likely than not recognition threshold is a matter of judgment based on the facts and circumstances of each individual issue. As of December 31, 2011, we had reserves of approximately $18.8 million for taxes, interest and penalties that may become due in later years as a result of future tax audits. These reserves are associated with potential transfer pricing issues, tax residency issues, deductibility of interest expense in various jurisdictions and certain foreign tax reporting income issues.
Inventory Valuation Methodology
Inventories are stated at the lower of average cost or market. We regularly review inventories for obsolescence and calculate a reserve based on historical write-offs, customer demand, product evolution, usage rates and quantities of stock on hand. Inventory in excess of estimated usage requirements is written down to its estimated net realizable value.
As of March 31, 2012 and December 31, 2011 and 2010, we had inventory reserve balances of $10.3 million, $9.6 million and $10.1 million, respectively, for obsolete, damaged and slow moving inventory. If actual future demand or market conditions are less favorable than those projected by our management, additional inventory reserves or inventory write-downs may be required.
Product Sales and Revenue Recognition
We recognize revenue, including freight charged to customers, when the earnings process is complete. This occurs when products are shipped to or received by the customer in accordance with the terms of the agreement, title and risk of loss have been transferred, collectability is probable and pricing is fixed or determinable. Shipping terms are customarily “FOB shipping point” and do not include right of inspection or acceptance provisions. Equipment sales arrangements may include right of inspection or acceptance provisions, in which case revenue is deferred until these provisions are satisfied.
We also occasionally sell equipment to some of our customers to use with our products. These equipment sales can also be linked with other purchase agreements and could represent multiple element arrangements under ASC Topic 605, “Revenue Recognition” or contain future performance provisions pursuant to SEC Staff Accounting Bulletin 104, “Revenue Recognition”. The process of determining the appropriate revenue recognition in such transactions is highly complex and requires significant judgments and estimates.
Purchase Accounting, Goodwill and Intangible Assets
In connection with the Acquisition, MacDermid, Incorporated incurred significant indebtedness under our Credit Facilities and the Senior Subordinated Notes. The purchase price paid in connection with the Acquisition was allocated to state the acquired assets and assumed liabilities at fair value. The purchase accounting adjustments (1) increased the carrying value of our property, plant and equipment, (2) established intangible assets for our tradenames, customer lists and developed technology and (3) established goodwill related to the difference between the purchase price and the fair value of the assets and liabilities as of the Acquisition date. Subsequent to the Acquisition, interest expense and non-cash depreciation and amortization charges significantly increased. During 2009, we incurred non-cash impairment charges of $68.7 million to reduce the goodwill assets, customer lists, tradename and equipment assets established at the time of the Acquisition. During 2011, we recorded impairment charges of $46.4 million related to a write down of our customer list intangible assets established at the time of the Acquisition.
The Acquisition resulted in us having an entirely new, and significantly different, capital structure. Subsequent to the Acquisition date of April 12, 2007, we recorded purchase adjustments related to our balances of land, buildings, equipment, goodwill and intangible assets. We retained an outside valuation firm to assist management with determining the fair value of certain of our tangible assets and liabilities and our intangible
84
Table of Contents
assets. The outside valuation firm finalized their review of these tangible assets and liabilities and intangible assets in 2007. We have recorded all assets acquired and liabilities assumed at their respective fair value as of April 13, 2007. We completed the accounting for the goodwill allocation in 2008.
The estimated fair values and useful lives of identified intangible assets are based on many factors, including estimates and assumptions of future operating performance and cash flows of the acquired business, estimates of cost avoidance, the nature of the business acquired, the specific characteristics of the identified intangible assets and our historical experience and that of the acquired business. The estimates and assumptions used to determine the fair values and useful lives of identified intangible assets could change due to numerous factors, including product demand, market conditions, regulations affecting the business model of our operations, technological developments, economic conditions and competition. The carrying values and useful lives for amortization of identified intangible assets are reviewed on an ongoing basis, and any resulting changes in estimates could have a material negative impact on our financial results.
Employee Benefits and Pension Obligations
We sponsor a variety of employee benefit programs, some of which are non-contributory. The accounting policies used to account for these plans are as follows:
Retirement—We provide non-contributory defined benefit plans to domestic and certain foreign employees. The projected unit credit actuarial method is used for financial reporting purposes. We recognize the funded status; the difference between the fair value of the plan assets and the projected benefit obligation (pension plans) or the accumulated postretirement benefit obligation (other postretirement plan) in our consolidated balance sheet. Our funding policy for qualified plans is consistent with federal or other local regulations and customarily equals the amount deductible for federal and local income tax purposes. Foreign subsidiaries contribute to other plans, which may be administered privately or by government agencies in accordance with local regulations. We also provide the defined contribution Savings Plan (401(a), (k) and 501(a)) for substantially all domestic employees. We may make discretionary contributions to the Savings Plan, but there were no discretionary contributions made to the Savings Plan during the years ended December 31, 2011, 2010 and 2009.
Post-retirement—We currently accrue for post-retirement health care benefits for U.S. employees hired prior to April 1, 1997. The post-retirement health care plan is unfunded.
Post-employment—MacDermid, Incorporated currently accrues for post-employment disability benefits to United Kingdom employees meeting specified service requirements. The post-employment benefits plan is unfunded.
The actuarial determination of the projected benefit obligations and related benefit expense requires that certain assumptions be made regarding such variables as expected return on plan assets, discount rates, rates of future compensation increases, estimated future employee turnover rates and retirement dates, distribution election rates, mortality rates, retiree utilization rates for health care services and health care cost trend rates. The selection of assumptions requires considerable judgment concerning future events and has a significant impact on the amount of the obligations recorded in the consolidated balance sheets and on the amount of expense included in the consolidated statements of operations.
Jumpstart Our Business Startups Act of 2012
Section 107 of the Jumpstart Our Business Startups Act of 2012 provides that an “emerging growth company” can take advantage of the extended transition period provided in Section 7(a)(2)(B) of the Securities Act for complying with new or revised accounting standards. In other words, an “emerging growth company” can delay the adoption of certain accounting standards until those standards would otherwise apply to private companies. We are electing to delay such adoption of new or revised accounting standards, and as a result, we may choose not to comply with new or revised accounting standards on the relevant dates on which adoption of such standards is required for other public companies. Additionally, we are in the process of evaluating the
85
Table of Contents
benefits of relying on other exemptions and reduced reporting requirements provided by the Jumpstart Our Business Startups Act of 2012.
Recent Accounting Pronouncements and Legislation Changes
In May 2011, the FASB issued ASU No. 2011-04, “Fair Value Measurement” (“ASU No. 2011-04”). ASU No. 2011-04 clarifies the concepts related to highest and best use and valuation premise, blockage factors and other premiums and discounts, the fair value measurement of financial instruments held in a portfolio and of those instruments classified as a component of shareowners’ equity. ASU No. 2011-04 includes enhanced disclosure requirements about recurring Level 3 fair value measurements, the use of nonfinancial assets, and the level in the fair value hierarchy of assets and liabilities not recorded at fair value. This new guidance will be effective prospectively for interim and annual periods beginning on or after December 15, 2011, with early adoption prohibited. We do not expect this new guidance to have a material impact on our consolidated financial position, results of operations or cash flows.
In June 2011, the FASB issued ASU No. 2011-05, “Comprehensive Income” (“ASU No. 2011-05”). ASU No. 2011-05 intends to enhance comparability and transparency of other comprehensive income components. ASU No. 2011-05 provides an option to present total comprehensive income, the components of net income and the components of other comprehensive income in a single continuous statement or two separate but consecutive statements. ASU No. 2011-05 eliminates the option to present other comprehensive income components as part of the statement of changes in shareholders’ equity. This new guidance will be effective retrospectively for interim and annual periods beginning after December 15, 2011, with early adoption permitted. We adopted ASU No. 2011-05 in the fourth quarter of 2011. Since this standard impacts presentation and disclosure requirements only, the adoption of this new guidance did not have a material impact on our consolidated financial position, results of operations or cash flows.
In September 2011, the FASB issued ASU No. 2011-08, “Testing Goodwill for Impairment” (“ASU 2011-08”). ASU 2011-08 allows an entity to first assess qualitative factors to determine whether it is necessary to perform the two-step quantitative goodwill impairment test. Under ASU 2011-08, if a company chooses the qualitative method, an entity would not be required to calculate the fair value of a reporting unit unless the entity determines, based on a qualitative assessment, that it is more likely than not that its fair value is less than its carrying amount. This new guidance will be effective for annual and interim impairment tests performed for fiscal years beginning after December 15, 2011, with early adoption permitted. The adoption of this new guidance did not have a material impact on our consolidated financial position, results of operations or cash flows.
Changes in and Disagreements with Accountants on Accounting and Financial Disclosure
Grant Thornton LLP (“Grant Thornton”) served as MacDermid, Incorporated’s independent registered public accounting firm since April 6, 2006, auditing its financial statements for each fiscal year ending since that time, through and including the fiscal year ended December 31, 2008. Subsequent to the audit of MacDermid, Incorporated’s financial statements for the fiscal year ended December 31, 2008, the board of directors of MacDermid, Incorporated sought competitive proposals for audit services from a group of independent registered public accounting firms. As a result of this process, the board of directors of MacDermid, Incorporated dismissed Grant Thornton as its independent registered public accounting firm on April 21, 2009 and approved the engagement of KPMG LLP (“KPMG”) as the independent registered public accounting firm for MacDermid Holdings, LLC, the parent entity of MacDermid, Incorporated. On October 27, 2009, the board of MacDermid Holdings, LLC engaged KPMG to audit its financial statements for the fiscal year ended December 31, 2009.
For the fiscal year ended December 31, 2007, Grant Thornton issued two reports on the financial statements of MacDermid, Incorporated: the first in respect of the period from January 1, 2007 to the date of the Acquisition and the second in respect of the period from the date of the Acquisition through December 31, 2007. For the fiscal year ended December 31, 2007, neither of Grant Thornton’s reports on MacDermid, Incorporated’s
86
Table of Contents
consolidated financial statements contained an adverse opinion or a disclaimer of opinion, nor was either report qualified or modified as to uncertainty, audit scope or accounting principles.
For the fiscal year ended December 31, 2008, Grant Thornton’s report on MacDermid, Incorporated’s consolidated financial statements also did not contain an adverse opinion or a disclaimer of opinion, nor was it qualified or modified as to uncertainty, audit scope or accounting principles. During the 2008 fiscal year, Grant Thornton identified three material weaknesses in MacDermid, Incorporated’s system of internal control over financial reporting. MacDermid, Incorporated responded to Grant Thornton in writing with respect to the three material weaknesses, and MacDermid, Incorporated authorized Grant Thornton to respond fully to the inquiries of KPMG concerning these material weaknesses. No other reportable events described in Item 304(a)(1)(v) of Regulation S-K occurred during the fiscal years ended December 31, 2008 or December 31, 2007 or from the interim period from December 31, 2008 to the date of Grant Thornton’s dismissal as our independent registered public accounting firm. Additionally, there were no disagreements with Grant Thornton on any matter of accounting principles or practices, financial statement disclosure or auditing scope or procedure, which disagreements, if not resolved to the satisfaction of Grant Thornton, would have caused Grant Thornton to make reference thereto in its report on our financial statements for the fiscal years ended December 31, 2008 or 2007. There were also no such disagreements with Grant Thornton during the period from December 31, 2008 through the date of Grant Thornton’s dismissal as our independent registered public accounting firm. For the fiscal year ended December 31, 2009, KPMG’s report on MacDermid Holdings, LLC’s consolidated financial statements did not contain an adverse opinion or a disclaimer of opinion, nor was it qualified or modified as to uncertainty, audit scope or accounting principles.
MacDermid Group, Inc. provided Grant Thornton with a copy of the foregoing disclosures set forth above and requested that Grant Thornton review such disclosures and furnish a letter addressed to the SEC stating whether or not Grant Thornton agrees with such statements. Grant Thornton’s response letter is attached as an exhibit to the Registration Statement.
During the fiscal years ended December 31, 2008 and 2007 and the period from January 1, 2009 to October 27, 2009, MacDermid Holdings, LLC did not consult KPMG with respect to the application of accounting principles to a specified transaction, either completed or proposed, or the type of audit opinion that might be rendered on our consolidated financial statements, or regarding any other matters or reportable events described under Item 304(a)(2) of Regulation S-K.
Quantitative and Qualitative Disclosures About Market Risk
Foreign Currency Risk
As a multinational company, our transactions are denominated in a variety of currencies. Our business is exposed to foreign currency risk primarily from changes in the exchange rate between the U.S Dollar and the following currencies: the Euro, British Pound Sterling, Hong Kong Dollar, Chinese Yuan, Japanese Yen and Brazilian Real. Historically, we have not utilized foreign currency hedges to mitigate exchange rate changes between the U.S. Dollar and the foreign currencies of our operations. Generally, each of our operations utilizes the local currency of the operation as its functional currency—the currency in which it incurs operating expenses and collects accounts receivable. However, approximately 25% of the net sales of our Autotype foreign subsidiary, which is based in the United Kingdom and utilizes the British Pound Sterling as its functional currency, are denominated in U.S. Dollars. For that reason, we utilize foreign currency hedges between the British Pound Sterling and the U.S. Dollar to help mitigate the risk of a stronger British Pound Sterling for our Autotype foreign subsidiary. Accordingly, the British Pound Sterling is the only currency with respect to which we currently utilize foreign currency hedges to manage currency risks resulting from transactions in currencies other than the functional currency of our subsidiaries. Our policy prohibits us from speculating in financial instruments for profit on exchange rate price fluctuations, from trading in currencies for which there are no underlying exposures, and from entering into trades for any currency to intentionally increase the underlying exposure.
87
Table of Contents
A significant variation of the value of the U.S. Dollar against the principal currencies that have a material impact on us could result in a negative impact on our net income (loss) in the case of an appreciation of the U.S. Dollar, or a positive impact on our net income (loss) if the U.S. Dollar depreciates relative to these currencies. Currency exchange rate fluctuations affect our results of operations because our reporting currency is the U.S. Dollar, while the majority of our sales are received in currencies other than the U.S. Dollar. We incur a significant portion of our costs in currencies other than the U.S. Dollar. Certain significant costs incurred by us, such as manufacturing labor costs, research and development expenses and selling, technical and administrative expenses are incurred in the currencies of the jurisdictions in which our operations are located.
We conduct a significant portion of our business in currencies other than the U.S. Dollar, the currency in which our consolidated financial statements are reported. Correspondingly, our operating results could be affected by foreign currency exchange rate volatility relative to the U.S. Dollar. To hedge against the risk of a stronger British Pound Sterling with respect to our Autotype foreign subsidiary, in 2012, 2011, 2010 and 2009, we contracted with a financial institution to deliver U.S. Dollars at a fixed British Pound Sterling rate and to receive British Pound Sterling in exchange for the U.S. Dollar. We did not pay up-front premiums to obtain the hedge.
While we have implemented certain strategies to mitigate risks related to the impact of fluctuations in currency exchange rates, we cannot assure you that we will not recognize gains or losses from international transactions, as this is part of transacting business in an international environment. Not every exposure is or can be hedged and, where hedges are put in place based on expected foreign exchange exposure, they are based on forecasts for which actual results may differ from the original estimate. Failure to successfully hedge or anticipate currency risks properly could adversely affect impact or benefit our operating results.
As of March 31, 2012, the aggregate U.S. Dollar notional amount of foreign currency forward contracts, designated as hedges, was $14.0 million. During the years ended December 31, 2011, 2010 and 2009, unrealized gains and (losses) of $(0.4) million net of tax, $0.2 million net of tax and $0.3 million net of tax, respectively, were recorded to other comprehensive income (loss) (“OCI”) related to foreign currency hedges. During the years ended December 31, 2011, 2010 and 2009, the company recorded realized gains/(losses) of $0.6 million, $(1.3) million and $1.4 million, respectively, in other income/(expense) related to the settlement of hedged foreign exchange contracts. During the three months ended March 31, 2012 and 2011, $0.4 million and $0.2 million, respectively, were recorded as unrealized gains/(losses) to OCI related to foreign currency hedges. During the three months ended March 31, 2012 and 2011, the company recorded realized gains (losses) of $0 and $0.3 million, respectively, in other income (expense) related to the settlement of hedged foreign exchange contracts. The fair value of the foreign currency forward contract at March 31, 2012, was a $0.1 million short term asset.
The following table summarizes derivative instrument amounts as of March 31, 2012, by currency and the portion of the asset that settles within the next twelve months related to foreign currency derivatives.
| Local Currency Amount |
U.S. Dollar Amount |
Percentage Settled Within One Year |
Dates Contracts are Through |
|||||||||||||
| Derivative Assets (amounts in thousands) |
||||||||||||||||
| British Pound Sterling |
£3,105 | $ | 5,000 | 100 | % | June 29, 2012 | ||||||||||
| British Pound Sterling |
£3,148 | $ | 5,000 | 100 | % | September 27, 2012 | ||||||||||
| British Pound Sterling |
£2,572 | $ | 4,000 | 100 | % | December 19, 2012 | ||||||||||
|
|
|
|||||||||||||||
| $ | 14,000 | |||||||||||||||
|
|
|
|||||||||||||||
Foreign exchange financial instruments that are subject to the effects of currency fluctuations, which may affect reported earnings, include financial instruments which are not denominated in the functional currency of the legal entity holding the instrument. Derivative financial instruments consist primarily of forward contracts. Other financial instruments, which are not denominated in the functional currency of the legal entity holding the instrument, consist primarily of cash and cash equivalents, accounts payable and accounts receivable. The fair value
88
Table of Contents
of the foreign exchange financial instruments would hypothetically decrease by approximately $1.4 million as of March 31, 2012, if the U.S. Dollar were to appreciate against the British Pound Sterling by 10% of the exchange rate as of March 31, 2012. This hypothetical amount is suggestive of the effect on future cash flows under the following conditions: (1) all current payables and receivables that are hedged were not realized, (2) all hedged commitments and anticipated transactions were not realized or canceled and (3) hedges of these amounts were not canceled or offset. We do not expect that any of these conditions will be realized. We expect that gains and losses on the derivative financial instruments should offset losses and gains on the assets, liabilities and future transactions being hedged. If the hedged instruments were included in the sensitivity analysis, the hypothetical change in fair value would be immaterial. The foreign exchange financial instruments are held for purposes other than trading.
Instruments used as cash flow hedges must be effective at reducing the risk associated with the exposure being hedged and must be designated as a cash flow hedge at the inception of the contract. Accordingly, changes in the fair values of such hedge instruments must be highly correlated with changes in the fair values of underlying hedged items both at inception of the hedge and over the life of the hedge contract.
Interest Rate Risk
Our financial instruments include cash and cash equivalents, accounts receivable, accounts payable, accrued liabilities, notes payable, long-term debt, and other financing commitments.
At March 31, 2012, we had cash and cash equivalents of $109.3 million. Included in this amount is $72.0 million of cash included in money market accounts which pays us interest income. A 100 basis point increase in the interest rate we earn on our money market accounts would have an approximate $0.7 million positive impact on our interest income.
At March 31, 2012, we had total debt of $730.4 million including $371.3 million of variable interest rate debt based on either 1-month LIBOR or 1-month EURIBOR. As of March 31, 2012, we have effectively fixed our interest rate on $100.0 million of our Tranche B Facility debt variable rate debt through June 30, 2012 through the use of an interest rate collar. The fair value of the interest rate collar, excluding accrued interest, at March 31, 2012, was a $1.2 million current liability. Our remaining variable interest rate debt is subject to interest rate risk, because our interest payments will fluctuate as the underlying interest rates change from market changes. A 100 basis point increase in LIBOR and EURIBOR rates would result in a higher interest expense of approximately $4.0 million annually. A 100 basis point increase in the 1-month LIBOR rates would result in lower interest expense on our interest rate collar of approximately $1.0 million annually.
The fair value of our Tranche B Facility, Tranche C Facility and Senior Subordinated Notes was $732.9 million at March 31, 2012, which was determined based upon quoted market prices. Since considerable judgment is required in interpreting market information, the fair value of the long-term debt is not necessarily indicative of the amount which could be realized in a current market exchange.
The carrying value of our Japanese senior secured bank debt of $8.0 million at March 31, 2012, approximates fair value.
The fair values of the other financial instruments were not materially different from their carrying or contract values at March 31, 2012.
Counterparty Risk
Outstanding financial derivative instruments expose us to credit loss in the event of nonperformance by the counterparties to the agreements. The credit exposure related to these financial instruments is represented by the fair value of contracts with an obligation fair value as of March 31, 2012. On a periodic basis, we review the credit ratings of our counterparties and adjust our exposure as deemed appropriate. As of March 31, 2012, we believe that our exposure to counterparty risk is immaterial.
89
Table of Contents
Our Company
We are a global producer of high technology specialty chemical products and provider of technical services with a proven track record of success and innovation spanning our 90-year history. Our business involves the manufacture of a broad range of specialty chemicals, which we create by blending raw materials, and the incorporation of these chemicals into multi-step technological processes. These specialty chemicals and processes together encompass the products we sell to our customers in the electronics, metal and plastic plating, graphic arts, and offshore oil production and drilling industries. We refer to our products as “dynamic chemistries” due to their delicate chemical compositions, which are frequently altered during customer use. Our dynamic chemistries are used in a wide variety of attractive niche markets, and based on 2011 net sales, we believe that the majority of our operations hold leading positions in the product markets they serve, including, with respect to Electronic Solutions and Industrial Solutions, the number one or number two market share positions in the product markets they serve.
We generate revenue through the manufacture and sale of our dynamic chemistries and by providing highly technical post-sale service to our customers through our extensive global network of specially trained service personnel. Our personnel work closely with our customers to ensure that the chemical composition and function of our dynamic chemistries are maintained as intended. As an example, a customer will engage us to manufacture and sell a product consisting of a process composed of eight successive chemical baths, each of which is made up of our specialty chemicals, in order to enhance the overall performance of that customer’s circuit boards. Not only would we provide such product, but a member of our professional service team would also visit the customer’s manufacturing facilities on a regular basis post-sale to ensure that the process sold maintains the correct chemical balance and can be used effectively in the manner and for the purpose desired.
As of December 31, 2011, we served more than 3,500 customers through our direct sales force in 24 countries and through our several distribution partners in an additional ten countries. While our dynamic chemistries typically represent only a small portion of our customers’ costs, they are critical to our customers’ manufacturing processes and overall product performance. Further, significant operational risks and switching costs make it difficult for our customers to change suppliers and allow us to retain customers and maintain our leading market positions. For the 12 months ended December 31, 2011, we generated net sales, operating profit, net income attributable to MacDermid, Incorporated and Adjusted EBITDA of $728.8 million, $55.9 million, $1.0 million and $151.7 million, respectively, and for the three months ended March 31, 2012, we generated net sales, operating profit, net income attributable to MacDermid, Incorporated and Adjusted EBITDA of $182.2 million, $27.1 million, $4.9 million and $38.5 million, respectively. For a reconciliation of net income (loss) attributable to MacDermid, Incorporated to Adjusted EBITDA, see “Prospectus Summary—Summary Consolidated Financial Data” and the footnotes contained therein.
We dedicate extensive resources to research and development and highly technical, post-sale customer service, while limiting our investments in fixed assets and capital expenditures. We refer to this approach as our “asset-lite, high-touch” business model, which emphasizes the “bookends” of our operations—innovation and technical service. We believe that this model enables us to focus on high growth market opportunities, maintain high margins and a high return on invested capital, and generate stable and strong cash flows. Given that our annual capital expenditures have been consistently less than 2% of our annual net sales, we believe that our cash conversion rate (the proportion of our profits converted into cash flow) is higher than a majority of the companies in our sector.
Due to our focus on offering highly specialized customer service and our customers’ reliance on such service, our personnel often become closely acquainted with our customers. We are able to utilize these strong customer relationships to identify new product opportunities and platform-level solutions, which we can further develop by drawing upon our significant intellectual property portfolio that includes over 750 issued patents and
90
Table of Contents
extensive technical expertise. We believe that our ability to draw upon our customer relationships and leverage our intellectual property and technical service offerings across product lines and target markets enables us to successfully position our portfolio of products within the ever-changing business environment.
Our businesses are currently benefiting from global growth trends in many of our end markets, including the increasing use of electronic devices such as mobile phones and computers, growth in worldwide automotive production and increasing oil production from offshore, sub-sea wells. In addition, over the last several years, we have increased our focus on growth in emerging markets. In 2011, approximately 37% of our net sales, approximately 37% of our gross profit and approximately 41% of our Adjusted EBITDA was generated in Asia (predominately in the greater China region) and Brazil as compared with approximately 36% of our net sales, approximately 36% of our gross profit and approximately 45% of our Adjusted EBITDA in 2008 in the same regions. In addition to the global growth trends and expansion into emerging markets, we also believe that we are effectively expanding the existing market for our dynamic chemistries by developing new applications within the electronics, general industrial and automotive, graphic arts and offshore oil production and drilling markets. These new applications include: surface coatings for solar panels, plated antennas for smart mobile devices, flexographic plates for printing consumer packaging materials, decorative components for automobile interiors and control system fluids used to prevent oil from seeping from ocean floor valves.
We have developed long-term customer relationships with, as of December 31, 2011, more than 3,500 customers worldwide. Among these customers are some of the world’s preeminent companies, such as LG, Molex, Samsung, FIAT, Ford, GM, Stanley Black & Decker and major companies in the offshore oil and gas industries. We believe that our customers place significant value on the “MacDermid” brand, which has been developed through innovation, product leadership and customer service spanning our 90-year history. We believe that we are able to service these customers and attract new customers successfully through our extensive global network of 14 manufacturing sites and 21 technical service facilities, including 8 research and development centers, in 24 countries. In order to ensure that we are able to continue to provide innovative products and highly technical service to our customers, we place a premium on maintaining a highly specialized and qualified employee base. As of March 31, 2012, approximately 1,000 of the approximately 2,100 people we employed were research and development chemists and experienced technical sales and service personnel.
Our History
MacDermid Group, Inc. was incorporated in Delaware on June 17, 2011. Prior to the completion of this offering, MacDermid Group, Inc. is a direct, wholly owned subsidiary of MacDermid Holdings, LLC and has no material assets. Following the completion of this offering, MacDermid Group, Inc. will be a holding company with no material assets other than its direct 100% ownership interest in MacDermid, Incorporated. MacDermid, Incorporated is, and will, following this offering, continue to be, the main U.S. operating entity for the MacDermid business and the direct or indirect parent entity of all the MacDermid operating companies. Please refer to “The Corporate Reorganization” for a more complete discussion of the corporate structure of the MacDermid entities.
MacDermid, Incorporated was established in Waterbury, Connecticut in 1922. On May 9, 1966, shares of MacDermid, Incorporated common stock were registered for trading. From June 22, 1966 to February 8, 1971, the shares traded on the over-the-counter system of trading and from February 8, 1971, when the NASDAQ stock exchange began trading, to February 25, 1998, the shares traded on the NASDAQ stock exchange. From February 26, 1998 to April 12, 2007, shares of MacDermid, Incorporated traded on the NYSE under the symbol “MRD”. On April 12, 2007, MacDermid, Incorporated was acquired by MDI Holdings, LLC, an entity formed by Court Square, Weston Presidio and Daniel H. Leever. The purpose of the acquisition was to allow Court Square, Weston Presidio and Daniel H. Leever to own a majority of MacDermid, Incorporated, to bear the risks and rewards of such ownership and to afford the company greater operating flexibility as a private entity. In connection with the acquisition, the common stock of MacDermid, Incorporated ceased to be listed on the NYSE.
91
Table of Contents
The future cash flow of MacDermid Group, Inc. will derive from, and depend on, dividends, distributions and other transfers from MacDermid, Incorporated that are generated from the operation of the MacDermid business. In light of the fact that no material change in the operation of the MacDermid business is currently contemplated, we believe that our anticipated future revenue and our cash and cash equivalents will be sufficient to meet our anticipated cash requirements through the end of fiscal year 2012. We believe that it will not be necessary to raise additional funds during the six-month period beginning on the date of this prospectus to meet the expenditures required to operate our business, including expenditures for (1) material product research and development, (2) material acquisitions of plant and equipment and the capacity thereof, (3) material changes in the number of employees in our various departments and (4) other material areas specific to our business.
Our Businesses
We report our business in two operating segments: an Industrial segment and a Printing segment. In the fiscal year ended December 31, 2011, our Industrial and Printing segments generated net sales of $568.6 million and $160.2 million, respectively. For the three months ended March 31, 2012, our Industrial and Printing segments generated net sales of $140.5 million and $41.7 million, respectively.
Industrial—The Industrial segment supplies technological solutions and dynamic chemistries used for finishing metals and non-metallic surfaces for automotive and other industrial applications, electro-plating metal surfaces, manufacturing circuit boards and other electronic devices for the electronics industry, and fluids for the offshore oil and gas markets and specialty coated industrial films. As the regional sales mix in this segment has shifted over the past several years from more industrialized nations towards emerging markets, such as Asia and South America, we have invested significantly in these regions, including developing state-of-the-art facilities in Suzhou, China, and São Paulo, Brazil, to better serve our customers there. We have over 600 personnel and three manufacturing facilities in Asia and remain focused on further increasing our presence in the region.
The Industrial segment is composed of the following three businesses, which share manufacturing facilities and administrative resources:
Electronic Solutions. We believe we are one of the leading global suppliers of chemical compounds to the printed circuit board fabrication industry based on our 2011 net sales. In this business, we design and formulate a complete line of proprietary “wet” dynamic chemistries that our customers use to process the surface of the printed circuit boards and other electronic components they manufacture. Our product portfolio in this business is focused on niches such as final finishes, through hole metallization and circuit formation, in which we are a small cost to the overall finished product, but a critical component for maintaining the products’ performance. Growth in this business is driven by demand in telecommunication, wireless devices and computers, and the increasing use of electronics in automobiles. Our customer base includes customers in the following end markets: computers, telecommunications, wireless devices, audio visual, automotive and office equipment.
Industrial Solutions. We believe that we have a leading position worldwide in industrial metal and plastic finishing chemistries based on 2011 net sales. In this business, our dynamic chemistries are used for finishing, cleaning and providing surface coatings for a broad range of metal and non-metal surfaces. These coatings may have functional uses, such as improving wear and tear or providing corrosion resistance for appliance parts, or decorative uses, such as providing gloss finishes to components used in automotive interiors. As of December 31, 2011, we manufactured more than 1,000 chemical compounds for these surface coating applications, including cleaning, activating, polishing, electro and electroless plating, phosphatizing, stripping and coating, anti-tarnishing and rust inhibiting for metal and plastic surfaces. Electroless plating is a method of plating metals onto a variety of base materials using chemical reduction without the application of electrical power. Electro plating, in contrast, involves plating metals with the use of an electrical current. Phosphatizing is the application of phosphates, such as iron and zinc, to prevent corrosion of steel surfaces. Our customer base is highly fragmented and includes customers in the following end markets: automotive parts, industrial parts, transportation equipment, electronics equipment and appliances and plumbing goods. Growth in this business is primarily driven by increased world-wide automobile production and demand for appliances, computers and general engineering hardware.
92
Table of Contents
Offshore Solutions. We produce water-based hydraulic control fluids for major oil companies and drilling contractors for offshore deep water production and drilling applications. Production fluids are used in the control systems that open and close critical valves for the deep water oil extraction and transportation process. Drilling fluids are used in control systems to operate valves on the ocean floor. We believe there is significant growth potential for this business as the oil and gas industry continues to grow, as evidenced by the $66.5 billion of capital that is forecasted to be spent globally by deep oil and gas producers from 2011 through 2016, a 109% increase over the prior five-year period, and as oil is produced from new sub-sea wells.
Printing—The Printing segment supplies an extensive line of flexographic plates that are used in the commercial packaging and commercial printing industries. We manufacture photopolymers used to produce printing plates for transferring images onto commercial packaging, including packaging for consumer food products, pet food bags, corrugated boxes, labels and beverage containers. In addition, we also produce photopolymer printing plates for the flexographic and letterpress newspaper and publications markets. Our products are used to improve print quality and printing productivity. Flexography is a printing process that utilizes flexible printing plates made of rubber or other flexible plastics. Photopolymers are molecules that change properties upon exposure to light. Over the last three years, we have shifted our business mix to refocus this segment on high innovation, higher cash flow businesses by divesting two capital intensive, lower growth businesses. The growth in this segment is driven by consumer demand and advertising.
Both of our operating segments are dependent upon foreign operations. There are certain risks attendant to our foreign operations, including the following:
| • | enforcing agreements and our intellectual property rights may be more difficult in foreign jurisdictions; |
| • | the imposition of taxes, tariffs and other restrictions on foreign trade or investment could impact our ability to operate or make operations more expensive; |
| • | delays and interruptions inherent in foreign travel may impact the transportation of our products; |
| • | fluctuations in exchange rates may affect product demand and may adversely affect the profitability in U.S. Dollars of our foreign operations; |
| • | general economic conditions in the foreign countries in which we operate may impact the profitability of our foreign operations; |
| • | political or economic instability on a country-specific or global level may impact our ability to operate; |
| • | we may encounter difficulties in staffing and managing multi-national operations, including the possibility of labor disputes; |
| • | we may be subject to possible adverse changes in foreign laws or regulatory requirements and may experience difficulties in complying with the variety of foreign laws and regulations; and |
| • | we may be subject to the risks of divergent business expectations resulting from cultural incompatibility. |
For more information regarding the risks attendant to our foreign operations, see “Risk Factors—Risks Related to Our Business and Industry—Our substantial international operations subject us to risks not faced by domestic competitors, including unfavorable political, regulatory, labor, tax and economic conditions in other countries that could adversely affect our business, financial condition and results of operations.”
For financial information about our segments, see Note 21 to our audited financial statements for the years ended December 31, 2011, 2010 and 2009 and Note 16 to our unaudited financial statements for the three months ended March 31, 2012 and 2011 included in this prospectus. For financial information about the geographic areas in which we operate, see Note 21 to our audited financial statements for the years ended December 31, 2011, 2010 and 2009 included in this prospectus.
93
Table of Contents
Our Competitive Strengths
We believe that the following are our key competitive strengths:
Leading Market Position in Attractive Niche Markets. We believe, based on our 2011 net sales, that a majority of our operations hold leading positions in the product markets they serve, including the number one or number two market share positions held by Electronic and Industrial Solutions in the product markets they serve. We believe that the combination of our global presence, history of innovation, process know-how, strong commitment to research and development, dedication to customer service and broad range of proprietary products distinguishes us from our competitors, allowing us to maintain our leading market share positions Furthermore, we believe the diversity of the niche markets we serve will enable us to continue our growth throughout economic cycles and mitigate the impact of a downturn in any single market.
Proprietary Technology and Service Oriented Business Model. Our commitment to technological innovation and our extensive intellectual property portfolio of over 750 issued patents enables us to develop our cutting-edge products. In order to continue to provide innovative products and highly technical service to our customers, we place a premium on maintaining a specialized and qualified employee base. Our global sales and service personnel possess extensive knowledge of and experience in our local markets. For instance, our technical management team serving our Asian markets has, on average, over 20 years of experience, including decades of joint product development with our key customers located in the greater China region. We believe that our proprietary technology, extensive industry experience and customer service-focused business model are difficult for our competitors to replicate. As a result, and in order to avoid the transition risks that go along with switching suppliers, customers elect not to switch from our products to those of our competitors. Switching suppliers generally does not make sense for our customers from a cost-benefit standpoint: the cost of our products is low relative to the potential cost savings, as switching expenses (including conducting expensive trials to ensure quality assurance and compliance with regulatory requirements, industry standards and internal protocols) can be significant.
The key role our products play in improving the efficacy of our customers’ manufacturing processes and reducing their total costs, combined with our extensive experience in local markets, our focus on highly technical customer service and the significant customer switching risks and costs inherent in our industry, have enabled us to establish and maintain our long-term customer relationships. We leverage these close relationships to identify opportunities for new products and position our portfolio of products within the ever-changing business environment.
Track Record of Targeted Growth. We have a demonstrated history of achieving targeted growth by expanding into new, fast-growing geographic markets, generating growth in our higher margin businesses and enhancing our product offerings by drawing on our core competencies to extend our existing technologies into adjacent markets. We believe that the experience and knowledge gained through our history of innovation and track record of successfully entering new markets enables us to identify and capitalize on future growth opportunities.
| • | We have, for example, grown our presence in emerging markets (specifically Asia (predominately in the greater China region) and Brazil), as demonstrated by the increase in net sales in these markets to 37% of total net sales in 2011 as compared to 36% of total net sales in 2009. We have updated facilities and increased headcount to expand our operations in the greater China region, which is now home to three state-of-the-art facilities and 600 employees. We are focused on continuing to increase our presence in emerging markets. |
| • | We generated 78% of our 2011 net sales from our higher growth, higher margin Industrial segment, compared to 61% of our net sales in 2005. |
| • | We have significantly expanded our Offshore Solutions business over the last six years, representing a 2005-2011 net sales compound annual growth rate of over 12%. |
Strong Free Cash Flow Generation. Our high gross profit margins, combined with the low capital expenditure requirements and low fixed cost structure that result from our “asset-lite, high-touch” business model, allow us to
94
Table of Contents
generate strong free cash flow through all economic cycles. Our fixed asset base is modern and well-maintained and, accordingly, requires low, and often discretionary, capital expenditures. Our fixed manufacturing costs during 2011 were approximately 11% of our 2011 net sales, and our maintenance capital expenditures during 2011 were approximately 0.6% of our 2011 net sales. Our business model has allowed us to generate free cash flow even during economic downturns, including the global economic downturn that began in 2008. For example, in the year ended December 31, 2009, we generated $49.0 million in net cash flows provided by operating activities, and we used $6.5 million for capital expenditures and received $2.6 million of proceeds from the disposition of fixed assets.
Our key proprietary technology, service oriented business model and the high costs our customers must incur in order to switch suppliers have allowed us to achieve stable, industry-leading margins throughout our history and have protected our market share. The following chart highlights the stability of our margins since 1995:
Stable Financial Performance Through Economic Cycles
| (1) | Gross profit is defined as net sales minus cost of sales. The percentages represent gross profit margin, which is defined as gross profit divided by net sales. Gross profit for years 1995 to 2000 is for fiscal years ending March 31. |
| (2) | Gross profit margins are net of discontinued operations. |
Customer, Product, Application, End-Market and Geographic Diversity. We offer a broad range of products and services to diverse end markets, ranging from electronics to printing to offshore oil drilling. As of December 31, 2011, we served more than 3,500 customers globally, with no single customer accounting for more than 3% of our 2011 net sales. We have a significant presence in the rapidly growing Asian and Brazilian markets, with over $268 million in 2011 net sales to customers in those regions. In addition, each of our product lines serves numerous and often unrelated end markets. Our customer, product and geographic diversity help to mitigate the effects of any adverse event affecting a specific industry, end market or region.
95
Table of Contents
Limited Raw Material Concentration and Low Exposure to Energy Prices. We use in excess of 1,000 chemicals as raw materials in the manufacture of our proprietary products, with no single raw material representing more than 3% of our cost of sales in 2011. Further, the raw materials that are of greatest importance to our global operations are, in most cases, obtainable from multiple sources worldwide. In addition, energy costs, which have historically been volatile, only represented approximately 2% of our cost of sales in 2011.
Experienced Management Team with Significant Equity Investment. Our senior management team is led by Daniel H. Leever, our chairman and chief executive officer, who has approximately 31 years of experience with the MacDermid business and has been our chief executive officer since 1990. Our senior management team comprised of our executive officers and our divisional business managers has, on average, 29 years of industry experience and 18 years of experience with our company. Our management has been responsible for successfully implementing a number of strategic initiatives designed to enhance growth, improve productivity, reduce costs and expand margins. We believe that our employee ownership, stemming from our history as an employee-owned company including through our Savings Plan, and use of a variable compensation structure has allowed us to maintain throughout our history an “owner mentality” among our workforce that has proven instrumental to our success.
Our Business Strategy
Our business strategy is focused on maximizing cash flow through our “asset-lite, high-touch” business model with continued emphasis on the “bookends” of our operations—innovation and technical service. Building on our competitive strengths, we intend to continue to grow our business, improve profitability and strengthen our balance sheet by pursuing the following integrated strategies:
Build Our Core Businesses. We believe that we can capitalize on our technical capabilities, sophisticated process know-how, strong customer relationships and deep industry knowledge to enhance growth and generate significant free cash flow.
| • | Extend Product Breadth: We intend to extend many of our product offerings through the development of new applications for our existing products in our existing markets. For example, we are extending our capabilities for films used in in-mold decoration for high-end automotive interiors to exteriors and other applications. We are also leveraging our capabilities in plating technology in printed circuits and automotive applications to meet the emerging technological and environmental needs of our customers. |
| • | Continue to Grow Internationally with Our Customers: We intend to continue to grow internationally by expanding our product sales to our existing multinational customers as they penetrate emerging regions. We continue to make investments, especially in technical staff, in high-growth markets such as the greater China region and Brazil in order to better service our customers. |
Leverage our Capabilities to Grow into New Markets and Applications. Building on our core competencies in product innovation, applications development and technical services, we intend to expand into new high-growth markets and expand upon our existing technologies to develop new products for new applications in markets that are adjacent to those we currently serve. Examples of our initiatives include:
| • | Plating for Solar Cell Metallization: Metallization is the process of coating metal on the surface of non-metallic objects. We are developing a chemistry solution using light-induced, electroless silver technology (which is a method of plating silver onto base materials using chemical reduction without the application of electrical power) to enhance the conductivity and reduce the usage of screened silver paste, which is a silver paste applied by printing the paste through a screen, on solar cells that will result in a higher manufacturing yield from such solar cells at a lower cost to our customers. In the longer term, we believe that we can extend our technology to create a new way of manufacturing crystalline silicon solar cells, or solar cells made from the chemical element silicon in the form of a crystal, and eliminate the need for silver paste. |
96
Table of Contents
| • | Plating for Molded Interconnect Devices: Molded interconnect devices are devices made with injection-molded parts that integrate mechanical and electrical functions into a single piece. We are extending our “plating on plastics” technology into antenna manufacturing for smartphones. We believe that our technology results in a higher manufacturing yield and lower cost to our customers. We believe that we increased our market share in this product in 2011. |
| • | Light-Emitting Diode (“LED”) Lighting Market: We are developing products for thermal management systems and using silver as a wire-bondable and reflective finish option to enhance energy conversion into light. |
| • | High Value PET Recycling: As worldwide demand for recycled polyethylene terephthalate (“PET”) grows, we are leveraging our strong position in Europe for specialized cleaners and defoamers that are used in recycling plastic products made of PET to expand that business globally, especially in emerging markets such as the greater China region and South America. Our specialized cleaners and defoamers enable recycled PET to be used in higher value applications such as bottle resin. |
| • | Digital Flexographic Printing: We have developed an innovative LUX® process, which uses a flat top dot processing technology that significantly increases the quality and consistency of the printed image from a flexographic printing plate in a manner that is more efficient and cost effective for our customers. The LUX® process is a proprietary process we developed that changes the form of the dots on printing plates and enables printing with higher definition and fidelity. |
| • | Metals: We believe the metals industry presents an opportunity to introduce new products, and extend existing products, in an adjacent market. We define the metals industry as flat-rolled steel producers and processors, aluminum producers (including can making), and tube and pipe extruding. Extrusion is the process of shaping materials through use of a die. We have been successful at penetrating the steel market with our tin plating chemistries, including cleaners and passivates. Passivates are surface coatings used to make metals less reactive. We have hired specialists in rolling lubricants and metal pre-treatment with the expectation of rapid expansion of our business in this market. We believe the addressable market for metals is over $750 million. |
Maintain Our Technology Leadership Position. Our continued success in product innovation and applications development is a result of our focused commitment to technology research and development. This commitment has historically allowed us to sustain and enhance the growth and profitability of our businesses and further penetrate our target markets, including our existing customer base. Because the highly technical service we provide to our customers is an integral part of their successful use of our products, our service personnel become closely acquainted, and develop deep relationships, with our customers. These close customer relationships enable us to identify and forecast the needs of our customers and draw upon our intellectual property portfolio and expertise in technology research and development to create new products and successfully position our portfolio of products within the ever-changing business environment.
Continue to Pursue Operational Efficiencies. We consistently focus on opportunities to reduce operating expenses through facility optimization, product and raw material rationalization and by maintaining a relatively low fixed cost structure that supports our growth strategy. In 2009, during the economic crisis, we permanently reduced costs by over $40 million annually by closing certain manufacturing facilities and executing a series of operational restructuring initiatives that streamlined our organizational structure and reduced our workforce in our manufacturing and general and administrative functions. These cost reductions resulted in an increase in our Adjusted EBITDA margin for 2011 by over 48.1% compared to 2009. Net income attributable to MacDermid, Incorporated was $1.0 million in 2011 compared to a net loss attributable to MacDermid, Incorporated of $82.8 million in 2009. For a reconciliation of net income (loss) attributable to MacDermid, Incorporated to Adjusted EBITDA, see “Prospectus Summary—Summary Consolidated Financial Data” and the footnotes contained therein. Our operational restructuring initiatives were primarily responsible for an increase in our gross profit margin percentage from 43.8% for the year ended December 31, 2009 to 46.7% for the year ended December 31, 2011, representing a 6.6% increase.
97
Table of Contents
Maximize Cash Flow. Our ability to maintain strong cash flows results from our business model and growth strategies. Historically, we have been able to generate significant cash flow as a result of the low capital expenditure requirements and low fixed cost structure that result from our “asset-lite, high-touch” business model and by focusing on growing our higher margin businesses. We intend to continue to focus on maximizing our cash flow because it enables us to further invest in our business, reduce our debt and provide value to our stockholders.
Focus on Human Capital. The success of our business depends on our ability to continue to capitalize on our technical capabilities, unique process know-how, strong customer relationships and industry knowledge. Our technical expertise and history of innovation reflect the specialized and highly skilled nature of our research and development personnel. Our strong customer relationships and familiarity with our local markets result from the work of our highly talented and experienced sales and service personnel. As such, we intend to continue to focus on attracting, retaining and developing the best human talent across all levels of our organization, which is key to our ability to successfully operate and grow our business.
Our Products
We review our portfolio of products quarterly to identify and replace low margin products with high margin product offerings. Accordingly, our product mix frequently changes depending upon customer demand and the cost and selling prices related to any given product. As of March 31, 2012, the following products were among those offered to our customers in our Electronic Solutions business:
| • | Plating products, which are used to plate holes drilled through printed circuit boards to connect opposite sides of the board and to connect the different layers of multi-layer printed circuit boards; |
| • | Final finishes, which are used on printed circuit boards to preserve the solderability of the finished boards; |
| • | Circuit formation products, which are an assortment of products to promote adhesion and form circuit patterns; and |
| • | Oxides, which are conversion coatings used in the fabrication of multilayer circuit boards. |
As of March 31, 2012, the following products were among those offered to our customers in our Industrial Solutions business:
| • | Pre-treatment and cleaning solutions, which are applied to prepare the surfaces of a wide variety of industrial products for additional treatment. We have developed a complete line of aqueous and semi-aqueous pre-treatment and cleaning products, which are more environmentally friendly than the solvents they replace; |
| • | Functional conversion coatings, which are applied to metals to enhance corrosion resistance and paint adhesion in a wide spectrum of industrial applications where heavy duty usage and exposure to unfavorable environments are anticipated. Our products plate various parts that are used in automotive and aerospace equipment, appliances, computer hard disks and other electronic products; |
| • | Electroless nickel, which is applied to a variety of metal and plastic surfaces to enhance corrosion resistance, wear resistance, solderability and to repair worn or over-machined surfaces in a variety of applications. We were among the earliest developers of electroless nickel products, which are safer and more environmentally friendly than the products they replace; |
| • | Decorative plating products, which can be used on all surface conditions to provide mirror-like finishes on steel, alloys or plastic in a more environmentally friendly manner. We offer an extensive range of quality decorative plating processes used in the plating of appliances, plumbing goods and automotive trim; and |
| • | Hard-coated films for the membrane switch and touch screen markets. |
98
Table of Contents
As of March 31, 2012, the following products were offered to our customers in our Offshore Solutions business:
| • | Production fluids, which are water-based hydraulic control fluids used in subsea production control systems to operate valves for the deep water oil extraction and transportation process; and |
| • | Drilling fluids, which are water-based hydraulic control fluids used in subsea control systems to operate valves for drilling rigs on the ocean floor. |
As of March 31, 2012, the following products were among those offered to our customers in our Printing business:
| • | Solid sheet printing elements, which are digital and analog printing sheets used in the flexographic printing and platemaking processes. Our extensive line of flexographic plates are used in the commercial packaging and letterpress newspaper and publication industries; |
| • | Liquid products, which are liquid photopolymers used to produce printing plates for transferring images onto commercial packaging; and |
| • | Printing equipment, which are thermal plate processing systems that allow press-ready printing plates to be created without solvents. |
The following table sets forth the types of products we offer and the respective percentage of total consolidated revenue for fiscal years 2011, 2010 and 2009 and for the three months ended March 31, 2012 and 2011:
| Types of Products |
Fiscal Year 2011 | Fiscal Year 2010 | Fiscal Year 2009 | Three Months Ended March 31, 2012 |
Three Months Ended March 31, 2011 |
|||||||||||||||||||||||||||||||||||
| (in thousands, except percentages) |
||||||||||||||||||||||||||||||||||||||||
| Proprietary products |
$ | 684,293 | 93.9 | % | $ | 641,233 | 92.4 | % | $ | 549,880 | 92.5 | % | $ | 170,765 | 93.7 | % | $ | 167,571 | 93.9 | % | ||||||||||||||||||||
| Resale, Equipment, and other |
44,480 | 6.1 | % | 53,100 | 7.6 | % | 44,273 | 7.5 | % | 11,430 | 6.3 | % | 10,950 | 6.1 | % | |||||||||||||||||||||||||
|
|
|
|
|
|
|
|
|
|
|
|||||||||||||||||||||||||||||||
| Total net sales |
$ | 728,773 | 100.0 | % | $ | 694,333 | 100.0 | % | $ | 594,153 | 100.0 | % | $ | 182,195 | 100.0 | % | $ | 178,521 | 100.0 | % | ||||||||||||||||||||
|
|
|
|
|
|
|
|
|
|
|
|||||||||||||||||||||||||||||||
Customers and Classes of Products: We believe that our business is not materially dependent upon a single customer. Additionally, although we have a diverse customer base and no customer or distributor constitutes 10% or more of our consolidated net sales, we do have customers and independent, third-party distributors, the loss of which could have a material adverse effect on results of operations for the affected earnings periods. Both our Industrial segment and our Printing segment are dependent on such customers and distributors. The principal products purchased by such customers are production fluids in our Industrial segment and solid sheet printing elements in our Printing segment. No material part of our business is subject to renegotiation or termination at the election of a governmental unit.
Within our two general types of products, as of March 31, 2012, we sold approximately 76 classes of products. Three of our classes of products, each within our Industrial segment, each represent 10% or more of our net sales. Net sales of our class of functional products, which is comprised of approximately 25 different products designed to improve the corrosion resistance and/or functionality of the surfaces they are used to treat, for the years ended December 31, 2011, 2010 and 2009 approximated 28%, 26% and 27%, respectively, of our consolidated net sales. Net sales of our class of decorative products, which is comprised of approximately 30 different products designed to enhance the appearance of the surfaces they treat, for the years ended December 31, 2011, 2010 and 2009 approximated 12%, 11% and 10%, respectively, of our consolidated net sales. Net sales of our class of metallization products, which is comprised of six different products used to plate electronic components onto the surfaces they treat, for the years ended December 31, 2011, 2010 and 2009 approximated 15%, 15% and 14%, respectively, of our consolidated net sales.
99
Table of Contents
Proprietary sales are generated from manufactured chemical compounds produced from our own research and development laboratories and manufacturing facilities. In many cases, these products are protected with patents or trademarks. Proprietary products have higher gross margins than non-proprietary products, and are perceived by our management to be more critical to our overall performance.
Methods for selling and marketing our proprietary products vary slightly by geographic region. In total, we generate business through the efforts of sales and service personnel and regional distributors and manufacturing representatives. In the Americas, approximately 290 sales and service personnel market our entire line of proprietary products. In certain areas of the United States, distributors and manufacturing representatives also sell and service many of our products. We market certain of our products through wholly owned subsidiaries in Canada and Mexico, and through 95% ownership of our operations in Brazil. In Europe, approximately 340 sales and service representatives, who are employed by our wholly owned subsidiaries located in Belgium, Czech Republic, France, Germany, Great Britain, Italy, Luxembourg, the Netherlands, Spain and Sweden, market our proprietary products. In the Asia-Pacific region, our local subsidiaries employ approximately more than 420 sales and service representatives to market our proprietary products through either wholly owned subsidiaries or branches in Australia, mainland China, Hong Kong, India, Japan, Singapore, South Korea and Taiwan. In addition to the countries where we have wholly owned subsidiaries, some of our proprietary chemicals are sold in other countries throughout Asia, Europe and South America through distributors. Such resale items are marketed in conjunction with and as an aid to the sale of proprietary chemicals.
Revenue from product sales, including freight charged to customers, is recorded upon shipment to the customer if the collection of the resulting receivable is probable. Our stated shipping terms are customarily FOB shipping point and do not include customer inspection or acceptance provisions. Equipment sales arrangements may include right of inspection or acceptance provisions in which case revenue is deferred until these provisions have been satisfied. If circumstances arise where title has not passed, or revenue is not earned, we defer revenue recognition in accordance with criteria set forth in Staff Accounting Bulletin No. 101, Revenue Recognition in Financial Statements and Staff Accounting Bulletin No. 104, Revenue Recognition.
There is no material portion of our business that is subject to seasonality. Likewise, there is no major portion of our business, or business segments, dependent upon a single customer or a few customers, the loss of which would have a materially adverse effect on our business.
Research and Development
Research in connection with proprietary products is performed principally in the United States, Great Britain, Japan and China. We spent approximately $23.0 million during fiscal year 2011, $21.0 million during fiscal year 2010 and $20.1 million during fiscal year 2009 on research and development activities. Substantially all research and development activities were performed internally.
Patents, Trademarks and Proprietary Products
We own more than 750 domestic and foreign patents. The patents we hold are important to our business and have remaining lives of varying duration. Although certain of these patents are becoming increasingly more important to our business, we believe that our ability to provide technical and testing services to customers, and to meet our customers’ rapid delivery requirements of our customers is equally, if not, more important. No specific group or groups of intellectual property rights are material to our business. In addition, we have many proprietary products which are not covered by patents and which are responsible for a large component of our total sales. Further, we hold a number of domestic and foreign tradenames and trademark registrations and applications for registration which we consider to be of value in identifying the MacDermid business and our products. We do not hold nor have we granted any franchises or concessions.
100
Table of Contents
Government and Environmental Regulation
We are subject to numerous federal, state and local laws and regulations in the countries in which we operate, including tax and other laws that govern the way we conduct our business. However, no portion of our business is subject to re-negotiation of profits or termination of contracts or subcontracts at the election of the governments in the countries in which we operate.
As a manufacturer and distributor of specialty chemicals and systems, we are subject to extensive U.S. and foreign laws and regulations relating to environmental protection and worker health and safety, including those governing discharges of pollutants into the air and water, the management and disposal of hazardous substances and wastes, the cleanup of contaminated properties and occupational safety and health matters. We could incur significant costs, including cleanup costs, fines and sanctions and third-party claims for property or natural resource damage or personal injuries as a result of past or future violations of, or liabilities under, such laws and regulations.
In response to increased government attention to environmental matters worldwide, we continue to develop proprietary products designed to reduce the discharge of pollutant materials into the environment and eliminate the use of certain targeted raw materials while enhancing the efficiency of customer chemical processes.
Competitive Environment
We provide a broad line of proprietary chemical compounds and supporting services. Broadly speaking, we compete in the specialty chemicals market. On a more narrow scale, we compete in markets for specialty chemicals for electronic applications, general metal and plastic finishing, printing and oil exploration and production. Based on 2011 net sales, we believe that the majority of our operations hold leading positions in the product markets they serve, including, with respect to Electronic Solutions and Industrial Solutions, the number one or number two market share positions in the product markets they serve.
We have many competitors in some proprietary product areas. Some large competitors operate globally, as we do, but most operate only locally or regionally. Our Electronic Solutions business has five primary worldwide competitors. Our Industrial Solutions business has eight primary worldwide competitors. Our Offshore Solutions business has three primary worldwide competitors. Our Printing business has five primary worldwide competitors, with DuPont being the dominant participant in the market. To the best of our knowledge, no single competitor competes with all our proprietary products.
We compete primarily on the basis of quality, technology, performance, reliability, brand, reputation, range of products and services, and service and support. We maintain extensive support, technical and testing services for our customers, and are continuously developing new products. We believe that our combined abilities to manufacture, sell, service and develop new products and applications, enable us to compete successfully both locally and internationally.
101
Table of Contents
Properties
Our corporate executive office is at 1401 Blake Street, Denver, Colorado. We also operate manufacturing facilities, laboratory and warehouse and sales offices throughout the world. As of December 31, 2011, we owned 15 facilities and leased 42 facilities. The following table lists our principal facilities by segment and gives a brief description of the activities performed at each facility:
| Location |
Principal Use |
Ownership status | ||
| Corporate & other support functions |
||||
| Denver, Colorado |
Executive offices | Owned* | ||
| Waterbury, Connecticut |
Industrial and Printing segment administration offices, marketing offices, corporate service, customer support and research laboratories | Owned* | ||
| Industrial Segment |
||||
| Ferndale, Michigan |
Factory, warehouse and offices | Owned* | ||
| New Hudson, Michigan |
Laboratories and offices | Owned* | ||
| Pasadena, Texas |
Factory, warehouse and offices | Owned* | ||
| São Paulo, Brazil |
Factory, warehouse and offices | Leased | ||
| Hsin Chu, Taiwan |
Factory, warehouse, laboratories and offices | Owned | ||
| Panyu, China |
Factory, warehouse, laboratories and offices | Owned | ||
| Suzhou, China |
Factory, laboratories and offices | Owned | ||
| Sungnam-City, South Korea |
Warehouse and offices | Leased | ||
| Singapore |
Warehouse and offices | Leased | ||
| Hong Kong |
Warehouse and offices | Leased | ||
| Kawasaki, Japan |
Laboratories and offices | Leased | ||
| Birmingham, United Kingdom |
Factory, warehouse, laboratories and offices | Leased | ||
| Wigan, United Kingdom |
Factory, warehouse and offices | Owned | ||
| Wantage, United Kingdom |
Factory, warehouse, laboratories and offices | Leased | ||
| Novara, Italy |
Factory, warehouse, laboratory and offices | Owned | ||
| Frost, Germany |
Warehouse and offices | Leased | ||
| Barcelona, Spain |
Warehouse, laboratory and offices | Owned | ||
| Printing Segment |
||||
| Morristown, Tennessee |
Factory, warehouse, laboratory and offices | Owned* | ||
| Atlanta, Georgia |
Offices and laboratories | Owned* | ||
| San Marcos, California |
Factory, warehouse, laboratory and offices | Owned* | ||
| Middletown, Delaware |
Factory, warehouse and offices | Owned* | ||
| Cernay, France |
Warehouse and offices | Leased | ||
| Melbourne, Australia |
Factory, warehouse and offices | Leased | ||
| * | Subject to a mortgage granted to secure our obligations under the Credit Facilities. |
We believe that all of our facilities and equipment are in good condition, are well maintained and are adequate for our present operations.
Insurance
Our belief is that we have customary levels of insurance for a company of our size in our industry. Our insurance policies are subject to deductibles and limits. We have property coverage with a limit of $150.0 million, domestic employee benefits coverage with a limit of $2.0 million and cargo transport liability with a limit of $1.5 million. We also maintain other types of insurance, such as aviation products liability, automobile, and general liability insurance. During the three months ended March 31, 2012, we paid $0.2 million in aggregate insurance premiums.
102
Table of Contents
We maintain insurance coverage at levels that we believe to be reasonable. However, we are not fully insured against all potential hazards incident to our business. Additionally, we may incur losses beyond the limits of, or outside the coverage of, our insurance. We maintain full replacement value insurance coverage for property damage to a majority our facilities and business interruption insurance. Nevertheless, a significant business interruption in the operation of one or more of our facilities could have a material adverse effect on our business. As a result of market conditions, premiums and deductibles for certain insurance policies can increase substantially and, in some instances, certain insurance may become unavailable or available only for reduced amounts of coverage.
Employees
We employ individuals in 24 countries. As of March 31, 2012, we employed approximately 2,100 full-time employees, including approximately 1,000 research and development chemists and experienced technical service and sales personnel.
Legal Proceedings
In the ordinary course of our business, we are subject to periodic lawsuits, investigations and claims, including, but not limited to, product liability claims, contractual disputes, premises claims and employment and environmental, health, and safety matters. Although we cannot predict with certainty the ultimate resolution of lawsuits, investigations and claims asserted against us, we do not believe any currently pending legal proceeding to which we are a party will have a material adverse effect on our business, prospects, financial condition, cash flows and results of operations.
Corporate Information
The principal executive offices of MacDermid Group, Inc. are located at 1401 Blake Street, Denver, Colorado 80202, and the telephone number at this address is (720) 479-3060. Our website address is www.macdermid.com. Information on, or accessible through, our website is not a part of, and will not be deemed to be incorporated into, this prospectus or the registration statement of which this prospectus forms a part. Investors should not rely on any such information in deciding whether to purchase our common stock.
103
Table of Contents
MANAGEMENT AND BOARD OF DIRECTORS
Executive Officers and Directors
Set forth below is information concerning our current executive officers and directors and prospective directors as of June 22, 2012.
| Name |
Age |
Position | ||
| Daniel H. Leever |
63 | Director, Chairman and Chief Executive Officer | ||
| Frank J. Monteiro |
42 | Senior Vice President and Chief Financial Officer | ||
| John L. Cordani |
49 | Vice President, Corporate Secretary and General Counsel | ||
| Michael V. Kennedy |
50 | Treasurer and Director of Tax | ||
| Jerry A. Mitchell |
48 | Corporate Controller | ||
| Joseph M. Silvestri |
50 | Director | ||
| Kevin D. Brown |
37 | Director | ||
| David L. Ferguson |
57 | Director | ||
| Michael F. Finley |
50 |
Director | ||
| T. Quinn Spitzer, Jr. |
63 | Director* |
| * | Appointment to our Board effective upon the listing of our common stock on the NYSE. |
Backgrounds of Current Executive Officers and Directors and Prospective Directors
Each executive officer serves at the discretion of our Board and holds office until his successor is elected and qualified or until his earlier death, resignation or removal.
Set forth below is information concerning our current executive officers and directors and prospective directors identified above.
Daniel H. Leever: Mr. Leever has been a member of the board of directors of MacDermid Group, Inc. since its formation and a member of the board of directors of MacDermid, Incorporated since 1989. He has served as Chief Executive Officer and Chairman of the board of directors of MacDermid Group, Inc. since its formation and as Chief Executive Officer of MacDermid, Incorporated since 1990. He has been Chairman of the board of directors of MacDermid, Incorporated since 1998. From 1989 to 1990, Mr. Leever served as Senior Vice President and Chief Operating Officer of MacDermid, Incorporated. Mr. Leever initially joined MacDermid, Incorporated as an employee in 1982. Mr. Leever attended undergraduate school at Kansas State University and the graduate school at the University of New Haven School of Business.
We believe Mr. Leever’s qualifications to serve on our board of directors include his extensive knowledge of our company and our industry and his years of leadership at our company.
Frank J. Monteiro: Mr. Monteiro has served as the Senior Vice President and Chief Financial Officer of MacDermid Group, Inc. since its formation and as the Senior Vice President and Chief Financial Officer of MacDermid, Incorporated since February 2010. From April 2007 until February 2010, Mr. Monteiro served as Vice President of Finance and Treasurer of MacDermid, Incorporated. Mr. Monteiro joined the MacDermid business in June 1998 and, from June 1998 to April 2007, served in the positions of General Accounting Manager, Domestic Accounting Manager and Assistant Controller of Industrial Americas operations, and as Assistant Treasurer and Risk Manager of MacDermid, Incorporated. Mr. Monteiro received a Bachelor of Science in Accountancy from Bentley University.
104
Table of Contents
John L. Cordani: Mr. Cordani has served as the Vice President, Secretary and General Counsel of MacDermid Group, Inc. since its formation and as the Vice President, Secretary, and General Counsel of MacDermid, Incorporated since 1993, other than during the period from May 2000 to March 2002, when he worked as a partner at Carmody & Torrance LLP. From 1989 until 1992, Mr. Cordani served as IP Manager of MacDermid, Incorporated. Having joined MacDermid in 1986, Mr. Cordani served as a Researcher for the company from 1986 until 1989. Mr. Cordani also works, and has since 2001, as an Adjunct Professor of Law at Quinnipiac University Law School. Mr. Cordani received a Juris Doctor from Quinnipiac University Law School, a Master of Science in Materials Science from Rensselaer Polytech, and a Bachelor of Science in Chemical Engineering from Texas A&M University.
Michael V. Kennedy: Mr. Kennedy has served as the Treasurer and Director of Tax of MacDermid Group, Inc. since its formation and as the Director of Tax of MacDermid, Incorporated continuously since August 2006 and previously from January 1997 until September 2001. Mr. Kennedy has also served as Treasurer of MacDermid, Incorporated since May 2011. From October 2001 through June 2006, Mr. Kennedy was Vice President-Tax for Allied Domecq North American Corporation, an alcoholic beverage company. From October 1989 to December 1996, he was a tax manager at Dynamics Corporation of America, an electrical appliance and electronic device manufacturer. Mr. Kennedy began his career at Arthur Andersen & Co as a tax accountant from 1986 to 1989. Mr. Kennedy is a certified public accountant and received a Bachelor of Business Administration in Accounting from Pace University.
Jerry A. Mitchell: Mr. Mitchell has served as the Corporate Controller of MacDermid Group, Inc. since its formation and as the Corporate Controller of MacDermid, Incorporated since September 2006. Mr. Mitchell joined MacDermid, Incorporated in November 2005 as the Director of Operational Accounting. Before joining the company, Mr. Mitchell worked at Arthur Andersen & Co., an accounting firm, as an auditor for six years. He is a Certified Public Accountant and received his Bachelor of Science in Accountancy from Arizona State University.
Joseph M. Silvestri: Mr. Silvestri has been a member of the board of directors of MacDermid Group, Inc. since its formation and a member of the board of directors of MacDermid, Incorporated since December 1999. Mr. Silvestri is a Managing Partner of Court Square Capital Partners II, L.P., an affiliate of Court Square Capital Partners, which, together with its predecessor, Citigroup Venture Capital, Ltd., has employed Mr. Silvestri since 1990. He is a member of the boards of directors and audit committees of SGS International, Inc. and Triumph Group, Inc. He also serves on the board of directors of Auto Europe Group, Newmarket International, Inc. and Aerospace Parts Holdings. Mr. Silvestri received a Masters in Business Administration from Columbia Business School and a Bachelor of Science in Civil Engineering from Pennsylvania State University.
We believe Mr. Silvestri’s qualifications to serve on our board of directors include his affiliation with Court Square Capital Partners, his extensive experience as a director, his financial expertise and his significant experience in working with companies controlled by private equity sponsors.
Kevin D. Brown: Mr. Brown has been a member of the board of directors of MacDermid Group, Inc. since its formation and a member of the board of directors of MacDermid, Incorporated since April 2007. Mr. Brown is a Principal of Court Square Capital Partners and has been with the firm since April 2006, after serving as a Vice President at Apax Partners, a private equity investment group, since 2003. Prior to Apax Partners, Mr. Brown worked at Alta Communications, a private equity firm specializing in investments in media and communications companies, and the chemicals investment banking group of J.P. Morgan. He is a member of the board of directors of Wyle, Inc. Mr. Brown received a Masters in Business Administration from the Wharton School of Business, where he graduated as a Palmer Scholar, and a Bachelor of Science in Commerce from the McIntire School of Commerce at the University of Virginia.
We believe Mr. Brown’s qualifications to serve on our board of directors include his affiliation with Court Square Capital Partners and his significant experience working with companies controlled by private equity sponsors.
105
Table of Contents
David L. Ferguson: Mr. Ferguson has been a member of the board of directors of MacDermid Group, Inc. since its formation and a member of the board of directors of MacDermid, Incorporated since April 2007. Mr. Ferguson is currently a Partner at Perella Weinberg Partners. Prior to joining Perella Weinberg Partners in 2012, he was a partner at Weston Presidio from 2003 until 2011. He is a member of the boards of directors of RE/MAX, LLC and Robbins Bros. Jewelry, Inc. and was formerly a director of Cellu Tissue Holdings, Inc. from June 2006 through December 2010. From 1989 to 2003, Mr. Ferguson was a partner with JPMorgan Partners. Mr. Ferguson is a certified public accountant and received a Masters in Business Administration in Finance from the Wharton School of Business and a Bachelor of Arts in Accounting from Loyola University Maryland.
We believe Mr. Ferguson’s qualifications to serve on our board of directors include his knowledge of MacDermid, Incorporated, his extensive director experience, and his financial and accounting expertise.
Michael F. Finley: Mr. Finley has been a member of the board of directors of MacDermid Group, Inc. since its formation and been a member of the board of directors of MacDermid, Incorporated since May 2011. Mr. Finley has served as a Partner with Court Square Capital Partners since 2008. Previously, he was a Managing Director of The Cypress Group since 1998 and had been a member of The Cypress Group since its formation in April 1994. Prior to joining The Cypress Group, he was a vice president in the Merchant Banking Group at Lehman Brothers Inc. Mr. Finley received a Masters of Business Administration from the University of Chicago Booth School of Business and a Bachelor of Arts in Economics and Accounting from the University of St. Thomas. Mr. Finley serves on the board of directors of Wyle, Inc. and has served on the board of directors of Affinia Group Inc. from December 2004 to March 2011, on the board of directors of CPI, Inc. from April 2006 until February 2011 and on the board of directors of Williams Scotsman International, Inc. from May 1997 until November 2007.
We believe Mr. Finley’s qualifications to serve on our board of directors include his experience working with companies controlled by private equity sponsors and his extensive experience in finance and financial advisory work.
T. Quinn Spitzer, Jr.: Mr. Spitzer has been selected, and has agreed to serve, as a member of the board of directors of MacDermid Group, Inc., effective upon the listing of our common stock on the NYSE. Mr. Spitzer is a partner and chairman of McHugh Consulting, a management consulting firm specializing in business strategy and complexity management that he co-founded in 1999. Prior to co-founding McHugh Consulting, he served as chairman, president and chief executive officer of Kepner-Tregoe, Inc., a management consulting firm. Mr. Spitzer received a Bachelor of Arts from the University of Virginia, where he graduated as an Echols Scholar, and attended graduate school at the University of Georgia. Mr. Spitzer previously served on the board of directors of MacDermid, Incorporated from July 2000 to April 2007, serving on the audit, compensation and corporate governance committees during that period.
We believe Mr. Spitzer’s qualifications to serve on our board of directors include his extensive consulting experience working with public and private companies, his financial expertise and his previous service as a director of MacDermid, Incorporated.
Board of Directors
Board Composition
Our business and affairs are managed under the direction of our Board. Prior to the completion of this offering, our Board consists of five directors and, immediately following the completion of this offering, our Board will consist of eight directors. Pursuant to the Securityholders’ Agreement, until they cease to own at least 7.5% of our outstanding common stock, each of Court Square and Weston Presidio will have the right to designate individuals for nomination to our Board. Pursuant to the Securityholders’ Agreement, the other
106
Table of Contents
securityholders party thereto are required to vote for the election of such designated nominees. The number of individuals each of Court Square and Weston Presidio is entitled to designate for nomination by our Board is dependent on the amount of our common stock then owned by such entity. See “Certain Relationships and Related Party Transactions—Relationship with Court Square and Weston Presidio—Securityholders’ Agreement”. Because of their affiliations with Court Square or Weston Presidio or their role as an executive officer of the company, none of our current or prospective directors are “independent” under the listing rules of the NYSE or Rule 10A-3 of the Securities Exchange Act of 1934 (as amended, the “Exchange Act”), except for Mr. Spitzer, who will join our Board upon consummation of this offering. Within one year following the completion of this offering, we intend to appoint two additional independent directors.
Our certificate of incorporation and by-laws provide that our directors are elected annually. Each of our directors will hold office until his successor has been duly elected and qualified or until his earlier death, resignation or removal.
Controlled Company Status
After this offering, Court Square and Weston Presidio will collectively beneficially own a majority of our outstanding common stock, and we will be a “controlled company” under the corporate governance rules of the NYSE. As a controlled company, we are eligible for exemptions from some of the requirements of these rules, including the requirements (1) that a majority of our Board consist of independent directors, (2) that we have a nomination and governance committee and a compensation committee, which are each composed entirely of independent directors and governed by a written charter addressing the respective committee’s purpose and responsibilities and (3) for annual performance evaluations of the nomination and governance committee and the compensation committee. We intend to avail ourselves of some or all of these exemptions for so long as Court Square and Weston Presidio or any other person, group or entity continues to beneficially own a majority of our outstanding voting shares. In the event that we cease to be a controlled company within the meaning of these rules, we will be required to comply with these provisions after specified transition periods.
More specifically, if we cease to be a controlled company within the meaning of these rules, we will be required to (1) satisfy the majority independent board requirement within one year of our status change, (2) have at least one independent member on each of our nomination and governance committee and compensation committee by the date of our status change, (3) have at least a majority of independent members on each committee within 90 days of the date of our status change and (4) have fully independent committees within one year of the date of our status change.
Committees
Our Board has established an audit committee, a compensation committee and a nominating and corporate governance committee, each of which will have the composition and responsibilities described below. The audit committee, compensation committee and nominating and corporate governance committee all operate under charters approved by our Board, which are available on our website.
Audit Committee
The members of the audit committee are expected to be Messrs. Spitzer, and with Mr. Spitzer serving as the chair. We expect our Board to determine Mr. Spitzer to be independent under the SEC and NYSE rules.
The SEC and NYSE rules allow an issuer to phase-in, in connection with an initial public offering, the number of directors on the audit committee as well as the independence of such directors. Under the initial public offering phase-in, at the time of listing, the audit committee must have at least one member, and that member must be an independent director (as defined in the SEC and NYSE rules) and must have accounting or related
107
Table of Contents
financial management expertise, as required by the NYSE rules, at the time of listing. Within 90 days after the effective date of the Registration Statement, the audit committee must have at least two members, and a majority of the members of the audit committee must be independent. Within one year after the effective date of the Registration Statement, the audit committee must have at least three members, all of whom must be independent. In addition, each member of the audit committee is required to be financially literate or must become financially literate within a reasonable period of time after his or her appointment to the audit committee, and at least one member of the audit committee must have accounting or related financial management expertise as required by the NYSE rules. Mr. Spitzer qualifies as an “audit committee financial expert” as such term is defined under the SEC rules. While the NYSE rules do not require that a listed company’s audit committee include a person who satisfies the definition of an “audit committee financial expert” under the SEC rules, a board of directors may presume that such a person has the required accounting or related financial management expertise under the NYSE rules. We will modify the composition of our audit committee as required to comply with the SEC and NYSE rules.
Our audit committee is responsible for, among other things:
| • | reviewing and approving the selection of our independent registered public accounting firm, and approving the audit and non-audit services to be performed by our independent registered public accounting firm; |
| • | monitoring the integrity of our financial statements and our compliance with legal and regulatory requirements as they relate to financial statements or accounting matters; |
| • | reviewing the adequacy and effectiveness of our internal control policies and procedures; |
| • | discussing the scope and results of the audit with the independent auditors and reviewing with management and the independent auditors our interim and year-end operating results; and |
| • | preparing the audit committee report that the SEC requires in our annual proxy statement. |
The audit committee will have the power to investigate any matter brought to its attention within the scope of its duties and to retain counsel for this purpose where appropriate.
Compensation Committee
The members of the compensation committee are expected to be , and with serving as the chair. The compensation committee is responsible for, among other things:
| • | overseeing our compensation policies, plans and benefit programs; |
| • | reviewing and approving for each of our executive officers: the annual base salary, the annual incentive bonus, including the specific goals and amount, equity compensation, employment agreements, severance arrangements and change in control arrangements, and any other benefits, compensations or arrangements; |
| • | reviewing and approving compensation to our non-executive directors; |
| • | preparing the compensation committee report that the SEC requires to be included in our annual proxy statement; and |
| • | administrating our equity compensation plans. |
108
Table of Contents
Nominating and Corporate Governance Committee
The members of the nominating and corporate governance committee are expected to be , and with serving as the chair. The nominating and corporate governance committee is responsible for, among other things:
| • | assisting our Board in identifying prospective director nominees and recommending nominees for each annual meeting of stockholders to our Board; |
| • | reviewing developments in corporate governance practices and developing and recommending governance principles applicable to our Board; |
| • | reviewing the succession planning for our executive officers; |
| • | overseeing the evaluation of our Board and management; and |
| • | recommending members for each board committee to our Board. |
Code of Ethics
In connection with this offering, our Board will adopt a code of ethics that establishes the standards of ethical conduct applicable to all our directors, officers, employees, consultants and contractors. The code of ethics will address, among other things, competition and fair dealing, conflicts of interest, financial matters and external reporting, company funds and assets, confidentiality and corporate opportunity requirements, the process for reporting violations of the code of ethics, employee misconduct, conflicts of interest or other violations. Our code of ethics will be publicly available on our website at www.macdermid.com. Any waiver of our code of ethics with respect to our chief executive officer, chief financial officer, controller or persons performing similar functions may only be authorized by our audit committee and will be disclosed as required by applicable law.
Director Compensation
The directors of MacDermid, Incorporated in 2011 were Daniel H. Leever, Joseph M. Silvestri, Michael A. Delaney, Kevin D. Brown, David L. Ferguson and Michael F. Finley. We currently do not pay our directors any compensation for serving on our Board. Daniel H. Leever was an executive officer as well as a director and did not receive any compensation for his services as a director in addition to his executive compensation.
Upon consummation of this offering, we anticipate only those directors who are considered independent directors under the SEC and NYSE rules will receive compensation from us for their service on our Board. Our independent directors will receive:
| • | an annual retainer of $50,000, paid in quarterly installments; and |
| • | an additional annual retainer of $15,000, paid in quarterly installments, to each of the chairmen of the audit committee, the compensation committee and the nominating and corporate governance committee. |
109
Table of Contents
COMPENSATION TABLES AND NARRATIVE DISCLOSURES
Summary Compensation Table
The following table summarizes the compensation of each of our named executive officers for the fiscal years ended December 31, 2011 and 2010.
| Name and Principal |
Year | Salary ($)(1) |
Bonus ($)(2) |
Stock Awards ($)(3) |
Option Awards ($) |
Non-Equity Incentive Plan Compensation ($) |
Nonqualified Deferred Compensation Earnings ($) |
All Other Compensation ($)(4) |
Total ($) |
|||||||||||||||||||||||||||
| Daniel H. Leever |
2011 | 793,750 | 480,000 | 43,416 | — | — | — | 3,564 | 1,320,730 | |||||||||||||||||||||||||||
| Chairman and Chief Executive Officer |
2010 | 754,167 | 1,450,000 | — | — | — | — | 4,158 | 2,208,325 | |||||||||||||||||||||||||||
| Frank J. Monteiro |
2011 | 269,750 | 95,550 | 12,529 | — | — | — | 541 | 378,370 | |||||||||||||||||||||||||||
| Senior Vice President and Chief Financial Officer |
2010 | 243,562 | 175,500 | — | — | — | — | 541 | 419,603 | |||||||||||||||||||||||||||
| John L. Cordani |
2011 | 302,525 | 68,400 | 3,685 | — | — | — | 810 | 375,420 | |||||||||||||||||||||||||||
| Vice President, Corporate Secretary and General Counsel |
2010 | 295,210 | 149,050 | — | — | — | — | 878 | 445,138 | |||||||||||||||||||||||||||
| (1) | Amounts disclosed in this column represent annual base salary, and include adjustments to our named executive officers’ base salaries made by the Board at its February 2011 and February 2010 meeting, respectively. These adjustments were applied retroactively to January 2011 and January 2010, respectively. These amounts are not reduced to reflect the named executive officers’ elections to defer receipt of salary under the Savings Plan. |
| (2) | Amounts disclosed in this column were earned under the company’s discretionary bonus plan for 2011 (the “2011 Bonus Plan”) and 2010 and paid in March 2012 and 2011, respectively. These amounts are not reduced to reflect the named executive officers’ elections to defer receipt of salary under the Savings Plan. |
| (3) | Amounts disclosed in this column relate to the adjustment of the Class B Units by resolution of the Board on February 28, 2011, subject to MacDermid Holdings, LLC member consent, to take into account the divestitures and acquisitions by the company since 2007 and the difficult global economic conditions that occurred in 2009. As required under SEC rules for compensation disclosure in registration statements, the amounts disclosed in this column are based on the incremental fair value with respect to the adjusted Class B Units, computed as of the date of such adjustment, in accordance with Financial Accounting Standards Board Accounting Standards Codification Topic 718. Amounts disclosed in this column take into account the probable outcome of the performance conditions with respect to the Class B Units and exclude the impact of estimated forfeitures related to service-based vesting. Assuming the highest level of performance achievement, the maximum fair value of the adjusted Class B Units for Mr. Leever would be: $217,080; for Mr. Monteiro: $62,645; and for Mr. Cordani: $18,425. The actual value, if any, realized by a named executive officer from the Class B Units will depend on the performance of our common stock and the achievement of the applicable performance goals. As part of the Corporate Reorganization, holders of unvested Class B Units will receive, upon liquidation of MacDermid Holdings, LLC, restricted shares of our common stock, which will be subject to substantially identical vesting conditions as the Class B Units. For additional information regarding the Class B Units, see the narrative disclosure following the Summary Compensation Table beginning on page 111 of this prospectus. For information relating to the assumptions made in determining the value of the Class B Units, see Note 9 to our audited financial statements included in this prospectus. |
| (4) | Amounts disclosed in this column represent premiums paid on behalf of our named executive officers for a company-sponsored life insurance program. |
110
Table of Contents
Narrative Disclosure to Summary Compensation Table
The following describes material features of the compensation disclosed in the Summary Compensation Table:
Class A Units and Class B Units
The membership interests in MacDermid Holdings, LLC held by the named executive officers are divided into four classes of interests consisting of the preferred units, the common units, time-vesting membership interests (the “Class A Units”) and performance-vesting membership interests (the “Class B Units”). Grants of Class A Units and Class B Units were made pursuant to the MacDermid Holdings, LLC Equity Incentive Plan. None of the interests have been registered under the Securities Act or the securities laws of any state and cannot be sold, assigned, transferred, exchanged or otherwise disposed of except in compliance with the terms of the agreement among the securityholders’ of MacDermid Holdings, LLC (the “Holdings Securityholders’ Agreement”). Pursuant to the Holdings Securityholders’ Agreement, prior to an initial public offering of MacDermid Holdings, LLC, a holder of Class A Units and Class B Units may only transfer his or her interests as part of another member’s negotiated sale of its interests pursuant to customary “tag along” rights. In addition, a holder of Class A Units and Class B Units may be forced to sell his or her interests on terms similar to those agreed to by other selling members pursuant to customary “drag along” rights.
The Class A Units vest in equal increments of 20% on each of the first five anniversaries of the issue date, subject to our named executive officers’ continued employment. In the event the company undergoes a change of control on or prior to the fifth anniversary of the issue date, all the outstanding Class A Units will become vested. In March 2011, 20% of the Class A Units vested. As of December 31, 2011, 20% of the Class A Units remain unvested.
As a result of adjustments made to the Class B Units, 20% of the Class B Units vested on March 31, 2011 and the remaining Class B Units will vest in equal increments of 20% on each of March 31, 2012, 2013, 2014 and 2015, subject to our named executive officers’ continued employment and the company’s attainment of certain annual EBITDA performance vesting targets. The Class B Units were adjusted by resolution of the Board on February 28, 2011, subject to MacDermid Holdings, LLC member consent, to take into account the divestitures and acquisitions by the company since 2007 and the difficult global economic conditions that occurred in 2009. MacDermid Holdings, LLC member consent was completed on April 4, 2011. The performance vesting targets required for ratable vesting of the Class B Units on the applicable vesting date are (1) EBITDA (as defined in the MacDermid Holdings, LLC operating agreement) for calendar year 2010 of at least $137 million; (2) EBITDA for calendar year 2011 of at least $150 million; (3) EBITDA for calendar year 2012 of at least $162 million; (4) EBITDA for calendar year 2013 of at least $172 million; and (5) EBITDA for calendar year 2014 of at least $185 million. In addition, the Class B Units that were eligible to vest on any vesting date (other than the final vesting date) but failed to vest due to our failure to achieve the applicable performance vesting target will vest on the immediately subsequent vesting date if the applicable performance vesting target is achieved with respect to such immediately subsequent vesting date.
In the event the company undergoes a change of control on or prior to March 31, 2015, any Class B Units that were eligible to vest on the vesting date in the year immediately preceding the year of the change of control but failed to vest due to our failure to achieve the applicable performance vesting target, as well as the Class B Units eligible to vest in the year of the change of control and all years following the year of the change of control, will vest on the date of the consummation of the change of control. However, such accelerated vesting of the Class B Units will only occur to the extent that holders of the preferred units, common units and Class A Units receive distributions in connection with the change of control which, when added to the aggregate distributions (if any) received by the holders of the preferred units, common units and Class A Units from distributions prior to such date, equal or exceed $1,000,000,000.
On the earlier of the final vesting date or the date of the consummation of a change of control, any Class B Units that have not vested will be forfeited and will cease to be outstanding.
111
Table of Contents
No capital contributions are required to be made by a holder of Class A Units or Class B Units upon issuance. The Class A Units and the Class B Units are intended to constitute a “profits interest” in the company for tax purposes. Subject to the restrictions in the Holdings Securityholders’ Agreement, holders of vested Class A Units and vested Class B Units have a general right to vote for all purposes, including the election of directors of the board of directors of MacDermid Holdings, LLC, as a single class together with the holders of vested common units.
Distributions to the members of MacDermid Holdings, LLC of the cash or other assets of MacDermid Holdings, LLC are made only at such times and in such amounts as authorized in the Holdings Securityholders’ Agreement. The board of directors of MacDermid Holdings, LLC has no obligation or duty to authorize any distributions prior to a dissolution or liquidation of MacDermid Holdings, LLC.
Pursuant to the Holdings Securityholders’ Agreement and in connection with the liquidation of MacDermid Holdings, LLC as part of the Corporate Reorganization, the holders of Class A Units and Class B Units will participate with the holders of common units, as a group, in the distribution of the shares of our common stock then held by MacDermid Holdings, LLC that remain after (i) the holders of preferred units receive an amount equal to the aggregate unpaid yield and unreturned original cost of the outstanding preferred units and (ii) the holders of common units receive an amount equal to the aggregate common preference and unreturned original cost of the common units. The shares of our common stock distributed to holders of unvested Class A Units and unvested Class B Units as part of the Corporate Reorganization will be subject to substantially identical vesting conditions as those described above. Following the Corporate Reorganization, no Class A Units or Class B Units will be outstanding.
2011 Outstanding Equity Awards at Fiscal Year End
The following table sets forth information concerning our named executive officers’ outstanding equity awards as of December 31, 2011.
| Stock Awards | ||||||||||||||
| Name |
Number of Shares or Units of Stock That Have Not Vested(1) |
Market Value of Shares or Units of Stock That Have Not Vested(2) |
Equity Incentive Plan Awards: Number of Unearned Shares, Units or Other Rights That Have Not Vested(3) |
Equity Incentive Plan Awards: Market or Payout Value of Unearned Shares, Units or Other Rights That Have Not Vested (4) | ||||||||||
| Daniel H. Leever |
86,000 | $ | 259,200 | |||||||||||
| Frank J. Monteiro |
16,125 | $ | 74,800 | |||||||||||
| John L. Cordani |
8,600 | $ | 22,000 | |||||||||||
| (1) | This column represents outstanding Class A Units. The Class A Units vest in equal increments of 20% on each of the first five anniversaries of the issue date, subject to our named executive officers’ continued employment. Amounts disclosed in this column represent the remaining 20% of each named executive officer’s original grant of Class A Units that remain unvested. In the event the company undergoes a change of control on or prior to the fifth anniversary of the issue date, all the outstanding Class A Units will become vested. For additional information regarding the Class A Units, see the narrative disclosure following the Summary Compensation Table beginning on page 111 of this prospectus. As part of the Corporate Reorganization, holders of unvested Class A Units will receive, upon the liquidation of MacDermid Holdings, LLC, restricted shares of our common stock, which will be subject to substantially identical vesting conditions. Following the Corporate Reorganization, no Class A Units will be outstanding. |
| (2) | The amounts in this column represent the market value of the Class A Units disclosed in the previous column based on the value of one share of company stock on the date of this offering at an initial public offering price of $ , the midpoint of the price range on the cover of this prospectus. A public market for the Class A Units and the Class B Units did not exist as of December 31, 2011 and all of the Class A Units were subject to transfer restrictions as of December 31, 2011, as described in the narrative disclosure following the Summary Compensation Table beginning on page 111 of this prospectus. |
112
Table of Contents
As noted above, as part of the Corporate Reorganization, holders of unvested Class A Units will receive, upon the liquidation of MacDermid Holdings, LLC, restricted shares of our common stock which, pursuant to the Securityholders’ Agreement, will be subject to substantially identical vesting conditions as described above. Following the Corporate Reorganization, no Class A Units will be outstanding.
| (3) | This column represents outstanding Class B Units. Since the Acquisition and prior to March 31, 2011, none of the Class B Units vested pursuant to their terms because certain annual EBITDA performance vesting targets were not satisfied. As a result of adjustments made to the Class B Units, 20% of the Class B Units vested on March 31, 2011 and the remaining Class B Units will vest in equal increments of 20% on each of March 31, 2012, 2013, 2014 and 2015, subject to our named executive officers’ continued employment and the company’s attainment of certain annual EBITDA performance vesting targets. The Class B Units were adjusted by resolution of the Board on February 28, 2011, subject to member consent, to take into account the divestitures and acquisitions by the company since 2007 and the difficult global economic conditions that occurred in 2009. MacDermid Holdings, LLC member consent was completed on April 4, 2011. The performance vesting targets required for ratable vesting of the Class B Units on the applicable vesting date are (1) EBITDA (as defined in the MacDermid Holdings, LLC operating agreement) for calendar year 2010 of at least $137 million; (2) EBITDA for calendar year 2011 of at least $150 million; (3) EBITDA for calendar year 2012 of at least $162 million; (4) EBITDA for calendar year 2013 of at least $172 million; and (5) EBITDA for calendar year 2014 of at least $185 million. In addition, the Class B Units that were eligible to vest on any vesting date (other than the final vesting date) but failed to vest due to our failure to achieve the applicable performance vesting target will vest on the immediately subsequent vesting date if the applicable performance vesting target is achieved with respect to such immediately subsequent vesting date. Amounts disclosed in this column represent the 80% of each named executive officers’ Class B Units that are unvested and may vest in the future depending on the company’s financial performance. |
In the event the company undergoes a change of control on or prior to March 31, 2015, any Class B Units that were eligible to vest on the vesting date in the year immediately preceding the year of the change of control but failed to vest due to our failure to achieve the applicable performance vesting target, as well as the Class B Units eligible to vest in the year of the change of control and all years following the year of the change of control, will vest on the date of the consummation of the change of control. However, such accelerated vesting of the Class B Units will only occur to the extent that holders of the preferred units, common units and Class A Units receive distributions in connection with the change of control which, when added to the aggregate distributions (if any) received by the holders of the preferred units, common units and Class A Units from distributions prior to such date, equal or exceed $1,000,000,000. On the earlier of the final vesting date or the date of the consummation of a change of control, any Class B Units that have not vested will be forfeited and will cease to be outstanding. For additional information regarding the Class B Units, see the narrative disclosure following the Summary Compensation Table beginning on page 111 of this prospectus. As part of the Corporate Reorganization, holders of unvested Class B Units will receive, upon the liquidation of MacDermid Holdings, LLC, restricted shares of our common stock, which will be subject to substantially identical vesting conditions. Following the Corporate Reorganization, no Class B Units will be outstanding.
| (4) | The amounts in this column represent the market value of the Class B Units disclosed in the previous column based on the value of one share of company stock on the date of this offering at an initial public offering price of $ , the midpoint of the price range on the cover of this prospectus. A public market for the Class B Units did not exist as of December 31, 2011 and all of the Class B Units were subject to transfer restrictions as of December 31, 2011, as described in the narrative disclosure following the Summary Compensation Table beginning on page 111 of this prospectus. |
As noted above, as part of the Corporate Reorganization, holders of unvested Class B Units will receive, upon the liquidation of MacDermid Holdings, LLC, restricted shares of our common stock which, pursuant to the Securityholders’ Agreement, will be subject to substantially identical vesting conditions as described above. Following the Corporate Reorganization, no Class B Units will be outstanding.
113
Table of Contents
Pension Benefits
The company currently maintains the MacDermid, Incorporated Employees’ Pension Plan (the “Defined Benefit Plan”), a tax-qualified defined benefit pension plan designed to provide retirement benefits for eligible employees of the company, and the Supplemental Executive Retirement Plan (the “SERP”), a non-tax-qualified retirement plan maintained by the company that is designed to replace the amounts lost under the Defined Benefit Plan due to certain Internal Revenue Code limitations. All the named executive officers are vested in their benefits under the Defined Benefit Plan. Normal retirement eligibility under the Defined Benefit Plan is at age 65 with respect to service provided by the participant on or prior to December 31, 2004 and age 60 with respect to service provided by the participant after December 31, 2004. Early retirement eligibility is at age 55 with at least five years of service. Benefits for service provided by the participant on or prior to December 31, 2004 are not reduced for early retirement and are paid upon early retirement in an amount equal to the benefit that the participant would receive if the participant retired as of December 31, 2004, updated to reflect compensation earned through the date of actual retirement. Benefits for service provided by the participant after December 31, 2004 are reduced for early retirement. The early retirement benefit reduction is 1/200th for each month between the age of 60 and 65, and 1/300th for each month between the ages of 55 and 60. Benefit payments will commence at retirement. The form of benefit payment will be elected by each participant upon retirement. The forms of benefit payment include a basic life annuity and various survivor annuities. The Defined Benefit Plan provides an annual benefit accrual determined pursuant to the following formula: (i) 1.5% of the participant’s five-year average monthly compensation (generally, salary and bonus), reduced by 0.45% of the lesser of the Social Security pay level or the participant’s five-year average monthly compensation, multiplied by (ii) years of credited service, up to a maximum of 30 years. The Social Security pay level is defined as the 35-year average of the Social Security taxable wage base. Compensation taken into account and the benefits payable under the Defined Benefit Plan are subject to the limitations imposed on qualified plans under the Internal Revenue Code.
The SERP provides benefits above the limits permitted by federal tax law for the Defined Benefit Plan, so that the total of the benefits provided by the two retirement plans is equal to the benefits that would be provided by the Defined Benefit Plan if no tax limits were applied and certain compensation not counted as compensation for purposes of the Defined Benefit Plan were counted. Participants will vest in their benefits under the SERP at the same time as they vest in their Defined Benefit Plan benefits. All of the named executive officers are vested in their benefits under the SERP. Benefit payments will commence upon retirement in the form of a single lump-sum payment. In the event that a named executive officer is terminated for cause or enters into competition with the company within two years after the termination of his or her employment, all benefits under the SERP will be forfeited, unless the Board determines that such action was taken in the best interest of the company.
The company also maintains the MacDermid, Incorporated Profit Sharing and Employee Savings Plan (the “Savings Plan”), a tax-qualified defined contribution plan designed to aid in retention and to assist employees in providing for their retirement. Each of our named executive officers participates in the Savings Plan. The company may make discretionary contributions to the Savings Plan but there were no discretionary contributions made to the Savings Plan during the fiscal year ended December 31, 2011.
Potential Payments Upon Termination or Change of Control
The company’s plans and arrangements provide for certain payments and benefits upon termination of employment and/or a change of control of the company. This section describes potential payments that would have been made to each of our named executive officers in connection with a change of control of the company and/or the termination of our named executive officer’s employment for the reasons identified below. For purposes of this section, the triggering events are assumed to have taken place on December 31, 2011. Unless otherwise specifically noted, the terms and conditions described below apply to each named executive officer on an identical basis.
114
Table of Contents
Involuntary Termination Without Cause on December 31, 2011, Not in Connection with a Change of Control
Upon an involuntary termination without cause on December 31, 2011, other than during the two year period following a change of control, each named executive officer other than Mr. Leever would have been entitled to receive, subject to his execution of a general release of claims in favor of the company, an amount equal to one year of his then-current base salary. Upon an involuntary termination without cause on December 31, 2011, regardless of whether a change of control has occurred, Mr. Leever would have been entitled to receive, subject to his execution of a general release of claims in favor of the company, an amount equal to the product of two times the sum of his then-current base salary and target bonus. The company’s 2011 Bonus Plan specifies each named executive officer’s target bonus to be used for purposes of his severance agreement.
Involuntary Termination Without Cause on December 31, 2011, in Connection with a Change of Control
Upon an involuntary termination without cause on December 31, 2011 and during the two year period following a change of control, each named executive officer other than Mr. Leever would have been entitled to receive, subject to his execution of a general release of claims in favor of the company, an amount equal to the product of two times the sum of his then-current base salary and target bonus. Upon an involuntary termination without cause on December 31, 2011, regardless of whether a change of control has occurred, Mr. Leever would have been entitled to receive, subject to his execution of a general release of claims in favor of the company, an amount equal to the product of two times the sum of his then-current base salary and target bonus. The company’s 2011 Bonus Plan specifies each named executive officer’s target bonus to be used for purposes of his severance agreement.
Change of Control Consummated on December 31, 2011 Without Termination
Upon a change of control consummated on December 31, 2011, all of the named executive officers’ unvested Class A Units, any Class B Units that were eligible to vest on March 31st of the year prior to the year of the change of control but failed to vest due to the company’s failure to achieve the applicable performance vesting target, as well as any Class B Units eligible to vest in the year of the change of control and all years following the year of the change of control, will vest. However, such accelerated vesting of the Class B Units will only occur to the extent that holders of the preferred units, common units and Class A Units receive distributions in connection with the change of control which, when added to the aggregate distributions (if any) received by the holders of the preferred units, common units and Class A Units from distributions prior to such date, equal or exceed $1,000,000,000.
Defined Terms
“Cause”, for purposes of the change of control agreements, means, in general, when a named executive officer (i) is charged with, convicted of, or pleads guilty or nolo contendere to, any crime constituting a felony or involving dishonesty or moral turpitude; (ii) engages in any activity that amounts to gross negligence and that significantly affects the business affairs or reputation of the company; (iii) fails to perform his duties, after receiving notice of such failure from the company in writing; or (iv) commits a gross or willful violation of the company’s standard policies, or the law, and such violation creates a material liability (actual or potential) for the company.
“Change of Control”, for purpose of the severance agreements, means, in general (i) an acquisition by any person or group, except for an employee benefit plan sponsored by the company, of beneficial ownership of 50% or more of the company’s voting securities in any combination; (ii) the sale of all or substantially all of the assets of the company; or (iii) individuals, who as of January 1, 2002 are members of the Board (the “Incumbents”), and any additional individuals (“Additional Directors”) who are recommended to become directors by a majority of the Incumbents and/or any then previously so recommended and elected Additional Directors, cease for any reason to constitute a majority of the Board.
115
Table of Contents
“Change of Control”, for purposes of the Class A Units and Class B Units, means, in general, such time as (1) any “person” (as such term is used in Sections 3(a)(9) and 13(d)(3) of the Exchange Act), other than (x) the other members of MacDermid Holdings, LLC and/or their respective permitted transferees (as described in the Holdings Securityholders’ Agreement), or (y) any “group” (within the meaning of such Section 13(d)(3)) of which either of the members of MacDermid Holdings, LLC constitutes a majority (on the basis of ownership interest), acquires, directly or indirectly, by virtue of the consummation of any purchase, merger or other combination, securities of MacDermid Holdings, LLC representing more than 51% of the combined voting power then outstanding voting of MacDermid Holdings, LLC securities with respect to matters submitted to a vote of the members generally; or (2) a sale or transfer by of MacDermid Holdings, LLC or any of its subsidiaries of substantially all of the consolidated assets of MacDermid Holdings, LLC and its subsidiaries to a Person other than any Person described in clauses (x) or (y) above.
Director Compensation
We did not pay our directors any compensation for serving on our Board for the years ended December 31, 2010 and 2011.
Omnibus Equity Plan
Upon consummation of this offering, we will not have an active omnibus equity plan. Omnibus equity plans typically provide for the grant of options, restricted stock, restricted stock units, performance shares or other equity-based awards to executive officers and certain other members of management. Although we have not adopted such a plan, our Board may, in its discretion, establish and adopt an omnibus equity plan in the future.
116
Table of Contents
CERTAIN RELATIONSHIPS AND RELATED PARTY TRANSACTIONS
We describe below transactions and series of similar transactions, since January 1, 2009, to which we were a party or will be a party other than compensation arrangements which are described under “Management and Board of Directors” and “Compensation Tables and Narrative Disclosures” in which:
| • | the amounts involved exceeded or will exceed $120,000; and |
| • | a director, executive officer, holder of more than 5% of our outstanding shares of common stock or any member of their immediately family had or will have a direct or indirect material interest. |
Relationship with Court Square and Weston Presidio
Securityholders’ Agreement
In connection with this offering, we will enter into the Securityholders’ Agreement with Court Square, Weston Presidio, Daniel H. Leever and our other historical management investors. The provisions of the Securityholders’ Agreement will terminate once Court Square holds less than 5.0% of our outstanding shares of common stock. The following paragraphs, which summarize certain key provisions of the Securityholders’ Agreement, are qualified in their entirety by reference to the Securityholders’ Agreement.
Board Composition
Following the consummation of this offering, our Board will consist of eight directors. The Securityholders’ Agreement will provide Court Square and Weston Presidio with the contractual right to designate directors for nomination for election to our Board. For so long as Court Square holds at least 40% of our outstanding shares of common stock, it will have the right to designate three directors for nomination for election to our Board. If Court Square holds at least 25% but less than 40% of our outstanding common shares, it will have the right to designate two directors for nomination, and, if it holds at least 7.5% but less than 25% of our outstanding common shares, it will have the right to designate one director for nomination. At such time as Court Square holds less than 7.5% of our outstanding common shares, it will not have a right to designate any directors for nomination. For so long as Weston Presidio holds at least 7.5% of our outstanding common shares, it will have the right to designate one director for nomination for election to our Board and, at such time as it holds less than 7.5% of our common shares, it will not have any right to designate any directors for nomination. The remaining directors will be nominated by the nominating and corporate governance committee and, other than our chairman and chief executive officer, will be independent directors within the meaning of the corporate governance rules of the NYSE. Any director who is nominated by Court Square or Weston Presidio may only be removed for Cause (as defined in the Securityholders’ Agreement) or with the consent of the Court Square representative or the Weston Presidio representative, as applicable.
The Securityholders’ Agreement will also provide Court Square with certain contractual rights to designate directors to the committees of our Board, subject to the applicable independence requirements of the NYSE and the fiduciary duty and other legal requirements to which our directors are subject. So long as Court Square holds at least 25% of our outstanding shares of common stock, and subject to the foregoing exceptions, at least one Court Square designee will be a member of each committee. The Securityholders’ Agreement will also provide each Court Square entity that does not have a director nominated by Court Square on the Board and Weston Presidio with the right to appoint a representative to attend meetings of the Board as a non-voting observer.
Board Action
Pursuant to the Securityholders’ Agreement, a quorum of the Board will, subject to certain exceptions, consist of a majority of the total number of directors, including a majority of the Court Square designees so long as Court Square owns at least 25% of our outstanding common shares. Further, the Securityholders’ Agreement provides that, so long as Court Square owns at least 25% of our issued and outstanding common shares, certain
117
Table of Contents
actions by us or our subsidiaries will require the approval of at least a majority of the Court Square designees (in addition to any other vote by our Board or stockholders). The actions requiring Court Square approval include certain change of control transactions, the acquisition or sale of any assets or operations with a value in excess of $50.0 million, any appointment or dismissal of our chief executive officer, any changes in the size of the Board and any amendment to our certificate of incorporation or by-laws. Also, the Securityholders’ Agreement will provide that, so long as Court Square owns at least 7.5% of our issued and outstanding common shares, our Board shall not authorize the issuance of any preferred stock of the Company without the approval of Court Square.
Transfer Restrictions
The Securityholders’ Agreement will provide that, for three years after the date thereof, Weston Presidio and Daniel H. Leever (and their permitted transferees) may transfer shares of our common stock only to (1) a third party, after the conclusion of the holdback period described below, in an amount not in excess of the greater of (A) such number of shares that would result in the transferor holding a smaller percentage of its ownership as of the consummation of this offering immediately following such transfer than the percentage of Court Square’s ownership as of the consummation of this offering then held by Court Square and its permitted affiliates and (B) one-third of the amount of such transferor’s initial ownership in any 12-month period (plus, to the extent applicable, any of our common shares that were eligible to be transferred under this clause (B) in prior twelve-month periods following the date of the Securityholders’ Agreement that were not transferred) and (2) certain specified permitted transferees.
Restricted Shares
The Securityholders’ Agreement will also contain provisions governing the transfer and vesting of the unvested Class A Units and unvested Class B Units in the Corporate Reorganization (the “Restricted Shares”). The Restricted Shares may only be transferred, in accordance with applicable securities laws, to certain permitted transferees, who must agree to be bound by the terms of the Securityholders’ Agreement and any other agreement governing the terms of the Restricted Shares. See the discussion related to the Restricted Shares set forth in the narrative disclosure following the Summary Compensation Table for a description of the vesting provisions applicable to the Restricted Shares.
Holdback Periods and Registration Rights
Under the Securityholders’ Agreement, we and each securityholder party thereto have agreed not to effect any public sale or distribution (including sales pursuant to Rule 144 and Rule 144A under the Securities Act) of any securities of the company during the 14 days prior to the effective date of any registration statement filed by the company or during the period after such effective date equal to the lesser of (1) such period of time agreed to by us and the lead underwriter for such offering, and (2) 180 days with respect to this offering and 90 days with respect to any other public offering (as defined in the Securityholders’ Agreement), in each case subject to certain exceptions.
The Securityholders’ Agreement provides Court Square with the right to demand registrations, which may be underwritten in certain circumstances. These demand rights may be exercised at any time, subject to the holdback periods described in the preceding paragraph and provided that the gross aggregate proceeds expected to be received from the sale of shares included in a demand are at least $25.0 million (or $5.0 million in the case of a short-form registration). In addition, in the event that we are registering additional common shares for sale to the public, whether on our own behalf or pursuant to a Court Square demand, Court Square and the other parties to the Securityholders’ Agreement will have “piggyback” registration rights providing them the right to have us include the common shares owned by them in any such registration. Such securityholder’s right to include shares in an underwritten registration is, however, subject to the ability of the underwriters to limit the number of shares included in such offering. All expenses of such registrations (including both demand and “piggyback” registrations), other than underwriting fees, discounts and commissions, certain out-of-pocket expenses of the securityholders and fees or expenses of underwriters’ counsel, will be borne by us.
118
Table of Contents
Advisory Agreement
We are party to advisory agreements with Court Square and Weston Presidio, pursuant to which such entities provide advisory services to us and receive specified consideration for such services. The advisory agreements require us to pay $0.4 million and $0.1 million annually to Court Square and Weston Presidio, respectively, for these advisory services. We expect to terminate the advisory agreements in connection with this offering. Upon termination of the advisory agreements and the consummation of this offering, Court Square and Weston Presidio will receive aggregate payments from us of $ million and $ million, respectively. The advisory agreements include customary exculpation and indemnification provisions in favor of Court Square and Weston Presidio.
SGS International
Joseph M. Silvestri, one of our directors, has served and continues to serve as a director and a member of the audit committee of one of our customers, SGS International, Inc. Investment funds managed by Court Square, an affiliate of three of our directors, indirectly own approximately 72% and 80% of this customer’s outstanding common and preferred stock, respectively, and have indirectly held a controlling interest in SGS International, Inc. since December 2005. Net sales to this customer accounted for approximately $4.3 million in 2011, $5.4 million in 2010, and $3.2 million in 2009. We believe that these sales, which represent less than 1% of our net sales in all three periods, were made on terms at least as favorable as we would have made available to other customers. We continue to sell products to this customer.
CIGNA
The brother of John L. Cordani, one of our executive officers, has served and continues to serve as the chief executive officer of CIGNA Corporation (“CIGNA”), the parent company of the health insurance carrier for our domestic employees. We paid approximately $5.2 million in 2011, $4.9 million in 2010 and $5.3 million in 2009 in premiums to CIGNA. We believe that the terms of our contract with CIGNA are customary for a company our size in our industry and do not represent a significant portion of CIGNA’s revenues. We continue to use CIGNA as the health insurance carrier for our domestic employees.
Policy Concerning Related Party Transactions
Our Board has adopted a written policy relating to the approval of related party transactions. Under the policy, our employees, officers and directors are discouraged from entering into any transaction that may cause a conflict of interest for MacDermid Group, Inc. In addition, they must report any potential conflict of interest, including related party transactions, to their supervisors or to our legal department. Pursuant to its charter, our audit committee is required to evaluate each related person transaction for the purpose of recommending to the disinterested members of our Board that the transactions are fair, reasonable and within our policy, and should be ratified and approved by the Board.
In evaluating such proposed transactions, the audit committee is required to consider the relevant facts and circumstances available and deemed relevant to the audit committee, including:
| • | the benefits of the transaction to the company; |
| • | the terms of the transaction and whether the transaction is arm’s-length and in the ordinary course of the company’s business; |
| • | the direct or indirect nature of the related person’s interest in the transaction; |
| • | the size and expected term of the transaction; and |
| • | other facts and circumstances that bear on the materiality of the related person transaction under applicable law and listing standards. |
119
Table of Contents
Our audit committee will recommend approval of only those transactions that, in light of the known circumstances, are in, or are not inconsistent with, our best interests, as our audit committee determines in the good faith exercise of its discretion.
Indemnification Agreements
We expect to enter into indemnification agreements with the directors and executive officers of MacDermid Group, Inc. prior to the consummation of this offering. These indemnification agreements will provide, among other things, that we will indemnify our directors and executive officers, under the circumstances and to the extent provided for therein, for expenses, damages, judgments, fines and settlements that they may be required to pay in actions or proceedings which they are or may be made a party by reason of any such person’s position as a director or executive officer of the company, subject to, and to the maximum extent permitted by, applicable law.
120
Table of Contents
The following table sets forth information regarding the beneficial ownership of our common stock as of March 31, 2012, (1) immediately prior to this offering (giving effect to the Corporate Reorganization) and (2) as adjusted to give effect to this offering and the Corporate Reorganization, for:
| • | each person known by us to beneficially own more than 5% of our common stock prior to the consummation of this offering and after giving effect to the Corporate Reorganization; |
| • | each of our executive officers; |
| • | each of our directors and our nominee director; and |
| • | all of our directors (including our nominee director) and executive officers as a group. |
Beneficial ownership for the purposes of the following table is determined in accordance with the rules and regulations of the SEC. These rules generally provide that a person is the beneficial owner of securities if they have or share the power to vote or direct the voting thereof, or to dispose or direct the disposition thereof or have the right to acquire such powers within 60 days.
Unless otherwise indicated, the address of each person named in the table below is c/o MacDermid Group, Inc., 1401 Blake Street, Denver, Colorado 80202.
| Shares of MacDermid Group, Inc. common stock beneficially owned prior to this offering |
Shares of MacDermid Group, Inc. common stock beneficially owned after this offering | |||||||
| Beneficial Owner |
Number | % | Number | % | ||||
| 5% Stockholders: |
||||||||
| Court Square |
||||||||
| Weston Presidio |
||||||||
| Savings Plan |
||||||||
| Directors and Officers: |
||||||||
| Daniel H. Leever |
||||||||
| Frank J. Monteiro |
||||||||
| John L. Cordani |
||||||||
| Michael V. Kennedy |
||||||||
| Jerry A. Mitchell |
||||||||
| Joseph M. Silvestri |
||||||||
| Kevin D. Brown |
||||||||
| David L. Ferguson(1) |
||||||||
| Michael F. Finley |
||||||||
| T. Quinn Spitzer, Jr. |
||||||||
| Directors and Officers as a Group (10 persons): |
||||||||
| (1) | Mr. Ferguson disclaims beneficial ownership of the shares held by Weston Presidio V, L.P., except to the extent of his pecuniary interest therein. |
121
Table of Contents
Our authorized capital stock consists of shares, the rights and preferences of which may be established from time to time by our Board, which will be made up of:
| • | 500,000,000 shares of common stock, $0.01 par value; and |
| • | 10,000,000 shares of preferred stock, $1.00 par value. |
Upon completion of this offering, there will be outstanding shares of common stock ( shares if the underwriters’ over-allotment is exercised in full), and no outstanding shares of preferred stock.
The following is a summary of our capital stock and important provisions of our restated certificate of incorporation (“certificate of incorporation”) and amended and restated by-laws (“by-laws”), as will be in effect immediately following this offering. Reference is made to our certificate of incorporation and by-laws, copies of which are filed as exhibits to the Registration Statement.
Common Stock
The holders of our common stock are entitled to one vote per share on all matters voted upon by our stockholders, including the election or removal of directors, and do not have cumulative voting rights. Generally, all matters to be voted on by stockholders must be approved by a majority of the votes entitled to be cast by the holders of common stock present in person or represented by proxy, subject to any voting rights granted to holders of any preferred stock.
Subject to the rights of holders of any then outstanding shares of our preferred stock, holders of our common stock are entitled to receive ratably any dividends that may be declared by our Board out of funds legally available therefor. Holders of our common stock are also entitled to share ratably in our net assets upon our dissolution or liquidation after payment or provision for all liabilities and any preferential liquidation rights of our preferred stock then outstanding.
Holders of our common stock do not have preemptive rights to purchase shares of our common stock. Further, shares of our common stock are not subject to any redemption provisions and are not convertible into any other shares of our capital stock. All outstanding shares of our common stock are validly issued, fully paid and nonassesable. The rights, preferences and privileges of holders of our common stock will be subject to those of the holders of any shares of our preferred stock, which we may issue in the future.
Blank Check Preferred Stock
Our Board may, from time to time, authorize the issuance of one or more classes or series of preferred stock without stockholder approval. However, the Securityholders’ Agreement will provide that, so long as Court Square owns at least 7.5% of our issued and outstanding common shares, our Board shall not authorize the issuance of any preferred stock of the Company without the approval of Court Square. We have no current intention to issue any shares of preferred stock.
Our certificate of incorporation permits us to issue up to 10,000,000 shares of preferred stock from time to time. Subject to the provisions of our certificate of incorporation and limitations prescribed by law, our Board is authorized to adopt resolutions to issue shares, establish the number of shares, change the number of shares constituting any series, and provide or change the voting powers, designations, preferences and relative rights, qualifications, limitations or restrictions on shares of our preferred stock, including dividend rights, terms of redemption, conversion rights and liquidation preferences, in each case without any action or vote by our stockholders.
The issuance of preferred stock may adversely affect the rights of our common stockholders by, among other things:
| • | restricting dividends on our common stock; |
122
Table of Contents
| • | diluting the voting power of our common stock; |
| • | impairing the liquidation rights of our common stock; or |
| • | delaying or preventing a change of control without further action by the stockholders. |
As a result of these or other factors, the issuance of preferred stock could have an adverse impact on the market price of our common stock.
Anti-takeover Effects of Certain Provisions of Our Certificate of Incorporation and By-laws
General
Our certificate of incorporation and by-laws contain provisions that are intended to enhance the likelihood of continuity and stability in the composition of our Board and that could make it more difficult to acquire control of the company by means of a tender offer, open market purchases, a proxy contest or otherwise. A description of these provisions is set forth below.
No Cumulative Voting
Under Delaware law, the right to vote cumulatively does not exist unless the certificate of incorporation specifically authorizes cumulative voting. Our certificate of incorporation does not grant stockholders the right to vote cumulatively.
Blank Check Preferred Stock
We believe that the availability of the preferred stock under our certificate of incorporation provides us with flexibility in addressing corporate issues that may arise. Having these authorized shares available for issuance will allow us to issue shares of preferred stock without the expense and delay of a special stockholders’ meeting. The authorized shares of preferred stock, as well as shares of our common stock, will be available for issuance without further action by our stockholders, unless action is required by applicable law or the rules of any stock exchange on which our securities may be listed. However, the Securityholders’ Agreement will provide that, so long as Court Square owns at least 7.5% of our issued and outstanding common shares, our Board shall not authorize the issuance of any preferred stock of the Company without the approval of Court Square. Our Board has the power, subject to applicable law, to issue series of preferred stock that could, depending on the terms of the series, impede the completion of a merger, tender offer or other takeover attempt. For instance, subject to applicable law, series of preferred stock might impede a business combination by including class voting rights which would enable the holder or holders of such series to block a proposed transaction. Our Board will make any determination to issue shares based on its judgment as to our and our stockholders’ best interests. Our Board, in so acting, could issue preferred stock having terms which could discourage an acquisition attempt or other transaction that some, or a majority, of the stockholders might believe to be in their and our best interests or in which stockholders might receive a premium for their stock over the then prevailing market price of the stock.
Stockholder Action by Written Consent
So long as Court Square and Weston Presidio own shares of our common stock representing greater than 50% of the total voting power of the outstanding shares generally entitled to elect our directors, any action required or permitted to be taken by our stockholders may be effected by written consent in lieu of a meeting, without prior notice and without a vote, if a consent or consents in writing, setting forth the action to be taken, are signed by the holders of outstanding stock having not less than the minimum number of votes necessary to authorize such action. Court Square and Weston Presidio, acting collectively, will have enough shares of our common stock to amend our certificate of incorporation. That, coupled with their ability to take action by written consent, may have the effect of delaying, deterring or preventing a merger, tender offer or other takeover attempt that a stockholder might consider in its or our best interest. Once Court Square and Weston Presidio, collectively, cease to beneficially own shares of our common stock representing greater than 50% of the total voting power of the outstanding shares generally entitled to elect our directors, and subject to the terms of any series of preferred
123
Table of Contents
stock, any action required or permitted to be taken by our stockholders must be effected at an annual or special meeting of the stockholders and may not be effected by written consent in lieu of a meeting.
Advance Notice Procedure
Our by-laws provide an advance notice procedure for stockholders to nominate director candidates for election or to bring business before an annual meeting of stockholders, including proposed nominations of persons for election to our Board. Only persons nominated by, or at the direction of, our Board or by a stockholder who has given proper and timely notice to our secretary prior to the meeting will be eligible for election as a director. However, our by-laws provide that, so long as the Securityholders’ Agreement is in effect, Court Square and Weston Presidio will be able to nominate persons for director or bring business before an annual meeting of stockholders without advance notice. In addition, any proposed business other than the nomination of persons for election to our Board must constitute a proper matter for stockholder action pursuant to the notice of meeting delivered to us. These advance notice provisions may have the effect of precluding the conduct of certain business at a meeting if the proper procedures are not followed or may discourage or deter a potential acquirer from conducting a solicitation of proxies to elect its own slate of directors or otherwise attempt to obtain control of us.
Special Meetings of Stockholders
Our by-laws provide that special meetings of stockholders may be called only by a majority of our Board. Following the date that Court Square and Weston Presidio each owns less than 7.5% of our issued and outstanding common shares, the Chairman of the Board may also call special meetings of stockholders.
Amendments to our By-laws
Our by-laws generally provide that they may amended by (a) the affirmative vote of holders of our capital stock representing at least a majority of the votes of all series of our capital stock entitled to be cast on the election of directors, voting together as a single class, or (b) the majority of our Board. However, notwithstanding the foregoing, (i) certain provisions of our by-laws (including provisions related special meetings of stockholders, advance notice, the Board’s quorum, notice of Board meetings, Board vacancies, the removal of directors and indemnification) may not be amended at any time Court Square owns greater than 7.5% in voting power of our issued and outstanding capital stock unless Court Square votes all shares held by it in favor of such amendment and (ii) no provision of our by-laws may be amended at any time Court Square owns greater than 25.0% in voting power of our issued and outstanding capital stock unless Court Square votes all shares held by it in favor of such amendment.
Delaware Anti-Takeover Law
Section 203 of the Delaware General Corporation Law (“DGCL”) provides that, subject to exceptions specified therein, an “interested stockholder” of a Delaware corporation shall not engage in any “business combination”, including general mergers or consolidations or acquisitions of additional shares of the corporation, with the corporation for a three-year period following the time that such stockholder becomes an interested stockholder unless:
| • | prior to such time, the board of directors of the corporation approved either the business combination or the transaction which resulted in the stockholder becoming an interested stockholder; |
| • | upon consummation of the transaction which resulted in the stockholder becoming an “interested stockholder”, the interested stockholder owned at least 85% of the voting stock of the corporation outstanding at the time the transaction commenced (excluding specified shares); or |
| • | on or subsequent to such time, the business combination is approved by the board of directors of the corporation and authorized at an annual or special meeting of stockholders, and not by written consent, by the affirmative vote of at least 66 2/3% of the outstanding voting stock not owned by the interested stockholder. |
124
Table of Contents
Under Section 203, the restrictions described above also do not apply to specified business combinations proposed by an interested stockholder following the announcement or notification of one of the specified transactions involving the corporation and a person who had not been an interested stockholder during the previous three years or who became an interested stockholder with the approval of a majority of the corporation’s directors, if such transaction is approved or not opposed by a majority of the directors who were directors prior to any person becoming an interested stockholder during the previous three years or were recommended for election or elected to succeed such directors by a majority of such directors.
Except as otherwise specified in Section 203, an “interested stockholder” is defined to include:
| • | any person that is the owner of 15% or more of the outstanding voting stock of the corporation, or is an affiliate or associate of the corporation and was the owner of 15% or more of the outstanding voting stock of the corporation at any time within three years immediately prior to the date of determination; and |
| • | the affiliates and associates of any such person. |
Under some circumstances, Section 203 makes it more difficult for a person who is an interested stockholder to effect various business combinations with us for a three-year period. Our certificate of incorporation provides that we have elected to be exempt from the restrictions imposed under Section 203.
Choice of Forum
Unless we consent in writing to the selection of an alternative forum, our certificate of incorporation provides that the Delaware Court of Chancery will be the exclusive forum for (i) any derivative action or proceeding brought on our behalf, (ii) any action asserting a breach of fiduciary duty, (iii) any action asserting a claim against us arising under the Delaware General Corporation Law, our certificate of incorporation or our by-laws or (iv) any action asserting a claim against us that is governed by the internal affairs doctrine, in each case subject to the Delaware Court of Chancery having personal jurisdiction over the indispensable parties named as defendants in such action or proceeding. Although our certificate of incorporation includes this provision, it is possible that a court could rule that this provision is inapplicable or unenforceable.
Limitation of Liability of Directors and Officers
Our certificate of incorporation limits the liability of directors to the fullest extent permitted by Delaware law. The effect of these provisions is to eliminate the rights of us and our stockholders, through stockholders’ derivative suits on behalf of the company, to recover monetary damages from a director for breach of fiduciary duty as a director, including breaches resulting from grossly negligent behavior. However, exculpation does not apply to any director if the director has acted in bad faith, knowingly or intentionally violated the law, authorized illegal dividends or redemptions or derived an improper benefit from his or her actions as a director. In addition, our certificate of incorporation and our by-laws provide that we indemnify our directors and officers to the fullest extent permitted by Delaware law. We also expect to maintain directors and officers liability insurance.
Transfer Agent and Registrar
The transfer agent and registrar for our common stock is Computershare Trust Company, N.A.
125
Table of Contents
DESCRIPTION OF CERTAIN INDEBTEDNESS OF MACDERMID, INCORPORATED
Senior Secured Credit Facilities
Overview
On April 12, 2007, MacDermid Holdings, LLC, MacDermid, Incorporated and certain of MacDermid, Incorporated’s subsidiaries entered into the credit agreement governing the Credit Facilities with Credit Suisse, as administrative and collateral agent and the other lenders and agents party thereto. The Credit Facilities consist of (1) the $360.0 million Tranche B Facility denominated in U.S. Dollars, (2) the $250.0 million Tranche C Facility denominated in Euros, and (3) the $50.0 million Revolving Credit Facility denominated in U.S. Dollars. A portion of the Revolving Credit Facility not in excess of $15.0 million is available for the issuance of letters of credit. Pursuant to the terms of an amendment to the credit agreement governing the Credit Facilities, upon consummation of the Corporate Reorganization, MacDermid Group, Inc. will replace MacDermid Holdings, LLC as the parent guarantor of the Credit Facilities and all covenants and agreements applicable to MacDermid Holdings, LLC will then apply to MacDermid Group, Inc.
As of March 31, 2012, MacDermid, Incorporated had $220.4 million of indebtedness outstanding under the Tranche B Facility, $151.0 million of indebtedness outstanding under the Tranche C Facility, no borrowings outstanding under the Revolving Credit Facility and $46.1 million of availability under the Revolving Credit Facility.
Prior to the completion of this offering, all obligations under the Credit Facilities are unconditionally guaranteed by MacDermid Holdings, LLC and certain of its direct and indirect wholly owned domestic subsidiaries. Following the consummation of the Corporate Reorganization, all obligations under the Credit Facilities will be unconditionally guaranteed by MacDermid Group, Inc. and its wholly owned domestic subsidiaries.
Collateral
The loans are secured by a perfected first priority security lien and interest in, subject to customary exceptions, exclusions and release mechanisms, (a) all the issued and outstanding equity interests of each present and future U.S. subsidiary of MacDermid, Incorporated or any of the guarantors, (b) 65% of the issued and outstanding voting equity interests and all the issued and outstanding non-voting equity interests, in either case, of each present and future foreign subsidiary directly owned by MacDermid, Incorporated or any of the guarantors and (c) all existing and future property and assets, real (other than foreign and certain other properties) and personal of MacDermid, Incorporated or any of the guarantors, and all proceeds and products of such property and assets.
Interest Rates and Fees
The loans under the Tranche B Facility and the Revolving Credit Facility bear interest at an alternate base rate or LIBOR-based rate, at MacDermid, Incorporated’s option. The loans under the Tranche C Facility bear interest at a EURIBOR-based rate only. The alternate base rate is equal to the sum of (a) the higher of (1) the rate of interest determined by the administrative agent from time to time at its prime rate and (2) the federal funds rate plus 0.50 percent, and (b) an applicable margin. The LIBOR-based rate is equal to the sum of (a) the product of (1) the London Interbank Offered Rate, or LIBOR, and (2) certain statutorily required reserves, for the applicable interest period selected by the borrower of 1, 2, 3 or 6 months or, if available, 9 or 12 months, and (b) an applicable margin. The EURIBOR-based rate is equal to the sum of (a) the product of (1) the Euro Interbank Offered Rate, or EURIBOR, and (2) certain statutorily required reserves, for the applicable interest period selected by the borrower of 1, 2, 3 or 6 months or, if available, 9 or 12 months, and (b) an applicable margin.
126
Table of Contents
In addition to the requirement to pay interest on outstanding principal under the Credit Facilities, MacDermid, Incorporated is required to pay quarterly (1) a commitment fee equal to an applicable rate determined by reference to a corporate ratings condition multiplied by the average daily undrawn portion of the commitments under the Revolving Credit Facility and (2) customary letter of credit fees.
In connection with the letters of credit, MacDermid, Incorporated is also required to pay to the issuing bank certain customary fronting fees and processing charges.
Prepayments
Mandatory Prepayments
If at any time the aggregate amount of outstanding loans, unreimbursed letter of credit drawings and undrawn letters of credit under the Revolving Credit Facility exceeds the total commitments then in effect under the Revolving Credit Facility, MacDermid, Incorporated is required to prepay all such outstanding loans or to cash collateralize the letters of credit in an aggregate amount equal to such excess or to do both. In addition, MacDermid, Incorporated is required to prepay outstanding loans with, subject to certain exceptions, the following:
| • | the net cash proceeds from certain sales of property and assets of the company; |
| • | 50% of the net cash proceeds from certain equity issuances of MacDermid Holdings, LLC and MacDermid, Incorporated (but only 25% thereof if, on the date of prepayment, the consolidated leverage ratio is less than 5.00 to 1.00), provided that, pursuant to an amendment to the credit agreement governing the Credit Facilities, in the case of this offering, such percentage shall be 50% with respect to the proceeds thereof regardless of the consolidated leverage ratio on the date of prepayment; |
| • | the net cash proceeds from the incurrence of additional indebtedness; and |
| • | 50% of the excess cash flow of MacDermid, Incorporated and its subsidiaries for the fiscal year then ended less the aggregate amount of all voluntary prepayments during such fiscal year (but only 25% thereof if, on the date of the prepayment, the consolidated leverage ratio is less than 5.00 to 1.00 but greater than or equal to 4.00 to 1.00, and, alternatively, zero percent thereof if, on such date, the consolidated leverage ratio is less than 4.00 to 1.00). |
Voluntary Prepayments
MacDermid, Incorporated may, upon prior notice, prepay loans under the Credit Facilities in full or in part without premium or penalty. All prepayments are required to be in a principal amount of $1.0 million or, if in greater amounts, in integral multiples of $0.5 million. In addition, each prepayment with respect to a LIBOR-based loan must include, among other things, reimbursement for any funding losses of the lenders resulting from the prepayment. MacDermid, Incorporated may also voluntarily reduce the undrawn portion of the commitments under the Revolving Credit Facility without premium or penalty.
Covenants
The Credit Facilities contain customary representations and warranties and customary affirmative and negative covenants. The negative covenants include, among other things and subject to certain exceptions, restrictions on liens, indebtedness, fundamental changes, dispositions, affiliate transactions, dividends and other distributions, entry into new lines of business, use of loan proceeds, capital expenditures, amendments to organizational documents, accounting changes and sale and leaseback transactions. The credit agreement governing the Credit Facilities also requires MacDermid, Incorporated to comply with consolidated leverage and interest coverage ratios and limitations on capital expenditures if usage under the Revolving Credit Facility exceeds $10.0 million for ten days or more in any fiscal quarter. As of March 31, 2012, MacDermid, Incorporated had no borrowings under the Revolving Credit Facility.
127
Table of Contents
Events of Default
Events of default, which are subject to customary grace periods and exceptions, where appropriate, as defined under the Credit Facilities, include:
| • | failure to pay principal when due or to pay interest or other amounts within five business days after they become due; |
| • | failure to perform or observe covenants in the credit agreement governing the Credit Facilities within a specified period of time; |
| • | any representation, warranty, certification or statement of fact, providing to have been materially incorrect or misleading when made or deemed made; |
| • | occurrence of a default upon other indebtedness in an amount exceeding $15.0 million; |
| • | involvement in bankruptcy or insolvency proceedings, with grace periods for involuntary proceedings; |
| • | issuance or levy of any writ or warrant of attachment or execution or similar process against any material part of the property of MacDermid Holdings, LLC, MacDermid, Incorporated or certain of MacDermid, Incorporated’s subsidiaries, without it being released, vacated or fully bonded within 30 days after its issue or levy; |
| • | receipt of a final judgment or order for the payment of money in an aggregate amount exceeding $15.0 million, or one or more non-monetary final judgments that have or could reasonably be expected to have, individually or in the aggregate, a material adverse effect on MacDermid Holdings, LLC, MacDermid, Incorporated or its subsidiaries; |
| • | certain violations of provisions of the Employee Retirement Income Security Act of 1974, as amended; |
| • | impairment of any loan documentation or security; |
| • | failure of any indebtedness under the Senior Subordinated Notes to remain validly subordinated to the loan obligations under the Credit Facilities; and |
| • | change of ownership or operating control. |
Maturity
The Revolving Credit Facility will mature on April 12, 2014, and the Tranche B Facility and Tranche C Facility will expire on April 12, 2014.
Japanese Senior Secured Bank Debt
In February 2007, in connection with the Acquisition, MacDermid, Incorporated entered into a senior secured credit facility with three Japanese banks. As of March 31, 2012, we had $8.0 million of indebtedness outstanding under our Japanese debt. These borrowings are under four separate notes and have maturity dates ranging from 2012 through 2014. Our weighted average interest rate for our Japanese debt was 1.88% as of March 31, 2012. The first outstanding note of approximately $2.1 million has a maturity date of March 26, 2014 and a fixed interest rate of 1.47% per annum. The second outstanding note of approximately $1.1 million has a maturity date of May 28, 2012 and a fixed interest rate of 1.41% per annum. The third outstanding note of approximately $1.2 million has a maturity date of September 29, 2014 and a fixed interest rate of 1.42% per annum. The fourth outstanding note of approximately $3.6 million has a maturity date of August 20, 2014 and a fixed interest rate of 2.40% per annum. Interest and principal payments on each of the notes are due on a semi-annual basis, except for the fourth note, for which interest and principal payments are due on a monthly basis. Each of these notes is secured by the assets of MacDermid Japan.
128
Table of Contents
Other Credit Facilities
MacDermid, Incorporated also has various other uncommitted short-term facilities, with no balances outstanding as of March 31, 2012. MacDermid, Incorporated also has various overdraft facilities available, which total approximately $23.4 million of availability as of March 31, 2012.
Senior Subordinated Notes
MacDermid, Incorporated currently has outstanding $350.0 million of Senior Subordinated Notes with a fixed interest rate of 9.50% at par. The Senior Subordinated Notes mature April 15, 2017. Interest on the Senior Subordinated Notes is due semi-annually on April 15th and October 15th and the principal amount is payable at maturity on April 15, 2017.
Under the terms of the indenture governing the Senior Subordinated Notes, on or after April 15, 2012, MacDermid, Incorporated may redeem some or all of the Senior Subordinated Notes upon not less than 30 nor more than 60 days prior notice mailed to each holder thereof at the redemption prices set forth below plus accrued and unpaid interest to the redemption date if redeemed during the 12-month period beginning on April 15 of the years set forth below:
| Year |
Percentage | |||
| 2012 |
104.750 | % | ||
| 2013 |
103.167 | % | ||
| 2014 |
101.583 | % | ||
| 2015 and thereafter |
100.000 | % | ||
All obligations under the Senior Subordinated Notes are unconditionally guaranteed on an unsecured senior subordinated basis by MacDermid, Incorporated’s wholly owned domestic subsidiaries.
The indenture governing the Senior Subordinated Notes contains customary representations and warranties and customary affirmative and negative covenants. The negative covenants include, among other things and subject to certain exceptions, restrictions on liens, indebtedness, fundamental changes, dispositions, affiliate transactions and dividends and other distributions.
129
Table of Contents
SHARES ELIGIBLE FOR FUTURE SALE
Prior to this offering, there was no public market for our common stock. Future sales of substantial amounts of shares of our common stock or the possibility of these sales occurring could cause the prevailing market price for our common stock to fall or impair our ability to raise equity capital in the future.
Upon the completion of this offering a total of shares of common stock will be outstanding. Of these shares, all shares of common stock sold in this offering by us, plus any shares sold upon exercise of the underwriters’ option to purchase additional shares, will be freely tradable in the public market without restriction or further registration under the Securities Act, unless these shares are held by “affiliates”, as that term is defined in Rule 144 under the Securities Act.
The remaining shares of our common stock will be “restricted securities”, as that term is defined in Rule 144 under the Securities Act. These restricted securities are eligible for public sale only if they are registered under the Securities Act or if they qualify for an exemption from registration under Rule 144 under the Securities Act, which is summarized below. Of these remaining shares, shares beneficially owned by Court Square, Weston Presidio, Daniel H. Leever and certain of our other officers and employees, which amount to approximately % of the remaining shares of our common stock, will be subject to lock-up agreements restricting the sale of such shares for 180 days from the date of this prospectus, subject to certain extensions. However, Credit Suisse Securities (USA) LLC, Morgan Stanley & Co. LLC and Deutsche Bank Securities Inc. may waive this restriction and allow these stockholders to sell their shares at any time. These shares will all become eligible for resale in the public market from time to time following such lock-up period when the applicable holding period under Rule 144 has been met with respect to such shares.
Rule 144
In general, under Rule 144, beginning 90 days after the date of this prospectus, a person who is not our affiliate and has not been our affiliate at any time during the preceding three months will be entitled to sell any shares of our common stock that such person has beneficially owned for at least six months, including the holding period of any prior owner other than one of our affiliates, without regard to volume limitations. Sales of our common stock by any such person would be subject to the availability of current public information about us if the shares to be sold were beneficially owned by such person for less than one year.
Beginning 90 days after the date of this prospectus, our affiliates who have beneficially owned shares of our common stock for at least six months, including the holding period of any prior owner other than one of our affiliates, would be entitled to sell within any three-month period a number of shares that does not exceed the greater of:
| • | 1% of the number of shares of our common stock then-outstanding, which will equal approximately shares immediately after this offering; and |
| • | the average weekly trading volume in our common stock during the four calendar weeks preceding the date of filing of a Notice of Proposed Sale of Securities Pursuant to Rule 144 with respect to the sale. |
Sales under Rule 144 by our affiliates are also subject to manner of sale provisions and notice requirements and to the availability of current public information about us.
Lock-Up Agreements
In connection with this offering, Court Square, Weston Presidio, Daniel H. Leever and certain of our other officers and directors have agreed with the underwriters, subject to certain exceptions, not to dispose of or hedge any of our common stock or securities convertible into or exchangeable for shares of common stock, file or cause to be filed a registration statement covering shares of common stock or any securities that are convertible into, exchangeable for, or represent the right to receive, common stock or any substantially similar securities, or
130
Table of Contents
publicly disclose the intention to do any of the foregoing, during the period from the date of this prospectus continuing through the date 180 days after the date of this prospectus, except with the prior written consent of Credit Suisse Securities (USA) LLC, Morgan Stanley & Co. LLC and Deutsche Bank Securities Inc. This agreement is subject to certain exceptions, as set forth in “Underwriting”.
Registration Rights
Upon completion of this offering, the holders of approximately shares of our common stock or their transferees will be entitled to various rights with respect to the registration of these shares under the Securities Act. Except for shares purchased by affiliates, registration of these shares under the Securities Act would result in these shares becoming fully tradable without restriction under the Securities Act immediately upon the effectiveness of the registration, subject to the expiration of the lock-up period. See “Certain Relationships and Related Party Transactions” for additional information.
Registration Statement
Following the completion of this offering, we intend to file a registration statement on Form S-8 under the Securities Act, including a reoffer prospectus, to register the shares of our common stock held by the Savings Plan after the Corporate Reorganization or issued to the Savings Plan thereafter. For more information about these shares, see “The Corporate Reorganization”. The registration statement will become effective immediately upon filing. Other than shares subject to lock-up agreements, shares covered by the registration statement will be eligible for resale in the public market immediately after the effective date. Shares subject to lock-up agreements will not be eligible for resale until the expiration of the applicable lock-up period.
131
Table of Contents
MATERIAL U.S. FEDERAL INCOME AND ESTATE TAX
CONSIDERATIONS FOR NON-U.S. STOCKHOLDERS
The following discussion is a general summary of material U.S. federal income and estate tax considerations with respect to your acquisition, ownership and disposition of our common stock, and applies if you (1) purchase our common stock in this offering, (2) will hold the common stock as a capital asset and (3) are a “non-U.S. Holder”. You are a non-U.S. Holder if you are a beneficial owner of shares of our common stock other than:
| • | an individual citizen or resident of the United States; |
| • | a corporation or other entity taxable as a corporation created or organized in, or under the laws of, the United States, any state thereof or the District of Columbia; |
| • | an estate, the income of which is subject to U.S. federal income taxation regardless of its source; |
| • | a trust, if a court within the United States is able to exercise primary supervision over the administration of the trust and one or more U.S. persons have the authority to control all substantial decisions of the trust; or |
| • | a trust that has a valid election in place to be treated as a U.S. person for U.S. federal income tax purposes. |
This summary does not address all of the U.S. federal income and estate tax considerations that may be relevant to you in the light of your particular circumstances or if you are a beneficial owner subject to special treatment under U.S. federal income tax laws (such as if you are a controlled foreign corporation, passive foreign investment company, company that accumulates earnings to avoid U.S. federal income tax, foreign tax-exempt organization, financial institution, broker or dealer in securities, insurance company, regulated investment company, real estate investment trust, person who holds our common stock as part of a hedging or conversion transaction or as part of a short-sale or straddle, U.S. expatriate, former long-term permanent resident of the United States or partnership or other pass-through entity for U.S. federal income tax purposes). This summary does not discuss non-income taxes (except U.S. federal estate tax), any aspect of the U.S. federal alternative minimum tax or state, local or non-U.S. taxation. This summary is based on current provisions of the Internal Revenue Code of 1986, as amended (the “Code”), Treasury regulations, judicial opinions, published positions of the Internal Revenue Service (the “IRS”) and all other applicable authorities (all such sources of law, “Tax Authorities”). The Tax Authorities are subject to change, possibly with retroactive effect.
If a partnership (or an entity or arrangement classified as a partnership for U.S. federal income tax purposes) holds our common stock, the tax treatment of a partner will generally depend on the status of the partner and the activities of the partnership. If you are a partner of a partnership holding our common stock, you should consult your tax advisor.
WE URGE PROSPECTIVE NON-U.S. HOLDERS TO CONSULT THEIR OWN TAX ADVISORS REGARDING THE UNITED STATES FEDERAL, STATE, LOCAL AND NON-UNITED STATES INCOME AND OTHER TAX CONSIDERATIONS OF ACQUIRING, HOLDING AND DISPOSING OF SHARES OF COMMON STOCK.
Dividends
In general, any distributions we make to you with respect to your shares of common stock that constitute dividends for U.S. federal income tax purposes will be subject to U.S. withholding tax at a rate of 30% of the gross amount, unless you are eligible for a reduced rate of withholding tax under an applicable income tax treaty and you properly file with the payor an IRS Form W-8BEN, or successor form, claiming an exemption from or reduction in withholding under the applicable income tax treaty (special certification and other requirements may apply if our common stock is held through certain foreign intermediaries). A distribution will constitute a dividend for U.S. federal income tax purposes to the extent of our current or accumulated earnings and profits as determined under the Tax Authorities. Any distribution to the extent not constituting a dividend will be treated first as reducing your basis in your shares of our common stock and, to the extent it exceeds your basis, as capital gain.
132
Table of Contents
Dividends we pay to you that are effectively connected with your conduct of a trade or business within the United States (and, if certain income tax treaties apply, are attributable to a U.S. permanent establishment maintained by you) generally will not be subject to U.S. withholding tax if you provide an IRS Form W-8ECI, or successor form, to the payor. Instead, such dividends generally will be subject to U.S. federal income tax, net of certain deductions, at the same graduated individual or corporate rates applicable to U.S. persons. If you are a corporation, effectively connected income may also be subject to a “branch profits tax” at a rate of 30% (or such lower rate as may be specified by an applicable income tax treaty).
Sale or Other Disposition of Our Common Stock
You generally will not be subject to U.S. federal income tax on any gain realized upon the sale or other disposition of your shares of our common stock unless:
| • | the gain is effectively connected with your conduct of a trade or business within the United States (and, under certain income tax treaties, is attributable to a U.S. permanent establishment you maintain); |
| • | you are an individual, you are present in the United States for 183 days or more in the taxable year of disposition and you meet other conditions, and you are not eligible for relief under an applicable income tax treaty; or |
| • | we are or have been a “United States real property holding corporation” for U.S. federal income tax purposes (which we believe we are not and do not anticipate we will become) and, as long as our common stock is regularly traded on an established securities market, you hold or have held, directly or indirectly, at any time within the shorter of the five-year period ending on the date of disposition or your holding period for our common stock, more than 5% of our common stock. |
Gain that is effectively connected with your conduct of a trade or business within the United States generally will be subject to U.S. federal income tax, net of certain deductions, at the same rates applicable to U.S. persons. If you are a corporation, the branch profits tax (described above) also may apply to such effectively connected gain. If you are described in the second bullet point above, you generally will be subject to U.S. federal income tax at a rate of 30% on the gain realized, although the gain may be offset by certain U.S. source capital losses realized during the same taxable year.
Information Reporting and Backup Withholding Requirements
We must report annually to the IRS and to each non-U.S. Holder the amount of any dividends or other distributions we pay to you and the amount of tax we withhold on these distributions regardless of whether withholding is required. The IRS may make available copies of the information returns reporting those distributions and amounts withheld to the tax authorities in the country in which you reside pursuant to the provisions of an applicable income tax treaty or exchange of information treaty.
Under certain circumstances, the United States imposes a backup withholding tax on any dividends and certain other types of payments to U.S. persons. You will not be subject to backup withholding tax on dividends you receive on your shares of our common stock if you provide proper certification of your status as a non-U.S. Holder or you are a corporation or one of several types of entities and organizations that qualify for an exemption (an “exempt recipient”).
Information reporting and backup withholding generally are not required with respect to the amount of any proceeds from the sale of your shares of our common stock outside the United States through a foreign office of a foreign broker that does not have certain specified connections to the United States. If you sell your shares of common stock through a U.S. broker or the U.S. office of a foreign broker, however, the broker will be required to report to the IRS the amount of proceeds paid to you, and also backup withhold on that amount, unless you provide appropriate certification to the broker of your status as a non-U.S. Holder or you are an exempt recipient. Information reporting will also apply if you sell your shares of our common stock through a foreign broker
133
Table of Contents
deriving more than a specified percentage of its income from U.S. sources or having certain other connections to the United States, unless such broker has documentary evidence in its records that you are a non-U.S. Holder and certain other conditions are met, or you are an exempt recipient. Any amounts withheld with respect to your shares of our common stock under the backup withholding rules will be refunded to you or credited against your U.S. federal income tax liability, if any, by the IRS if the required information is furnished in a timely manner.
Recently Enacted Withholding Legislation
Recently enacted legislation will generally impose an additional withholding tax of 30% on dividends and the gross proceeds of a disposition of our common stock paid to a foreign financial institution unless such institution enters into an agreement with the U.S. government to withhold on certain payments and collect and provide to the U.S. tax authorities substantial information regarding U.S. account holders of such institution (which would include certain account holders that are foreign entities with U.S. owners). This legislation will also generally impose a withholding tax of 30% on dividends and the gross proceeds of a disposition of our shares paid to a non-financial foreign entity unless such entity provides the withholding agent with a certification identifying the direct and indirect U.S. owners of the entity. U.S. Holders may be impacted by these rules if they hold our common stock through certain foreign entities. IRS guidance released in July 2011, as well as proposed Treasury Regulations issued in February 2012, indicate that the withholding under these two scenarios will apply to payments of dividends on our common stock made on or after January 1, 2014 and to payments of gross proceeds from a sale or other disposition of our common stock made on or after January 1, 2015. Under certain circumstances, a holder of common stock may be eligible for a refund or credit of such taxes. You should consult your own tax advisor as to the possible implications of this legislation on your investment in shares of our common stock.
U.S. Federal Estate Tax
Common stock owned or treated as owned by an individual who is not a citizen or resident (as defined for U.S. federal estate tax purposes) of the United States at the time of his or her death will be included in the individual’s gross estate for U.S. federal estate tax purposes and therefore may be subject to U.S. federal estate tax unless an applicable tax treaty provides otherwise.
134
Table of Contents
Under the terms and subject to the conditions contained in an underwriting agreement dated , 2012, we have agreed to sell to the underwriters named below, for whom Credit Suisse Securities (USA) LLC, Morgan Stanley & Co. LLC and Deutsche Bank Securities Inc. are acting as representatives, the following respective numbers of shares of common stock:
| Underwriter |
Number of Shares | |
| Credit Suisse Securities (USA) LLC |
||
| Morgan Stanley & Co. LLC |
||
| Deutsche Bank Securities Inc. |
||
| Lazard Capital Markets LLC |
||
| Oppenheimer & Co. Inc. |
||
| RBC Capital Markets, LLC |
||
| Stifel, Nicolaus & Company, Incorporated |
||
|
| ||
| Total |
The underwriting agreement provides that the underwriters are obligated to purchase all the shares of common stock in this offering if any are purchased, other than those shares covered by the over-allotment option described below. The underwriting agreement also provides that, if an underwriter defaults, the purchase commitments of non-defaulting underwriters may be increased or this offering may be terminated.
We have granted to the underwriters a 30-day option to purchase on a pro rata basis up to additional shares at the initial public offering price less the underwriting discounts and commissions. The option may be exercised only to cover any over-allotments of common stock.
The underwriters propose to offer the shares of common stock initially at the public offering price on the cover page of this prospectus and to selling group members at that price less a selling concession of $ per share. The underwriters and selling group members may allow a discount of $ per share on sales to other broker/dealers. After the initial public offering the representatives may change the public offering price and concession and discount to broker/dealers.
The following table summarizes the compensation and estimated expenses we will pay:
| Per Share | Total | |||||||
| Without Over-allotment |
With Over-allotment |
Without Over-allotment |
With Over-allotment | |||||
| Underwriting discounts and commissions paid by us |
$ | $ | $ | $ | ||||
| Expenses payable by us |
$ | $ | $ | $ | ||||
The underwriters have informed us that they do not expect sales to accounts over which the underwriters have discretionary authority to exceed 5% of the shares of common stock being offered.
We have agreed that we will not offer, sell, contract to sell, pledge or otherwise dispose of, directly or indirectly, or file with the SEC a registration statement under the Securities Act relating to, any shares of our common stock or securities convertible into or exchangeable or exercisable for any shares of our common stock, or publicly disclose the intention to make any offer, sale, pledge, disposition or filing, without the prior written consent of the representatives for a period of 180 days after the date of this prospectus, subject to limited exceptions. However, in the event that either (1) during the last 17 days of the “lock-up” period, we release earnings results or material news or a material event relating to us occurs or (2) prior to the expiration of the “lock-up” period, we announce that we will release earnings results during the 16-day period beginning on the last day of the “lock-up” period, then in either case the expiration of the “lock-up” will be extended until the expiration of the 18-day period beginning on the date of the release of the earnings results or the occurrence of the material news or event, as applicable, unless the representatives waive, in writing, such an extension.
135
Table of Contents
Our officers and directors and certain other holders of our common stock have agreed that they will not offer, sell, contract to sell, pledge or otherwise dispose of, directly or indirectly, any shares of our common stock or securities convertible into or exchangeable or exercisable for any shares of our common stock, enter into a transaction that would have the same effect, or enter into any swap, hedge or other arrangement that transfers, in whole or in part, any of the economic consequences of ownership of our common stock, whether any of these transactions are to be settled by delivery of our common stock or other securities, in cash or otherwise, or publicly disclose the intention to make any offer, sale, pledge or disposition, or to enter into any transaction, swap, hedge or other arrangement, without, in each case, the prior written consent of the representatives for a period of 180 days after the date of this prospectus, subject to limited exceptions. However, in the event that either (1) during the last 17 days of the “lock-up” period, we release earnings results or material news or a material event relating to us occurs or (2) prior to the expiration of the “lock-up” period, we announce that we will release earnings results during the 16-day period beginning on the last day of the “lock-up” period, then in either case the expiration of the “lock-up” will be extended until the expiration of the 18-day period beginning on the date of the release of the earnings results or the occurrence of the material news or event, as applicable, unless the representatives waive, in writing, such an extension.
The underwriters have reserved for sale at the initial public offering price up to shares of the common stock for employees, directors and other persons associated with us who have expressed an interest in purchasing common stock in this offering. The number of shares available for sale to the general public in this offering will be reduced to the extent these persons purchase the reserved shares. Any reserved shares not so purchased will be offered by the underwriters to the general public on the same terms as the other shares.
We have agreed to indemnify the underwriters against liabilities under the Securities Act, or contribute to payments that the underwriters may be required to make in that respect.
We have applied to list the shares of common stock on the NYSE under the symbol “MRD”.
The underwriters and their respective affiliates and Lazard Frères & Co. LLC are full service financial institutions engaged in various activities, which may include securities trading, commercial and investment banking, financial advisory, investment management, investment research, principal investment, hedging, financing and brokerage activities. Certain of the underwriters and their respective affiliates and Lazard Frères & Co. LLC have, from time to time, performed, and may in the future perform, various financial advisory and investment banking services for us, for which they received or will receive customary fees and expenses. In particular, Credit Suisse Securities (USA) LLC acted as an initial purchaser in the Senior Subordinated Notes issuance and as a joint lead arranger and joint bookrunner under our Credit Facilities for which it received customary fees and expenses. In addition, an affiliate of Credit Suisse Securities (USA) LLC is the administrative agent and collateral agent under our Credit Facilities. Affiliates of Credit Suisse Securities (USA) LLC are lenders under our Credit Facilities, which include our Term Loan Facilities. Such affiliates will receive a portion of the proceeds from this offering upon any repayment of a portion of the borrowings outstanding under our Term Loan Facilities. Affiliates of Morgan Stanley & Co. LLC and Deutsche Bank Securities Inc. are lenders under our Revolving Credit Facility. Lazard Frères & Co. LLC has acted as a financial advisor to us in connection with certain aspects of this offering. The relationship between Lazard Frères & Co. LLC and Lazard Capital Markets LLC is governed by a business alliance agreement between their respective parent companies. Lazard Frères & Co. LLC referred this offering to Lazard Capital Markets LLC and will receive a referral fee in connection with this offering.
Prior to the completion of this offering, there will have been no public market for our common stock. The initial public offering price will be determined by negotiations among us and the underwriters. The principal factors to be considered in determining the initial public offering price include the following:
| • | the information included in this prospectus and otherwise available to the underwriters; |
| • | market conditions for initial public offerings; |
| • | the history of and prospects for our business and our past and present operations; |
136
Table of Contents
| • | our past and present earnings and current financial position; |
| • | an assessment of our management; |
| • | the market for securities of companies in businesses similar to ours; and |
| • | the general condition of securities markets. |
In connection with this offering the underwriters may engage in stabilizing transactions, over-allotment transactions, syndicate covering transactions and penalty bids in accordance with Regulation M under the Exchange Act.
| • | Stabilizing transactions permit bids to purchase the underlying security so long as the stabilizing bids do not exceed a specified maximum. |
| • | Over-allotment involves sales by the underwriters of shares in excess of the number of shares the underwriters are obligated to purchase, which creates a syndicate short position. The short position may be either a covered short position or a naked short position. In a covered short position, the number of shares over-allotted by the underwriters is not greater than the number of shares that they may purchase in the over-allotment option. In a naked short position, the number of shares involved is greater than the number of shares in the over-allotment option. The underwriters may close out any covered short position by either exercising their over-allotment option and/or purchasing shares in the open market. |
| • | Syndicate covering transactions involve purchases of the common stock in the open market after the distribution has been completed in order to cover syndicate short positions. In determining the source of shares to close out the short position, the underwriters will consider, among other things, the price of shares available for purchase in the open market as compared to the price at which they may purchase shares through the over-allotment option. If the underwriters sell more shares than could be covered by the over-allotment option, a naked short position, the position can only be closed out by buying shares in the open market. A naked short position is more likely to be created if the underwriters are concerned that there could be downward pressure on the price of the shares in the open market after pricing that could adversely affect investors who purchase in this offering. |
| • | Penalty bids permit the representatives to reclaim a selling concession from a syndicate member when the common stock originally sold by the syndicate member is purchased in a stabilizing or syndicate covering transaction to cover syndicate short positions. |
These stabilizing transactions, syndicate covering transactions and penalty bids may have the effect of raising or maintaining the market price of our common stock or preventing or retarding a decline in the market price of the common stock. As a result the price of our common stock may be higher than the price that might otherwise exist in the open market. These transactions may be effected on the NYSE or otherwise and, if commenced, may be discontinued at any time.
A prospectus in electronic format may be made available on the web sites maintained by one or more of the underwriters, or selling group members, if any, participating in this offering and one or more of the underwriters participating in this offering may distribute prospectuses electronically. The representatives may agree to allocate a number of shares to underwriters and selling group members for sale to their online brokerage account holders. Internet distributions will be allocated by the underwriters and selling group members that will make internet distributions on the same basis as other allocations.
Notice to Prospective Investors in the European Economic Area
In relation to each Member State of the European Economic Area which has implemented the Prospectus Directive (each, a “Relevant Member State”) an offer to the public of any shares which are the subject of this offering contemplated by this Prospectus (the “Shares”) may not be made in that Relevant Member State, except
137
Table of Contents
that an offer to the public in that Relevant Member State of any Shares may be made at any time under the following exemptions under the Prospectus Directive, if they have been implemented in that Relevant Member State:
(a) to any legal entity which is a qualified investor as defined in the Prospectus Directive;
(b) to fewer than 100 or, if the Relevant Member State has implemented the relevant provision of the 2010 PD Amending Directive, 150, natural or legal persons (other than qualified investors as defined in the Prospectus Directive), as permitted under the Prospectus Directive, subject to obtaining the prior consent of the representatives for any such offer; or
(c) in any other circumstances falling within Article 3(2) of the Prospectus Directive;
provided that no such offer of Shares shall result in a requirement for the publication by us or any underwriter of a prospectus pursuant to Article 3 of the Prospectus Directive.
For the purposes of this provision, the expression an “offer to the public” in relation to any Shares in any Relevant Member State means the communication in any form and by any means of sufficient information on the terms of the offer and any Shares to be offered so as to enable an investor to decide to purchase any Shares, as the same may be varied in that Member State by any measure implementing the Prospectus Directive in that Member State, the expression “Prospectus Directive” means Directive 2003/71/EC (and amendments thereto, including the 2010 PD Amending Directive, to the extent implemented in the Relevant Member State), and includes any relevant implementing measure in the Relevant Member State, and the expression “2010 PD Amending Directive” means Directive 2010/73/EU.
Notice to Prospective Investors in the United Kingdom
Each underwriter has represented and agreed that:
(a) it has only communicated or caused to be communicated and will only communicate or cause to be communicated an invitation or inducement to engage in investment activity (within the meaning of Section 21 of the FSMA) received by it in connection with the issue or sale of the Shares in circumstances in which Section 21(1) of the FSMA does not apply to us; and
(b) it has complied and will comply with all applicable provisions of the FSMA with respect to anything done by it in relation to the Shares in, from or otherwise involving the United Kingdom.
138
Table of Contents
The validity of the shares of our common stock offered by this prospectus will be passed upon for our company by Cravath, Swaine & Moore LLP, New York, New York. The underwriters have been represented by Latham & Watkins LLP, New York, New York in connection with this offering.
The balance sheets of MacDermid Group, Inc. as of December 31, 2011 and June 17, 2011, have been included herein in reliance upon the report of KPMG LLP, independent registered public accounting firm, appearing elsewhere herein and upon the authority of said firm as experts in accounting and auditing.
The consolidated financial statements and related financial statement schedule of MacDermid, Incorporated and subsidiaries as of December 31, 2011, 2010 and 2009 and for each of the years in the three year period ended December 31, 2011 have been included herein in reliance upon the report of KPMG LLP, independent registered public accounting firm, appearing elsewhere herein and upon the authority of said firm as experts in accounting and auditing.
WHERE YOU CAN FIND MORE INFORMATION
We have filed with the SEC the Registration Statement on Form S-1 under the Securities Act with respect to the common stock we propose to sell in this offering. This prospectus, which constitutes part of the Registration Statement, does not contain all of the information set forth in the Registration Statement and the exhibits and schedules thereto. For further information about us and our common stock, we refer you to the Registration Statement and the exhibits and schedules filed as a part of the Registration Statement. Statements contained in this prospectus as to the contents of any contract or other document referred to are not necessarily complete. If a contract or document has been filed as an exhibit to the Registration Statement, we refer you to the copy of the contract or document that has been filed as an exhibit to the Registration Statement, each statement about such contract or document being qualified in all respects by such reference.
A copy of the Registration Statement, including the exhibits and schedules thereto, may be read and copied at the SEC’s Public Reference Room at 100 F Street, N.E., Washington, D.C. 20549. Information on the operation of the Public Reference Room may be obtained by calling the SEC at 1-800-SEC-0330. In addition, the SEC maintains an Internet website that contains reports, proxy statements and other information about issuers, like us, that file electronically with the SEC. The address of that site is www.sec.gov. Our reports and any other information that we have filed or may in the future file with the SEC are not incorporated by reference into, and do not constitute a part of, this prospectus or the Registration Statement.
As a result of this offering, we will become subject to the full informational requirements of the Exchange Act. We will fulfill our obligations with respect to such requirements by filing periodic reports and other information with the SEC. We intend to furnish our stockholders with annual reports containing consolidated financial statements certified by an independent public accounting firm. We also maintain an Internet site at www.macdermid.com. Our website and the information contained therein or connected thereto shall not be deemed to be incorporated into this prospectus or the Registration Statement.
139
Table of Contents
BALANCE SHEETS AS OF MARCH 31, 2012 (UNAUDITED), DECEMBER 31, 2011 AND JUNE 17, 2011
| F-2 | ||||
| Balance Sheets as of March 31, 2012 (Unaudited), December 31, 2011 and June 17, 2011 |
F-3 | |||
| Notes to Balance Sheets as of March 31, 2012 (Unaudited), December 31, 2011 and June 17, 2011 |
F-4 |
MACDERMID, INCORPORATED AND SUBSIDIARIES
CONSOLIDATED FINANCIAL STATEMENTS
YEARS ENDED DECEMBER 31, 2011, 2010, 2009 AND THE THREE MONTHS ENDED
MARCH 31, 2012 AND 2011
INDEX TO FINANCIAL STATEMENTS
Audited Financial Statements for the Fiscal Years Ended December 31, 2011, 2010 and 2009
F-1
Table of Contents
REPORT OF INDEPENDENT REGISTERED PUBLIC ACCOUNTING FIRM
The Board of Directors and Stockholders
MacDermid Group, Inc.
We have audited the accompanying balance sheets of MacDermid Group, Inc. (the Company) as of December 31, 2011 and June 17, 2011. These financial statements are the responsibility of the Company’s management. Our responsibility is to express an opinion on these financial statement based on our audits.
We conducted our audit in accordance with the standards of the Public Company Accounting Oversight Board (United States). Those standards require that we plan and perform the audit to obtain reasonable assurance about whether the financial statements are free of material misstatement. An audit includes examining, on a test basis, evidence supporting the amounts and disclosures in the financial statements. An audit also includes assessing the accounting principles used and significant estimates made by management, as well as evaluating the overall financial statement presentation. We believe that our audit provides a reasonable basis for our opinion.
In our opinion, the balance sheets referred to above presents fairly, in all material respects, the financial position of MacDermid Group, Inc. as of December 31, 2011 and June 17, 2011, in conformity with U.S. generally accepted accounting principles.
| /s/ KPMG LLP |
| Hartford, Connecticut
March 7, 2012 |
F-2
Table of Contents
MACDERMID GROUP, INC.
BALANCE SHEETS AS OF MARCH 31, 2012 (UNAUDITED), DECEMBER 31, 2011 AND JUNE 17, 2011
| March 31,
2012 (unaudited) |
December 31, 2011 | June 17, 2011 | ||||||||||
| Assets |
||||||||||||
| Current assets: |
||||||||||||
| Cash and cash equivalents |
$ | 100 | $ | 100 | $ | 100 | ||||||
|
|
|
|
|
|
|
|||||||
| Total current assets |
100 | 100 | 100 | |||||||||
|
|
|
|
|
|
|
|||||||
| Total assets |
$ | 100 | $ | 100 | $ | 100 | ||||||
|
|
|
|
|
|
|
|||||||
| Liabilities and Stockholders’ Equity |
||||||||||||
| Total liabilities |
$ | — | $ | — | $ | — | ||||||
| Stockholders’ Equity |
||||||||||||
| Common Stock, 100 shares issued and 1,000 shares authorized at March 31, 2012, December 31, 2011 and June 17, 2011, $0.01 par value per share |
1 | 1 | 1 | |||||||||
| Additional paid-in capital |
99 | 99 | 99 | |||||||||
|
|
|
|
|
|
|
|||||||
| Total Stockholders’ Equity |
100 | 100 | 100 | |||||||||
|
|
|
|
|
|
|
|||||||
| Total Liabilities and Stockholders’ Equity |
$ | 100 | $ | 100 | $ | 100 | ||||||
|
|
|
|
|
|
|
|||||||
See accompanying notes to balance sheets.
F-3
Table of Contents
MACDERMID GROUP, INC.
NOTES TO BALANCE SHEETS AS OF MARCH 31, 2012 (UNAUDITED), DECEMBER 31, 2011 AND JUNE 17, 2011
1. BASIS OF PRESENTATION AND SUMMARY OF SIGNIFICANT ACCOUNTING POLICIES
Business Description—MacDermid Group, Inc. (the “Company”) was incorporated in Delaware on June 17, 2011. The Company is a direct, wholly owned subsidiary of MacDermid Holdings, LLC and has no significant assets. Following the completion of an initial public stock offering, the Company will be a holding company with no material assets other than its direct 100% ownership interest in MacDermid, Incorporated. MacDermid, Incorporated is, and following the initial public stock offering, will continue to be, the main U.S. operating entity for the MacDermid business and the direct or indirect parent entity of all of the MacDermid operating companies. The Company is a Delaware corporation organized as a holding company. There was no activity in the Company between June 17, 2011 and March 31, 2012.
Cash and Cash Equivalents—For the purpose of the Consolidated Balance Sheets, the Company considers all highly liquid debt instruments purchased with an initial maturity of three months or less to be cash equivalents.
2. STOCKHOLDERS’ EQUITY
On June 17, 2011 the Company issued 100 shares of Common Stock at $0.01 par value to MacDermid Holdings, LLC for total proceeds of $100.
3. SUBSEQUENT EVENTS (UNAUDITED)
The Company has evaluated subsequent events and transactions for potential recognition or disclosure on the balance sheets through March 7, 2012, the date of these financial statements. There were no events or transactions during this evaluation that require recognition or disclosure in the financial statements.
F-4
Table of Contents
When the reverse stock split referred to in note 2 of the notes to the Consolidated Financial Statements has been consummated, we will be in a position to render the following report.
/s/ KPMG LLP
REPORT OF INDEPENDENT REGISTERED PUBLIC ACCOUNTING FIRM
The Board of Directors and Stockholders
MacDermid, Incorporated:
We have audited the accompanying consolidated balance sheets of MacDermid, Incorporated and subsidiaries (the “Company”) as of December 31, 2011 and 2010, and the related consolidated statements of operations, comprehensive income (loss), changes in stockholders’ equity, and cash flows for each of the years in the three-year period ended December 31, 2011. In connection with our audits of the consolidated financial statements, we also have audited the financial statement Schedule II, Valuation and Qualifying Accounts, for the years ended December 31, 2011, 2010 and 2009. These consolidated financial statements and financial statement schedule are the responsibility of the Company’s management. Our responsibility is to express an opinion on these consolidated financial statements and financial statement schedule based on our audits.
We conducted our audits in accordance with the standards of the Public Company Accounting Oversight Board (United States). Those standards require that we plan and perform the audit to obtain reasonable assurance about whether the financial statements are free of material misstatement. An audit includes examining, on a test basis, evidence supporting the amounts and disclosures in the financial statements. An audit also includes assessing the accounting principles used and significant estimates made by management, as well as evaluating the overall financial statement presentation. We believe that our audits provide a reasonable basis for our opinion.
In our opinion, the consolidated financial statements referred to above present fairly, in all material respects, the financial position of MacDermid, Incorporated and subsidiaries as of December 31, 2011 and 2010, and the results of their operations and their cash flows for each of the years in the three-year period ended December 31, 2011 in conformity with U.S. generally accepted accounting principles. Also, in our opinion, the related financial statement schedule, when considered in relation to the basic consolidated financial statements taken as a whole, presents fairly, in all material respects, the information set forth therein.
| Hartford, Connecticut |
March 7, 2012, except as related to note 23 to the Consolidated
Financial Statements, which is as of , 2012
F-5
Table of Contents
MACDERMID, INCORPORATED AND SUBSIDIARIES
CONSOLIDATED STATEMENTS OF OPERATIONS
(In thousands, except share and per share amounts)
| For the years ended | ||||||||||||
| December 31, 2011 | December 31, 2010 | December 31, 2009 | ||||||||||
| Net sales |
$ | 728,773 | $ | 694,333 | $ | 594,153 | ||||||
| Cost of sales |
388,298 | 371,223 | 333,963 | |||||||||
|
|
|
|
|
|
|
|||||||
| Gross profit |
340,475 | 323,110 | 260,190 | |||||||||
| Operating expenses: |
||||||||||||
| Selling, technical and administrative |
185,649 | 179,786 | 156,508 | |||||||||
| Research and development |
22,966 | 21,005 | 20,103 | |||||||||
| Amortization |
28,578 | 29,694 | 29,868 | |||||||||
| Restructuring |
896 | 6,234 | 4,228 | |||||||||
| Impairment charges |
46,438 | — | 68,692 | |||||||||
|
|
|
|
|
|
|
|||||||
| Total operating expenses |
284,527 | 236,719 | 279,399 | |||||||||
|
|
|
|
|
|
|
|||||||
| Operating profit (loss) |
55,948 | 86,391 | (19,209 | ) | ||||||||
| Other income (expense): |
||||||||||||
| Interest income |
500 | 696 | 458 | |||||||||
| Interest expense |
(54,554 | ) | (56,196 | ) | (60,740 | ) | ||||||
| Miscellaneous income (expense) |
9,412 | 15,106 | (5,020 | ) | ||||||||
|
|
|
|
|
|
|
|||||||
| Income (loss) from continuing operations before income taxes, non-controlling interest and accumulated payment-in-kind dividends on cumulative preferred shares |
11,306 | 45,997 | (84,511 | ) | ||||||||
| Income tax (expense) benefit |
(9,953 | ) | (21,723 | ) | 6,427 | |||||||
|
|
|
|
|
|
|
|||||||
| Income (loss) from continuing operations |
1,353 | 24,274 | (78,084 | ) | ||||||||
| (Loss) income from discontinued operations, net of tax |
— | — | (4,448 | ) | ||||||||
|
|
|
|
|
|
|
|||||||
| Net income (loss) |
1,353 | 24,274 | (82,532 | ) | ||||||||
| Less net income attributable to the non-controlling interest |
(366 | ) | (343 | ) | (295 | ) | ||||||
|
|
|
|
|
|
|
|||||||
| Net income (loss) attributable to MacDermid, Incorporated |
987 | 23,931 | (82,827 | ) | ||||||||
| Accrued payment-in-kind dividend on cumulative preferred shares |
(40,847 | ) | (37,361 | ) | (34,124 | ) | ||||||
|
|
|
|
|
|
|
|||||||
| Net loss attributable to common shares |
$ | (39,860 | ) | $ | (13,430 | ) | $ | (116,951 | ) | |||
|
|
|
|
|
|
|
|||||||
| Net (loss) attributable to MacDermid, Incorporated per share |
||||||||||||
| Basic: |
||||||||||||
| (Loss) from continuing operations |
$ | (4.01 | ) | $ | (1.35 | ) | $ | (11.30 | ) | |||
| (Loss) from discontinued operations |
$ | — | $ | — | $ | (0.45 | ) | |||||
| Net loss |
$ | (4.01 | ) | $ | (1.35 | ) | $ | (11.75 | ) | |||
| Diluted: |
||||||||||||
| (Loss) from continuing operations |
$ | (4.01 | ) | $ | (1.35 | ) | $ | (11.30 | ) | |||
| (Loss) from discontinued operations |
$ | — | $ | — | $ | (0.45 | ) | |||||
| Net loss |
$ | (4.01 | ) | $ | (1.35 | ) | $ | (11.75 | ) | |||
| Weighted average shares outstanding |
||||||||||||
| Basic |
9,942,777 | 9,932,862 | 9,951,799 | |||||||||
| Diluted |
9,942,777 | 9,932,862 | 9,951,799 | |||||||||
| Pro forma net income per share (unaudited) |
||||||||||||
| Basic and diluted |
$ | 0.03 | ||||||||||
| Pro forma weighted average number of common shares outstanding (unaudited): |
||||||||||||
| Basic |
31,387,359 | |||||||||||
| Diluted |
31,509,558 | |||||||||||
See accompanying notes to consolidated financial statements.
F-6
Table of Contents
MACDERMID, INCORPORATED AND SUBSIDIARIES
CONSOLIDATED STATEMENTS OF
COMPREHENSIVE INCOME (LOSS)
(In thousands)
| For the years ended | ||||||||||||
| December 31, 2011 | December 31, 2010 | December 31, 2009 | ||||||||||
| Net income (loss) |
$ | 1,353 | $ | 24,274 | $ | (82,532 | ) | |||||
| Foreign currency translation (loss) gain |
(5,683 | ) | 7,760 | 26,253 | ||||||||
| Pension and postretirement benefit plans |
||||||||||||
| Amortization of actuarial loss and prior service credits |
90 | 574 | 1,196 | |||||||||
| Current year change |
(22,781 | ) | 10,978 | 7,724 | ||||||||
| Unrealized (loss) gain on available for sale equity investments |
||||||||||||
| Change in fair value |
(153 | ) | 354 | (156 | ) | |||||||
| Unrealized gain on derivatives valuation |
||||||||||||
| Change in fair value |
2,958 | 5,904 | 4,689 | |||||||||
| Reclassification into earnings |
527 | (1,301 | ) | 1,431 | ||||||||
| Income tax benefit (expense) on other comprehensive (loss) income |
6,085 | (5,367 | ) | (5,666 | ) | |||||||
|
|
|
|
|
|
|
|||||||
| Comprehensive (loss) income |
(17,604 | ) | 43,176 | (47,061 | ) | |||||||
| Comprehensive income attributable to the non-controlling interest |
(366 | ) | (343 | ) | (295 | ) | ||||||
|
|
|
|
|
|
|
|||||||
| Comprehensive (loss) income attributable to MacDermid, Incorporated |
$ | (17,970 | ) | $ | 42,833 | $ | (47,356 | ) | ||||
|
|
|
|
|
|
|
|||||||
See accompanying notes to consolidated financial statements.
F-7
Table of Contents
MACDERMID, INCORPORATED AND SUBSIDIARIES
CONSOLIDATED BALANCE SHEETS
(In thousands, except share and per share amounts)
| December 31, 2011 | December 31, 2010 | |||||||
| Assets |
||||||||
| Current assets: |
||||||||
| Cash and cash equivalents |
$ | 113,452 | $ | 106,740 | ||||
| Accounts receivable, net of allowance for doubtful receivables of $8,730 and $8,179, respectively |
134,584 | 139,418 | ||||||
| Inventories, net |
75,186 | 80,312 | ||||||
| Prepaid expenses and other current assets |
12,048 | 11,683 | ||||||
| Deferred income taxes |
6,116 | 7,800 | ||||||
|
|
|
|
|
|||||
| Total current assets |
341,386 | 345,953 | ||||||
| Property, plant and equipment, net of accumulated depreciation of $76,216 and $62,012, respectively |
96,916 | 105,371 | ||||||
| Goodwill |
474,581 | 477,483 | ||||||
| Intangibles, net of accumulated amortization of $139,427 and $112,224, respectively |
274,105 | 349,569 | ||||||
| Deferred income taxes |
2,387 | 2,292 | ||||||
| Other assets |
32,043 | 34,121 | ||||||
|
|
|
|
|
|||||
| Total assets |
$ | 1,221,418 | $ | 1,314,789 | ||||
|
|
|
|
|
|||||
| Liabilities and Stockholders’ Equity |
||||||||
| Current liabilities: |
||||||||
| Accounts payable |
$ | 49,481 | $ | 54,010 | ||||
| Accrued compensation |
14,372 | 21,442 | ||||||
| Accrued interest |
6,958 | 6,957 | ||||||
| Accrued income taxes payable |
6,398 | 5,678 | ||||||
| Accrued expenses |
9,641 | 11,991 | ||||||
| Short-term notes payable |
— | 1,305 | ||||||
| Current installments of long-term debt and capital lease obligations |
26,141 | 36,393 | ||||||
| Other current liabilities |
13,915 | 13,774 | ||||||
|
|
|
|
|
|||||
| Total current liabilities |
126,906 | 151,550 | ||||||
| Long-term debt and capital lease obligations |
718,231 | 746,914 | ||||||
| Retirement benefits, less current portion |
40,902 | 30,749 | ||||||
| Deferred income taxes |
62,835 | 91,258 | ||||||
| Other long-term liabilities |
30,738 | 35,109 | ||||||
|
|
|
|
|
|||||
| Total liabilities |
$ | 979,612 | $ | 1,055,580 | ||||
|
|
|
|
|
|||||
| Stockholders’ Equity |
||||||||
| Cumulative preferred shares, 316,000 shares authorized and issued, 315,264 shares and 315,247 shares outstanding at December 31, 2011 and 2010, respectively, including cumulative dividends of $164,449 and $123,602 at December 31, 2011 and 2010, respectively |
480,449 | 439,602 | ||||||
| Common shares, 50,000,000 shares authorized and issued, 9,946,439 shares and 9,932,132 shares outstanding at December 31, 2011 and 2010, respectively |
50,000 | 50,000 | ||||||
| Class A Junior shares, 430,000 shares authorized and issued, and 314,245 vested shares and 236,252 vested shares outstanding at December 31, 2011 and 2010, respectively |
— | — | ||||||
| Class B Junior shares, 324,000 shares authorized and issued, and 49,878 vested shares and 0 vested shares outstanding at December 31, 2011 and 2010, respectively |
— | — | ||||||
| Additional paid-in capital |
2,156 | 1,429 | ||||||
| Accumulated deficit |
(274,458 | ) | (234,598 | ) | ||||
| Accumulated other comprehensive income (loss) |
(14,959 | ) | 3,998 | |||||
| Common and preferred shares in treasury, 736 preferred shares and 53,561 common shares at December 31, 2011 and 753 preferred shares and 67,868 common shares at December 31, 2010, at cost, respectively |
(994 | ) | (1,082 | ) | ||||
|
|
|
|
|
|||||
| Total Stockholders’ equity |
242,194 | 259,349 | ||||||
| (Deficit) in non-controlling interest |
(388 | ) | (140 | ) | ||||
|
|
|
|
|
|||||
| Total equity |
241,806 | 259,209 | ||||||
|
|
|
|
|
|||||
| Total liabilities and stockholders’ equity |
$ | 1,221,418 | $ | 1,314,789 | ||||
|
|
|
|
|
|||||
See accompanying notes to consolidated financial statements.
F-8
Table of Contents
MACDERMID, INCORPORATED AND SUBSIDIARIES
CONSOLIDATED STATEMENTS OF CASH FLOWS
(In thousands)
| For the years ended | ||||||||||||
| December 31, 2011 |
December 31, 2010 |
December 31, 2009 |
||||||||||
| Cash flows from operating activities: |
||||||||||||
| Net income (loss) |
$ | 1,353 | $ | 24,274 | $ | (82,532 | ) | |||||
| (Income) loss from discontinued operations, net |
— | — | 4,448 | |||||||||
| Adjustments to reconcile net income (loss) from continuing operations to net cash flows provided by operating activities: |
||||||||||||
| Depreciation |
18,167 | 16,850 | 17,937 | |||||||||
| Amortization |
28,578 | 29,694 | 29,868 | |||||||||
| Provision for bad debts |
1,995 | 1,617 | 2,154 | |||||||||
| Deferred income taxes |
(16,010 | ) | (6,186 | ) | (35,626 | ) | ||||||
| Write off of deferred financing costs |
506 | 436 | 1,362 | |||||||||
| Equity compensation expense |
727 | 389 | 337 | |||||||||
| (Gain) loss on remeasurement of foreign denominated debt |
(9,156 | ) | (17,395 | ) | 5,067 | |||||||
| Gain on disposition of fixed assets |
(157 | ) | (960 | ) | (649 | ) | ||||||
| Impairment charges |
46,438 | — | 68,692 | |||||||||
| Restructuring charges |
896 | 6,234 | 4,228 | |||||||||
| Amortization of deferred financing fees |
3,802 | 3,946 | 4,116 | |||||||||
| Loss on sale of business unit |
1,237 | — | — | |||||||||
| Changes in assets and liabilities: |
||||||||||||
| (Increase) decrease in accounts receivable |
(401 | ) | (7,026 | ) | 3,724 | |||||||
| Decrease (increase) in inventories |
1,481 | (8,125 | ) | 20,035 | ||||||||
| (Increase) decrease in prepaid expenses |
(734 | ) | (1,398 | ) | (645 | ) | ||||||
| (Increase) decrease in equipment at customers |
(1,074 | ) | 1,325 | (219 | ) | |||||||
| (Decrease) increase in accounts payable |
(3,498 | ) | 5,250 | (3,978 | ) | |||||||
| (Decrease) in accrued expenses |
(12,743 | ) | (5,254 | ) | (12,782 | ) | ||||||
| (Decrease) increase in income tax balances |
(2,011 | ) | 7,437 | 17,019 | ||||||||
| Other |
(9,650 | ) | 4,986 | 5,847 | ||||||||
|
|
|
|
|
|
|
|||||||
| Net cash flows provided by continuing operating activities |
49,746 | 56,094 | 48,403 | |||||||||
| Net cash flows provided by (used in) discontinued operating activities |
— | — | 630 | |||||||||
|
|
|
|
|
|
|
|||||||
| Net cash flows provided by operating activities |
49,746 | 56,094 | 49,033 | |||||||||
|
|
|
|
|
|
|
|||||||
| Cash flows from investing activities: |
||||||||||||
| Capital expenditures |
(8,741 | ) | (7,518 | ) | (6,508 | ) | ||||||
| Proceeds from disposition of fixed assets |
261 | 1,100 | 2,621 | |||||||||
| Redemption (purchase) of certificate of deposit |
2,516 | (2,500 | ) | — | ||||||||
| Proceeds from disposition of business |
3,267 | — | — | |||||||||
| Additions to goodwill and other assets, net |
— | — | — | |||||||||
| Purchases of equity securities |
(757 | ) | — | — | ||||||||
|
|
|
|
|
|
|
|||||||
| Net cash flows (used in) investing activities |
(3,454 | ) | (8,918 | ) | (3,887 | ) | ||||||
|
|
|
|
|
|
|
|||||||
F-9
Table of Contents
MACDERMID, INCORPORATED AND SUBSIDIARIES
CONSOLIDATED STATEMENTS OF CASH FLOWS—(CONTINUED)
(In thousands)
| For the years ended | ||||||||||||
| December 31, 2011 |
December 31, 2010 |
December 31, 2009 |
||||||||||
| Cash flows from financing activities: |
||||||||||||
| Short term (repayments) borrowings |
(1,308 | ) | 577 | 735 | ||||||||
| Proceeds from capital leases |
1,283 | — | — | |||||||||
| Proceeds from borrowings |
— | — | 6,782 | |||||||||
| Repayments of borrowings |
(36,983 | ) | (26,565 | ) | (60,711 | ) | ||||||
| Dividends paid to non-controlling interest partner |
(614 | ) | (611 | ) | (476 | ) | ||||||
| Issuance of treasury shares |
100 | — | — | |||||||||
| Repurchase of treasury shares |
(12 | ) | (49 | ) | (682 | ) | ||||||
| Payment of financing fees |
(264 | ) | — | — | ||||||||
|
|
|
|
|
|
|
|||||||
| Net cash flows used in continuing financing activities |
(37,798 | ) | (26,648 | ) | (54,352 | ) | ||||||
| Effect of exchange rate changes on cash and cash equivalents |
(1,782 | ) | 716 | 1,553 | ||||||||
|
|
|
|
|
|
|
|||||||
| Net increase (decrease) in cash and cash Equivalents |
6,712 | 21,244 | (7,653 | ) | ||||||||
| Cash and cash equivalents at beginning of period |
106,740 | 85,496 | 93,149 | |||||||||
|
|
|
|
|
|
|
|||||||
| Cash and cash equivalents at end of period |
$ | 113,452 | $ | 106,740 | $ | 85,496 | ||||||
|
|
|
|
|
|
|
|||||||
| Supplemental disclosure information: |
||||||||||||
| Cash paid for interest |
$ | 50,040 | $ | 51,545 | $ | 55,029 | ||||||
|
|
|
|
|
|
|
|||||||
| Cash paid for income taxes |
$ | 25,878 | $ | 20,087 | $ | 9,354 | ||||||
|
|
|
|
|
|
|
|||||||
See accompanying notes to consolidated financial statements.
F-10
Table of Contents
MACDERMID, INCORPORATED AND SUBSIDIARIES
CONSOLIDATED STATEMENT OF CHANGES IN STOCKHOLDERS’ EQUITY
(In thousands, except share and per share amounts)
| MacDermid Stockholders | ||||||||||||||||||||||||||||||||||||||||||||
| Cumulative Preferred Shares |
Common Shares |
Class A Junior Shares |
Class B Junior Shares |
Additional paid-in capital |
Accumulated deficit |
Accumulated other comprehensive income (loss) |
Treasury Shares |
Total MacDermid Stockholder Equity |
Non- controlling interest |
Total equity |
||||||||||||||||||||||||||||||||||
| Balance at January 1, 2009 |
$ | 368,117 | $ | 50,000 | $ | — | $ | — | $ | 703 | $ | (104,217 | ) | $ | (50,375 | ) | $ | (351 | ) | $ | 263,877 | $ | 309 | $ | 264,186 | |||||||||||||||||||
| Net loss |
— | — | — | — | — | (82,827 | ) | — | — | (82,827 | ) | 295 | (82,532 | ) | ||||||||||||||||||||||||||||||
| Equity compensation |
— | — | — | — | 337 | — | — | — | 337 | — | 337 | |||||||||||||||||||||||||||||||||
| Accrual of paid in kind dividend on cumulative preferred shares |
34,124 | — | — | — | — | (34,124 | ) | — | — | — | — | — | ||||||||||||||||||||||||||||||||
| Foreign currency translation adjustments |
— | — | — | — | — | — | 26,253 | — | 26,253 | — | 26,253 | |||||||||||||||||||||||||||||||||
| Pension and postretirement plans, net of tax expense of $3,524 |
— | — | — | — | — | — | 5,396 | — | 5,396 | — | 5,396 | |||||||||||||||||||||||||||||||||
| Derivatives valuation, net of tax expense of $2,142 |
— | — | — | — | — | — | 3,978 | — | 3,978 | — | 3,978 | |||||||||||||||||||||||||||||||||
| Shares repurchased |
— | — | — | — | — | — | — | (682 | ) | (682 | ) | — | (682 | ) | ||||||||||||||||||||||||||||||
| Unrealized loss on available for sale equity securities |
— | — | — | — | — | — | (156 | ) | — | (156 | ) | — | (156 | ) | ||||||||||||||||||||||||||||||
| Dividend paid to non-controlling interest partner |
— | — | — | — | — | — | — | — | — | (476 | ) | (476 | ) | |||||||||||||||||||||||||||||||
|
|
|
|
|
|
|
|
|
|
|
|
|
|
|
|
|
|
|
|
|
|
|
|||||||||||||||||||||||
| Balance at December 31, 2009 |
$ | 402,241 | $ | 50,000 | $ | — | $ | — | $ | 1,040 | $ | (221,168 | ) | $ | (14,904 | ) | $ | (1,033 | ) | 216,176 | $ | 128 | $ | 216,304 | ||||||||||||||||||||
| Net income |
— | — | — | — | — | 23,931 | — | — | 23,931 | 343 | 24,274 | |||||||||||||||||||||||||||||||||
| Equity compensation |
— | — | — | — | 389 | — | — | — | 389 | — | 389 | |||||||||||||||||||||||||||||||||
| Accrual of paid in kind dividend on cumulative preferred shares |
37,361 | — | — | — | — | (37,361 | ) | — | — | — | — | — | ||||||||||||||||||||||||||||||||
| Foreign currency translation adjustments |
— | — | — | — | — | — | 7,760 | — | 7,760 | — | 7,760 | |||||||||||||||||||||||||||||||||
| Pension and postretirement plans, net of tax expense of $3,756 |
— | — | — | — | — | — | 7,796 | — | 7,796 | — | 7,796 | |||||||||||||||||||||||||||||||||
| Derivatives valuation, net of tax expense of $1,611 |
— | — | — | — | — | — | 2,992 | — | 2,992 | — | 2,992 | |||||||||||||||||||||||||||||||||
| Shares repurchased |
— | — | — | — | — | — | — | (49 | ) | (49 | ) | — | (49 | ) | ||||||||||||||||||||||||||||||
| Unrealized gain on available for sale equity securities |
— | — | — | — | — | — | 354 | — | 354 | — | 354 | |||||||||||||||||||||||||||||||||
| Dividend paid to non-controlling interest partner |
— | — | — | — | — | — | — | — | — | (611 | ) | (611 | ) | |||||||||||||||||||||||||||||||
|
|
|
|
|
|
|
|
|
|
|
|
|
|
|
|
|
|
|
|
|
|
|
|||||||||||||||||||||||
| Balance at December 31, 2010 |
$ | 439,602 | $ | 50,000 | $ | — | $ | — | $ | 1,429 | $ | (234,598 | ) | $ | 3,998 | $ | (1,082 | ) | 259,349 | $ | (140 | ) | $ | 259,209 | ||||||||||||||||||||
| Net income |
— | — | — | — | — | 987 | — | — | 987 | 366 | 1,353 | |||||||||||||||||||||||||||||||||
| Equity compensation |
— | — | — | — | 727 | — | — | — | 727 | — | 727 | |||||||||||||||||||||||||||||||||
| Accrual of paid in kind dividend on cumulative preferred shares |
40,847 | — | — | — | — | (40,847 | ) | — | — | — | — | — | ||||||||||||||||||||||||||||||||
| Foreign currency translation adjustments |
— | — | — | — | — | — | (5,683 | ) | — | (5,683 | ) | — | (5,683 | ) | ||||||||||||||||||||||||||||||
| Pension and postretirement plans, net of tax benefit of $7,251 |
— | — | — | — | — | — | (15,440 | ) | — | (15,440 | ) | — | (15,440 | ) | ||||||||||||||||||||||||||||||
| Derivatives valuation, net of tax expense of $1,220 |
— | — | — | — | — | — | 2,265 | — | 2,265 | — | 2,265 | |||||||||||||||||||||||||||||||||
| Shares issued |
— | — | — | — | — | — | — | 100 | 100 | — | 100 | |||||||||||||||||||||||||||||||||
| Shares repurchased |
— | — | — | — | — | — | — | (12 | ) | (12 | ) | — | (12 | ) | ||||||||||||||||||||||||||||||
| Unrealized loss on available for sale equity securities, net of tax benefit of $54 |
— | — | — | — | — | — | (99 | ) | — | (99 | ) | — | (99 | ) | ||||||||||||||||||||||||||||||
| Dividend paid to non-controlling interest partner |
— | — | — | — | — | — | — | — | — | (614 | ) | (614 | ) | |||||||||||||||||||||||||||||||
|
|
|
|
|
|
|
|
|
|
|
|
|
|
|
|
|
|
|
|
|
|
|
|||||||||||||||||||||||
| Balance at December 31, 2011 |
$ | 480,449 | $ | 50,000 | $ | — | $ | — | $ | 2,156 | $ | (274,458 | ) | $ | (14,959 | ) | $ | (994 | ) | $ | 242,194 | $ | (388 | ) | $ | 241,806 | ||||||||||||||||||
|
|
|
|
|
|
|
|
|
|
|
|
|
|
|
|
|
|
|
|
|
|
|
|||||||||||||||||||||||
See accompanying notes to consolidated financial statements.
F-11
Table of Contents
MACDERMID, INCORPORATED AND SUBSIDIARIES
NOTES TO CONSOLIDATED FINANCIAL STATEMENTS
YEARS ENDED DECEMBER 31, 2009, 2010 AND 2011
(In thousands, except share and per share amounts)
1. BASIS OF PRESENTATION AND SUMMARY OF SIGNIFICANT ACCOUNTING POLICIES
Business Description—MacDermid, Incorporated and its subsidiaries (collectively, “MacDermid” or “the Company”) was established in Waterbury, Connecticut, in 1922. The terms “MacDermid” or “the Company” shall, unless the context otherwise requires, be deemed to include the consolidated entity. MacDermid Holdings, LLC, is a Delaware limited liability company organized as a holding company with the sole purpose of being the primary stockholder of its consolidated operating subsidiary MacDermid. MacDermid Holdings, LLC has no business operations or material assets or liabilities other than its ownership interest of 97.0% of the common stock and 96.7% of the preferred stock in MacDermid as of December 31, 2011. Participants of the MacDermid, Incorporated Profit Sharing and Employee Savings Plan (the “Savings Plan”) owned 3.0% of the common stock and 3.3% of the preferred stock in MacDermid as of December 31, 2011. These shares have substantially the same terms as the MacDermid Holdings, LLC common and preferred units. The Company develops, produces and markets a broad line of specialty chemical and printing products that are used worldwide. These products are supplied to the metal and plastic finishing markets (for automotive and other applications), the electronics industry (to create electrical patterns on circuit boards), the offshore oil and gas markets (for oil production) and to the commercial printing and packaging industries (for image transfer applications). The Company’s products are delivered primarily to customers directly or secondarily through distributors.
Merger Transaction—On April 12, 2007, Daniel H. Leever, MacDermid’s Chairman and Chief Executive Officer, together with Court Square Capital Partners II LP (“Court Square or CSC”), a related party, Weston Presidio, a related party and certain other members of the Company’s management acquired the common stock of predecessor MacDermid, Incorporated (“predecessor”). See Note 3 below for further information. The accompanying financial statements include the accounts of the surviving Company.
Principles of Consolidation—The accompanying consolidated financial statements include the accounts of MacDermid and all of its majority-owned domestic and foreign subsidiaries. All inter-company accounts and transactions were eliminated in consolidation.
Reclassifications—Certain amounts in prior periods have been reclassified to conform with the presentation of 2011.
Use of Estimates – In preparing the consolidated financial statements in conformity with accounting principles generally accepted in the United States of America (“GAAP”), Company management must undertake decisions that impact the reported amounts and related disclosures. Such decisions include the selection of the appropriate accounting principles to be applied and also assumptions upon which accounting estimates are based. The Company applies judgment based on its understanding and analysis of the relevant circumstances to reach these decisions. By their nature, these judgments are subject to an inherent degree of uncertainty. Accordingly, actual results could differ significantly from the estimates applied. Significant items subject to such estimates and assumptions include the useful lives of fixed assets; allowances for doubtful accounts and sales returns, deferred tax assets, inventory, inventory valuation, share-based compensation, reserves for employee benefit obligations, environmental liabilities, income tax uncertainties and other contingencies.
Cash and Cash Equivalents—For the purpose of the Consolidated Statements of Cash Flows, MacDermid considers all highly liquid debt instruments purchased with an initial maturity of three months or less to be cash equivalents.
Credit Risk Management—MacDermid’s products are sold primarily to the automotive, electronic and printing industries. This level of concentration exposes the Company to certain collection risks which are subject
F-12
Table of Contents
MACDERMID, INCORPORATED AND SUBSIDIARIES
NOTES TO CONSOLIDATED FINANCIAL STATEMENTS—(CONTINUED)
(In thousands, except share and per share amounts)
1. BASIS OF PRESENTATION AND SUMMARY OF SIGNIFICANT ACCOUNTING POLICIES (CONTINUED)
to a variety of factors, including economic and technological change within these industries. As is common industry practice, MacDermid generally does not require collateral or other security as a condition of sale, rather relying on credit approval, balance limitation and monitoring procedures to control credit risk on trade accounts receivable. The Company establishes reserves against possible uncollectible amounts based on historical experience and specific knowledge regarding customers’ ability to pay.
Derivatives—The Company uses an interest rate swap and an interest rate collar to manage risks associated with changes in interest rates. The Company entered into the interest rate swap and an interest rate collar to hedge against the effect of changes in interest rates on floating rate debt. These transactions are designed as cash flow hedges.
The Company also uses forward and option contracts to manage risks generally associated with foreign exchange rate volatility. Company management will enter into foreign exchange forward and option contracts to hedge against the effect of exchange rate fluctuations on cash flows denominated in foreign currencies. These transactions are designated as cash flow hedges. When these contracts are settled, the associated difference between the settlement amount and contracted amount is recognized in earnings.
The Company accounts for each hedge instrument as either an asset or liability measured at its fair value in the Consolidated Balance Sheets, with changes in the fair value of qualifying hedges recorded in accumulated other comprehensive income (loss), a component of stockholders’ equity. The Company records the changes in a derivative’s fair value in earnings unless specific accounting criteria related to hedging are met. The Company formally documents, designates and assesses the effectiveness of transactions that receive hedge accounting treatment. Currently, all of the Company’s cash flow hedge contracts are deemed effective. The settlement of these derivatives will result in reclassifications from accumulated other comprehensive (loss) income to earnings in the period during which the hedged transactions affect earnings.
While the Company expects that its derivative instruments will continue to meet the conditions for hedge accounting, if the hedges did not qualify as highly effective or if the Company did not believe that forecasted transactions would occur, the changes in the fair value of the derivatives designated as hedges would be reflected immediately in earnings.
Inventories—Inventories are stated at the lower of average cost or market. The Company regularly reviews inventories for obsolescence and calculates a reserve based on historical write-offs, customer demand, product evolution, usage rates and quantities of stock on hand. Inventory in excess of estimated usage requirements is written down to its estimated net realizable value.
Property, Plant and Equipment—Property, plant and equipment are stated at cost less accumulated depreciation. MacDermid records depreciation on a straight-line basis over the estimated useful life of each asset. Estimated useful lives by asset class are as follows:
| Furniture, fixtures, automobiles, computers, etc | 3 to 5 years | |
| Machinery and equipment | 5 to 15 years | |
| Buildings | 20 years | |
| Building improvements | 15 to 20 years | |
| Leasehold improvements | lesser of useful life or lease life |
F-13
Table of Contents
MACDERMID, INCORPORATED AND SUBSIDIARIES
NOTES TO CONSOLIDATED FINANCIAL STATEMENTS—(CONTINUED)
(In thousands, except share and per share amounts)
1. BASIS OF PRESENTATION AND SUMMARY OF SIGNIFICANT ACCOUNTING POLICIES (CONTINUED)
Maintenance and repair costs are charged directly to expense; renewals and betterments which significantly extend the useful life of the asset are capitalized. Costs and accumulated depreciation on assets, retired or disposed of, are removed from the accounts and any resulting gains or losses are recorded to earnings in the period of disposal.
Goodwill and Indefinite-Lived Purchased Intangible Assets—Goodwill represents the excess of the purchase price over the fair value of the identifiable net assets of an acquired business. The Company does not amortize goodwill and other intangible assets that have indefinite useful lives; rather, goodwill and other intangible assets with indefinite lives are tested for impairment. Goodwill is tested for impairment at the reporting unit level annually, or when events or changes in circumstances indicate that goodwill might be impaired. The Company’s annual test for goodwill impairment is performed as of April 1st, utilizing a two-step impairment test procedure for each of our reporting units. In the first step of impairment testing, the fair value of each reporting unit is compared to its carrying value. The fair value of a reporting unit is determined based on the present value of estimated discounted future cash flows. If the fair value of the reporting unit exceeds the carrying value of the net assets assigned to that reporting unit, goodwill is not impaired, and no further testing is performed. If the carrying value of the net assets assigned to the reporting unit exceeds the fair value of the reporting unit, then the second step of the impairment test must be performed to determine the implied fair value of the reporting unit’s goodwill. If the carrying value of a reporting unit’s goodwill exceeds its implied fair value, an impairment loss is recorded equal to the difference.
Indefinite-lived intangible assets are reviewed for potential impairment on an annual basis, or when events or changes in circumstances indicate that indefinite-lived intangible assets might be impaired. Indefinite-lived intangible assets are reviewed for impairment at the reportable business unit level for which identifiable revenues are reported. The Company’s annual test for indefinite–lived intangible asset impairment is performed as of April 1st. Indefinite-lived intangible assets are reviewed for impairment by comparing the estimated fair value of the indefinite-lived purchased intangible assets to the carrying value. The estimated fair value of these intangible assets is determined using the “relief from royalty” approach. An impairment loss is recognized when the estimated fair value of an indefinite-lived intangible asset is less than the carrying value.
Long-lived Assets Including Finite-Lived Purchased Intangible Asset—Finite-lived intangible assets such as developed technology and customer lists are amortized on a straight-line basis over their estimated useful lives, which are currently ten years for developed technology and range between three and twenty one years for customer lists. The Company evaluates long-lived assets, such as property, plant and equipment and purchased intangible assets with finite lives, for impairment whenever events or changes in circumstances indicate the carrying value of an asset may not be recoverable. If circumstances require a long-lived asset group to be tested for possible impairment, the Company first determines if the estimated undiscounted future cash flows expected to result from the use of the asset plus net proceeds expected from disposition of the asset, if any, are less than the carrying value of the asset. When an impairment is identified, the carrying amount of the asset is reduced to its estimated fair value based on a discounted cash flow approach or, when available and appropriate, to comparable market values.
Asset Retirement Obligations—MacDermid records the fair value of legal obligations associated with the retirement of tangible long-lived assets in the period in which they are determined to exist, if a reasonable estimate of fair value can be made. Upon initial recognition of a liability, the Company capitalizes the cost of the asset retirement obligation by increasing the carrying amount of the related long-lived asset. Over time, the liability is increased for changes in its present value and the capitalized cost is depreciated over the useful life of the related asset.
F-14
Table of Contents
MACDERMID, INCORPORATED AND SUBSIDIARIES
NOTES TO CONSOLIDATED FINANCIAL STATEMENTS—(CONTINUED)
(In thousands, except share and per share amounts)
1. BASIS OF PRESENTATION AND SUMMARY OF SIGNIFICANT ACCOUNTING POLICIES (CONTINUED)
Employee Benefits—MacDermid sponsors a variety of employee benefit programs, some of which are non-contributory. The accounting policies used to account for these plans are as follows:
Retirement—MacDermid provides non-contributory defined benefit plans to domestic and certain foreign employees. The projected unit credit actuarial method is used for financial reporting purposes. The Company recognizes the funded status; the difference between the fair value of the plan assets and the projected benefit obligation (pension plans) or the accumulated postretirement benefit obligation (other postretirement plan) in its Consolidated Balance Sheets. The Company’s funding policy for qualified plans is consistent with federal or other local regulations and customarily equals the amount deductible for federal and local income tax purposes. Foreign subsidiaries contribute to other plans, which may be administered privately or by government agencies in accordance with local regulations. MacDermid also provides the defined contribution Savings Plan (401(a), (k) and 501(a)) for substantially all domestic employees. MacDermid may make discretionary contributions to the Savings Plan, but there were no discretionary contributions made to the Savings Plan during the years ended December 31, 2011, 2010 and 2009.
Post-retirement —MacDermid currently accrues for post-retirement health care benefits for U.S. employees hired prior to April 1, 1997. The post-retirement health care plan is unfunded.
Post-employment—MacDermid currently accrues for post-employment disability benefits to United Kingdom (“U.K.”) employees meeting specified service requirements. The post-employment benefits plan is unfunded.
Financial Instruments—The Company’s financial instruments consist primarily of cash and cash equivalents, accounts receivable, investments, accounts payable and current and long-term debt. The Company believes that the carrying value of the cash and cash equivalents, accounts receivable and accounts payable are representative of their respective fair values. Available for sale equity investments are carried at fair value with net unrealized gains or losses reported as a component of accumulated other comprehensive (loss) income. See Note 14 for the fair value of the Company’s financial instruments
Foreign Operations—The assets and liabilities of MacDermid’s foreign subsidiaries are translated into U.S. dollars using foreign currency exchange rates prevailing as of the balance sheet dates. Revenue and expense accounts are translated at weighted-average foreign currency exchange rates for the periods presented. Cumulative currency translation adjustments are included in accumulated other comprehensive income (loss) in the stockholders’ equity section of the Consolidated Balance Sheets. Gains and losses realized from foreign currency transactions are included in miscellaneous income (expense) in the Consolidated Statement of Operations and Comprehensive Income (Loss). Gains and losses arising from intercompany loan transactions that contain fixed repayment terms are reported as remeasurement gains and losses in miscellaneous income (expense) in the Consolidated Statement of Operations and Comprehensive Income (Loss).
Revenue Recognition—MacDermid recognizes revenue, including freight charged to customers, when the earnings process is complete. This occurs when products are shipped to or received by the customer in accordance with the terms of the agreement, title and risk of loss have been transferred, collectability is probable and pricing is fixed or determinable. Shipping terms are customarily “FOB shipping point” and do not include right of inspection or acceptance provisions. Equipment sales arrangements may include right of inspection or acceptance provisions, in which case revenue is deferred until these provisions are satisfied.
F-15
Table of Contents
MACDERMID, INCORPORATED AND SUBSIDIARIES
NOTES TO CONSOLIDATED FINANCIAL STATEMENTS—(CONTINUED)
(In thousands, except share and per share amounts)
1. BASIS OF PRESENTATION AND SUMMARY OF SIGNIFICANT ACCOUNTING POLICIES (CONTINUED)
Cost of Sales—Cost of sales consists primarily of raw material costs and related purchasing and receiving costs used in the manufacturing process, direct salary and wages and related fringe benefits, packaging costs, shipping and handling costs, plant overhead and other costs associated with the manufacture and distribution of MacDermid’s products.
Selling, Technical and Administrative Expenses—Selling, technical and administrative expenses consist primarily of personnel and travel costs, advertising and marketing expenses, administrative expenses associated with accounting, finance, legal, human resource, risk management and overhead associated with these functions.
Research and Development—Research and development costs are expensed as incurred.
Amortization—Amortization expense represents the expense of finite-lived intangible assets expensed over a straight-line basis based upon their estimated useful lives. As of December 31, 2011, the net carrying amount of the Company’s customer list intangible assets with differing useful lives are as follows:
| Customer list intangible assets (useful lives of three to nine years) |
$ | 20,897 | ||
| Customer list intangible assets (useful lives of 12 to 13 years) |
$ | 31,871 | ||
| Customer list intangible assets (useful lives of 20 to 21 years) |
$ | 119,439 |
Income Taxes—The provision for income taxes includes federal, foreign, state and local income taxes currently payable by the Company. Deferred income taxes are recognized at currently enacted tax rates for temporary differences between the financial reporting and income tax basis of assets and liabilities. Deferred taxes are not provided on the undistributed earnings of subsidiaries operating outside the United States of America (“U.S.”) that are determined to be permanently reinvested.
Equity-based Compensation Plans—MacDermid granted Class A Junior Shares (“A Shares”) to employees who invested funds in the Company. The A Shares are accounted for by using the fair value method of accounting for all equity-based compensation. The resulting expense is amortized over the period in which the A Shares vest. MacDermid granted Class B Junior Performance Shares (“B Shares”) to senior management employees in 2008. The B Shares are accounted for by using the fair value method of accounting for all equity-based compensation. See Note 8 for further information regarding the Company’s equity compensation plans.
New Accounting Standards—In May 2011, the FASB issued ASU No. 2011-04, “Fair Value Measurement.” This ASU clarifies the concepts related to highest and best use and valuation premise, blockage factors and other premiums and discounts, the fair value measurement of financial instruments held in a portfolio and of those instruments classified as a component of shareowners’ equity. The guidance includes enhanced disclosure requirements about recurring Level 3 fair value measurements, the use of nonfinancial assets, and the level in the fair value hierarchy of assets and liabilities not recorded at fair value. The provisions of this ASU are effective prospectively for interim and annual periods beginning on or after December 15, 2011. Early application is prohibited. The Company does not anticipate the adoption of this new ASU to have a material impact on its financial statements.
In June 2011, the FASB issued ASU No. 2011-05, “Comprehensive Income.” This ASU intends to enhance comparability and transparency of other comprehensive income components. The guidance provides an option to present total comprehensive income, the components of net income and the components of other comprehensive income in a single continuous statement or two separate but consecutive statements. This ASU eliminates the option to present other comprehensive income components as part of the statement of changes in shareholders’
F-16
Table of Contents
MACDERMID, INCORPORATED AND SUBSIDIARIES
NOTES TO CONSOLIDATED FINANCIAL STATEMENTS—(CONTINUED)
(In thousands, except share and per share amounts)
equity. The provisions of this ASU will be applied retrospectively for interim and annual periods beginning after December 15, 2011. Early application is permitted. The Company adopted this ASU in the fourth quarter of 2011. Since this standard impact presentation and disclosure requirements only, the adoption did not have a material impact on the Company’s consolidated results of operations or financial condition.
In September 2011, the FASB issued ASU No. 2011-08, “Testing Goodwill for Impairment”. This ASU allows an entity to first assess qualitative factors to determine whether it is necessary to perform the two-step quantitative goodwill impairment test. Under this new ASU, if a company chooses the qualitative method, an entity would not be required to calculate the fair value of a reporting unit unless the entity determines, based on a qualitative assessment, that it is more likely than not that its fair value is less than its carrying amount. The provisions of this ASU are effective prospectively for interim and annual impairment tests performed for fiscal years beginning after December 15, 2011. Early application is permitted. The Company does not anticipate the adoption of this new ASU to have a material impact on its financial statements.
2. CORPORATE REORGANIZATION (UNAUDITED)
Prior to the time the registration statement in respect of the offering (the “offering”) of common stock by MacDermid Group, Inc. (“MacDermid Group”) is declared effective, the board of directors will approve a corporate reorganization (the “Corporate Reorganization”), pursuant to which, among other things, (1) the Company will effect a 1-for-5 reverse stock split (the “Reverse Stock Split”) of the Company’s common stock, A Shares and B Shares, (2) MacDermid Holdings, LLC and the Savings Plan, which comprise the existing stockholders of the Company, will exchange their shares of Company preferred stock, common stock, A Shares and B Shares for shares of MacDermid Group common stock, in each case in accordance with our applicable governing documents (the “Exchange”) and (3) MacDermid Holdings, LLC will liquidate and distribute the shares of common stock of MacDermid Group received by it in connection with the Exchange to the holders of its membership interests in accordance with the terms of the MacDermid Holdings, LLC operating agreement. Holders of vested A Shares and B Shares will receive shares of MacDermid Group common stock then held by MacDermid Holdings, LLC in accordance with the provisions of the MacDermid Holdings, LLC operating agreement. Holders of unvested A Shares and B Shares will receive restricted shares of MacDermid Group common stock that are subject to substantially identical vesting terms as the existing A Shares and B Shares, respectively. The number of shares of MacDermid Group common stock to be received by holders of vested and unvested A Shares and B Shares will be based on the initial public offering price.
The Reverse Stock Split will be consummated prior to the time the registration statement is declared effective, and the Exchange will be consummated following the time the registration statement is declared effective and the pricing of the offering, but prior to the closing of the offering, based on the initial public offering price.
The number of shares of the Company’s common stock, A Shares and B Shares outstanding have been adjusted retroactively in these financial statements to reflect the Reverse Stock Split in all periods presented. The number of A Shares and B Shares issuable under our equity compensation plans have also been adjusted retroactively in these financial statements to reflect the Reverse Stock Split in all periods presented.
Pro forma basic and pro forma diluted net income per share of common stock have been computed to give effect to the Exchange, the effect of which is to reflect (1) the effective conversion of our cumulative preferred stock, including the accumulated payment in kind dividend with respect to such preferred stock at the time of the
F-17
1. BASIS OF PRESENTATION AND SUMMARY OF SIGNIFICANT ACCOUNTING POLICIES (CONTINUED)
Table of Contents
MACDERMID, INCORPORATED AND SUBSIDIARIES
NOTES TO CONSOLIDATED FINANCIAL STATEMENTS—(CONTINUED)
(In thousands, except share and per share amounts)
2. CORPORATE REORGANIZATION (UNAUDITED) (CONTINUED)
offering, into common stock of the MacDermid Group and (2) the effective payment of a stock preference, in the form of MacDermid Group common stock, in respect of the Company’s common stock, in each case, in accordance with our applicable governing documents. The numerator in the calculation of net income (loss) attributable to common shares of the Company in the pro forma basic and pro forma diluted net income per share calculation has been increased to reflect the elimination of the payment in kind dividend as a result of the effective conversion of the Company’s preferred stock to common stock as described above, as if the Exchange had occurred at the beginning of the period. In accordance with our governing documents, the preferred shares (including the accumulated payment in kind dividend) will be exchanged for MacDermid Group common shares based on the initial public offering price less the underwriting discount. As a result, holders of the preferred shares will be deemed to have received a dividend attributable to the underwriting discount in an aggregate amount of $33,400 as of December 31, 2011. In accordance with applicable accounting guidance, this deemed dividend is not included in net income for purposes of the pro forma basic and diluted net income per share calculations. The amount of the stock preference effectively paid to holders of the Company’s common stock after giving effect to the Reverse Stock Split is $0.50 per share of the Company’s common stock. As a result of the Exchange, each holder of each share of the A Shares and B Shares will receive 0.78 shares of MacDermid Group common stock, other than a small number of such shares that were recently granted.
The following table presents the unaudited pro forma basic and pro forma diluted net loss per share (in thousands, except share and per share amounts):
| 2011 | ||||
| Pro forma net income per share (unaudited) |
||||
| Numerator: |
||||
| Net loss attributable to common shares |
$ | (39,860 | ) | |
| Add: accrued payment in-kind dividend on cumulative preferred shares |
40,847 | |||
|
|
|
|||
| Net income used to compute pro forma net income per share, basic and diluted |
$ | 987 | ||
|
|
|
|||
| Denominator basic: |
||||
| Outstanding shares subsequent to the Corporate Reorganization |
31,387,359 | |||
|
|
|
|||
| Pro forma weighted average number of shares outstanding, basic |
31,387,359 | |||
|
|
|
|||
| Denominator diluted: |
||||
| Outstanding shares subsequent to the Corporate Reorganization, basic and diluted |
31,387,359 | |||
| Outstanding shares converted from the A Shares and the B Shares, subsequent to the Corporate Reorganization |
122,199 | |||
|
|
|
|||
| Pro forma weighted average number of shares outstanding, diluted |
31,509,558 | |||
|
|
|
|||
| Pro forma net income attributable to common shares, basic and diluted |
$ | 0.03 | ||
|
|
|
|||
3. MERGER AND CHANGE IN BASIS OF ACCOUNTING
On September 5, 2006, Daniel H. Leever, MacDermid’s Chairman and Chief Executive Officer, together with Court Square, a related party, submitted a proposal to the MacDermid, Incorporated (“predecessor”) Board of Directors to acquire all of the predecessor’s outstanding common stock at a price of $32.50 per share in cash. On December 15, 2006, predecessor signed a definitive merger agreement, under which Daniel H. Leever,
F-18
Table of Contents
MACDERMID, INCORPORATED AND SUBSIDIARIES
NOTES TO CONSOLIDATED FINANCIAL STATEMENTS—(CONTINUED)
(In thousands, except share and per share amounts)
3. MERGER AND CHANGE IN BASIS OF ACCOUNTING (CONTINUED)
MacDermid’s Chairman and Chief Executive Officer, and investment funds managed by Court Square, a related party, and Weston Presidio, a related party to acquire predecessor in a transaction valued at over $1.3 billion, including the assumption or repayment of approximately $301,500 of debt. Under terms of the December 15, 2006 merger agreement, predecessor shareholders received $35.00 in cash for each share of predecessor common stock. On April 12, 2007, the Company and Matrix Acquisition Corp. (“Matrix”), an entity established for the acquisition and later merged into the Company, finalized the merger between the Company and Matrix.
In connection with the closing of the merger (the “Merger”), Matrix accepted for purchase approximately $298,830 aggregate principal amount of the predecessor’s 9 1/8% Senior Subordinated Notes due 2011 (the “Notes”) that were validly tendered pursuant to Matrix’s previously announced cash tender offer and solicitation of consents, representing approximately 99% of the Notes outstanding. The settlement of the purchase of such notes occurred concurrently with the closing of the Merger.
On April 12, 2007, the Company borrowed $610,000 under a senior secured credit facility with two tranches. The first tranche was in the amount of $360,000, which was denominated in U.S. Dollars and the second tranche was in the amount of $250,000, which was denominated in Euros.
Also, in connection with the closing of the Merger, Matrix sold $350,000 in aggregate principal amount of 9 1/2% senior subordinated notes due 2017 in a private offering. The senior subordinated notes have not been and will not be registered under the Securities Act of 1933 (as amended, the “Securities Act”), and may not be offered or sold in the U.S. absent registration or an applicable exemption from the registration requirements of the Securities Act and applicable state securities laws.
Prior to the Merger, the Company had borrowed approximately $15,000 denominated in Japanese Yen to help facilitate the Merger transaction.
Upon completion of the Merger, each share of predecessor Common Stock issued and outstanding immediately prior to the effective time of the Merger (other than shares held in the treasury of predecessor), was converted into the right to receive $35.00 in cash. In addition, in connection with the Merger, Daniel H. Leever, MacDermid’s Chairman and Chief Executive Officer and who, prior to the Merger, was also predecessor’s Chairman and Chief Executive Officer, exchanged equity interests in predecessor for equity investments in the surviving corporation. Mr. Leever and four members of management exchanged 308,214 shares of Predecessor common stock, valued at $35.00 per share, into an equivalent dollar value of equity securities of MDI Holdings, LLC (“MDI”), an entity formed by Court Square, Weston Presidio and Daniel H. Leever. Additionally, all outstanding employee predecessor equity instruments, which included stock options and restricted stock, became fully vested and unrestricted. Predecessor employee stock options were exercised into predecessor common stock and along with unrestricted stock of the predecessor, were exchanged at $35.00 per share for shares in MDI. Also in connection with the Merger, certain members of MacDermid’s management team made equity investments in the surviving corporation through additional cash contributions.
The Merger has been accounted for as an acquisition, using the purchase method of accounting, from the date of completion, April 12, 2007. MacDermid’s tangible assets and liabilities and intangible assets were recorded at their fair value resulting in a new carrying basis for those assets and liabilities. The Merger resulted in MacDermid having an entirely new and significantly different capital structure. Subsequent to the Merger transaction date of April 12, 2007, the Company has recorded purchase adjustments related to the Company’s balances of land, buildings, equipment, goodwill and intangible assets. In 2007, the Company’s management determined the fair
F-19
Table of Contents
MACDERMID, INCORPORATED AND SUBSIDIARIES
NOTES TO CONSOLIDATED FINANCIAL STATEMENTS—(CONTINUED)
(In thousands, except share and per share amounts)
3. MERGER AND CHANGE IN BASIS OF ACCOUNTING (CONTINUED)
value of MacDermid’s tangible assets and liabilities and intangible assets with the assistance of an outside valuation firm. The Company has recorded all assets acquired and liabilities assumed at their respective fair value as of April 13, 2007. The Company completed the accounting for the goodwill allocation in 2008.
4. DISCONTINUED OPERATIONS
On September 13, 2007, the Company announced an agreement to sell its MacDermid ColorSpan (“ColorSpan”) business unit to Hewlett Packard (“HP”). On November 1, 2007, the sale of ColorSpan to HP was finalized. The net sales price was $130,850 before income taxes and was subject to certain closing conditions. The Company recorded a $7,000 receivable from HP related to amounts due to MacDermid based upon the purchase and sale agreement and which is subject to adjustments for a period of twenty four months subsequent to the closing date of the purchase and sale agreement. The Company recognized a loss on the disposition of the ColorSpan business unit of approximately $533 in 2007. The loss increased by $975 in 2008, net of tax as a result of additional adjustment of outstanding claims and certain indemnities in conjunction with the disposition of the Company’s ColorSpan business. During 2009, the Company determined the collectability of the receivable from HP was uncertain and wrote off the remaining receivable $5,500, net of tax of $875. While the Company received a claim in excess of the $7,000 in escrow, management had determined the amount in escrow is their best estimate of the potential settlement. Additionally during 2009, an environmental reserve liability related to the ColorSpan sale of $300 was reversed, net of tax of $105. During 2010, there were no additional costs incurred for ColorSpan discontinued operations. Also during 2010, the Company reached an agreement with HP regarding the $7,000 escrow receivable. The agreement required the release of the escrow receivable to HP and resulted in no additional amounts payable to HP.
The Company classified the results of the ColorSpan business as discontinued operations in its Consolidated Statements of Operations and Comprehensive Income (Loss) for all periods presented. The following table summarizes the results of operations for ColorSpan:
| For the years ended | ||||||||||||
| Discontinued Operations |
December 31, 2011 | December 31, 2010 | December 31, 2009 | |||||||||
| Net sales |
$ | — | $ | — | $ | — | ||||||
| Gross profit |
— | — | — | |||||||||
| Operating profit |
— | — | (5,200 | ) | ||||||||
| Income tax benefit (expense) |
— | — | 770 | |||||||||
| Other |
— | — | — | |||||||||
|
|
|
|
|
|
|
|||||||
| (Loss) from discontinued operations |
$ | — | $ | — | $ | (4,430 | ) | |||||
|
|
|
|
|
|
|
|||||||
On March 18, 2008, the Company announced an agreement to sell its Offset Printing Blankets (“Offset”) business to Trelleborg AB of Sweden (“Trelleborg”). On May 31, 2008, the sale of Offset to Trelleborg was finalized. The net sales price was $67,398 before income taxes. Included in the table below for the year ended December 31, 2008, is a gain from the Offset disposition of $1,506, net of taxes of $8,826, which is included in the operating profit line. In 2009, the Company finalized the accounting for the Offset sale and recorded a loss of $267, net of tax of $249. During 2010, there were no additional costs incurred for Offset discontinued operations. The Company classified the results of the Offset business as discontinued operations in its Consolidated
F-20
Table of Contents
MACDERMID, INCORPORATED AND SUBSIDIARIES
NOTES TO CONSOLIDATED FINANCIAL STATEMENTS—(CONTINUED)
(In thousands, except share and per share amounts)
4. DISCONTINUED OPERATIONS (CONTINUED)
Statements of Operations and Comprehensive Income (Loss) for all periods presented. The following table summarizes the results of operations for Offset:
| For the years ended | ||||||||||||
| Discontinued Operations |
December 31, 2011 | December 31, 2010 | December 31, 2009 | |||||||||
| Net sales |
$ | — | $ | — | $ | — | ||||||
| Gross profit |
— | — | — | |||||||||
| Operating profit |
— | — | (267 | ) | ||||||||
| Income tax benefit (expense) |
— | — | 249 | |||||||||
| Other |
— | — | — | |||||||||
|
|
|
|
|
|
|
|||||||
| (Loss) income from discontinued operations |
$ | — | $ | — | $ | (18 | ) | |||||
|
|
|
|
|
|
|
|||||||
5. IMPAIRMENT LOSS
The Company recorded impairment losses to goodwill, intangibles and property, plant and equipment as summarized below:
| For the years ended | ||||||||||||
| December 31, 2011 | December 31, 2010 | December 31, 2009 | ||||||||||
| Goodwill |
||||||||||||
| Industrial |
$ | — | $ | — | $ | 41,212 | ||||||
| Printing |
— | — | — | |||||||||
|
|
|
|
|
|
|
|||||||
| Total goodwill impairment |
— | — | 41,212 | |||||||||
|
|
|
|
|
|
|
|||||||
| Other intangible assets |
||||||||||||
| Industrial |
46,438 | — | 195 | |||||||||
| Printing |
— | — | — | |||||||||
| Corporate |
— | — | 26,100 | |||||||||
|
|
|
|
|
|
|
|||||||
| Total other intangible asset impairment |
46,438 | — | 26,295 | |||||||||
|
|
|
|
|
|
|
|||||||
| Property, plant and equipment |
||||||||||||
| Industrial |
— | — | — | |||||||||
| Printing |
— | — | 1,185 | |||||||||
|
|
|
|
|
|
|
|||||||
| Total property, plant and equipment impairment |
— | — | 1,185 | |||||||||
|
|
|
|
|
|
|
|||||||
| Total asset impairment charges |
$ | 46,438 | $ | — | $ | 68,692 | ||||||
|
|
|
|
|
|
|
|||||||
2011
During the year ended December 31, 2011, the Company recorded $46,438 of impairment charges related to a write down of customer list intangible assets in its Industrial Asia reporting unit to their estimated fair values. During the third quarter of 2011, the Company concluded that certain indicators were present suggesting a potential impairment of the customer list intangible assets of the Industrial Asia reporting unit. The indicators of this potential impairment included:
| • | Recent reductions in gross profit margins of certain products; |
| • | Increases in raw material prices used in our manufacturing process that were difficult to pass along to customers; |
| • | Increased pricing pressure for certain of our products from competitors; and |
F-21
Table of Contents
MACDERMID, INCORPORATED AND SUBSIDIARIES
NOTES TO CONSOLIDATED FINANCIAL STATEMENTS—(CONTINUED)
(In thousands, except share and per share amounts)
5. IMPAIRMENT LOSS (CONTINUED)
| • | Customers reluctance to accept product price increases and our reluctance to continue selling certain products, which require technical support, at low margin levels. |
Based upon the above indicators the Company evaluated its customer list intangible assets for potential impairment in the third quarter of 2011. The Company utilized an “income approach” method to test the Industrial Asia customer list intangible assets for impairment. In step one of the impairment testing, the Company compared the carrying amounts of the Industrial Asia customer list intangible assets to the undiscounted cash flows expected to be generated from the use and eventual disposition of the customer list intangible assets over their remaining useful lives. Four of the Company’s businesses in the Industrial Asia reporting unit passed the first step of our testing procedures, with significant headroom. Two of the Company’s businesses in the Industrial Asia reporting unit failed the first step of the testing procedures; therefore, the Company performed the second step of its impairment testing procedures. In the second step of the testing procedures, the estimated fair value of the Industrial Asia customer list intangible assets was determined by estimating the after-tax cash flows attributable to the assets and then discounting these cash flows to their present values using a risk-adjusted discount rate. The cash flow model utilized in the customer list intangible asset impairment test involves significant judgments related to future growth rates, discount rates and tax rates, among other considerations. The Company’s step two testing procedures indicated that customer list intangible assets of two of its businesses in the Industrial Asia reporting unit were impaired because the carrying value of these assets exceeded their estimated fair value by $46,438.
In 2011, there was no impairment of goodwill or property, plant and equipment assets.
2010
In 2010, there was no impairment of goodwill, intangible or property, plant and equipment assets.
2009
The goodwill impairment charges were the result of lower sales levels because of the global economic recession and therefore lower profitability. The global economic recession resulted in weakening conditions in the automotive, industrial and electronic markets the Company served, which resulted in lower profitability in our Industrial segment. The first step of the goodwill impairment testing indicated that the carrying values of the Industrial Americas and Industrial Asia reporting units exceeded their fair values as of the testing date. The Company determined the fair values of the reporting units utilizing a discounted cash flow model. The cash flow model utilized in the goodwill impairment test involves significant judgments related to future growth rates, discount rates and tax rates, among other considerations. Because the first step indicated a potential impairment, the Company performed the second step as required by comparing the implied value of the goodwill as calculated in a hypothetical purchase transaction to the book value of the goodwill as of the testing date. The second step of the impairment testing indicated that the book values of the Industrial Americas and Industrial Asia reporting units’ goodwill exceeded the implied fair values of that goodwill. The implied fair values were determined by reviewing the current assets and liabilities; property, plant and equipment; and other identifiable intangible assets (both those recorded and not recorded) to determine the appropriate fair values of the reporting units’ assets and liabilities in a hypothetical purchase transaction. The Company hired independent valuation experts to assist management in determining the fair values of the Industrial Americas and Industrial Asia land, building and intangible assets balances to utilize in step two of the goodwill impairment test. The fair values of Industrial Americas and Industrial Asia assets and liabilities were then compared to the book values of the Industrial Americas and Industrial Asia to determine an implied value of the reporting units’ goodwill. As a result, an impairment charge of approximately $14,600 and $26,600, respectively, was recorded for the Industrial Americas and Industrial Asia reporting units’ goodwill during 2009.
F-22
Table of Contents
MACDERMID, INCORPORATED AND SUBSIDIARIES
NOTES TO CONSOLIDATED FINANCIAL STATEMENTS—(CONTINUED)
(In thousands, except share and per share amounts)
5. IMPAIRMENT LOSS (CONTINUED)
During 2009, the Company reviewed its indefinite-lived intangible assets for impairment. The Company determined, with the assistance of an independent valuation firm, the fair value of the indefinite-lived intangible assets. Company management concluded that the estimated direct cash flows associated with the applicable intangible assets using a “relief from royalty” methodology associated with revenues projected to be generated from these intangible assets were less than the carrying value of the intangible assets. This analysis indicated that a certain tradename was impaired by $26,100. The Company recorded an impairment charge of $26,100 related to this tradename during 2009.
During 2009, the carrying value of equipment at a certain business unit in the Printing Americas reporting unit was evaluated due to softening business conditions. This evaluation indicated that the carrying values of certain equipment were not recoverable, as the expected undiscounted future cash flows to be generated by them were less than their carrying values. The related impairment loss was measured based on the amount by which the asset carrying values exceeded fair value. The asset fair value was based on estimates of prices for similar assets. As a result of the above evaluation, the Company recorded a $1,185 asset impairment charge in 2009. The Company recorded a $427 tax benefit related to this asset impairment charge during 2009.
During 2009, the Company also recorded an impairment charge of $195 related to customer list intangible assets in the Industrial Europe reporting unit because of the loss of sales to outside customers.
6. INVENTORIES
The major components of inventory were as follows:
| December 31, 2011 | December 31, 2010 | |||||||
| Finished goods |
$ | 46,142 | $ | 47,399 | ||||
| Raw materials and supplies |
26,535 | 30,867 | ||||||
| Equipment |
2,509 | 2,046 | ||||||
|
|
|
|
|
|||||
| Total inventory, net |
$ | 75,186 | $ | 80,312 | ||||
|
|
|
|
|
|||||
As of December 31, 2011 and 2010, the reserve for inventory was $9,611 and $10,106, respectively.
7. PROPERTY, PLANT AND EQUIPMENT
The major components of property, plant and equipment were as follows:
| December 31, 2011 | December 31, 2010 | |||||||
| Land and improvements |
$ | 23,900 | $ | 23,286 | ||||
| Buildings and improvements |
61,394 | 61,494 | ||||||
| Machinery, equipment and fixtures |
87,838 | 82,603 | ||||||
|
|
|
|
|
|||||
| Total property |
173,132 | 167,383 | ||||||
| Less accumulated depreciation |
(76,216 | ) | (62,012 | ) | ||||
|
|
|
|
|
|||||
| Total property, plant and equipment, net |
$ | 96,916 | $ | 105,371 | ||||
|
|
|
|
|
|||||
For the years ended December 31, 2011, 2010 and 2009, the Company recorded depreciation expense of $18,167, $16,850 and $17,937, respectively.
F-23
Table of Contents
MACDERMID, INCORPORATED AND SUBSIDIARIES
NOTES TO CONSOLIDATED FINANCIAL STATEMENTS—(CONTINUED)
(In thousands, except share and per share amounts)
8. GOODWILL AND OTHER INTANGIBLE ASSETS
The following table presents goodwill allocated to the reportable segments:
| Reportable Segment | ||||||||||||
| Industrial | Printing | Total | ||||||||||
| Balance as of January 1, 2010 |
438,443 | 28,480 | 466,923 | |||||||||
| Foreign currency adjustments |
10,560 | — | 10,560 | |||||||||
| Revisions |
— | — | — | |||||||||
| Impairment charge |
— | — | — | |||||||||
|
|
|
|
|
|
|
|||||||
| Goodwill balance at December 31, 2010 |
449,003 | 28,480 | 477,483 | |||||||||
| Foreign currency adjustments |
2,402 | — | 2,402 | |||||||||
| Revisions |
(5,304 | ) | — | (5,304 | ) | |||||||
| Impairment charge |
— | — | — | |||||||||
|
|
|
|
|
|
|
|||||||
| Goodwill balance at December 31, 2011 |
$ | 446,101 | $ | 28,480 | $ | 474,581 | ||||||
|
|
|
|
|
|
|
|||||||
Accumulated goodwill impairment related to the Industrial reporting segment as of December 31, 2011 and 2010 was $57,515, respectively.
Intangible assets are as follows:
| December 31, 2011 | December 31, 2010 | |||||||||||||||||||||||
| Gross Carrying Amount |
Accumulated Amortization |
Net Carrying Amount |
Gross Carrying Amount |
Accumulated Amortization |
Net Carrying Amount |
|||||||||||||||||||
| Customer lists |
$ | 272,336 | $ | (100,129 | ) | $ | 172,207 | $ | 320,549 | $ | (81,244 | ) | $ | 239,305 | ||||||||||
| Developed technology |
83,318 | (39,298 | ) | 44,020 | 83,354 | (30,980 | ) | 52,374 | ||||||||||||||||
| Tradenames |
57,878 | — | 57,878 | 57,890 | — | 57,890 | ||||||||||||||||||
|
|
|
|
|
|
|
|
|
|
|
|
|
|||||||||||||
| Total |
$ | 413,532 | $ | (139,427 | ) | $ | 274,105 | $ | 461,793 | $ | (112,224 | ) | $ | 349,569 | ||||||||||
|
|
|
|
|
|
|
|
|
|
|
|
|
|||||||||||||
For the years ended December 31, 2011, 2010 and 2009, the Company recorded amortization expense on intangible assets of $28,578, $29,694 and $29,868, respectively.
Estimated future amortization of intangible assets is as follows:
| Year end |
||||
| 2012 |
$ | 26,524 | ||
| 2013 |
26,524 | |||
| 2014 |
26,524 | |||
| 2015 |
22,219 | |||
| 2016 |
20,320 | |||
| Thereafter |
94,116 | |||
|
|
|
|||
| Total |
$ | 216,227 | ||
|
|
|
F-24
Table of Contents
MACDERMID, INCORPORATED AND SUBSIDIARIES
NOTES TO CONSOLIDATED FINANCIAL STATEMENTS—(CONTINUED)
(In thousands, except share and per share amounts)
9. EQUITY COMPENSATION PLANS
On April 13, 2007, MacDermid authorized and issued 430,000 A Shares to employees who purchased both preferred and common shares of MacDermid, Incorporated as part of a $7,000 management buy-in of both preferred and common shares of MacDermid, Incorporated at the time of the Merger. Under the existing terms of the A Shares, vesting of the A Shares occurs evenly over a five year period and requires continued employment. Forfeited A Shares can be reissued at the Board of Directors’ discretion. Holders of the A Shares are not entitled to any dividends at the time that they vest. However, holders of vested A Shares are entitled to distributions if declared by the board of directors of MacDermid Holdings, LLC. Any such distributions, when declared, would be paid in the order of priority specified in the MacDermid Holdings, LLC operating agreement. Redemption value of the A Shares is based on a sliding formula which takes into account the final valuation of MacDermid at a “liquidity event”, such as an initial public offering or sale of the Company. At the point of the liquidity event, the A Shares will be liquidated in their order of priority or seniority, as compared to each of the Company’s debt and equity instruments. If during the liquidity event, there are not enough proceeds to redeem the Company’s debt and equity instruments with senior claims, then the A Shares may potentially have a $0 value.
The A Shares were valued at $5.00 per share for equity compensation expense purposes. The Company determined the estimated fair value of the A Shares as of the date of grant based upon the issuance price of the common stock in connection with the Merger, which was determined based on various factors including the lack of liquidity of the common stock, the general and industry specific economic outlook and the relative rights of the holders of capital stock of the Company and MacDermid Holdings, LLC to receive assets of the Company upon a liquidation event. A key assumption in determining the value of the A Shares was that the Company would attain the performance metrics required for full vesting of the B Shares because the number of B Shares vested at the time of any liquidation event would impact the amount of assets available for distribution to the A Shares upon such liquidation event. None of the specific terms of the A Shares, other than their vesting terms and the rights of the holders of the A Shares in a liquidation event relative to the rights of the holders of the common shares, preferred shares and B Shares, impact the fair value of the A Shares. The issuance of the A Shares was designed to compensate certain of the Company’s employees for their long-term commitment to the Company and, in a liquidation event, to permit employees to share in the value of equity in the Company.
As the A Shares vest, the Company records equity based compensation expense and the number of vested A Shares reflected on the balance sheet is increased. For the years ended December 31, 2011, 2010 and 2009, the Company recorded equity based compensation expense of $390, $389 and $337, respectively, based upon the vesting of the A Shares. The Company did not receive any funds upon the vesting of the A Shares. The total intrinsic value of A Shares exercised for the years ended December 31, 2011, 2010 and 2009, was $0. As of December 31, 2011 and 2010, there was $155 and $509, respectively, of unrecognized compensation cost related to the A Shares, which is expected to be recognized over a weighted average remaining period of approximately 0.4 years. As of December 31, 2011 and 2010, there were 314,245 and 236,252 vested A Shares, respectively.
F-25
Table of Contents
MACDERMID, INCORPORATED AND SUBSIDIARIES
NOTES TO CONSOLIDATED FINANCIAL STATEMENTS—(CONTINUED)
(In thousands, except share and per share amounts)
9. EQUITY COMPENSATION PLANS (CONTINUED)
The following table presents the activity in the non-vested A Shares:
| A Shares: |
A Shares | Weighted Average Grant Date Fair Value |
||||||
| Outstanding non-vested balance at December 31, 2009 |
237,387 | $ | 5.00 | |||||
| Changes during the period: |
||||||||
| Forfeited |
(1,135 | ) | ||||||
| Vesting |
(78,751 | ) | ||||||
|
|
|
|
|
|||||
| Outstanding non-vested balance at December 31, 2010 |
157,501 | $ | 5.00 | |||||
| Changes during the period: |
||||||||
| Forfeited |
(189 | ) | ||||||
| Vesting |
(78,751 | ) | ||||||
| Granted |
2,000 | $ | 5.00 | |||||
|
|
|
|
|
|||||
| Outstanding non-vested balance at December 31, 2011 |
80,561 | $ | 5.00 | |||||
|
|
|
|
|
|||||
On April 13, 2007, MacDermid authorized 324,000 B Shares for issuance. In May 2008, the Company issued 272,800 B Shares. The B Shares carry a vesting period of one to four years as well as performance requirements when issued. The Company’s Board of Directors issued the B Shares as a future compensation tool, using a valuation based method, during their annual Compensation and Equity meeting, held at the time of the financial review for the previous fiscal year’s earnings. The Company’s Board of Directors has no further obligation to issue B Shares to any employee of the Company and further issuance of B Shares is at the discretion of the Company’s Board of Directors.
The B Shares were adjusted by resolution of the Board on February 28, 2011, subject to MacDermid Holdings, LLC member consent, to take into account the divestitures and acquisitions by the Company since 2007 and the difficult global economic conditions that occurred in 2009. MacDermid Holdings, LLC member consent was completed on April 4, 2011. The change resulted in the reinstatement of shares previously forfeited under the former performance metrics. As a result of the modification of the performance metrics, the estimated fair value of the awards was determined at the date of modification. At the date of modification, the Company considered numerous objective and subjective factors, including liquidation scenarios and their respective dates and probabilities based upon management’s best estimates. As a result of the analysis, the estimated fair value at the date of modification was approximately $842. The Company determined the estimated fair value of the B Shares as of the modification date to be $3.35 per share based upon a stock valuation model of the Company’s common stock on the modification date of the B Shares. The stock valuation model that the Company utilized and that was used to estimate the fair value of the B Shares considered a number of factors including operating and financial performance, the lack of liquidity of the Company’s common stock and the relative rights of the holders of capital stock of the Company and MacDermid Holdings, LLC to receive assets of the Company upon a liquidation event. The key assumptions and estimates in determining the value of the B Shares were (1) the assumption that the Company would attain the modified performance metrics required for full vesting of the B Shares and (2) the estimation of the fair value of the Company’s common stock on the modification date of the B Shares. None of the specific terms of the B Shares, other than their vesting terms and the rights of the holders of the B Shares in a liquidation event relative to the rights of the holders of the common shares, preferred shares and A Shares, impact the fair value of the B Shares. The issuance of the B Shares was designed to compensate certain of the Company’s
F-26
Table of Contents
MACDERMID, INCORPORATED AND SUBSIDIARIES
NOTES TO CONSOLIDATED FINANCIAL STATEMENTS—(CONTINUED)
(In thousands, except share and per share amounts)
9. EQUITY COMPENSATION PLANS (CONTINUED)
employees for their long-term commitment to the Company, motivate sustained increases in the Company’s financial performance and, in a liquidation event, permit employees to share in the value of equity in the Company.
The B Shares will vest ratably on each of March 31, 2011, 2012, 2013, 2014 and 2015 (each, a “Vesting Date”) if the Company attains the modified performance metrics with respect to the calendar year immediately prior to the year of the applicable Vesting Date (a “Performance Vesting Target”). The B Shares can also be adjusted from time to time with the approval of Court Square to take into consideration any divestitures or acquisitions by the Company occurring during such year (a “Modified Performance Vesting Target”). If the Company does not attain the Performance Vesting Target for any of calendar years 2010, 2011, 2012 or 2013, but does attain the Performance Vesting Target for the immediately subsequent calendar year, then, such prior year’s Performance Vesting Target shall be deemed satisfied and such ratable portion of the B Shares that did not vest with respect to the prior calendar year shall vest on the Vesting Date for the then applicable period or upon a change of control (as defined in the MacDermid Holdings, LLC operating agreement), subject to holders of the Company’s preferred shares, common shares and A Shares having received certain threshold amounts in connection with the change of control. If the B Shares have not vested upon the earlier of March 31, 2015 or the date of the consummation of the change of control, any B Shares that have not vested shall be forfeited to the Company and shall cease to be outstanding. Holders of the B Shares are not entitled to any dividends at the time that they vest. However, holders of vested B Shares are entitled to distributions if declared by the board of directors of MacDermid Holdings, LLC. Any such distributions, when declared, would be paid in the order of priority specified in the MacDermid Holdings, LLC operating agreement.
The Performance Vesting Targets required for ratable vesting of the B Shares on the applicable Vesting Date are (1) EBITDA (as defined in the MacDermid Holdings, LLC operating agreement) for calendar year 2010 of at least $137 million; (2) EBITDA for calendar year 2011 of at least $150 million; (3) EBITDA for calendar year 2012 of at least $162 million; (4) EBITDA for calendar year 2013 of at least $172 million; and (5) EBITDA for calendar year 2014 of at least $185 million.
As the B Shares vest, the Company records equity based compensation expense and the number of vested B Shares reflected on the balance sheet is increased. During 2011, under the modified performance metrics noted above, 20% of the B Shares vested based upon the Company’s operating results of 2010. Additionally, the Company’s EBITDA for calendar year 2011 exceeded $150 million. As a result, stock compensation expense related to the vesting of the B Shares was $337 for the year ended December 31, 2011. The Company did not receive any funds upon the vesting of the B Shares. As of December 31, 2011, there was potentially $505 of unrecognized compensation cost related to the B Shares, which would be recorded if the performance metrics are achieved. If the performance metrics are achieved each year for the years from 2012 through 2014, stock based compensation of $168 would be recognized each year. As of December 31, 2011 and 2010, there were 49,878 and 0 vested B Shares, respectively.
The A Shares and B Shares have no redemption value as of December 31, 2011 or December 31, 2010, as the redemption value of each is contingent upon liquidation or dissolution of MacDermid Holdings, LLC, as described in the operating agreement governing that entity.
F-27
Table of Contents
MACDERMID, INCORPORATED AND SUBSIDIARIES
NOTES TO CONSOLIDATED FINANCIAL STATEMENTS—(CONTINUED)
(In thousands, except share and per share amounts)
9. EQUITY COMPENSATION PLANS (CONTINUED)
The following table presents the activity in the non-vested B Shares:
| B Shares: |
B Shares | Weighted Average Grant Date Fair Value |
||||||
| Outstanding non-vested balance at December 31, 2009 |
203,744 | — | ||||||
| Changes during the period: |
||||||||
| Forfeited |
(1,840 | ) | — | |||||
| Canceled |
(50,476 | ) | — | |||||
| Granted |
— | — | ||||||
|
|
|
|
|
|||||
| Outstanding non-vested balance at December 31, 2010 |
151,428 | — | ||||||
| Changes during the period: |
||||||||
| Forfeited |
— | — | ||||||
| Canceled |
— | — | ||||||
| Reinstated |
97,960 | $ | 3.35 | |||||
| Vested |
(49,878 | ) | — | |||||
| Granted |
2,000 | — | ||||||
|
|
|
|
|
|||||
| Outstanding non-vested balance at December 31, 2011 |
201,510 | — | ||||||
|
|
|
|
|
|||||
During the years ended December 31, 2010 and 2009, no compensation expense was recorded related to the B Shares as the performance condition contained in the B Shares was not probable at December 31, 2010 and 2009.
In connection with the Corporate Reorganization, holders of the A Shares and B Shares will receive MacDermid Group common stock received by MacDermid Holdings, LLC in the Exchange. See Note 2 for additional information regarding the Corporate Reorganization.
10. PENSION, POST-RETIREMENT AND POST-EMPLOYMENT PLANS
The Company has multiple deferred compensation arrangements, which are described below. The Company has defined benefit pension plans for certain domestic and foreign employees, a supplemental executive retirement plan (“SERP”) for executive officers, a post-employment benefits for substantially all of its domestic employees and a non-pension defined post-retirement benefits plan for certain domestic employees. Aggregate amounts charged to earnings for these plans for the years ended December 31, 2011, 2010 and 2009 was $1,873, $3,908 and $7,470, respectively.
Domestic Defined Benefit Pension Plan
The Company has a non-contributory domestic defined benefit pension plan (“Pension Plan”), which provides retirement benefits based upon years of service and compensation levels. At December 31, 2011 and 2010, the projected benefit obligation for the Pension Plan was $116,922 and $100,419, respectively. The measurement date used to determine pension and other postretirement benefits is December 31st, at which time the minimum contribution level for the following year is determined. The Company expects to contribute pension funding requirements of $3,000 in 2012 and approximately $3,000 each of the four years thereafter.
F-28
Table of Contents
MACDERMID, INCORPORATED AND SUBSIDIARIES
NOTES TO CONSOLIDATED FINANCIAL STATEMENTS—(CONTINUED)
(In thousands, except share and per share amounts)
10. PENSION, POST-RETIREMENT AND POST-EMPLOYMENT PLANS (CONTINUED)
The Company’s investment policies incorporate an asset allocation strategy that emphasizes the long-term growth of capital and acceptable asset volatility as long as it is consistent with the volatility of the relevant market indexes. The investment policies attempt to achieve a mix of approximately 75% of plan investments for long-term growth and 25% for near-term benefit payments. The Company believes this strategy is consistent with the long-term nature of plan liabilities and ultimate cash needs of the plans. Plan assets consist primarily of corporate bond mutual funds, limited partnership interests, listed stocks and cash. The corporate bond mutual funds held by the Pension Plan include primarily corporate bonds from companies from diversified industries located in the U.S. The listed stocks are investments in large-cap and mid-cap companies located in the U.S. The assets from the private investment partnership funds primarily include listed stocks located in the U.S. The weighted average asset allocation of the Pension Plan was 23% equity securities, 60% limited partnership interests, 13% bond mutual fund holdings and 4% cash at December 31, 2011.
An investment committee, appointed by the Board of Directors, manages Pension Plan assets in accordance with the Company’s investment polices. The investment committee meets at least four times per year to assess risk factors, rates of return, investment managers and asset allocation limitations as prescribed by the committee’s investment policy statement. Return on asset (“ROA”) assumptions are determined annually based on a review of the asset mix as well as individual ROA performances, benchmarked against indexes such as the S&P 500 Index and the Russell 2000 Index. In determining an assumed rate of return on plan assets, the Company considers past performance and economic forecasts for the types of investments held by the Pension Plan.
Actual pension expense and future contributions required to fund the Pension Plan will depend on future investment performance, changes in future discount rates, the level of contributions the Company makes and various other factors related to the populations participating in the pension plan. The Company will continue to evaluate all of the actuarial assumptions, on an annual basis, including the expected long-term rate of return on assets and discount rate, and will adjust the assumptions as necessary to ensure proper funding levels are maintained for the Pension Plan and that it can meet its long-term retirement obligations.
Supplemental Executive Retirement Plan
The Company sponsors an unfunded Supplemental Executive Retirement Plan (“SERP”) for certain executive officers. The SERP is a non-qualified plan and entitles executive officers to the difference between the benefits actually paid to them and the benefits they would have received under the Pension Plan were it not for certain restrictions imposed by the Internal Revenue Service Code, which relate to the amount of benefits payable under the SERP and the amount of annual compensation which may be taken into account in determining benefits under the SERP. Covered compensation under the SERP includes an employee’s annual salary and bonus. At December 31, 2011 and 2010, the projected benefit obligation was $4,537 and $3,332, respectively.
Foreign Pension Plans
MacDermid has retirement and death benefit plans (the “U.K. Pension Plan”) covering employees in the U.K. The U.K. Pension Plan is comprised of a defined benefit plan and a defined contribution plan. The defined benefit plan is closed to new entrants and existing active members ceased accruing any further benefits exclusive of adjustments for an inflation factor. The defined contribution plan is structured whereby the Company contributes an amount equal to a specified percentage of each employee’s contribution up to an annual maximum Company contribution per participant. The Company’s expense for matching contribution was $526, $477 and $470, respectively for the years ended December 31, 2011, 2010 and 2009.
F-29
Table of Contents
MACDERMID, INCORPORATED AND SUBSIDIARIES
NOTES TO CONSOLIDATED FINANCIAL STATEMENTS—(CONTINUED)
(In thousands, except share and per share amounts)
10. PENSION, POST-RETIREMENT AND POST-EMPLOYMENT PLANS (CONTINUED)
The projected benefit obligation of the U.K. Pension Plan was $61,804 and $57,357 at December 31, 2011 and 2010, respectively. The measurement date used to determine pension and other postretirement benefits is December 31st, at which time the minimum contribution level for the following year is determined. The Company anticipates contribution pension funding requirements of approximately $4,663 in 2012 and approximately $18,532 in total for the next four years thereafter. The plans’ assets consist primarily of pooled funds that invest in bonds, listed stocks and property.
The weighted-average asset allocation of the U.K. Pension Plan as of December 31, 2011 was 39% pooled bond funds, 8% pooled funds invested in real estate and 49% pooled equity funds and 4% cash. An independent trustee committee, appointed by both Company management and the employees in the U.K. Pension Plan, meets to assess risk factors, rates of return, and the asset allocation limitations as prescribed by the committee’s investment policy statement. In addition, an annual review is conducted to ensure both (a) that proper funding levels are maintained for the plan; and (b) that the plan can meet its long-term retirement obligations.
The Company also has retirement and death benefit plans covering employees in Taiwan and Germany. The Company also has longevity plans covering employees in France. The plans covering employees in Taiwan, Germany and France are not significant individually or in the aggregate to the overall consolidated financial statements. Information for these plans, along with the U.K. Pension Plan, is included in the accompanying tables of pension benefits below in the “Foreign” labeled columns.
During 2009, the pension plan covering certain employees located in Japan was transferred to the Japanese Smaller Enterprise Retirement Allowance Mutual Aid (“SERAMA”). The liabilities for the pensioners were settled by lump sum payment prior to the Japan pension plan closing date. The liabilities of the active members and remaining assets of the Japan pension plan were transferred to SERAMA. As of December 31, 2010 and 2009, there are no remaining liabilities or assets reflected in the consolidated financial statements. As a result of the transfer of the Japan pension plan liabilities and assets, the Company recorded pension expense of $789 during 2009. There was no pension expense for the Japan pension plan in 2011 or 2010.
Certain other MacDermid foreign subsidiaries maintain benefit plans that are consistent with statutory practices but do not meet the criteria for accounting rules under defined benefit plans under ASC 715-30 Compensation—Retirement Benefits—Defined Benefit Plans—Pensions. These benefit plans had obligation balances of $3,433 ($51 of short-term liabilities and $3,382 of long-term liabilities) and $3,951 ($52 of short-term liabilities and $3,899 of long-term liabilities) as of December 31, 2011 and 2010, respectively, which are included in Other Current Liabilities and Retirement Benefits on the Consolidated Balance Sheets and are excluded from the accompanying tables of pension benefits.
Domestic Defined Benefit Post-Retirement Medical and Dental Plan
The Company sponsors a defined benefit post-retirement medical and dental plan that covers all of its domestic full-time employees, hired prior to April 1, 1997, who retire after age fifty-five, with at least ten to twenty years of service (depending upon the date of hire).
In 2010, the Patient Protection and Affordable Care Act and the Health Care and Education Reconciliation Act (collectively, the “Health Care Acts”) were approved in the U.S. The Health Care Acts include several provisions that may affect a company’s postretirement benefit plans. The Company has evaluated the effects of the Health Care Acts for 2010 and has concluded that there was no current impact on the Company’s domestic defined benefit post-retirement medical and dental plans.
F-30
Table of Contents
MACDERMID, INCORPORATED AND SUBSIDIARIES
NOTES TO CONSOLIDATED FINANCIAL STATEMENTS—(CONTINUED)
(In thousands, except share and per share amounts)
10. PENSION, POST-RETIREMENT AND POST-EMPLOYMENT PLANS (CONTINUED)
Eligible employees receive a subsidy from the Company towards the purchase of their retiree medical benefits. The subsidy level is based on the date of retirement from MacDermid. The annual increase in the Company’s costs for post-retirement medical benefits is subject to a limit of 5% for those retiring prior to March 31, 1989 and 3% for those retiring after April 1, 1989. Retirees will be required to contribute to the plan costs in excess of their respective Company limits stated above in addition to their other required contributions.
The projected benefit obligation for the post-retirement plan at December 31, 2011 was comprised of 36% retirees, 15% fully eligible active participants and 49% other active participants. As described above, the annual increase in healthcare cost to MacDermid is subject to a defined limit of 3% or 5% for post-retirement medical benefits, based on the date of retirement; therefore, the healthcare trend rate assumption has no effect on the amounts reported. There is no assumed rate increase for dental benefits because it is a scheduled plan.
Domestic Defined Benefit Post-Employment Compensation Plan
The Company sponsors a defined benefit post-employment compensation continuation plan that covers all full-time domestic employees. Employees who have completed at least six months of service, and become permanently disabled and are unable to return to work, are eligible to receive a benefit under the plan. The benefit may range from one week to a maximum of six months of compensation. The estimated ongoing after-tax annual cost is not material to the overall consolidated financial statements.
The components of net periodic benefit cost of the pension, SERP and postretirement benefit plans with respect to the Consolidated Statements of Operations and Comprehensive Income (Loss) were as follows:
Pension & SERP Benefits:
| For the years ended | ||||||||||||||||||||||||
| December 31, 2011 | December 31, 2010 | December 31, 2009 | ||||||||||||||||||||||
| Domestic | Foreign | Domestic | Foreign | Domestic | Foreign | |||||||||||||||||||
| Net periodic benefit expense: |
||||||||||||||||||||||||
| Service cost |
$ | 2,982 | $ | 654 | $ | 2,999 | $ | 576 | $ | 3,360 | $ | 870 | ||||||||||||
| Interest cost on the projected benefit obligation |
5,806 | 3,262 | 5,798 | 3,241 | 5,650 | 3,227 | ||||||||||||||||||
| Expected return on plan assets |
(7,104 | ) | (4,314 | ) | (5,709 | ) | (3,725 | ) | (4,721 | ) | (3,281 | ) | ||||||||||||
| Other adjustments |
— | — | — | (81 | ) | — | — | |||||||||||||||||
| Amortization of prior service cost |
54 | — | 54 | — | 54 | — | ||||||||||||||||||
| Amortization of net loss |
(54 | ) | 90 | 224 | 296 | 740 | 402 | |||||||||||||||||
| Settlement (gain)/loss |
— | — | (283 | ) | 31 | — | 661 | |||||||||||||||||
|
|
|
|
|
|
|
|
|
|
|
|
|
|||||||||||||
| Net periodic benefit cost |
$ | 1,684 | $ | (308 | ) | $ | 3,083 | $ | 338 | $ | 5,083 | $ | 1,879 | |||||||||||
|
|
|
|
|
|
|
|
|
|
|
|
|
|||||||||||||
F-31
Table of Contents
MACDERMID, INCORPORATED AND SUBSIDIARIES
NOTES TO CONSOLIDATED FINANCIAL STATEMENTS—(CONTINUED)
(In thousands, except share and per share amounts)
10. PENSION, POST-RETIREMENT AND POST-EMPLOYMENT PLANS (CONTINUED)
| For the years ended | ||||||||||||
| Postretirement benefits: |
December 31, 2011 | December 31, 2010 | December 31, 2009 | |||||||||
| Net Periodic Benefit Expense: |
||||||||||||
| Service cost |
$ | 99 | $ | 99 | $ | 108 | ||||||
| Interest cost on the projected benefit obligation |
398 | 388 | 408 | |||||||||
| Cost of special events |
— | — | (8 | ) | ||||||||
|
|
|
|
|
|
|
|||||||
| Net periodic benefit cost |
$ | 497 | $ | 487 | $ | 508 | ||||||
|
|
|
|
|
|
|
|||||||
Other changes in plan assets and benefit obligations recognized in other comprehensive (loss) income in 2011 are as follows:
| For the year ended December 31, 2011 | ||||||||||||||||
| Domestic | Foreign | Postretirement Benefits | Total | |||||||||||||
| Current year actuarial (loss) gain |
$ | (16,948 | ) | $ | (7,235 | ) | $ | 1,202 | $ | (22,981 | ) | |||||
| Amortization of prior service credits |
54 | — | 54 | |||||||||||||
| Amortization of actuarial loss |
(54 | ) | 90 | — | 36 | |||||||||||
| Translation adjustment |
— | 290 | — | 290 | ||||||||||||
|
|
|
|
|
|
|
|
|
|||||||||
| Total recognized in other comprehensive income (loss) (pre tax) |
$ | (16,948 | ) | $ | (6,855 | ) | $ | 1,202 | $ | (22,601 | ) | |||||
|
|
|
|
|
|
|
|
|
|||||||||
The Company expects to recognize $1,344 of net actuarial loss and $93 of net prior service credit as a component of net periodic pension cost in 2012 for its defined benefit plans.
The following table sets forth the components of the pension, SERP and post-retirement benefit plans with respect to the Consolidated Balance Sheets:
| Pension & SERP Benefits | Postretirement Benefits | |||||||||||||||||||||||
| 2011 | 2010 | 2011 | 2010 | |||||||||||||||||||||
| Domestic | Foreign | Domestic | Foreign | Domestic | Domestic | |||||||||||||||||||
| Change in Projected Benefit Obligation: |
||||||||||||||||||||||||
| Beginning of year balance |
$ | 103,749 | $ | 63,323 | $ | 100,099 | $ | 63,580 | $ | 7,168 | $ | 6,675 | ||||||||||||
| Removal of defined contribution liability |
— | — | — | (81 | ) | — | — | |||||||||||||||||
| Service cost |
2,982 | 654 | 2,999 | 576 | 99 | 99 | ||||||||||||||||||
| Interest cost |
5,806 | 3,262 | 5,798 | 3,241 | 398 | 388 | ||||||||||||||||||
| Actuarial (gain)/loss due to assumption change |
9,440 | 4,196 | 4,654 | 2,602 | (458 | ) | 254 | |||||||||||||||||
| Actuarial (gain)/loss due to plan experience |
2,582 | (129 | ) | (5,594 | ) | (2,369 | ) | (2 | ) | 209 | ||||||||||||||
| Benefits and expenses paid |
(3,544 | ) | (3,124 | ) | (3,439 | ) | (2,519 | ) | (435 | ) | (457 | ) | ||||||||||||
| Amendments |
444 | — | — | — | (742 | ) | — | |||||||||||||||||
| Settlement |
— | — | (768 | ) | (37 | ) | — | — | ||||||||||||||||
| Translation adjustment |
— | (573 | ) | — | (1,670 | ) | — | — | ||||||||||||||||
|
|
|
|
|
|
|
|
|
|
|
|
|
|||||||||||||
| End of year balance |
$121,459 | $ | 67,609 | $ | 103,749 | $ | 63,323 | $ | 6,028 | $ | 7,168 | |||||||||||||
|
|
|
|
|
|
|
|
|
|
|
|
|
|||||||||||||
F-32
Table of Contents
MACDERMID, INCORPORATED AND SUBSIDIARIES
NOTES TO CONSOLIDATED FINANCIAL STATEMENTS—(CONTINUED)
(In thousands, except share and per share amounts)
10. PENSION, POST-RETIREMENT AND POST-EMPLOYMENT PLANS (CONTINUED)
| Pension & SERP Benefits | Postretirement Benefits | |||||||||||||||||||||||
| 2011 | 2010 | 2011 | 2010 | |||||||||||||||||||||
| Domestic | Foreign | Domestic | Foreign | Domestic | Domestic | |||||||||||||||||||
| Change in Fair Value of Plan Assets: |
||||||||||||||||||||||||
| Beginning of year balance |
$ | 85,909 | $ | 65,209 | $ | 69,860 | $ | 58,099 | $ | — | $ | — | ||||||||||||
| Actual return on plan assets, net of expenses |
2,623 | 709 | 13,488 | 6,337 | — | — | ||||||||||||||||||
| Employer contributions |
6,000 | 5,260 | 6,768 | 5,067 | 435 | 457 | ||||||||||||||||||
| Benefits paid |
(3,544 | ) | (2,688 | ) | (3,439 | ) | (2,519 | ) | (435 | ) | (457 | ) | ||||||||||||
| Settlement |
— | — | (768 | ) | (37 | ) | — | — | ||||||||||||||||
| Translation adjustment |
— | (396 | ) | — | (1,738 | ) | — | — | ||||||||||||||||
|
|
|
|
|
|
|
|
|
|
|
|
|
|||||||||||||
| End of year balance |
$ | 90,988 | $ | 68,094 | $ | 85,909 | $ | 65,209 | $ | — | $ | — | ||||||||||||
|
|
|
|
|
|
|
|
|
|
|
|
|
|||||||||||||
| Funded Status: |
||||||||||||||||||||||||
| Fair value of plan assets |
$ | 90,988 | $ | 68,094 | $ | 85,909 | $ | 65,209 | $ | — | $ | — | ||||||||||||
| Benefit obligations |
$ | (121,459 | ) | $ | (67,609 | ) | $ | (103,749 | ) | $ | (63,323 | ) | $ | (6,028 | ) | $ | (7,168 | ) | ||||||
|
|
|
|
|
|
|
|
|
|
|
|
|
|||||||||||||
| Funded status of plan |
$ | (30,471 | ) | $ | 485 | $ | (17,840 | ) | $ | 1,886 | $ | (6,028 | ) | $ | (7,168 | ) | ||||||||
|
|
|
|
|
|
|
|
|
|
|
|
|
|||||||||||||
Amounts included in the balance sheet categories consist of the following:
| December 31, 2011 | December 31, 2010 | |||||||
| Prepaid pension assets |
||||||||
| Foreign pension |
4,506 | 6,130 | ||||||
|
|
|
|
|
|||||
| Total long term assets |
$ | 4,506 | $ | 6,130 | ||||
|
|
|
|
|
|||||
| Other current liabilities |
||||||||
| Domestic pension & SERP |
3,000 | 2,400 | ||||||
|
|
|
|
|
|||||
| Total current liabilities |
$ | 3,000 | $ | 2,400 | ||||
|
|
|
|
|
|||||
| Retirement benefits, less current portion |
||||||||
| Domestic pension & SERP |
27,471 | 15,440 | ||||||
| Foreign pension |
4,021 | 4,244 | ||||||
| Postretirement benefits |
6,028 | 7,168 | ||||||
|
|
|
|
|
|||||
| Total non current liabilities |
$ | 37,520 | $ | 26,852 | ||||
|
|
|
|
|
|||||
| Pension & SERP Benefits | Postretirement Benefits December 31, |
|||||||||||||||||||||||
| December 31, 2011 | December 31, 2010 | 2011 | 2010 | |||||||||||||||||||||
| Domestic | Foreign | Domestic | Foreign | Domestic | Domestic | |||||||||||||||||||
| Amounts Recognized in the Consolidated Balance Sheets: |
||||||||||||||||||||||||
| Retirement benefit (liability) asset |
$ | (30,471 | ) | $ | 485 | $ | (17,840 | ) | $ | 1,886 | $ | (6,028 | ) | $ | (7,168 | ) | ||||||||
| Accumulated other comprehensive income (loss) |
21,531 | 15,007 | 4,583 | 8,152 | (1,227 | ) | (25 | ) | ||||||||||||||||
|
|
|
|
|
|
|
|
|
|
|
|
|
|||||||||||||
| Net amount recognized |
$ | (8,940 | ) | $ | 15,492 | $ | (13,257 | ) | $ | 10,038 | $ | (7,255 | ) | $ | (7,193 | ) | ||||||||
|
|
|
|
|
|
|
|
|
|
|
|
|
|||||||||||||
F-33
Table of Contents
MACDERMID, INCORPORATED AND SUBSIDIARIES
NOTES TO CONSOLIDATED FINANCIAL STATEMENTS—(CONTINUED)
(In thousands, except share and per share amounts)
10. PENSION, POST-RETIREMENT AND POST-EMPLOYMENT PLANS (CONTINUED)
Amounts recognized in other comprehensive income (loss) consist of the following:
| Pension & SERP Benefits | Postretirement Benefits December 31, |
|||||||||||||||||||||||
| December 31, 2011 | December 31, 2010 | 2011 | 2010 | |||||||||||||||||||||
| Domestic | Foreign | Domestic | Foreign | Domestic | Domestic | |||||||||||||||||||
| Net actuarial (loss) gain |
$ | (20,775 | ) | $ | (15,007 | ) | $ | (4,217 | ) | $ | (8,152 | ) | $ | 485 | $ | 25 | ||||||||
| Prior service (costs) credits |
(756 | ) | — | (366 | ) | — | 742 | — | ||||||||||||||||
|
|
|
|
|
|
|
|
|
|
|
|
|
|||||||||||||
| $ | (21,531 | ) | $ | (15,007 | ) | $ | (4,583 | ) | $ | (8,152 | ) | $ | 1,227 | $ | 25 | |||||||||
|
|
|
|
|
|
|
|
|
|
|
|
|
|||||||||||||
| Weighted average assumptions used to measure benefit obligations at December 31: |
||||||||||||||||||||||||
| Discount rate |
5.2 | % | 4.6 | % | 5.7 | % | 5.1 | % | 5.2 | % | 5.7 | % | ||||||||||||
| Rate of compensation increase |
4.0 | % | 3.4 | % | 4.0 | % | 3.4 | % | * | * | * | * | ||||||||||||
| ** | Not a meaningful statistic. |
| For the years ended | ||||||||||||||||||||||||
| December 31, 2011 | December 31, 2010 | December 31, 2009 | ||||||||||||||||||||||
| Domestic | Foreign | Domestic | Foreign | Domestic | Foreign | |||||||||||||||||||
| Weighted average assumptions used to determine expense: |
||||||||||||||||||||||||
| Discount rate |
5.7 | % | 5.1 | % | 6.0 | % | 5.4 | % | 6.3 | % | 5.5 | % | ||||||||||||
| Rate of compensation increase |
4.0 | % | 3.4 | % | 4.0 | % | 3.4 | % | 4.0 | % | 3.5 | % | ||||||||||||
| Long-term rate of return on assets |
8.0 | % | 7.4 | % | 8.0 | % | 6.7 | % | 8.0 | % | 6.2 | % | ||||||||||||
The major categories of assets in the Company’s various pension plans as of December 31, 2011 and 2010 are presented in the following table. Assets are segregated by the level of the valuation inputs within the fair value hierarchy utilized to measure fair value (see Note 14—Fair Value Measurements). The Company’s postretirement plan is unfunded.
| Fair Value Measurement Using | ||||||||||||||||
| December 31, 2011 |
Quoted prices in active markets (Level 1) |
Significant other observable inputs (Level 2) |
Significant unobservable inputs (Level 3) |
|||||||||||||
| Asset Category |
||||||||||||||||
| Domestic equities |
$ | 15,996 | $ | 15,996 | $ | — | $ | — | ||||||||
| Global equity securities |
4,551 | 4,551 | — | — | ||||||||||||
| Pooled funds holding global equity securities |
32,267 | — | 32,267 | — | ||||||||||||
| Pooled funds holding global fixed income securities |
26,182 | — | 26,182 | — | ||||||||||||
| Pooled funds holding property in the United Kingdom(a) |
5,298 | — | — | 5,298 | ||||||||||||
| Mutual funds holding U.S. Treasury Securities |
11,687 | 11,687 | — | — | ||||||||||||
| Limited partnership interests(b) |
55,022 | — | 55,022 | — | ||||||||||||
| Designated benefit fund(c) |
1,785 | — | 1,785 | — | ||||||||||||
| Cash and cash equivalents |
6,294 | 6,294 | — | — | ||||||||||||
|
|
|
|
|
|
|
|
|
|||||||||
| Total |
$ | 159,082 | $ | 38,528 | $ | 115,256 | $ | 5,298 | ||||||||
|
|
|
|
|
|
|
|
|
|||||||||
F-34
Table of Contents
MACDERMID, INCORPORATED AND SUBSIDIARIES
NOTES TO CONSOLIDATED FINANCIAL STATEMENTS—(CONTINUED)
(In thousands, except share and per share amounts)
10. PENSION, POST-RETIREMENT AND POST-EMPLOYMENT PLANS (CONTINUED)
| Fair Value Measurement Using | ||||||||||||||||
| December 31, 2010 |
Quoted prices in active markets (Level 1) |
Significant other observable inputs (Level 2) |
Significant unobservable inputs (Level 3) |
|||||||||||||
| Asset Category |
||||||||||||||||
| Domestic equities |
$ | 16,306 | $ | 16,306 | $ | — | $ | — | ||||||||
| Global equity securities |
4,605 | 4,605 | — | — | ||||||||||||
| Pooled funds holding global equity securities |
35,160 | — | 35,160 | — | ||||||||||||
| Pooled funds holding global fixed income securities |
20,817 | — | 20,817 | — | ||||||||||||
| Pooled funds holding property in the United Kingdom(a) |
5,296 | — | — | 5,296 | ||||||||||||
| Mutual funds holding U.S. Treasury Securities |
11,427 | 11,427 | — | — | ||||||||||||
| Limited partnership interests(b) |
47,256 | — | 47,256 | — | ||||||||||||
| Designated benefit fund(c) |
1,721 | — | 1,721 | — | ||||||||||||
| Cash and cash equivalents |
8,530 | 8,530 | — | — | ||||||||||||
|
|
|
|
|
|
|
|
|
|||||||||
| Total |
$ | 151,118 | $ | 40,868 | $ | 104,954 | $ | 5,296 | ||||||||
|
|
|
|
|
|
|
|
|
|||||||||
| (a) | This category represents investments in real estate directly held by the pooled funds. |
| (b) | This category represents limited partner investments with general partners that invest in debt and equity securities. |
| (c) | This category includes assets held in a fund with the Bank of Taiwan as prescribed by the Taiwan government in accordance with local statutory rules. |
The fair value measurement of plan assets using significant unobservable inputs (Level 3) changed during 2011 due to the following:
| Pooled funds holding property in the United Kingdom |
||||
| Beginning balance, December 31, 2010 |
$ | 5,296 | ||
| Unrealized gains relating to instruments still held in the reporting period |
331 | |||
| Transfers out |
(329 | ) | ||
|
|
|
|||
| Ending balance, December 31, 2011 |
$ | 5,298 | ||
|
|
|
|||
The Company’s retirement plan assets are reported at fair value. Level 1 assets include investments in publicly traded equity securities and mutual funds. These securities (or the underlying investments of the funds) are actively traded and valued using quoted prices for identical securities from the market exchanges. Level 2 assets consist of global fixed-income securities and commingled funds that are not actively traded or whose underlying investments are valued using observable marketplace inputs. The fair value of plan assets invested in fixed-income securities is generally determined using market approach pricing methodology, where observable prices are obtained by market transactions involving identical or comparable securities of issuers with similar credit ratings. Plan assets that are invested in commingled funds are valued using a unit price or net asset value (NAV) that is based on the underlying investments of the fund. Level 3 assets include investments in pooled
F-35
Table of Contents
MACDERMID, INCORPORATED AND SUBSIDIARIES
NOTES TO CONSOLIDATED FINANCIAL STATEMENTS—(CONTINUED)
(In thousands, except share and per share amounts)
10. PENSION, POST-RETIREMENT AND POST-EMPLOYMENT PLANS (CONTINUED)
funds holding property in the United Kingdom are valued on a weekly basis using discounted cash flow models which consider long-term lease estimates, future rental receipts and estimated residual values. Valuation estimates are supplemented by third-party appraisals on a monthly basis.
As of December 31, 2011, expected future benefit payments related to the Corporation’s defined benefit plans were as follows:
| Year End |
Domestic | Foreign | Postretirement Benefits |
Total | ||||||||||||
| 2012 |
$ | 4,004 | $ | 2,794 | $ | 365 | $ | 7,163 | ||||||||
| 2013 |
4,265 | 2,920 | 356 | 7,541 | ||||||||||||
| 2014 |
5,980 | 3,073 | 359 | 9,412 | ||||||||||||
| 2015 |
5,072 | 3,185 | 372 | 8,629 | ||||||||||||
| 2016 |
5,057 | 3,278 | 374 | 8,709 | ||||||||||||
| Thereafter |
31,998 | 18,358 | 1,858 | 52,214 | ||||||||||||
|
|
|
|
|
|
|
|
|
|||||||||
| Total |
$ | 56,376 | $ | 33,608 | $ | 3,684 | $ | 93,668 | ||||||||
|
|
|
|
|
|
|
|
|
|||||||||
11. INCOME TAXES
Income tax expense (benefit) is allocated as follows:
| For the years ended | ||||||||||||
| December 31, 2011 | December 31, 2010 | December 31, 2009 | ||||||||||
| Income tax expense (benefit) |
$ | 9,953 | $ | 21,723 | $ | (6,427 | ) | |||||
| Stockholders’ equity for the tax effects of pension and postretirement benefit plans and hedging activities |
(6,085 | ) | 5,367 | 5,666 | ||||||||
|
|
|
|
|
|
|
|||||||
| Total |
$ | 3,868 | $ | 27,090 | $ | (761 | ) | |||||
|
|
|
|
|
|
|
|||||||
Income tax (benefit) expense attributable to income from continuing operations consisted of the following:
| For the years ended | ||||||||||||
| December 31, 2011 | December 31, 2010 | December 31, 2009 | ||||||||||
| Current: |
||||||||||||
| U.S.: |
||||||||||||
| Federal |
$ | (4,221 | ) | $ | 6,045 | $ | 3,784 | |||||
| State and local |
324 | (7 | ) | 453 | ||||||||
| Foreign |
29,860 | 21,871 | 24,962 | |||||||||
|
|
|
|
|
|
|
|||||||
| Total current |
25,963 | 27,909 | 29,199 | |||||||||
|
|
|
|
|
|
|
|||||||
| Deferred: |
||||||||||||
| U.S.: |
||||||||||||
| Federal |
3,459 | (2,268 | ) | (25,918 | ) | |||||||
| State and local |
(615 | ) | 128 | (562 | ) | |||||||
| Foreign |
(18,854 | ) | (4,046 | ) | (9,146 | ) | ||||||
|
|
|
|
|
|
|
|||||||
| Total deferred |
(16,010 | ) | (6,186 | ) | (35,626 | ) | ||||||
|
|
|
|
|
|
|
|||||||
| Provision (benefit) for income taxes |
$ | 9,953 | $ | 21,723 | $ | (6,427 | ) | |||||
|
|
|
|
|
|
|
|||||||
F-36
Table of Contents
MACDERMID, INCORPORATED AND SUBSIDIARIES
NOTES TO CONSOLIDATED FINANCIAL STATEMENTS—(CONTINUED)
(In thousands, except share and per share amounts)
11. INCOME TAXES (CONTINUED)
Income tax expense (benefit) attributable to continuing operations differed from the amounts computed by applying the U.S. Federal statutory tax rates to pretax income, as a result of the following:
| For the years ended | ||||||||||||
| December 31, 2011 | December 31, 2010 | December 31, 2009 | ||||||||||
| U.S. Federal statutory tax rate |
35.0 | % | 35.0 | % | 35.0 | % | ||||||
|
|
|
|
|
|
|
|||||||
| Taxes computed at U.S. statutory rate |
$ | 3,957 | $ | 16,099 | $ | (29,579 | ) | |||||
| State income taxes, net of Federal benefit |
(702 | ) | (2,315 | ) | 3,375 | |||||||
| Foreign tax rate differential |
(1,469 | ) | (691 | ) | 9,615 | |||||||
| Net change in reserve |
(27 | ) | 5,617 | 12,634 | ||||||||
| Change in valuation allowances |
6,674 | 1,722 | (8,443 | ) | ||||||||
| Provision for tax on undistributed foreign earnings |
(260 | ) | 880 | (288 | ) | |||||||
| Non-deductible goodwill impairment |
— | — | 11,116 | |||||||||
| Change in tax rate |
(847 | ) | (205 | ) | (2,312 | ) | ||||||
| Foreign exchange impact on provision |
1,193 | — | — | |||||||||
| Other, net |
1,434 | 616 | (2,545 | ) | ||||||||
|
|
|
|
|
|
|
|||||||
| Actual income taxes |
$ | 9,953 | $ | 21,723 | $ | (6,427 | ) | |||||
|
|
|
|
|
|
|
|||||||
| Effective tax rate |
88.02 | % | 47.23 | % | 7.60 | % | ||||||
|
|
|
|
|
|
|
|||||||
For the years ended December 31, 2011, 2010 and 2009, earnings from continuing operations before income taxes included foreign earnings of $56,669, $86,205 and $20,648, respectively.
MacDermid has not recognized a deferred tax liability for U.S. taxes on the portion of the undistributed earnings of foreign subsidiaries that arose in 2011 and prior years that the Company does not expect to repatriate in the foreseeable future. A deferred tax liability will be recognized when the Company expects to recover those earnings in a taxable transaction, such as the receipt of dividends or sale of the investment, net of foreign tax credits. A determination of the deferred tax liability related to the undistributed earnings of foreign subsidiaries that are permanently reinvested is not practical. The undistributed earnings of those subsidiaries were $112,552 and $116,690 at December 31, 2011 and 2010, respectively.
F-37
Table of Contents
MACDERMID, INCORPORATED AND SUBSIDIARIES
NOTES TO CONSOLIDATED FINANCIAL STATEMENTS—(CONTINUED)
(In thousands, except share and per share amounts)
11. INCOME TAXES (CONTINUED)
The tax effects of temporary differences that give rise to significant portions of the deferred tax assets and liabilities are as follows:
| December 31, 2011 | December 31, 2010 | |||||||
| Deferred tax assets: |
||||||||
| Accounts receivable, primarily due to allowance for doubtful accounts |
$ | 1,295 | $ | 921 | ||||
| Inventories |
2,350 | 2,416 | ||||||
| Accrued liabilities |
1,748 | 3,431 | ||||||
| Employee benefits |
14,566 | 5,172 | ||||||
| Capitalized research and development costs |
12,393 | 12,054 | ||||||
| Foreign tax credits |
24,450 | 22,244 | ||||||
| Net operating losses |
12,420 | 13,833 | ||||||
| State tax credits |
1,183 | 1,053 | ||||||
| Unrealized foreign exchange gain/loss |
193 | 771 | ||||||
| Research and development credits |
5,844 | 5,264 | ||||||
| Alternative minimum tax credits |
2,342 | 2,342 | ||||||
| Deferred financing |
786 | 2,244 | ||||||
| Other |
5,696 | 6,654 | ||||||
|
|
|
|
|
|||||
| Total deferred tax assets |
85,266 | 78,399 | ||||||
| Valuation allowance |
(34,531 | ) | (27,858 | ) | ||||
|
|
|
|
|
|||||
| Total gross deferred tax assets |
50,735 | 50,541 | ||||||
|
|
|
|
|
|||||
| Deferred tax liabilities: |
||||||||
| Plant and equipment, primarily due to depreciation |
4,727 | 2,419 | ||||||
| Goodwill and intangibles |
78,483 | 107,466 | ||||||
| Undistributed foreign earnings |
5,915 | 6,441 | ||||||
| Partnership basis difference |
12,304 | 13,002 | ||||||
| Unrealized foreign exchange gain/loss |
1,819 | — | ||||||
| Other |
1,819 | 2,379 | ||||||
|
|
|
|
|
|||||
| Total gross deferred tax liabilities |
105,067 | 131,707 | ||||||
|
|
|
|
|
|||||
| Net deferred tax liability |
$ | 54,332 | $ | 81,166 | ||||
|
|
|
|
|
|||||
The net tax effects of temporary differences that give rise to significant portions of the net deferred tax asset and liabilities are as follows:
| December 31, 2011 | December 31, 2010 | |||||||
| Net current deferred tax asset |
$ | 6,116 | $ | 7,800 | ||||
| Net noncurrent deferred tax asset |
2,387 | 2,292 | ||||||
|
|
|
|
|
|||||
| 8,503 | 10,092 | |||||||
| Net noncurrent deferred tax liability |
62,835 | 91,258 | ||||||
|
|
|
|
|
|||||
| Total net deferred tax liability |
$ | 54,332 | $ | 81,166 | ||||
|
|
|
|
|
|||||
In assessing whether deferred tax assets will be realized, the Company considers whether it is more likely than not that some portion or all of the deferred tax assets will not be realized. The ultimate realization of deferred tax assets is dependent upon the generation of future taxable income during the periods in which those
F-38
Table of Contents
MACDERMID, INCORPORATED AND SUBSIDIARIES
NOTES TO CONSOLIDATED FINANCIAL STATEMENTS—(CONTINUED)
(In thousands, except share and per share amounts)
11. INCOME TAXES (CONTINUED)
temporary differences become deductible. The Company considers the scheduled reversal of deferred tax liabilities, projected future taxable income, tax planning strategies and expiration dates of certain deferred tax assets in making this assessment. Based upon the level of historical taxable income and projections for future taxable income over the periods in which the deferred tax assets are deductible, the Company believes it is more likely than not that the benefits of those deductible differences will be realized, net of existing valuation allowances at December 31, 2011.
The valuation allowance for deferred tax assets was $34,531 and $27,858 at December 31, 2011 and 2010, respectively.
At December 31, 2011, MacDermid had state and foreign net operating losses of approximately $14,638 and $11,859, respectively, which were available for carry-forward. The majority of the state net operating loss carry-forwards expire during the years 2016 and 2025. The state net operating loss carry-forwards result in a deferred tax asset of $9,515 net of federal tax. A full valuation allowance has been provided against the deferred tax asset because it is more likely than not that it will not be utilized based on the Company’s domestic operations and structure. The majority of the foreign net operating loss carry-forwards expire during the years 2011 through 2016, with some being unlimited in utilization. This results in a deferred tax asset of $2,905. A valuation allowance of $344 has been provided against the deferred tax assets associated with certain foreign net operating loss carry-forwards because the recent results of the business units associated with the loss carry-forwards indicate that it is more likely than not that the benefits from the net operating loss carry-forwards will not be realized.
In addition, at December 31, 2011, the Company has approximately $24,450, $5,844, $2,342 and $1,183 of foreign tax credits, research and development credits, alternative minimum tax credits and state tax credits (net of federal tax), respectively, that are available for carryforward. These carry-forward periods range from ten years to an unlimited period of time. A valuation allowance of $17,946, $5,515 and $1,183 is provided for foreign tax credits, research and development credits and state tax credits, respectively, that the Company believes the benefits from the credits will not be realized.
The United Kingdom, Canada and Japan all enacted tax rate changes during 2011. The total impact of the lower rates resulted in a decrease to deferred taxes of $472. MacDermid also changed the state tax rate applied to U.S. temporary items for one of its subsidiaries as well as the rate applied to certain deferred tax liabilities. This rate change has resulted in an increase to the net deferred tax liabilities of $375. The total impact due to the change in tax rates is $847.
MacDermid is a beneficiary of a tax holiday in China which expired at December 31, 2011. The aggregate effect on income tax expense in 2011 as a result of the tax holiday was a benefit of approximately $1,751.
Tax Uncertainties—A reconciliation of the beginning and ending unrecognized tax benefits is as follows:
| December 31, 2011 | December 31, 2010 | |||||||
| Unrecognized tax benefits at beginning of period |
$ | 22,502 | $ | 17,010 | ||||
| Additions based on current year tax positions |
3,716 | 4,294 | ||||||
| (Reductions) additions based upon prior year tax positions |
(3,881 | ) | 2,765 | |||||
| (Reductions) for settlements and payments |
(3,504 | ) | (885 | ) | ||||
| Reductions due to closed statutes |
— | (682 | ) | |||||
|
|
|
|
|
|||||
| Total Unrecognized Tax benefits at end of period |
$ | 18,833 | $ | 22,502 | ||||
|
|
|
|
|
|||||
F-39
Table of Contents
MACDERMID, INCORPORATED AND SUBSIDIARIES
NOTES TO CONSOLIDATED FINANCIAL STATEMENTS—(CONTINUED)
(In thousands, except share and per share amounts)
11. INCOME TAXES (CONTINUED)
The Company has $18,833 of total unrecognized tax benefits as of December 31, 2011, of which $12,000, if recognized, would impact the Company’s effective tax rate. The Company estimates that $41 of the total unrecognized benefits will reverse within the next twelve months.
The Company recognizes interest and/or penalties related to income tax matters as part of income tax expense. The Company has approximately $2,174 and $2,036 accrued for interest and penalties as of December 31, 2011 and 2010, respectively. Changes in these balances are recorded in income tax expense or as a reduction of the balance for payments made. The Company made no payments in 2011.
MacDermid, Inc. and its subsidiaries are subject to U.S. federal income tax as well as income tax of multiple state and foreign jurisdictions. The Company has closed all U.S. federal tax matters for years through 2005. Federal income tax returns for 2006 through 2011 are currently open to examination although no audits are ongoing. The Company has been notified of an intent to conduct an audit in the United Kingdom for the 2009 tax year. The Company does not expect the amount of unrecognized tax benefits to significantly change within the next twelve months.
As of December 31, 2011 the following tax years remained subject to examination by the major tax jurisdiction indicated:
| Major Jurisdiction |
Open Years | |
| Brazil |
2007 through 2011 | |
| China |
2009 through 2011 | |
| France |
2009 through 2011 | |
| Germany |
2007 through 2011 | |
| Italy |
2007 through 2011 | |
| Japan |
2009 through 2011 | |
| Netherlands |
2005 through 2011 | |
| Singapore |
2007 through 2011 | |
| United Kingdom |
2009 through 2011 | |
| United States |
2009 through 2011 |
12. DEBT AND CAPITAL LEASES
MacDermid’s debt and capital lease obligations consisted of the following:
| December 31, 2011 | December 31, 2010 | |||||||
| Borrowings under lines of credit |
$ | — | $ | 1,305 | ||||
|
|
|
|
|
|||||
| Senior secured credit facility, tranche B due 2014, LIBOR plus 2.00%, weighted average interest rate of 2.27% and 2.31%, respectively |
229,982 | 247,520 | ||||||
| Senior secured credit facility, tranche C due 2014, EURIBOR plus 2.25%, weighted average interest rate of 3.41% and 2.80%, respectively |
153,115 | 170,307 | ||||||
| Senior subordinated notes due 2017, 9.50% interest rate |
350,000 | 350,000 | ||||||
| Japanese senior secured bank debt, due in 2012 and 2014, weighted average interest rate of 1.85% and 1.78%, respectively |
10,108 | 15,360 | ||||||
| Other |
1,167 | 1,425 | ||||||
|
|
|
|
|
|||||
| Total debt and capital lease obligations |
744,372 | 784,612 | ||||||
| Less: current portion debt and capital lease obligations |
(26,141 | ) | (37,698 | ) | ||||
|
|
|
|
|
|||||
| Total long-term debt and capital lease obligations |
$ | 718,231 | $ | 746,914 | ||||
|
|
|
|
|
|||||
F-40
Table of Contents
MACDERMID, INCORPORATED AND SUBSIDIARIES
NOTES TO CONSOLIDATED FINANCIAL STATEMENTS—(CONTINUED)
(In thousands, except share and per share amounts)
12. DEBT AND CAPITAL LEASES (CONTINUED)
Minimum future principal payments on short-term debt, long-term debt and capital leases are as follows:
| Year End |
Capital leases |
Long-term debt |
Total | |||||||||
| 2012 |
$ | 540 | $ | 25,601 | $ | 26,141 | ||||||
| 2013 |
317 | 9,702 | 10,019 | |||||||||
| 2014 |
218 | 357,902 | 358,120 | |||||||||
| 2015 |
90 | — | 90 | |||||||||
| 2016 |
2 | — | 2 | |||||||||
| Thereafter |
— | 350,000 | 350,000 | |||||||||
|
|
|
|
|
|
|
|||||||
| Total |
$ | 1,167 | $ | 743,205 | $ | 744,372 | ||||||
|
|
|
|
|
|
|
|||||||
Senior Secured Credit Facility
On April 12, 2007, the Company closed three senior secured credit facilities consisting of (i) a $360,000 tranche B term loan credit facility denominated in U.S. Dollars (“tranche B”), (ii) a $250,000 tranche C term loan credit facility denominated in Euros (“tranche C”) and (iii) a $50,000 revolving credit facility denominated in U.S. Dollars. The loans under the tranche B facility and the revolving credit facility bear interest at the LIBOR based rate, 0.30% at December 31, 2011, plus 2.00% or an alternate base rate at the Company’s option. The Company has chosen the LIBOR based rate. The loans under the tranche C credit facility bear interest at EUROBOR, 1.02% at December 31, 2011, plus 2.25%. Under the tranche B and C term loans the Company is required to make quarterly interest and principal payments and the tranche B and C term loans mature in 2014. During the year ended December 31, 2011, $17,538 and $5,316 of principal and interest payments, respectively, were made on the tranche B term loan and $13,038 and $5,750 of principal and interest payments, respectively, were made on the tranche C term loan. During the year ended December 31, 2010, $12,835 and $5,804 of principal and interest payments, respectively, were made on the tranche B term loan and $9,153 and $4,850 of principal and interest payments, respectively, were made on the tranche C term loan. During the year ended December 31, 2011, the Company recorded $4,736 of other income related to the remeasurement gain on the foreign denominated tranche C term loan. During the year ended December 31, 2010, the Company recorded $12,568 of other income related to the remeasurement gain on the foreign denominated tranche C term loan. During the year ended December 31, 2009, the Company recorded $4,076 of other expense related to the remeasurement loss on the foreign denominated tranche C term loan. During the year ended December 31, 2011, the realized portion of the remeasurement loss on the foreign denominated tranche C term loan was $608. During the year ended December 31, 2010, the realized portion of the remeasurement loss on the foreign denominated tranche C term loan was $4. During the year ended December 31, 2009, the realized portion of the remeasurement loss on the foreign denominated tranche C term loan was $786.
In addition to scheduled repayments, the tranche B and tranche C loans contain mandatory prepayment provisions, whereby the Company is required to reduce the outstanding principal amounts of these loans based on excess cash flow (as defined in the credit agreement for the tranche B and tranche C loans) as of the most recent completed fiscal year. The Company has estimated that mandatory excess cash flow prepayment, based upon 2011 operating results, of $8,764 on the tranche B term loan and $5,835 on the tranche C term loan. These prepayments are due by March 31, 2012 and are included in current installments of long-term obligations in the Consolidated Balance Sheet as of December 31, 2011. During the year ended December 31, 2011, the Company made a mandatory excess cash flow prepayment, based on 2010 operating results, of $13,938 on the tranche B
F-41
Table of Contents
MACDERMID, INCORPORATED AND SUBSIDIARIES
NOTES TO CONSOLIDATED FINANCIAL STATEMENTS—(CONTINUED)
(In thousands, except share and per share amounts)
12. DEBT AND CAPITAL LEASES (CONTINUED)
loan and $10,282 on the tranche C loan. During the year ended December 31, 2010, the Company made a mandatory excess cash flow prepayment, based on 2009 operating results, of $9,235 on the tranche B loan and $6,485 on the tranche C loan.
The Senior Secured Credit Facility is guaranteed by MacDermid Holdings, LLC and certain of its direct and indirect wholly owned domestic subsidiaries and is secured by 65% of the stock of the Company’s first tier foreign subsidiaries, subject to customary exceptions, exclusions and release mechanisms.
Revolving Credit Facility
As discussed above, on April 12, 2007, the Company entered into a $50,000 revolving credit facility. In May 2012, the revolving credit facility was amended and extended. The revolving credit facility, as amended, will mature in April 2014. At December 31, 2011 and 2010, no balances were outstanding under the revolving credit facility. During the years ended December 31, 2011 and 2010, the Company paid commitment fees of $269 and $338, respectively, for the revolving credit facility.
MacDermid also has letters of credit outstanding of $3,874 and $4,024 at December 31, 2011 and 2010, respectively. The letters of credit reduce the borrowings available under the revolving credit facility.
Senior Subordinated Notes
On April 12, 2007, the Company issued $350,000 of senior subordinated notes with a fixed interest rate of 9.50% at par. The senior subordinated notes mature April 2017. Interest is payable semi-annually under the senior subordinated notes (October 15th and April 15th) and the principal amount is payable at maturity in 2017. During the years ended December 31, 2011 and 2010, no principal payments were made on the senior subordinated notes.
During each of the years ended December 31, 2011 and 2010, $33,250 of interest payments was made on the senior subordinated notes. The senior subordinated notes are guaranteed by the Company’s wholly owned domestic subsidiaries (“Guarantors”).
Japanese Senior Secured Bank Debt
On February 26, 2007, the predecessor company borrowed approximately $15,000 denominated in Japanese Yen in three separate notes and as described in Note 3, these notes were assumed by Matrix in the Merger. The first note of $8,397 has a maturity date of February 26, 2012 and a fixed interest rate of 1.37%. Under the first note, interest and principal payments are due on a semi-annual basis. During 2009, this note was paid in full. The second note of $5,878 has a maturity date of March 26, 2014 and a fixed interest rate of 1.47%. Under the second note, interest and principal payments are due on a semi-annual basis. The third note of $840 has a maturity date of March 27, 2012 and a fixed interest rate of 1.31%. Under the third note, interest and principal payments are due on a semi-annual basis.
On May 7, 2007 the Company borrowed an additional $7,557 denominated in Japanese Yen. The May 2007 note has a maturity date of May 28, 2012 and a fixed interest rate of 1.41%. Interest and principal payments are due on a semi-annual basis.
On September 26, 2007, the Company borrowed an additional $2,519 denominated in Japanese Yen. The September 2007 note has a maturity date of September 26, 2014 and a fixed interest rate of 1.47%. Interest and principal payments are due on a semi-annual basis.
F-42
Table of Contents
MACDERMID, INCORPORATED AND SUBSIDIARIES
NOTES TO CONSOLIDATED FINANCIAL STATEMENTS—(CONTINUED)
(In thousands, except share and per share amounts)
12. DEBT AND CAPITAL LEASES (CONTINUED)
On October 1, 2009, the Company borrowed $5,569 denominated in Japanese Yen. This note has a maturity date of August 20, 2014, and a fixed interest rate of 2.40%. Under this note, interest and principal payments are due on a monthly basis.
On February 15, 2010, the Company borrowed $1,111 denominated in Japanese Yen. The note had a maturity date of March 31, 2010 and a fixed interest rate of 1.725% and was paid in full on March 31, 2010.
During the year ended December 31, 2011, $5,935 and $245 of principal and interest payments, respectively, were made on the Japanese senior secured bank debt. During the year ended December 31, 2010, $5,679 and $232 of principal and interest payments, respectively, were made on the Japanese senior secured bank debt.
During the years ended December 31, 2011, 2010 and 2009, the Company recorded $35 of other expense, $1,544 of other expense and $1,505 of other income, respectively, related to the remeasurement gains/losses on the foreign denominated Japanese debt.
Capital Leases
During the year ended December 31, 2011, the Company entered into equipment capital lease agreements totaling $1,283 with interest rates ranging from 4.3% to 10%. Payments on capital leases were $472 for the year ended December 31, 2011.
Debt Covenants
The senior secured credit facility and senior subordinated notes contain various covenants including limitations on additional indebtedness, dividends and other distributions, entry into new lines of business, use of loan proceeds, capital expenditures, restricted payments, restrictions on liens, transactions with affiliates, amendments to organizational documents, accounting changes, sale and leaseback transactions and dispositions. In addition, the revolving credit facility requires the Company to comply with certain financial covenants, including consolidated leverage, interest coverage ratios and limitations on capital expenditures if the Company’s funding under the revolving credit facility exceeds $10,000 for ten or more consecutive days in any fiscal quarter. As of December 31, 2011, the Company was in compliance with the debt covenants contained in the senior secured credit facility and senior subordinated notes.
Other Debt Facilities
MacDermid carries various short-term debt facilities worldwide which are used to fund short-term cash needs when the need arises. As of December 31, 2011 and 2010, there was $0 and $1,305, respectively, outstanding under these other debt facilities. The Company also has various overdraft facilities available. The capacity under these overdraft facilities was $22,762 of December 31, 2011 and $21,880 at December 31, 2010. Some of these overdraft lines carry variable interest rates. As of December 31, 2011, MacDermid’s overdraft lines bore interest rates ranging from 1% to 6%.
13. DERIVATIVE INSTRUMENTS
In the normal course of business, MacDermid is exposed to risks such as changes in foreign currency exchange rates, interest rates and commodity prices. Derivative financial instruments, such as interest rate swaps
F-43
Table of Contents
MACDERMID, INCORPORATED AND SUBSIDIARIES
NOTES TO CONSOLIDATED FINANCIAL STATEMENTS—(CONTINUED)
(In thousands, except share and per share amounts)
13. DERIVATIVE INSTRUMENTS (CONTINUED)
are used to manage changes in market conditions related to debt obligations. All derivatives are recognized on the consolidated balance sheets at fair value at the end of each year. The counterparty to the Company’s derivative agreements is a major international financial institution. The Company continually monitors its positions and the credit ratings of its counterparties, and does not anticipate nonperformance by the counterparties.
Interest Rates
In June 2007, the Company entered into an interest rate swap agreement (“swap”) to hedge interest rate fluctuation on the Company’s tranche B term loan in the senior secured credit facility (see Note 12 above). The swap helped mitigate interest rate fluctuations on the Company’s floating rate U.S. dollar denominated debt. The swap was at a fixed rate of 5.40%, a notional amount of $170,000 and matured on June 30, 2010. The Company also entered into an interest rate collar agreement (“collar”) in June 2007. The collar helps protect the Company’s floating rate U.S. dollar denominated debt. The collar has a floor of 5.20% and a ceiling of 6.25%, a notional amount of $100,000 and covers the period from June 30, 2010 through June 30, 2012.
Changes in the fair value of a derivative that is designated as and meets all the required criteria for a cash flow hedge are recorded in accumulated other comprehensive income (loss) and reclassified into earnings as the underlying hedged item affects earnings. Amounts reclassified into earnings related to interest rate swap agreements are included in interest expense. As of December 31, 2011 and 2010, approximately $1,500 and $4,200 of unrealized losses, net of tax, respectively, related to the interest rate derivative instruments were included in accumulated other comprehensive income (loss) with a corresponding offset to both current and long-term liabilities. There was hedge effectiveness of approximately $80 and 573, as of December 31, 2011 and 2010, respectively, included in Other Comprehensive Income (“OCI”). Additionally, $28 was recorded as other income in the statement of operations for hedge ineffectiveness for the year ended December 31, 2011. For the years ended December 31, 2010 and 2009, $14 and $0, respectively, was recorded as other expense in the statement of operations for hedge ineffectiveness. For the years ended December 31, 2011, 2010 and 2009, the Company recorded $2,707 of unrealized gains, net of tax, $2,769 of unrealized gains, net of tax and $3,642 of unrealized gains, net of tax, to OCI, respectively.
During the years ended December 31, 2011, 2010 and 2009, the Company made payments of $0, $4,388 and $7,798, respectively, related the difference between the swap rate of 5.40% and the actual interest rate on the Company’s floating rate U.S. dollar denominated debt.
During the years ended December 31, 2011, 2010 and 2009, the Company made payments of $4,949, $2,448 and $0, respectively, related to the difference between the interest rate collar agreement rate of 5.20% and the actual interest rate on the Company’s floating rate U.S. dollar denominated debt.
These payments were recorded as interest expense in the Consolidated Statement of Operations and Comprehensive Income (Loss).
Foreign Currency
The Company conducts a significant portion of its business in currencies other than the U.S. dollar, the currency in which the consolidated financial statements are reported. Correspondingly, the Company’s operating results could be affected by foreign currency exchange rate volatility relative to the U.S. dollar. The Company’s Autotype subsidiary in the United Kingdom uses the Great Britain Pound (“GBP”) as its functional currency for
F-44
Table of Contents
MACDERMID, INCORPORATED AND SUBSIDIARIES
NOTES TO CONSOLIDATED FINANCIAL STATEMENTS—(CONTINUED)
(In thousands, except share and per share amounts)
13. DERIVATIVE INSTRUMENTS (CONTINUED)
paying labor and other operating costs, while approximately 25 percent of its revenues are U.S. dollar denominated. To hedge against the risk of a stronger GBP, the Corporate Treasury Group contracted in 2011 and 2010, on behalf of the Autotype foreign subsidiary, with a financial institution to deliver U.S. dollars at a fixed GBP rate and to receive GBP in exchange for the U.S. dollar. The Company did not pay up-front premiums to obtain the hedge.
While the Company has implemented certain strategies to mitigate risks related to the impact of fluctuations in currency exchange rates, it cannot ensure that it will not recognize gains or losses from international transactions, as this is part of transacting business in an international environment. Not every exposure is or can be hedged and, where hedges are put in place based on expected foreign exchange exposure, they are based on forecasts for which actual results may differ from the original estimate. Failure to successfully hedge or anticipate currency risks properly could adversely affect impact or benefit the Company’s consolidated operating results.
As of December 31, 2011, the aggregate U.S. dollar notional amount of foreign currency forward contracts, designated as hedges, was $19,000. During the years ended December 31, 2011, 2010 and 2009, unrealized (losses) and gains of $(442), net of tax, of $223, net of tax and $336, net of tax, respectively, were recorded to OCI related to foreign currency hedges. During the years ended December 31, 2011, 2010 and 2009, the Company recorded realized gains/ (losses) of $555, $(1,315) and $1,431, respectively, in other income/(expense) related to the settlement of hedged foreign exchange contracts.
The following table summarizes derivative instrument amounts as of December 31, 2011, by currency and the portion of the asset/liability that settles within the next twelve months.
| Local Currency Amount |
U.S. Dollar Amount |
Percentage Settled Within One Year |
Dates Contracts are Through |
|||||||||||||
| Derivative Assets |
||||||||||||||||
| Great Britain Pound |
£3,103 | $ | 5,000 | 100 | % | March 30, 2012 | ||||||||||
| Great Britain Pound |
£3,105 | $ | 5,000 | 100 | % | June 29, 2012 | ||||||||||
| Great Britain Pound |
£3,148 | $ | 5,000 | 100 | % | September 27, 2012 | ||||||||||
| Great Britain Pound |
£2,572 | $ | 4,000 | 100 | % | December 19, 2012 | ||||||||||
|
|
|
|||||||||||||||
| $ | 19,000 | |||||||||||||||
|
|
|
|||||||||||||||
F-45
Table of Contents
MACDERMID, INCORPORATED AND SUBSIDIARIES
NOTES TO CONSOLIDATED FINANCIAL STATEMENTS—(CONTINUED)
(In thousands, except share and per share amounts)
13. DERIVATIVE INSTRUMENTS (CONTINUED)
The following table summarizes the fair value of derivative instruments reported in the Consolidated Balance Sheets:
| Assets Balance Sheet Location |
December 31, 2011 U.S. Dollar Amount |
December 31, 2010 U.S. Dollar Amount |
Liabilities Balance Sheet Location |
December 31, 2011 U.S. Dollar Amount |
December 31, 2010 U.S. Dollar Amount |
|||||||||||||||||||
| Derivatives designated as hedging instruments: |
||||||||||||||||||||||||
| Interest rate collar |
$ | — | $ | — | |
Other current liabilities |
|
$ | 2,234 | $ | 4,538 | |||||||||||||
| Interest rate swap |
|
Other current liabilities |
|
— | — | |||||||||||||||||||
| Foreign exchange contracts |
|
Other current assets |
|
— | 217 | |
Other current liabilities |
|
463 | — | ||||||||||||||
| Interest rate collar |
— | — | |
Other long-term liabilities |
|
— | 1,889 | |||||||||||||||||
|
|
|
|
|
|
|
|
|
|||||||||||||||||
| $ | — | $ | 217 | $ | 2,697 | $ | 6,427 | |||||||||||||||||
|
|
|
|
|
|
|
|
|
|||||||||||||||||
| Total derivative contracts |
$ | — | $ | 217 | $ | 2,697 | $ | 6,427 | ||||||||||||||||
|
|
|
|
|
|
|
|
|
|||||||||||||||||
The effect of derivative instruments on the Consolidated Statements of Operations and Comprehensive Income (Loss) is as follows:
| For the years ended | ||||||||||||||||||||||||||||||||||||
| December 31, 2011 | December 31, 2010 | December 31, 2009 | ||||||||||||||||||||||||||||||||||
| Interest rates |
Foreign Currency |
Total | Interest rates |
Foreign Currency |
Total | Interest rates |
Foreign Currency |
Total | ||||||||||||||||||||||||||||
| Cash Flow Derivative Instrument |
||||||||||||||||||||||||||||||||||||
| Amount of gain (loss) recognized in OCI—effective portion |
$ | 2,707 | $ | (442 | ) | $ | 2,265 | $ | 2,769 | $ | 223 | $ | 2,992 | $ | 3,642 | $ | 336 | $ | 3,978 | |||||||||||||||||
| Amount of net loss reclassified from accumulated OCI to Other income (expense)—effective portion |
$ | — | $ | 555 | $ | 555 | $ | — | $ | (1,315 | ) | $ | (1,315 | ) | $ | — | $ | 1,431 | $ | 1,431 | ||||||||||||||||
| Amount of net gain (loss) reclassified from accumulated OCI to Other income (expense)—ineffective portion |
$ | 28 | $ | — | $ | 28 | $ | (14 | ) | $ | — | $ | (14 | ) | $ | — | $ | — | $ | — | ||||||||||||||||
An accumulated other comprehensive pre-tax loss of $2,234 related to the interest rate collar is expected to be reclassified into earnings within the next twelve months of December 31, 2011. An accumulated other comprehensive pre-tax loss of $463 related to the foreign exchange contracts is expected to be reclassified into earnings within the next twelve months of December 31, 2011.
F-46
Table of Contents
MACDERMID, INCORPORATED AND SUBSIDIARIES
NOTES TO CONSOLIDATED FINANCIAL STATEMENTS—(CONTINUED)
(In thousands, except share and per share amounts)
14. FAIR VALUE MEASUREMENTS
The Company determines fair value measurements used in its consolidated financial statements based upon the exit price that would be received to sell an asset or paid to transfer a liability in an orderly transaction between market participants exclusive of any transaction costs, as determined by either the principal market or the most advantageous market. The principal market is the market with the greatest level of activity and volume for the asset or liability. Absent a principal market to measure fair value, the Company has used the most advantageous market, which is the market in which the Company would receive the highest selling price for the asset or pay the lowest price to settle the liability, after considering transaction costs. However, when using the most advantageous market, transaction costs are only considered to determine which market is the most advantageous and these costs are then excluded when applying a fair value measurement.
Inputs used in the valuation techniques to derive fair values are classified based on a three-level hierarchy. The basis for fair value measurements for each level within the hierarchy is described below with Level 1 having the highest priority and Level 3 having the lowest.
The three levels of the fair value hierarchy are as follows:
| • | Level 1—quoted prices (unadjusted) in active markets for identical assets or liabilities that the Company has the ability to access at the measurement date. |
| • | Level 2—quoted prices for similar instruments in active markets; quoted prices for identical or similar instruments in non-active markets; and model derived valuations whose inputs are observable or whose significant valuation drivers are observable. |
| • | Level 3—significant inputs to the valuation model are unobservable and/or reflect the Company’s market assumptions. |
The following table presents the Company’s financial instruments, assets and liabilities that are measured at fair value on a recurring basis:
| Fair Value Measurements Using | ||||||||||||||||
| Description |
December 31, 2011 | Quoted prices in active markets (Level 1) |
Significant other observable inputs (Level 2) |
Significant unobservable inputs (Level 3) |
||||||||||||
| Assets: |
||||||||||||||||
| Money market accounts |
$ | 87,365 | $ | 87,365 | $ | — | $ | — | ||||||||
| Available for sale equity securities |
1,941 | 1,941 | — | — | ||||||||||||
|
|
|
|
|
|
|
|
|
|||||||||
| Total |
$ | 89,306 | $ | 89,306 | $ | — | $ | — | ||||||||
|
|
|
|
|
|
|
|
|
|||||||||
| Liabilities: |
||||||||||||||||
| Derivatives |
$ | 2,697 | $ | — | $ | 2,697 | $ | — | ||||||||
|
|
|
|
|
|
|
|
|
|||||||||
| Total |
$ | 2,697 | $ | — | $ | 2,697 | $ | — | ||||||||
|
|
|
|
|
|
|
|
|
|||||||||
F-47
Table of Contents
MACDERMID, INCORPORATED AND SUBSIDIARIES
NOTES TO CONSOLIDATED FINANCIAL STATEMENTS—(CONTINUED)
(In thousands, except share and per share amounts)
14. FAIR VALUE MEASUREMENTS (CONTINUED)
| Fair Value Measurements Using | ||||||||||||||||
| Description |
December 31, 2010 | Quoted prices in active markets (Level 1) |
Significant other observable inputs (Level 2) |
Significant unobservable inputs (Level 3) |
||||||||||||
| Assets: |
||||||||||||||||
| Money market accounts |
$ | 73,148 | $ | 73,148 | $ | — | $ | — | ||||||||
| Derivatives |
217 | — | 217 | — | ||||||||||||
| Available for sale equity securities |
1,331 | 1,331 | — | — | ||||||||||||
|
|
|
|
|
|
|
|
|
|||||||||
| Total |
$ | 74,696 | $ | 74,479 | $ | 217 | $ | — | ||||||||
|
|
|
|
|
|
|
|
|
|||||||||
| Liabilities: |
||||||||||||||||
| Derivatives |
$ | 6,427 | $ | — | $ | 6,427 | $ | — | ||||||||
|
|
|
|
|
|
|
|
|
|||||||||
| Total |
$ | 6,427 | $ | — | $ | 6,427 | $ | — | ||||||||
|
|
|
|
|
|
|
|
|
|||||||||
Money market accounts are included in cash and cash equivalents in the balance sheet. Available for sale equity securities are included in other long term assets in the balance sheet.
Nonrecurring Fair Value Measurements
In accordance with the provisions of ASC Topic 360, “Property, Plant and Equipment”, certain customer list intangible assets with carrying amounts of $51,138 in the Industrial Asia reporting unit were written down to their implied fair values of $4,700, resulting in intangible asset impairment charges of $46,438. These impairment charges were included in the results from operations for the year ended December 31, 2011.
There were no write down of assets to implied fair value during the year ended December 31, 2010.
In accordance with the provisions of ASC Topic 350, goodwill with carrying amounts of $112,264 and $242,117, respectively, in the Industrial Americas reporting unit and the Industrial Asia reporting unit, was written down to its implied fair value of $97,436 and $214,972, respectively, resulting in an impairment charge of $14,611 and $26,601, respectively. The goodwill impairment charges were included in the results from operations for the year ended December 31, 2009.
In accordance with the provisions of ASC Topic 350, other intangible assets with carrying amounts of $76,300 and $195, respectively, in the Industrial Americas reporting unit and Industrial Europe reporting unit, were written down to its implied fair value of $50,200 and $0, respectively, resulting in an impairment charge of $26,100 and $195, respectively. The other intangible asset impairment charges were included in the results from operations for the year ended December 31, 2009.
F-48
Table of Contents
MACDERMID, INCORPORATED AND SUBSIDIARIES
NOTES TO CONSOLIDATED FINANCIAL STATEMENTS—(CONTINUED)
(In thousands, except share and per share amounts)
14. FAIR VALUE MEASUREMENTS (CONTINUED)
In accordance with the provisions of the Impairment or Disposal of Long-Lived Assets Subsection of ASC Subtopic 360-10, fixed assets with a carrying amount of $1,185 were written down to their implied fair value of $0, resulting in an impairment charge of $1,185. The fixed asset impairment charge was included in the results from operations for the year ended December 31, 2009. See Note 5, Impairment Loss for further discussion.
| Fair Value Measurements Using | ||||||||||||||||||||
| Description |
Year ended December 31, 2011 |
Quoted prices in active markets (Level 1) |
Significant other observable inputs (Level 2) |
Significant unobservable inputs (Level 3) |
Total (Losses) |
|||||||||||||||
| Customer list intangible assets—Industrial Asia |
$ | 4,700 | $ | — | $ | — | $ | 4,700 | $ | (46,438 | ) | |||||||||
|
|
|
|||||||||||||||||||
| $ | (46,438 | ) | ||||||||||||||||||
|
|
|
|||||||||||||||||||
| Fair Value Measurements Using | ||||||||||||||||||||
| Description |
Year ended December 31, 2009 |
Quoted prices in active markets (Level 1) |
Significant other observable inputs (Level 2) |
Significant unobservable inputs (Level 3) |
Total (Losses) |
|||||||||||||||
| Goodwill, Industrial Americas |
$ | 97,436 | — | — | $ | 97,436 | $ | (14,611 | ) | |||||||||||
| Goodwill, Industrial Asia |
214,972 | 214,972 | (26,601 | ) | ||||||||||||||||
| Other intangible assets—Industrial Americas |
50,200 | — | — | 50,200 | (26,100 | ) | ||||||||||||||
| Other intangible assets—Industrial Europe |
— | — | — | — | (195 | ) | ||||||||||||||
| Property, plant and equipment—Printing Americas |
— | — | — | — | (1,185 | ) | ||||||||||||||
|
|
|
|||||||||||||||||||
| $ | (68,692 | ) | ||||||||||||||||||
|
|
|
|||||||||||||||||||
The following table presents the carrying value and estimated fair value of the Company’s tranche B, tranche C and senior subordinated notes debt:
| December 31, 2011 | December 31, 2010 | |||||||||||||||
| Carrying Value | Fair Value | Carrying Value | Fair Value | |||||||||||||
| Tranche B, tranche C and Senior subordinated notes debt including current portion |
$ | 733,097 | $ | 727,883 | $ | 767,827 | $ | 764,287 | ||||||||
|
|
|
|
|
|
|
|
|
|||||||||
The carrying value of the Company’s Japanese senior secured bank debt approximates fair value as of December 31, 2011 and 2010.
F-49
Table of Contents
MACDERMID, INCORPORATED AND SUBSIDIARIES
NOTES TO CONSOLIDATED FINANCIAL STATEMENTS—(CONTINUED)
(In thousands, except share and per share amounts)
14. FAIR VALUE MEASUREMENTS (CONTINUED)
The following methods and assumptions were used to estimate the fair value of each class of the Company’s financial instruments, assets and liabilities:
Money market accounts—The Company invests in various money market funds which are managed by financial institutions. These money market funds are not publicly traded, but historically have been highly liquid. The fair value of the money market accounts is determined by the banks based upon the funds’ net asset values (“NAV”). All of the money market accounts currently permit daily investments and redemptions at $1.00 NAV.
Derivatives—The fair value of derivatives are determined using pricing models based upon market observable inputs including interest rate curves and both forward and spot prices for currencies. Derivative assets include foreign exchange contracts and derivative liabilities include interest rate swaps and an interest rate collar.
Available for sale equity securities—Equity securities classified as available for sale are measured using quoted market prices at the reporting date multiplied by the quantity held.
Tranche B, Tranche C and senior subordinated notes debt – The Tranche B, Tranche C and senior subordinated debt are measured using quoted market prices at the reporting date multiplied by the carrying amount of the related debt.
15. STOCKHOLDERS’ EQUITY
In connection with the Merger transaction described in Note 2 above, the Company issued 10,000,000 shares at $5.00 par value per share of common share. As of December 31, 2011 and 2010, there were 9,946,439 common shares and 9,932,132 common shares outstanding, respectively.
The Company also issued 316,000 shares at $1,000 par value per share of preferred shares. The preferred shares accrue a 9% cumulative payment in kind dividend compounded quarterly. At December 31, 2011 and 2010, the amount of the cumulative payment in kind dividend was $164,449 and $123,602, respectively. At December 31, 2011 and 2010, there were 315,264 preferred shares and 315,247 preferred shares outstanding, respectively. The preferred shares are not redeemable and have no voting rights, covenants or restrictions. Upon the liquidation of the Company, the preferred shares would first receive, to the extent funds are available, proceeds equal to the payment in kind dividend then the unreturned preferred share original cost, which is $1,000 per share. Then, the holders of the common shares will receive the unreturned common share original issue cost, which is $1.00 per share. The holders of the common shares will then receive a common preference of $1.10 per share. After, the holders of the common shares and junior shares shall be entitled to receive the remaining portion of the proceeds from liquidation. Additionally, no shareholder shall be liable for the debts, obligations or liabilities of the Company.
Accumulated other comprehensive (loss) income consisted of the following:
| December 31, 2011 | December 31, 2010 | |||||||
| Foreign currency translation adjustments |
$ | 9,559 | $ | 15,242 | ||||
| Pension and postretirement benefit plans, net of tax |
(22,670 | ) | (7,230 | ) | ||||
| Cash flow and foreign currency hedges—derivatives valuation, net of tax |
(1,763 | ) | (4,028 | ) | ||||
| Investment securities, net of tax |
(85 | ) | 14 | |||||
|
|
|
|
|
|||||
| Accumulated other comprehensive (loss) income |
$ | (14,959 | ) | $ | 3,998 | |||
|
|
|
|
|
|||||
F-50
Table of Contents
MACDERMID, INCORPORATED AND SUBSIDIARIES
NOTES TO CONSOLIDATED FINANCIAL STATEMENTS—(CONTINUED)
(In thousands, except share and per share amounts)
16. OPERATING LEASE COMMITMENTS
MacDermid’s leases expire at various dates through 2047 for certain office and warehouse space, land, transportation, computer and other equipment. Contingent rentals are paid for warehouse space on the basis of the monthly quantities of materials stored and for transportation and other equipment on the basis of mileage or usage. Total rental expense for leases for the years ended December 31, 2011, 2010 and 2009 was $10,224, $10,553 and $10,404, respectively. Of these amounts, $721, $832 and $1,004 were contingent rentals.
Minimum future non-cancelable operating lease commitments are as follows:
| 2012 |
$ | 9,851 | ||
| 2013 |
5,774 | |||
| 2014 |
3,932 | |||
| 2015 |
2,820 | |||
| 2016 |
2,593 | |||
| Thereafter |
20,595 | |||
|
|
|
|||
| Total |
$ | 45,565 | ||
|
|
|
17. MISCELLANEOUS (EXPENSE) INCOME
The major components of miscellaneous (expense) income are as follows:
| For the years ended | ||||||||||||
| December 31, 2011 |
December 31, 2010 |
December 31, 2009 |
||||||||||
| Miscellaneous income: |
||||||||||||
| Remeasurement gain on foreign denominated debt |
$ | 4,093 | $ | 11,020 | $ | — | ||||||
| Remeasurement gain on foreign denominated intercompany loans |
5,063 | 6,375 | — | |||||||||
| Gain on settled foreign currency derivative |
555 | — | 1,431 | |||||||||
| Gain on interest rate derivative |
28 | — | — | |||||||||
| Other, net |
403 | 223 | 1,140 | |||||||||
|
|
|
|
|
|
|
|||||||
| Total miscellaneous income |
$ | 10,142 | $ | 17,618 | $ | 2,571 | ||||||
|
|
|
|
|
|
|
|||||||
| Miscellaneous expense: |
||||||||||||
| Remeasurement loss on foreign denominated debt |
$ | — | $ | — | $ | (4,178 | ) | |||||
| Loss on settled foreign currency derivative |
— | (1,315 | ) | — | ||||||||
| Foreign exchange loss, net |
(208 | ) | (963 | ) | (1,888 | ) | ||||||
| Remeasurement loss on foreign denominated intercompany loans |
— | — | (889 | ) | ||||||||
| Joint ventures |
(287 | ) | (54 | ) | (15 | ) | ||||||
| Loss on interest rate derivative |
— | (14 | ) | — | ||||||||
| Other, net |
(235 | ) | (166 | ) | (621 | ) | ||||||
|
|
|
|
|
|
|
|||||||
| Total miscellaneous expense |
(730 | ) | (2,512 | ) | (7,591 | ) | ||||||
|
|
|
|
|
|
|
|||||||
| Net miscellaneous income (expense) |
$ | 9,412 | $ | 15,106 | $ | (5,020 | ) | |||||
|
|
|
|
|
|
|
|||||||
F-51
Table of Contents
MACDERMID, INCORPORATED AND SUBSIDIARIES
NOTES TO CONSOLIDATED FINANCIAL STATEMENTS—(CONTINUED)
(In thousands, except share and per share amounts)
18. CONTINGENCIES, ENVIRONMENTAL AND LEGAL MATTERS
Environmental Issues
MacDermid is a manufacturer and distributor of specialty chemical products, and is therefore exposed to the risk of liability or claims with respect to environmental cleanup or other matters, including those in connection with the disposal of hazardous materials. The Company is subject to extensive domestic and foreign laws and regulations relating to environmental protection and worker health and safety, including those governing discharges of pollutants into the air and water, the management and disposal of hazardous substances and wastes, and the cleanup of contaminated properties. The Company has incurred, and will continue to incur, costs and capital expenditures in complying with these laws and regulations. Additional costs could be incurred, including cleanup costs, fines, sanctions, and third-party claims, as a result of violations of or liabilities under environmental laws.
Asset Retirement Obligations
The Company has recognized asset retirement obligations (“ARO’s”) for properties where the Company can make a reasonable estimate of the future cost, including those obligations for which the timing and/or method of settlement are conditional on a future event that may or may not be within the control of the Company. In identifying ARO’s, the Company considers identification of legally enforceable obligations, estimate of potential settlement dates and the calculation of an appropriate discount rate to be used in calculating the fair value of the obligations. At December 31, 2011 and 2010, the Company has accrued $2,497 and $2,285 respectively, for its ARO at manufacturing and administrative sites in the U.S., Europe and Japan. The ARO balances are included in the other long-term liabilities in the Consolidated Balance Sheets as of December 31, 2011 and 2010.
The changes in the carrying amount of the Company’s asset retirement obligations for the year ended December 31, 2011 are as follows:
| Asset retirement obligations, December 31, 2010 |
$ | 2,285 | ||
| Additional obligations incurred |
— | |||
| Foreign currency adjustments |
42 | |||
| Accretion expense |
170 | |||
|
|
|
|||
| Asset retirement obligations, December 31, 2011 |
$ | 2,497 | ||
|
|
|
On an ongoing basis, management evaluates its estimates and assumptions; however, actual amounts could differ from those based on such estimates and assumptions. Changes in the estimates during the period from January 1, 2011 through December 31, 2011 have not been significant.
Environmental Remediation
As of December 31, 2011 and 2010, $2,398 and $2,853, respectively, was reserved for various environmental matters. Ultimate costs may vary from current estimates and reserves, and the discovery of additional contaminants at these or other sites, or the imposition of additional cleanup obligations, or third-party claims relating thereto, could result in significant additional costs. The environmental remediation liabilities are included in both other current liabilities and other long-term liabilities in the Consolidated Balance Sheets at December 31, 2011 and 2010. The Company’s management has determined that any possible losses related to environmental remediation in addition to the amounts recorded as of December 31, 2011 and 2010 are not material.
F-52
Table of Contents
MACDERMID, INCORPORATED AND SUBSIDIARIES
NOTES TO CONSOLIDATED FINANCIAL STATEMENTS—(CONTINUED)
(In thousands, except share and per share amounts)
18. CONTINGENCIES, ENVIRONMENTAL AND LEGAL MATTERS (CONTINUED)
The following summary provides some details regarding the Company’s environmental liabilities:
| • | MacDermid is named as a potentially responsible party (“PRP”) at a Superfund site (Fike-Artel in Nitro, West Virginia), in which many other PRPs are also involved. With respect to this site, the Company has entered into a cost sharing agreement that historically has resulted in costs of less than $10 per year for funding MacDermid’s share of the ongoing cleanup costs at the site. No reserve has been established for this cost sharing agreement, because of the de minimus nature of the costs. The Company’s cost sharing percentage for this site is 0.2%. On October 31, 2005, the Environmental Protection Agency (“EPA”) notified the Company of alleged de minimus responsibility for certain contamination at the Mercury Refining Site in New York. The Company has entered in a de minimus settlement agreement with the EPA regarding the Mercury Refining Site and has paid $3 in settlement of its liabilities. The Company has also been named as a PRP at other sites within the U.S. As of December 31, 2011 and 2010, no liability amount was recorded by the Company as MacDermid has not been named as a PRP at these sites. |
| • | Some of the facilities associated with the Company have an extended history of chemical and industrial activity. These sites include certain sites such as the Kearny, New Jersey and Waukegan, Illinois sites, which were associated with the Company’s December 1998 acquisition of W. Canning plc (“Canning”). With respect to the Kearny, New Jersey site, a Canning subsidiary withheld, under the agreement in respect of the Canning acquisition, a deferred purchase price payment of approximately $1,600. In addition, a separate escrow fund of $2,000 has been established to fund remediation of the Kearny site. Clean-up costs at these sites are estimated to be between $2,000 and $5,000. The owners of the Kearny, New Jersey site have primary responsibility for clean-up costs. Investigations into the extent of contamination at these sites are, however, ongoing. MacDermid is in the process of characterizing contamination at its Huntingdon Avenue, Waterbury, Connecticut site, which was closed in 2003. As of December 31, 2011, $450 has been accrued for the estimated closure costs for this site. |
Legal Proceedings
From time to time there are various legal proceedings pending against the Company. MacDermid considers all such proceedings to be ordinary litigation incident to the nature of our business. Certain claims are covered by liability insurance. MacDermid believes that the resolution of these claims, to the extent not covered by insurance, will not individually or in the aggregate, have a material adverse effect on its financial position, cash flows or results of operations. To the extent reasonably estimable, reserves have been established regarding pending legal proceedings. As of December 31, 2011 and 2010, the Company has approximately $2,089 and $1,900, respectively, of reserves for legal proceedings.
19. RELATED PARTY TRANSACTIONS
For the years ending December 31, 2011, 2010 and 2009, the Company paid management fees of $509, $305 and $330, respectively, to Court Square. Court Square was owed $102 as of December 31, 2010 for a portion of its annual management fee. Three of MacDermid’s board members are employees of Court Square.
For the years ending December 31, 2011, 2010 and 2009, the Company paid management fees to Weston Presidio of $70, $93 and $70, respectively. Weston Presidio was owed $23 as of December 31, 2011 for a portion of its annual management fee. One of MacDermid’s board members is an employee of Weston Presidio.
F-53
Table of Contents
MACDERMID, INCORPORATED AND SUBSIDIARIES
NOTES TO CONSOLIDATED FINANCIAL STATEMENTS—(CONTINUED)
(In thousands, except share and per share amounts)
20. RESTRUCTURING ACTIVITIES
MacDermid continuously evaluates all operations to identify opportunities to improve profitability by leveraging existing infrastructure to reduce operating costs and respond to overall economic conditions. MacDermid implemented certain consolidation actions during the years ended December 31, 2011, 2010 and 2009. These actions are intended to better align the Company’s manufacturing capacity, eliminate excess capacity by lowering operating costs, and streamline the organizational structure for improved long-term profitability. The restructuring actions consist of facility consolidations and closures, inventory and equipment write offs and employee terminations. The Company expects to incur incremental manufacturing inefficiency costs at the operating locations impacted by the restructuring actions during the related restructuring implementation period. During 2009, the Company initiated restructuring and other cost-saving actions in order to streamline operations and improve efficiency and effectiveness in response to economic conditions within the businesses that the Company served. The restructuring actions included a reduction of the Company’s global workforce, reduction of manufacturing capacity and inventory and equipment write offs at its locations worldwide. The restructuring plans initiated in 2010 primarily related to the closure of one manufacturing facility. The restructuring plans initiated in 2011 primarily related to the consolidation of certain back office functions in the Industrial Europe reporting unit. During the years ended December 31, 2011, 2010 and 2009, MacDermid recognized restructuring charges in the amount of $896, $6,234 and $4,228, respectively, related to employee severance and other charges.
During the year ended December 31, 2011, the Company recorded $896 of restructuring expense. The Company recorded $931 related to the elimination of four positions in the Industrial Europe operations, $12 related to the elimination of one position in the Industrial Americas operations and $180 related to the elimination of seven positions in the Industrial Asia operations. Additionally, the Company reversed $(163) related to accrued benefits in the Industrial Europe operations and $(3) in the Industrial Americas operations as the amounts were no longer due to employees. The restructuring costs reversed during the year ended December 31, 2011 were accrued in prior years. Additionally, the Company reversed $(61) related to accrued other for estimated legal costs that were no longer required. As of December 31, 2011, the Company has accrued restructuring costs of $1,247 that are anticipated to be paid out within the succeeding twelve months.
During the year ended December 31, 2010, the Company recorded $6,234 of restructuring expense. The Company recorded $90 related to the elimination of four positions in the Industrial Americas operations and $3,172 related to the elimination of thirty-five positions in the Industrial Europe operations. The Company also recorded restructuring expense of $355 related to lease termination cost, and long term asset write down expense of $2,443, equipment disposal expense of $203 and other miscellaneous costs of $95 in the Industrial Europe operations. The Company also reversed $(112) of restructuring charges related to accrued benefits in the Industrial Americas operations as the amounts were no longer due the employees. During the year ended December 31, 2010, the Company recorded $40 related to the elimination of two positions in the Printing Asia operations and reversed $(52) for 2009 restructuring programs in the Printing Europe operations.
During the year ended December 31, 2009, the Company recorded $3,051 of restructuring expense in the Industrial Americas and Industrial Europe operations related to the reduction of one hundred thirty-four positions and $586 in the Printing Americas operations related to the reduction of forty-one positions. During this same period the Company recorded a $124 charge to restructuring related to other miscellaneous costs associated with the restructuring program in the Industrial Europe operations and $775 of facility costs in the Industrial Europe operations related to moving a manufacturing facility in the United Kingdom. During the year ended December 31, 2009, the Company reversed restructuring expense of $(279) for 2008 restructuring programs in the Printing Europe operations and $(29) for the corporate group.
F-54
Table of Contents
MACDERMID, INCORPORATED AND SUBSIDIARIES
NOTES TO CONSOLIDATED FINANCIAL STATEMENTS—(CONTINUED)
(In thousands, except share and per share amounts)
20. RESTRUCTURING ACTIVITIES (CONTINUED)
The activity in the accrued restructuring was as follows:
| Balance December 31, 2010 |
For the year ended December 31, 2011 | Total costs
and adjustments for the period ending December 31, 2011 |
Total costs as of December 31, 2011 |
|||||||||||||||||||||
| Charges to Expense |
Cash payments |
Non-cash Adjustments |
||||||||||||||||||||||
| Printing: |
||||||||||||||||||||||||
| Severance and other benefits |
$ | 24 | $ | — | $ | — | $ | (12 | ) | $ | (12 | ) | $ | 12 | ||||||||||
| Site clean-up costs |
10 | — | (2 | ) | — | (2 | ) | 8 | ||||||||||||||||
|
|
|
|
|
|
|
|
|
|
|
|
|
|||||||||||||
| Total Printing |
34 | — | (2 | ) | (12 | ) | (14 | ) | 20 | |||||||||||||||
|
|
|
|
|
|
|
|
|
|
|
|
|
|||||||||||||
| Industrial: |
||||||||||||||||||||||||
| Severance and other benefits |
1,912 | 957 | (1,815 | ) | (42 | ) | (900 | ) | 1,012 | |||||||||||||||
| Other |
442 | (61 | ) | (171 | ) | 5 | (227 | ) | 215 | |||||||||||||||
|
|
|
|
|
|
|
|
|
|
|
|
|
|||||||||||||
| Industrial |
2,354 | 896 | (1,986 | ) | (37 | ) | (1,127 | ) | 1,227 | |||||||||||||||
|
|
|
|
|
|
|
|
|
|
|
|
|
|||||||||||||
| Total restructuring charges |
$ | 2,388 | $ | 896 | $ | (1,988 | ) | $ | (49 | ) | $ | (1,141 | ) | $ | 1,247 | |||||||||
|
|
|
|
|
|
|
|
|
|
|
|
|
|||||||||||||
| Balance December 31, 2009 |
For the year ended December 31, 2010 | Total costs and adjustments for the year ending December 31, 2010 |
Total costs as of December 31, 2010 |
|||||||||||||||||||||
| Charges to Expense |
Cash payments |
Non-cash Adjustments |
||||||||||||||||||||||
| Printing: |
||||||||||||||||||||||||
| Severance and other benefits |
$ | — | $ | (12 | ) | $ | (122 | ) | $ | 158 | $ | 24 | $ | 24 | ||||||||||
| Site clean-up costs |
26 | — | (13 | ) | (3 | ) | (16 | ) | 10 | |||||||||||||||
|
|
|
|
|
|
|
|
|
|
|
|
|
|||||||||||||
| Total Printing |
26 | (12 | ) | (135 | ) | 155 | 8 | 34 | ||||||||||||||||
|
|
|
|
|
|
|
|
|
|
|
|
|
|||||||||||||
| Industrial: |
||||||||||||||||||||||||
| Severance and other benefits |
664 | 3,149 | (1,731 | ) | (170 | ) | 1,248 | 1,912 | ||||||||||||||||
| Asset write downs |
— | 2,443 | — | (2,443 | ) | — | — | |||||||||||||||||
| Facility and other costs |
— | 654 | (232 | ) | 20 | 442 | 442 | |||||||||||||||||
|
|
|
|
|
|
|
|
|
|
|
|
|
|||||||||||||
| Total Industrial |
664 | 6,246 | (1,963 | ) | (2,593 | ) | 1,690 | 2,354 | ||||||||||||||||
|
|
|
|
|
|
|
|
|
|
|
|
|
|||||||||||||
| Total restructuring charges |
$ | 690 | $ | 6,234 | $ | (2,098 | ) | $ | (2,438 | ) | $ | 1,698 | $ | 2,388 | ||||||||||
|
|
|
|
|
|
|
|
|
|
|
|
|
|||||||||||||
| Balance December 31, 2008 |
For the year ended December 31, 2009 | Total costs and adjustments for the year ending December 31, 2009 |
Total costs as of December 31, 2009 |
|||||||||||||||||||||
| Charges to Expense |
Cash payments |
Non-cash Adjustments |
||||||||||||||||||||||
| Printing: |
||||||||||||||||||||||||
| Severance and other benefits |
$ | 2,198 | $ | 293 | $ | (2,399 | ) | $ | (92 | ) | $ | (2,198 | ) | $ | — | |||||||||
| Site clean-up costs |
228 | — | (196 | ) | (6 | ) | (202 | ) | 26 | |||||||||||||||
|
|
|
|
|
|
|
|
|
|
|
|
|
|||||||||||||
| Total Printing |
2,426 | 293 | (2,595 | ) | (98 | ) | (2,400 | ) | 26 | |||||||||||||||
|
|
|
|
|
|
|
|
|
|
|
|
|
|||||||||||||
| Industrial: |
||||||||||||||||||||||||
| Severance and other benefits |
984 | 3,036 | (3,396 | ) | 40 | (320 | ) | 664 | ||||||||||||||||
| Facility and other costs |
46 | 899 | (827 | ) | (118 | ) | (46 | ) | — | |||||||||||||||
|
|
|
|
|
|
|
|
|
|
|
|
|
|||||||||||||
| Total Industrial |
1,030 | 3,935 | (4,223 | ) | (78 | ) | (366 | ) | 664 | |||||||||||||||
|
|
|
|
|
|
|
|
|
|
|
|
|
|||||||||||||
| Total restructuring charges |
$ | 3,456 | $ | 4,228 | $ | (6,818 | ) | $ | (176 | ) | $ | (2,766 | ) | $ | 690 | |||||||||
|
|
|
|
|
|
|
|
|
|
|
|
|
|||||||||||||
F-55
Table of Contents
MACDERMID, INCORPORATED AND SUBSIDIARIES
NOTES TO CONSOLIDATED FINANCIAL STATEMENTS—(CONTINUED)
(In thousands, except share and per share amounts)
21. SEGMENT INFORMATION
The Company operates on a worldwide basis, developing technological solutions using chemistry for the metal and plastic plating, electronic, graphic arts and offshore production and drilling industries. The Company’s Industrial segment supplies technological solutions and chemistry used for finishing metals and non-metallic surfaces for automotive and other industrial applications, electro-plating metal surfaces, etching and imagining to created electrical patterns on circuit boards for the electronic industry and offshore lubricants and cleaners for the offshore oil and gas markets. The Printing segment supplies flexographic plates for use in commercial printing and packaging industries and newspaper plates for the newspaper industry. The profitability of the Company’s reportable segments is evaluated by management based upon operating profit.
The operating profit for each reportable segment include corporate operating costs which are allocated based on the relative burden each segment bears on those corporate operating costs. Transactions between the Company’s reportable segments are recorded on a basis similar to external transactions. As a result of the sale of the Offset and Colorspan business, the Company has excluded the results of operations of these businesses as components of discontinued operations in accordance with ASC 205-20 “Discontinued Operations”. The operations of the Offset and Colorspan business are not included in the table below. See Note 4 for further information regarding the sale of the Colorspan and Offset business units.
The following table gives financial information regarding each reportable segment’s results of operations for the years ended December 31, 2011, 2010 and 2009:
| For the years ended December 31, | ||||||||||||
| 2011 | 2010 | 2009 | ||||||||||
| Net Sales: |
||||||||||||
| Industrial |
||||||||||||
| External sales for the Industrial segment |
$ | 568,578 | $ | 535,945 | $ | 449,059 | ||||||
| Printing |
||||||||||||
| External sales for the Printing segment |
160,195 | 158,388 | 145,094 | |||||||||
|
|
|
|
|
|
|
|||||||
| Consolidated external sales |
$ | 728,773 | $ | 694,333 | $ | 594,153 | ||||||
|
|
|
|
|
|
|
|||||||
| Depreciation and amortization |
||||||||||||
| Industrial |
$ | 37,827 | $ | 38,855 | $ | 39,929 | ||||||
| Printing |
8,918 | 7,689 | 7,876 | |||||||||
|
|
|
|
|
|
|
|||||||
| Consolidated depreciation and amortization |
$ | 46,745 | $ | 46,544 | $ | 47,805 | ||||||
|
|
|
|
|
|
|
|||||||
| Operating profit |
||||||||||||
| Industrial |
$ | 30,331 | $ | 65,053 | $ | (32,930 | ) | |||||
| Printing |
25,617 | 21,338 | 13,721 | |||||||||
|
|
|
|
|
|
|
|||||||
| Consolidated operating profit (loss) |
$ | 55,948 | $ | 86,391 | $ | (19,209 | ) | |||||
|
|
|
|
|
|
|
|||||||
Total assets by reportable segment as of December 31, 2011, 2010 and 2009 were as follows:
| December 31, 2011 | December 31, 2010 | December 31, 2009 | ||||||||||
| Industrial |
$ | 968,572 | $ | 1,063,822 | $ | 1,076,981 | ||||||
| Printing |
391,776 | 372,681 | 364,050 | |||||||||
| Corporate assets |
125,235 | 122,170 | 97,315 | |||||||||
| Intercompany eliminations |
(264,165 | ) | (243,884 | ) | (231,166 | ) | ||||||
|
|
|
|
|
|
|
|||||||
| Consolidated total assets |
$ | 1,221,418 | $ | 1,314,789 | $ | 1,307,180 | ||||||
|
|
|
|
|
|
|
|||||||
F-56
Table of Contents
MACDERMID, INCORPORATED AND SUBSIDIARIES
NOTES TO CONSOLIDATED FINANCIAL STATEMENTS—(CONTINUED)
(In thousands, except share and per share amounts)
21. SEGMENT INFORMATION (CONTINUED)
The following provides information for those countries that are 10 percent or more of the specific category:
| For the years ended December 31, | ||||||||||||
| 2011 | 2010 | 2009 | ||||||||||
| Net Sales*: |
||||||||||||
| United States |
$ | 187,480 | $ | 180,647 | $ | 162,692 | ||||||
|
|
|
|
|
|
|
|||||||
| Foreign Net Sales |
||||||||||||
| United Kingdom |
113,129 | 108,319 | 92,309 | |||||||||
| China |
72,763 | 72,004 | 52,765 | |||||||||
| Other countries |
355,401 | 333,363 | 286,387 | |||||||||
|
|
|
|
|
|
|
|||||||
| Total Foreign Net Sales |
541,293 | 513,686 | 431,461 | |||||||||
| Total consolidated sales |
$ | 728,773 | $ | 694,333 | $ | 594,153 | ||||||
|
|
|
|
|
|
|
|||||||
| * | Net sales are attributed to countries based on the country which generates the sale. |
| December 31, 2011 | December 31, 2010 | December 31, 2009 | ||||||||||
| Long-lived assets: |
||||||||||||
| United States |
$ | 36,640 | $ | 40,870 | $ | 43,894 | ||||||
| Foreign Long-lived assets: |
||||||||||||
| United Kingdom |
21,432 | 22,736 | 26,254 | |||||||||
| Italy |
15,391 | 16,618 | 19,437 | |||||||||
| China |
9,538 | 10,144 | 10,133 | |||||||||
| Other countries |
13,915 | 15,003 | 17,270 | |||||||||
|
|
|
|
|
|
|
|||||||
| Total foreign long-lived assets |
60,276 | 64,501 | 73,094 | |||||||||
|
|
|
|
|
|
|
|||||||
| Total consolidated long-lived assets |
$ | 96,916 | $ | 105,371 | $ | 116,988 | ||||||
|
|
|
|
|
|
|
|||||||
22. SALE OF BUSINESS UNITS
During the year ended December 31, 2011, the Company sold its Industrial Australia and New Zealand business units for proceeds of $3,267. A loss on the disposal of the business units was $1,237. The loss on disposal is included in selling, technical and administrative expense in the statement of operations for the year ended December 31, 2011. The revenues and loss contributions of these business units for the years ended December 31, 2011, 2010 and 2009 were not material.
23. EARNINGS PER SHARE
Basic net loss per share is calculated in accordance with ASC Topic 260, “Earnings Per Share,” by dividing net loss attributable to common stockholders by the weighted average shares outstanding during the period, without consideration for common stock equivalents. Diluted net loss per share is calculated by adjusting weighted average shares outstanding for the dilutive effect of common share equivalents outstanding for the period, determined using the treasury-stock method. For purposes of the diluted net loss per share calculation, the A Shares and B Shares are not considered to be common stock equivalents and are excluded from the calculation of diluted net loss per share because the A Shares and B Shares do not participate in the earnings of the Company.
F-57
Table of Contents
MACDERMID, INCORPORATED AND SUBSIDIARIES
NOTES TO CONSOLIDATED FINANCIAL STATEMENTS—(CONTINUED)
(In thousands, except share and per share amounts)
23. EARNINGS PER SHARE (CONTINUED)
The following table presents the historical computation of basic and diluted net loss per share (in thousands, except share and per share amounts):
| 2011 | 2010 | 2009 | ||||||||||
| Historical net loss per share | ||||||||||||
| Numerator: |
||||||||||||
| Net loss from continuing operations |
$ | (39,860 | ) | $ | (13,430 | ) | $ | (112,503 | ) | |||
| Net loss from discontinued operations |
$ | — | $ | — | $ | (4,448 | ) | |||||
|
|
|
|
|
|
|
|||||||
| Net loss attributable to common shares |
$ | (39,860 | ) | $ | (13,430 | ) | $ | (116,951 | ) | |||
|
|
|
|
|
|
|
|||||||
| Denominator: |
||||||||||||
| Weighted average number of shares outstanding, basic and diluted |
9,942,777 | 9,932,862 | 9,951,799 | |||||||||
| Net loss from continuing operations, basis and diluted |
$ | (4.01 | ) | $ | (1.35 | ) | $ | (11.30 | ) | |||
| Net loss from discontinued operations, basic and diluted |
$ | — | $ | — | $ | (0.45 | ) | |||||
|
|
|
|
|
|
|
|||||||
| Net loss attributable to common shares, basic and diluted |
$ | (4.01 | ) | $ | (1.35 | ) | $ | (11.75 | ) | |||
|
|
|
|
|
|
|
|||||||
24. SUBSEQUENT EVENTS
The Company has evaluated subsequent events through March 7, 2012, the date of these financial statements. There were no events or transactions during this evaluation that require recognition or disclosure in the financial statements.
F-58
Table of Contents
SCHEDULE II—VALUATION AND QUALIFYING ACCOUNTS
(in thousands)
The table below presents valuation and qualifying accounts for the periods presented.
| Beginning Balance |
Additions Charged to Cost and Expenses |
Deductions(1) | Ending Balance |
|||||||||||||
| Allowance for doubtful receivables: |
||||||||||||||||
| Year ended December 31, 2011 |
$ | 8,179 | $ | 1,995 | $ | 1,444 | $ | 8,730 | ||||||||
| Year ended December 31, 2010 |
$ | 7,725 | $ | 1,617 | $ | 1,163 | $ | 8,179 | ||||||||
| Year ended December 31, 2009 |
$ | 8,467 | $ | 2,154 | $ | 2,896 | $ | 7,725 | ||||||||
| Restructuring Accruals: |
||||||||||||||||
| Year ended December 31, 2011 |
$ | 2,388 | $ | 896 | $ | 2,037 | $ | 1,247 | ||||||||
| Year ended December 31, 2010 |
$ | 690 | $ | 6,234 | $ | 4,536 | $ | 2,388 | ||||||||
| Year ended December 31, 2009 |
$ | 3,456 | $ | 4,228 | $ | 6,994 | $ | 690 | ||||||||
| (1) | For allowance for doubtful receivable amounts represent recoveries of previously written off accounts receivable balances, revisions of doubtful accounts receivable and foreign currency impact of previous year’s ending balance. For restructuring accruals amounts represent cash payments, asset impairment charges and foreign currency impact of previous year’s ending balance. |
F-59
Table of Contents
MACDERMID, INCORPORATED AND SUBSIDIARIES
CONSOLIDATED STATEMENTS OF OPERATIONS
(In thousands, except share and per share amounts)
(Unaudited)
| For the three months ended | ||||||||
| March 31, 2012 |
March 31, 2011 |
|||||||
| (Unaudited) | (Unaudited) | |||||||
| Net sales |
$ | 182,195 | $ | 178,521 | ||||
| Cost of sales |
95,884 | 94,980 | ||||||
|
|
|
|
|
|||||
| Gross profit |
86,311 | 83,541 | ||||||
| Operating expenses: |
||||||||
| Selling, technical and administrative |
45,746 | 45,629 | ||||||
| Research and development |
6,718 | 5,359 | ||||||
| Amortization |
6,655 | 7,362 | ||||||
| Restructuring |
114 | (181 | ) | |||||
|
|
|
|
|
|||||
| Total operating expenses |
59,233 | 58,169 | ||||||
| Operating profit |
27,078 | 25,372 | ||||||
| Other income (expense): |
||||||||
| Interest income |
175 | 108 | ||||||
| Interest expense |
(13,556 | ) | (14,088 | ) | ||||
| Miscellaneous (expense) |
(4,353 | ) | (16,172 | ) | ||||
|
|
|
|
|
|||||
| Income (loss) from operations before income taxes, non-controlling interest and accumulated payment-in-kind dividends on cumulative preferred shares |
9,344 | (4,780 | ) | |||||
| Income tax expense |
(4,366 | ) | (1,145 | ) | ||||
|
|
|
|
|
|||||
| Net income (loss) |
4,978 | (5,925 | ) | |||||
| Less net income attributable to the non-controlling interest |
(91 | ) | (88 | ) | ||||
|
|
|
|
|
|||||
| Net income (loss) attributable to MacDermid, Incorporated |
4,887 | (6,013 | ) | |||||
| Accrued payment-in-kind dividend on cumulative preferred shares |
(10,788 | ) | (9,874 | ) | ||||
|
|
|
|
|
|||||
| Net (loss) attributable to common shares |
$ | (5,901 | ) | $ | (15,887 | ) | ||
|
|
|
|
|
|||||
| (Loss) per common share |
||||||||
| Basic and diluted |
$ | (0.59 | ) | $ | (1.60 | ) | ||
| Weighted average number of common shares outstanding: |
||||||||
| Basic and diluted |
9,946,419 | 9,932,132 | ||||||
| Pro forma earnings per share |
||||||||
| Basic |
$ | 0.16 | ||||||
| Diluted |
$ | 0.16 | ||||||
| Pro forma weighted average number of common shares outstanding: |
||||||||
| Basic |
31,387,359 | |||||||
| Diluted |
31,509,558 | |||||||
|
|
|
|
|
|||||
See accompanying notes to consolidated financial statements.
F-60
Table of Contents
MACDERMID, INCORPORATED AND SUBSIDIARIES
CONSOLIDATED STATEMENTS OF COMPREHENSIVE INCOME
(In thousands)
| For the three months ended | ||||||||
| March 31, 2012 |
March 31, 2011 |
|||||||
| (Unaudited) | (Unaudited) | |||||||
| Net income (loss) |
$ | 4,978 | $ | (5,925 | ) | |||
| Foreign currency translation gain |
4,425 | 15,216 | ||||||
| Unrealized gain on available for sale equity investments |
||||||||
| Current period change |
287 | 49 | ||||||
| Unrealized gain (loss) on derivatives valuation |
||||||||
| Change in fair value |
1,690 | 1,002 | ||||||
| Reclassification into earnings |
(19 | ) | 299 | |||||
| Income tax (expense) on other comprehensive income |
(685 | ) | (472 | ) | ||||
|
|
|
|
|
|||||
| Comprehensive income |
10,676 | 10,169 | ||||||
| Comprehensive income attributable to the non-controlling interest |
(91 | ) | (88 | ) | ||||
|
|
|
|
|
|||||
| Comprehensive income attributable to MacDermid, Incorporated |
$ | 10,585 | $ | 10,081 | ||||
|
|
|
|
|
|||||
See accompanying notes to consolidated financial statements.
F-61
Table of Contents
MACDERMID, INCORPORATED AND SUBSIDIARIES
CONSOLIDATED BALANCE SHEETS
(In thousands, except share and per share amounts)
| March 31, 2012 | December 31, 2011 | Pro Forma Stockholders’ Equity as of March 31, 2012 |
||||||||||
| (unaudited) | (unaudited) | |||||||||||
| (see Note 2) | ||||||||||||
| Assets |
||||||||||||
| Current assets: |
||||||||||||
| Cash and cash equivalents |
$ | 109,311 | $ | 113,452 | ||||||||
| Accounts receivable, net of allowance for doubtful receivables of $8,636 and $8,730, respectively |
144,986 | 134,584 | ||||||||||
| Inventories, net |
77,839 | 75,186 | ||||||||||
| Prepaid expenses and other current assets |
12,787 | 12,048 | ||||||||||
| Deferred income taxes |
5,716 | 6,116 | ||||||||||
|
|
|
|
|
|
|
|||||||
| Total current assets |
350,639 | 341,386 | ||||||||||
| Property, plant and equipment, net of accumulated depreciation of $81,303 and $76,216, respectively |
97,410 | 96,916 | ||||||||||
| Goodwill |
480,988 | 474,581 | ||||||||||
| Intangibles, net of accumulated amortization of $146,630 and $139,427, respectively |
268,977 | 274,105 | ||||||||||
| Deferred income taxes |
2,415 | 2,387 | ||||||||||
| Other assets |
32,552 | 32,043 | ||||||||||
|
|
|
|
|
|
|
|||||||
| Total assets |
$ | 1,232,981 | $ | 1,221,418 | ||||||||
|
|
|
|
|
|
|
|||||||
| Liabilities and Stockholders’ Equity |
||||||||||||
| Current liabilities: |
||||||||||||
| Accounts payable |
$ | 56,069 | $ | 49,481 | ||||||||
| Accrued compensation |
11,847 | 14,372 | ||||||||||
| Accrued interest |
15,270 | 6,958 | ||||||||||
| Accrued income taxes payable |
7,017 | 6,398 | ||||||||||
| Accrued expenses |
10,822 | 9,641 | ||||||||||
| Current installments of long-term debt and capital lease obligations |
11,024 | 26,141 | ||||||||||
| Other current liabilities |
11,330 | 13,915 | ||||||||||
|
|
|
|
|
|
|
|||||||
| Total current liabilities |
123,379 | 126,906 | ||||||||||
| Long-term debt and capital lease obligations |
719,412 | 718,231 | ||||||||||
| Retirement benefits, less current portion |
41,991 | 40,902 | ||||||||||
| Deferred income taxes |
60,769 | 62,835 | ||||||||||
| Other long-term liabilities |
34,496 | 30,738 | ||||||||||
|
|
|
|
|
|
|
|||||||
| Total liabilities |
$ | 980,047 | $ | 979,612 | ||||||||
|
|
|
|
|
|
|
|||||||
| Stockholders’ Equity |
||||||||||||
| Cumulative preferred shares, 316,000 shares authorized and issued, 315,254 shares outstanding at March 31, 2012 and 315,264 shares outstanding at December 31, 2011, respectively, including cumulative dividends of $175,237 and $164,449 at March 31, 2012 and December 31, 2011, respectively |
$ | 491,237 | $ | 480,449 | — | |||||||
| Common shares, 50,000,000 shares authorized and issued, 9,946,140 shares and 9,946,439 shares outstanding at March 31, 2012 and December 31, 2011, respectively |
50,000 | 50,000 | 314 | |||||||||
| Class A Junior shares, 430,000 shares authorized and issued, and 314,245 vested shares and 314,245 vested shares outstanding at March 31, 2012 and December 31, 2011, respectively |
— | — | — | |||||||||
| Class B Junior shares, 324,000 shares authorized and issued, and 100,156 vested shares and 49,878 vested shares outstanding at March 31, 2012 and December 31, 2011, respectively |
— | — | — | |||||||||
| Additional paid-in capital |
2,254 | 2,156 | 542,171 | |||||||||
| Accumulated deficit |
(280,359 | ) | (274,458 | ) | (280,359 | ) | ||||||
| Accumulated other comprehensive income |
(9,261 | ) | (14,959 | ) | (9,261 | ) | ||||||
| Common and preferred shares in treasury, 746 preferred shares and 736 preferred shares and 53,860 common shares and 53,561 common shares at March 31, 2012 and December 31, 2011, at cost, respectively |
(1,006 | ) | (994 | ) | — | |||||||
|
|
|
|
|
|
|
|||||||
| Total Stockholders’ equity |
252,865 | 242,194 | 252,865 | |||||||||
| Equity (deficit) in non-controlling interest |
69 | (388 | ) | |||||||||
|
|
|
|
|
|
|
|||||||
| Total equity |
252,934 | 241,806 | ||||||||||
|
|
|
|
|
|
|
|||||||
| Total liabilities and equity |
$ | 1,232,981 | $ | 1,221,418 | ||||||||
|
|
|
|
|
|
|
|||||||
See accompanying notes to consolidated financial statements.
F-62
Table of Contents
MACDERMID, INCORPORATED AND SUBSIDIARIES
CONSOLIDATED STATEMENTS OF CASH FLOWS
(In thousands)
| Three months ended March 31, 2012 |
Three months ended March 31, 2011 |
|||||||
| (Unaudited) | (Unaudited) | |||||||
| Cash flows from operating activities: |
||||||||
| Net income (loss) |
$ | 4,978 | $ | (5,925 | ) | |||
| Adjustments to reconcile net income (loss) from operations to net cash flows provided by operating activities: |
||||||||
| Depreciation |
4,494 | 4,093 | ||||||
| Amortization |
6,655 | 7,362 | ||||||
| Provision for bad debts |
111 | 33 | ||||||
| Deferred income taxes |
(2,132 | ) | (4,011 | ) | ||||
| Write off of deferred financing costs |
226 | 506 | ||||||
| Equity compensation expense |
98 | 98 | ||||||
| Remeasurement losses on foreign denominated debt and intercompany loans |
4,316 | 16,448 | ||||||
| (Gain) on the disposition of fixed assets |
(16 | ) | (7 | ) | ||||
| Restructuring charges |
114 | (181 | ) | |||||
| Amortization of deferred financing fees |
960 | 969 | ||||||
| Changes in assets and liabilities: |
||||||||
| (Increase) in accounts receivables |
(8,171 | ) | (6,352 | ) | ||||
| (Increase) in inventories |
(410 | ) | (6,087 | ) | ||||
| (Increase) in prepaid expenses |
(516 | ) | (1,426 | ) | ||||
| (Increase) decrease in equipment at customers |
(28 | ) | 95 | |||||
| Increase in accounts payable |
3,098 | 8,191 | ||||||
| Increase (decrease) in accrued expenses |
6,417 | (2,025 | ) | |||||
| Increase (decrease) in income tax balances |
715 | (1,321 | ) | |||||
| Other |
(973 | ) | (602 | ) | ||||
|
|
|
|
|
|||||
| Net cash flows provided by operating activities |
19,936 | 9,858 | ||||||
|
|
|
|
|
|||||
| Cash flows from investing activities: |
||||||||
| Capital expenditures |
(1,464 | ) | (1,525 | ) | ||||
| Proceeds from disposition of fixed assets |
46 | 8 | ||||||
| Business acquired |
(5,059 | ) | — | |||||
| (Purchase) of investments |
(57 | ) | — | |||||
|
|
|
|
|
|||||
| Net cash flows (used in) investing activities |
(6,534 | ) | (1,517 | ) | ||||
|
|
|
|
|
|||||
| Cash flows from financing activities: |
||||||||
| Net (repayments) borrowings from short-term borrowings |
(44 | ) | 464 | |||||
| Proceeds from capital leases |
59 | — | ||||||
| Repayments of borrowings |
(17,739 | ) | (27,243 | ) | ||||
| Dividends paid to non-controlling interest partner |
(173 | ) | (138 | ) | ||||
| Repurchase of treasury shares |
(12 | ) | — | |||||
|
|
|
|
|
|||||
| Net cash flows (used in) financing activities |
(17,909 | ) | (26,917 | ) | ||||
|
|
|
|
|
|||||
| Effect of exchange rate changes on cash and cash equivalents |
366 | 290 | ||||||
|
|
|
|
|
|||||
| Net (decrease) in cash and cash equivalents |
(4,141 | ) | (18,286 | ) | ||||
| Cash and cash equivalents at beginning of period |
113,452 | 106,740 | ||||||
|
|
|
|
|
|||||
| Cash and cash equivalents at end of period |
$ | 109,311 | $ | 88,454 | ||||
|
|
|
|
|
|||||
| Supplemental disclosure information: |
||||||||
| Cash paid for interest |
$ | 3,910 | $ | 4,285 | ||||
|
|
|
|
|
|||||
| Cash paid for income taxes |
$ | 5,293 | $ | 4,781 | ||||
|
|
|
|
|
|||||
See accompanying notes to consolidated financial statements.
F-63
Table of Contents
MACDERMID, INCORPORATED AND SUBSIDIARIES
CONSOLIDATED STATEMENT OF CHANGES IN STOCKHOLDERS’ EQUITY
(In thousands)
(unaudited)
| MacDermid Stockholders | ||||||||||||||||||||||||||||||||||||||||||||
| Cumulative Preferred Shares |
Common Shares |
Class A Junior Shares |
Class B Junior Shares |
Additional paid-in capital |
Accumulated deficit |
Accumulated other compre- hensive income (loss) |
Treasury Shares |
Total MacDermid Stockholder Equity |
Non- controlling interest |
Total equity |
||||||||||||||||||||||||||||||||||
| Balance at December 31, 2011 |
$ | 480,449 | $ | 50,000 | $ | — | $ | — | $ | 2,156 | $ | (274,458 | ) | $ | (14,959 | ) | $ | (994 | ) | $ | 242,194 | $ | (388 | ) | $ | 241,806 | ||||||||||||||||||
| Net income |
— | — | — | — | — | 4,887 | — | — | 4,887 | 91 | 4,978 | |||||||||||||||||||||||||||||||||
| Equity compensation |
— | — | — | — | 98 | — | — | — | 98 | — | 98 | |||||||||||||||||||||||||||||||||
| Accrual of paid in kind dividend on cumulative preferred shares |
10,788 | — | — | — | — | (10,788 | ) | — | — | — | — | — | ||||||||||||||||||||||||||||||||
| Foreign currency translation adjustments |
— | — | — | — | — | — | 4,425 | — | 4,425 | 6 | 4,431 | |||||||||||||||||||||||||||||||||
| Derivatives valuation, net of tax expense of $584 |
— | — | — | — | — | — | 1,087 | — | 1,087 | — | 1,087 | |||||||||||||||||||||||||||||||||
| Unrealized gain on available for sale equity securities, net of tax expense of $101 |
— | — | — | — | — | — | 186 | — | 186 | — | 186 | |||||||||||||||||||||||||||||||||
| Exchange for non controlling interest |
— | — | — | — | — | — | — | — | — | 533 | 533 | |||||||||||||||||||||||||||||||||
| Treasury shares repurchased |
— | — | — | — | — | — | — | (12 | ) | (12 | ) | — | (12 | ) | ||||||||||||||||||||||||||||||
| Dividend paid to non-controlling interest partner |
— | — | — | — | — | — | — | — | — | (173 | ) | (173 | ) | |||||||||||||||||||||||||||||||
|
|
|
|
|
|
|
|
|
|
|
|
|
|
|
|
|
|
|
|
|
|
|
|||||||||||||||||||||||
| Balance at March 31, 2012 |
$ | 491,237 | $ | 50,000 | $ | — | $ | — | $ | 2,254 | $ | (280,359 | ) | $ | (9,261 | ) | $ | (1,006 | ) | $ | 252,865 | $ | 69 | $ | 252,934 | |||||||||||||||||||
|
|
|
|
|
|
|
|
|
|
|
|
|
|
|
|
|
|
|
|
|
|
|
|||||||||||||||||||||||
See accompanying notes to consolidated financial statements.
F-64
Table of Contents
MACDERMID, INCORPORATED AND SUBSIDIARIES
NOTES TO CONSOLIDATED FINANCIAL STATEMENTS—(CONTINUED)
(In thousands, except share and per share amounts)
1. SUMMARY OF SIGNIFICANT ACCOUNTING POLICIES
Basis of Presentation
The accompanying unaudited interim financial information has been prepared in accordance with the interim reporting rules and regulations of the U.S. Securities and Exchange Commission and therefore does not include all information and footnotes necessary for a fair presentation of financial position, results of operations and cash flows in conformity with accounting principles generally accepted in the United States (“GAAP”). Certain information and footnote disclosures normally included in financial statements prepared in accordance with GAAP have been omitted. The preparation of financial statements, in conformity with GAAP, requires management to make estimates and assumptions that affect the reported amounts of assets and liabilities and the disclosure of contingencies at the date of the financial statements as well as the reported amounts of revenues and expenses during the reporting period. Estimates have been prepared on the basis of the most current and best available information and actual results could differ from those estimates.
In the opinion of MacDermid, Incorporated (together with its consolidated subsidiaries, “MacDermid” or the “Company”) management, the accompanying unaudited consolidated financial statements of the interim periods presented contain all adjustments necessary to present fairly the financial position of MacDermid as of March 31, 2012 and December 31, 2011, the results of operations for the three months ended March 31, 2012 and 2011 and the statements of cash flows for the three months ended March 31, 2012 and 2011. The results of operations for the three months ended March 31, 2012 are not necessarily indicative of the results that may be achieved for a full year and cannot be used to indicate financial performance for the entire year.
2. CORPORATE REORGANIZATION
Prior to the time the registration statement in respect of the offering (the “offering”) of common stock by MacDermid Group, Inc. (“MacDermid Group”) is declared effective, the board of directors will approve a corporate reorganization (the “Corporate Reorganization”), pursuant to which, among other things, (1) the Company will effect a 1-for-5 reverse stock split (the “Reverse Stock Split”) of the Company’s common stock, A Shares and B Shares, (2) MacDermid Holdings, LLC and the Savings Plan, which comprise the existing stockholders of the Company, will exchange their shares of Company preferred stock, common stock, A Shares and B Shares for shares of MacDermid Group common stock, in each case in accordance with our applicable governing documents (the “Exchange”) and (3) MacDermid Holdings, LLC will liquidate and distribute the shares of common stock of MacDermid Group received by it in connection with the Exchange to the holders of its membership interests in accordance with the terms of the MacDermid Holdings, LLC operating agreement. Holders of vested A Shares and B Shares will receive shares of MacDermid Group common stock then held by MacDermid Holdings, LLC in accordance with the provisions of the MacDermid Holdings, LLC operating agreement. Holders of unvested A Shares and B Shares will receive restricted shares of MacDermid Group common stock that are subject to substantially identical vesting terms as the existing A Shares and B Shares, respectively. The number of shares of MacDermid Group common stock to be received by holders of vested and unvested A Shares and B Shares will be based on the initial public offering price.
The Reverse Stock Split will be consummated prior to the time the registration statement is declared effective, and the Exchange will be consummated following the time the registration statement is declared effective and the pricing of the offering, but prior to the closing of the offering, based on the initial public offering price.
The number of shares of the Company’s common stock, A Shares and B Shares outstanding have been adjusted retroactively in these financial statements to reflect the Reverse Stock Split in all periods presented. The number of A Shares and B Shares issuable under our equity compensation plans have also been adjusted retroactively in these financial statements to reflect the Reverse Stock Split in all periods presented.
F-65
Table of Contents
MACDERMID, INCORPORATED AND SUBSIDIARIES
NOTES TO CONSOLIDATED FINANCIAL STATEMENTS—(CONTINUED)
(In thousands, except share and per share amounts)
2. CORPORATE REORGANIZATION (CONTINUED)
The pro forma stockholders’ equity as of March 31, 2012 presents the equity-related components of the Company’s consolidated balance sheet computed to give effect to the Exchange, the effect of which is to reflect (1) the effective conversion of our cumulative preferred stock, including the accumulated payment in kind dividend with respect to such preferred stock at the time of the offering, into common stock of the MacDermid Group and (2) the effective payment of a stock preference, in the form of MacDermid Group common stock, in respect of the Company’s common stock, in each case, in accordance with our applicable governing documents. The proceeds expected to be received in the offering are excluded from such pro forma information. The pro forma stockholders’ equity as of March 31, 2012 also gives effect to the cancellation of all of the Company’s treasury shares of both its preferred and common stock.
Pro forma basic and pro forma diluted net income per share of common stock have been computed to give effect to the Exchange, the effect of which is to reflect (1) the effective conversion of our cumulative preferred stock, including the accumulated payment in kind dividend with respect to such preferred stock at the time of the offering, into common stock of the MacDermid Group and (2) the effective payment of a stock preference, in the form of MacDermid Group common stock, in respect of the Company’s common stock, in each case, in accordance with our applicable governing documents. The numerator in the calculation of net income (loss) attributable to common shares of the Company in the pro forma basic and pro forma diluted net income per share calculation has been increased to reflect the elimination of the payment in kind dividend as a result of the effective conversion of the Company’s preferred stock to common stock as described above, as if the Exchange had occurred at the beginning of the period. In accordance with our governing documents, the preferred shares (including the accumulated payment in kind dividend) will be exchanged for MacDermid Group common shares based on the initial public offering price less the underwriting discount. As a result, holders of the preferred shares will be deemed to have received a dividend attributable to the underwriting discount in an aggregate amount of $34,150 as of March 31, 2012. In accordance with applicable accounting guidance, this deemed dividend is not included in net income for purposes of the pro forma basic and diluted net income per share calculations. The amount of the stock preference effectively paid to holders of the Company’s common stock after giving effect to the Reverse Stock Split is $0.50 per share of the Company’s common stock. As a result of the Exchange, each holder of each share of the A Shares and B Shares will receive 0.78 shares of MacDermid Group common stock, other than a small number of such shares that were recently granted.
F-66
Table of Contents
MACDERMID, INCORPORATED AND SUBSIDIARIES
NOTES TO CONSOLIDATED FINANCIAL STATEMENTS—(CONTINUED)
(In thousands, except share and per share amounts)
2. CORPORATE REORGANIZATION (CONTINUED)
The following table presents the historical computation of basic and diluted net loss per share and the unaudited pro forma basic and pro forma diluted net income per share (in thousands, except share and per share amounts):
| For the three months ended March 31, |
||||
| 2012 | ||||
| Pro forma net income per share (unaudited) |
||||
| Numerator: |
||||
| Net loss attributable to common shares |
$ | (5,901 | ) | |
| Add: accrued payment in-kind dividend on cumulative preferred shares |
10,788 | |||
|
|
|
|||
| Net income used to compute pro forma net income per share, basic and diluted |
$ | 4,887 | ||
|
|
|
|||
| Denominator basic: |
||||
| Outstanding shares subsequent to the Corporate Reorganization |
31,387,359 | |||
|
|
|
|||
| Pro forma weighted average number of shares outstanding, basic |
31,387,359 | |||
|
|
|
|||
| Denominator diluted: |
||||
| Outstanding shares subsequent to the Corporate Reorganization |
31,387,359 | |||
| Outstanding shares converted from the A Shares and the B Shares subsequent to the Corporate Reorganization |
122,199 | |||
|
|
|
|||
| Pro forma weighted average number of shares outstanding, diluted |
31,509,558 | |||
|
|
|
|||
| Pro forma net income attributable to common shares, basic and diluted |
$ | 0.16 | ||
|
|
|
|||
3. NEW ACCOUNTING STANDARDS
In June 2011, the FASB issued ASU No. 2011-05, “Comprehensive Income.” This ASU intends to enhance comparability and transparency of other comprehensive income components. The guidance provides an option to present total comprehensive income, the components of net income and the components of other comprehensive income in a single continuous statement or two separate but consecutive statements. This ASU eliminates the option to present other comprehensive income components as part of the statement of changes in shareholders’ equity. The provisions of this ASU will be applied retrospectively for interim and annual periods beginning after December 15, 2011. Early application is permitted. The Company adopted this ASU at December 31, 2011.
In September 2011, the FASB issued ASU No. 2011-08, “Testing Goodwill for Impairment.” This ASU allows an entity to first assess qualitative factors to determine whether it is necessary to perform the two-step quantitative goodwill impairment test. Under this new ASU, if a company chooses the qualitative method, an entity would not be required to calculate the fair value of a reporting unit unless the entity determines, based on a qualitative assessment, that it is more likely than not that its fair value is less than its carrying amount. The provisions of this ASU are effective prospectively for interim and annual impairment tests performed for fiscal years beginning after December 15, 2011. Early application is permitted. The Company adopted this ASU during the three months ended March 31, 2012.
F-67
Table of Contents
MACDERMID, INCORPORATED AND SUBSIDIARIES
NOTES TO CONSOLIDATED FINANCIAL STATEMENTS—(CONTINUED)
(In thousands, except share and per share amounts)
4. ACQUISITION OF BUSINESS
During the quarter ended March 31, 2012, the Company acquired 95% of the stock of a chemical business located in Brazil. This business was acquired to complement the service and product offerings within Brazil and its balance sheet and results of operations have been integrated into the Industrial segment. The total purchase price was approximately $10,652 of which approximately $5,060 remains payable at March 31, 2012. The payable represents the estimated fair value of contingent consideration expected to be payable in the event that the acquired business achieves specific performance metrics over the next two years of operations.
Assets and liabilities of the acquired business were included in the consolidated balance sheets as of March 31, 2012 based on their estimated fair value on the date of acquisition as determined in a purchase price allocation, using available information and making assumptions MacDermid believes are reasonable. The Company is still in the process of completing its valuations of the intangible assets and other purchase price adjustments for this acquisition. The valuation and purchase price allocation is expected to be finalized prior to the end of the Company’s third quarter ending September 30, 2012. The Company’s preliminary allocation of purchase price for these acquisitions included current assets of approximately $2,035, property, plant and equipment of approximately $2,134, goodwill of approximately $5,776, and miscellaneous long term assets of $707. The total amount of goodwill that is expected to be deductible for tax purposes is $0.
5. GOODWILL AND OTHER INTANGIBLE ASSETS
The following table presents goodwill allocated to the reportable segments:
| Reportable Segment | Total | |||||||||||
| Industrial | Printing | |||||||||||
| Balance as of December 31, 2011 |
$ | 446,101 | $ | 28,480 | $ | 474,581 | ||||||
| Addition due to business acquisition |
5,776 | — | 5,776 | |||||||||
| Foreign currency adjustments |
631 | — | 631 | |||||||||
|
|
|
|
|
|
|
|||||||
| Goodwill balance at March 31, 2012 |
$ | 452,508 | $ | 28,480 | $ | 480,988 | ||||||
|
|
|
|
|
|
|
|||||||
Accumulated goodwill impairment related to the Industrial reporting segment as of March 31, 2012 and December 31, 2011 was $57,515, respectively. There was no accumulated goodwill impairment for the Printing Solutions reporting segment as of March 31, 2012 and December 31, 2011.
Intangible assets are as follows:
| March 31, 2012 | December 31, 2011 | |||||||||||||||||||||||
| Gross Carrying Amount |
Accumulated Amortization |
Net Carrying Amount |
Gross Carrying Amount |
Accumulated Amortization |
Net Carrying Amount |
|||||||||||||||||||
| Customer lists |
$ | 274,015 | $ | (105,103 | ) | $ | 168,912 | $ | 272,336 | $ | (100,129 | ) | $ | 172,207 | ||||||||||
| Developed technology |
83,612 | (41,527 | ) | 42,085 | 83,318 | (39,298 | ) | 44,020 | ||||||||||||||||
| Trademarks |
57,980 | — | 57,980 | 57,878 | — | 57,878 | ||||||||||||||||||
|
|
|
|
|
|
|
|
|
|
|
|
|
|||||||||||||
| Total |
$ | 415,607 | $ | (146,630 | ) | $ | 268,977 | $ | 413,532 | $ | (139,427 | ) | $ | 274,105 | ||||||||||
|
|
|
|
|
|
|
|
|
|
|
|
|
|||||||||||||
F-68
Table of Contents
MACDERMID, INCORPORATED AND SUBSIDIARIES
NOTES TO CONSOLIDATED FINANCIAL STATEMENTS—(CONTINUED)
(In thousands, except share and per share amounts)
5. GOODWILL AND OTHER INTANGIBLE ASSETS (CONTINUED)
For the three months ended March 31, 2012 and 2011, the Company recorded amortization expense on intangible assets of $6,655 and $7,362, respectively. Amortization expense for intangible assets is expected to range from $26,720 to $20,425 over the next five years.
Customer lists assets are amortizable and are being amortized on a straight-line basis over the expected period of benefit of three to twenty one years. Developed technology assets are being amortized on a straight-line basis over the expected period of benefits of ten years. Trademarks assets are indefinite-lived intangible assets and are not amortizable.
Goodwill is tested for impairment at the reporting unit level annually, or when events or changes in circumstances indicate that goodwill might be impaired. The Company’s annual test for goodwill impairment is performed as of April 1st. For goodwill, a two-step impairment test is performed for each reporting unit. In the first step of impairment testing, the fair value of each reporting unit is compared to its carrying value. The fair value of a reporting unit is determined based on the present value of estimated discounted future cash flows. If the fair value of the reporting unit exceeds the carrying value of the net assets assigned to that reporting unit, goodwill is not impaired, and no further testing is performed. If the carrying value of the net assets assigned to the reporting unit exceeds the fair value of the reporting unit, then the second step of the impairment test must be performed to determine the implied fair value of the reporting unit’s goodwill. If the carrying value of a reporting unit’s goodwill exceeds its implied fair value, an impairment loss is recorded equal to the difference.
Indefinite-lived purchased intangible assets are reviewed for potential impairment as of April 1st, on an annual basis, or when events or changes in circumstances indicate that indefinite-lived intangible assets might be impaired. Indefinite-lived intangible assets are reviewed for impairment at the reporting unit level for which identifiable revenues are reported. Indefinite-lived intangible assets are reviewed for impairment by comparing the estimated fair value of the indefinite-lived purchased intangible assets to the carrying value. The estimated fair value of these intangible assets is determined using the income approach. An impairment loss is recognized when the estimated fair value of an indefinite-lived purchased intangible asset is less than the carrying value. Currently, the Company is not aware of any event that would have caused goodwill or intangible assets to become impaired.
6. EQUITY COMPENSATION PLANS
On April 13, 2007, MacDermid authorized and issued 430,000 Class A Junior Shares (“A Shares”) to employees who purchased both preferred and common shares of MacDermid, Incorporated as part of a $7,000 management buy-in of both preferred and common shares of MacDermid, Incorporated at the time of the Merger. Under the existing terms of the A Shares, vesting of the A Shares occurs evenly over a five year period and requires continued employment. Forfeited A Shares can be reissued at the Board of Directors’ discretion. Holders of the A Shares are not entitled to any dividends at the time that they vest. However, holders of vested A Shares are entitled to distributions if declared by the board of directors of MacDermid Holdings, LLC. Any such distributions, when declared, would be paid in the order of priority specified in the MacDermid Holdings, LLC operating agreement. Redemption value of the A Shares is based on a sliding formula which takes into account the final valuation of MacDermid at a “liquidity event”, such as an initial public offering or sale of the Company. At the point of the liquidity event, the A Shares will be liquidated in their order of priority or seniority, as compared to each of the Company’s debt and equity instruments. If during the liquidity event, there are not enough proceeds to redeem the Company’s debt and equity instruments with senior claims, then the A Shares may potentially have a $0 value.
As the A Shares vest, the Company records equity based compensation expense and the number of vested A Shares reflected on the balance sheet is increased. The A Shares were valued at $5.00 per share for equity compensation expense purposes. For the three months ended March 31, 2012 and 2011, the Company recorded
F-69
Table of Contents
MACDERMID, INCORPORATED AND SUBSIDIARIES
NOTES TO CONSOLIDATED FINANCIAL STATEMENTS—(CONTINUED)
(In thousands, except share and per share amounts)
6. EQUITY COMPENSATION PLANS (CONTINUED)
equity based compensation expense of $98 and $98, respectively, based upon the vesting of the A Shares. The Company did not receive any funds upon the vesting of the A Shares. The total intrinsic value of A Shares exercised for the three months ended March 31, 2012 and 2011 was $0. As of March 31, 2012, there was $57 of unrecognized compensation cost related to the A Shares, which is expected to be recognized over a weighted average remaining period of approximately 0.1 year. As of March 31, 2012 and December 31, 2011, there were 314,245 vested A Shares.
The following table presents the activity in the non-vested A Shares:
| A Shares: |
A Shares |
Weighted Average Grant Date Fair Value |
||||||
| Outstanding non-vested balance at December 31, 2011 |
80,561 | $ | 5.00 | |||||
| Changes during the period: |
||||||||
| Forfeited |
— | — | ||||||
| Granted |
— | — | ||||||
|
|
|
|
|
|||||
| Outstanding non-vested balance at March 31, 2012 |
80,561 | $ | 5.00 | |||||
|
|
|
|
|
|||||
During the second quarter of 2011, 2,000 A Shares were granted. The estimated fair value of the award was determined at the date of grant. At the date of grant, the Company considered numerous objective and subjective factors, including liquidation scenarios and their respective dates and probabilities based upon management’s best estimates. As a result of the analysis, the estimated fair value of the grant was approximately $10, which will be expensed over the term of the award agreement.
On April 13, 2007, MacDermid authorized the issuance of 324,000 Class B Junior Performance Shares (“B Shares”). In May 2008, the Company issued 272,800 B Shares. The B Shares carry a vesting period of one to four years as well as performance requirements when issued. The Company’s Board of Directors issued the B Shares as a future compensation tool, using a valuation based method, during their annual Compensation and Equity meeting, held at the time of the financial review for the previous fiscal year’s earnings. The Company’s Board of Directors has no further obligation to issue B Shares to any employee of the Company and further issuance of B Shares is at the discretion of the Company’s Board of Directors.
The B Shares were adjusted by resolution of the Board on February 28, 2011, subject to MacDermid Holdings, LLC member consent, to take into account the divestitures and acquisitions by the company since 2007 and the difficult global economic conditions that occurred in 2009. MacDermid Holdings, LLC member consent was completed on April 4, 2011. The change resulted in the reinstatement of shares previously forfeited under the former performance metrics. As a result of the modification of the performance metrics, the estimated fair value of the awards was determined at the date of modification. At the date of modification, the Company considered numerous objective and subjective factors, including liquidation scenarios and their respective dates and probabilities based upon management’s best estimates. As a result of the analysis, the estimated fair value at the date of modification was approximately $842. The Company determined the estimated fair value of the B Shares as of the modification date to be $3.35 per share based upon a stock valuation model of the Company’s common stock on the modification date of the B Shares. The stock valuation model that the Company utilized and that was used to estimate the fair value of the B Shares considered a number of factors including operating and financial performance, the lack of liquidity of the Company’s common stock and the relative rights of the holders of capital stock of the Company and MacDermid Holdings, LLC to receive assets of the Company upon a liquidation event. The key assumptions and estimates in determining the value of the B Shares were (1) the
F-70
Table of Contents
MACDERMID, INCORPORATED AND SUBSIDIARIES
NOTES TO CONSOLIDATED FINANCIAL STATEMENTS—(CONTINUED)
(In thousands, except share and per share amounts)
6. EQUITY COMPENSATION PLANS (CONTINUED)
assumption that the Company would attain the modified performance metrics required for full vesting of the B Shares and (2) the estimation of the fair value of the Company’s common stock on the modification date of the B Shares. None of the specific terms of the B Shares, other than their vesting terms and the rights of the holders of the B Shares in a liquidation event relative to the rights of the holders of the common shares, preferred shares and A Shares, impact the fair value of the B Shares. The issuance of the B Shares was designed to compensate certain of the Company’s employees for their long-term commitment to the Company, motivate sustained increases in the Company’s financial performance and, in a liquidation event, permit employees to share in the value of equity in the Company.
The B Shares will vest ratably on each of March 31, 2011, 2012, 2013, 2014 and 2015 (each, a “Vesting Date”) if the Company attains the modified performance metrics with respect to the calendar year immediately prior to the year of the applicable Vesting Date (a “Performance Vesting Target”). The B Shares can also be adjusted from time to time with the approval of Court Square to take into consideration any divestitures or acquisitions by the Company occurring during such year (a “Modified Performance Vesting Target”). If the Company does not attain the Performance Vesting Target for any of calendar years 2010, 2011, 2012 or 2013, but does attain the Performance Vesting Target for the immediately subsequent calendar year, then, such prior year’s Performance Vesting Target shall be deemed satisfied and such ratable portion of the B Shares that did not vest with respect to the prior calendar year shall vest on the Vesting Date for the then applicable period or upon a change of control (as defined in the MacDermid Holdings, LLC operating agreement), subject to holders of the Company’s preferred shares, common shares and A Shares having received certain threshold amounts in connection with the change of control. If the B Shares have not vested upon the earlier of March 31, 2015 or the date of the consummation of the change of control, any B Shares that have not vested shall be forfeited to the Company and shall cease to be outstanding. Holders of the B Shares are not entitled to any dividends at the time that they vest. However, holders of vested B Shares are entitled to distributions if declared by the board of directors of MacDermid Holdings, LLC. Any such distributions, when declared, would be paid in the order of priority specified in the MacDermid Holdings, LLC operating agreement.
The Performance Vesting Targets required for ratable vesting of the B Shares on the applicable Vesting Date are (1) EBITDA (as defined in the MacDermid Holdings, LLC operating agreement) for calendar year 2010 of at least $137 million; (2) EBITDA for calendar year 2011 of at least $150 million; (3) EBITDA for calendar year 2012 of at least $162 million; (4) EBITDA for calendar year 2013 of at least $172 million; and (5) EBITDA for calendar year 2014 of at least $185 million.
As the B Shares vest, the Company records equity based compensation expense and the number of vested B Shares reflected on the balance sheet is increased. The Company’s EBITDA for calendar year 2011 exceeded $150 million. As a result, 20% of the B Shares vested on March 31, 2012 for the achievement of the 2011 EBITDA performance metric. The Company did not receive any funds upon the vesting of the B Shares. As of March 31, 2012 and December 31, 2011, there were 100,156 and 49,878 vested B Shares, respectively.
The A Shares and B Shares have no redemption value as of March 31, 2012 or December 31, 2011, as the redemption value of each is contingent upon liquidation or dissolution of MacDermid Holdings, LLC, as described in the operating agreement governing that entity.
F-71
Table of Contents
MACDERMID, INCORPORATED AND SUBSIDIARIES
NOTES TO CONSOLIDATED FINANCIAL STATEMENTS—(CONTINUED)
(In thousands, except share and per share amounts)
6. EQUITY COMPENSATION PLANS (CONTINUED)
The following table presents the activity in the non-vested B Shares:
| B Shares: |
B Shares | Weighted Average Grant Date Fair Value |
||||||
| Outstanding non-vested balance at December 31, 2011 |
201,510 | $ | — | |||||
| Changes during the period: |
||||||||
| Forfeited |
— | — | ||||||
| Canceled |
— | — | ||||||
| Reinstated |
— | — | ||||||
| Vesting |
(50,278 | ) | 3.35 | |||||
| Granted |
— | — | ||||||
|
|
|
|
|
|||||
| Outstanding non-vested balance at March 31, 2012 |
151,232 | — | ||||||
|
|
|
|
|
|||||
During the three months ended March 31, 2012 and 2011, no compensation expense was recorded related to the B Shares as the performance condition contained in the B Shares was not probable at March 31, 2012 and 2011. Compensation expense related to the B Shares will not be recorded until the Company’s management concludes that the achievement of the performance condition contained in the B Shares is probable.
In connection with the Corporate Reorganization, holders of the A Shares and B Shares will receive MacDermid Group common stock received by MacDermid Holdings, LLC in the Exchange. See Note 2 for additional information regarding the Corporate Reorganization.
7. INVENTORIES
The major components of inventory as of March 31, 2012 and December 31, 2011 were as follows:
| March 31, 2012 | December 31, 2011 | |||||||
| Finished goods |
$ | 48,851 | $ | 46,142 | ||||
| Raw materials and supplies |
27,272 | 26,535 | ||||||
| Equipment |
1,716 | 2,509 | ||||||
|
|
|
|
|
|||||
| Total inventory, net |
$ | 77,839 | $ | 75,186 | ||||
|
|
|
|
|
|||||
As of March 31, 2012 and December 31, 2011, the reserve for inventory was $10,312 and $9,611, respectively.
F-72
Table of Contents
MACDERMID, INCORPORATED AND SUBSIDIARIES
NOTES TO CONSOLIDATED FINANCIAL STATEMENTS—(CONTINUED)
(In thousands, except share and per share amounts)
8. PENSION, POST-RETIREMENT AND POST-EMPLOYMENT PLANS
The following table shows the components of the net periodic pension benefit costs the Company incurred for the three months ended March 31, 2012 and 2011:
| For the three
months ended March 31, 2012 |
For the three
months ended March 31, 2011 |
|||||||||||||||
| Domestic | Foreign | Domestic | Foreign | |||||||||||||
| Net periodic benefit cost: |
||||||||||||||||
| Service cost |
$ | 866 | $ | 166 | $ | 749 | $ | 121 | ||||||||
| Interest cost |
1,538 | 759 | 1,449 | — | ||||||||||||
| Expected (return) on plan assets |
(1,794 | ) | (1,098 | ) | (1,427 | ) | — | |||||||||
| Net prior service cost amortization |
235 | 125 | 70 | — | ||||||||||||
|
|
|
|
|
|
|
|
|
|||||||||
| Net periodic benefit cost |
$ | 845 | $ | (48 | ) | $ | 841 | $ | 121 | |||||||
|
|
|
|
|
|
|
|
|
|||||||||
The estimated net periodic benefit cost for other postretirement benefits for the three months ended March 31, 2012 was $56. The estimated net periodic benefit cost for other postretirement benefits for the three months ended March 31, 2011 was $122.
The Company expects to contribute $3,000 and $4,633, respectively, to MacDermid’s various domestic and foreign pension plans in 2012. As of March 31, 2012, domestic and foreign pension plan contributions were $0 and $871, respectively. The current portion of pension and postretirement benefit plans are included in other current liabilities in the Company’s balance sheets at March 31, 2012 and December 31, 2011.
9. INCOME TAXES
For the three months ended March 31, 2012 and 2011, the Company reported an income tax provision from continuing operations of $4,366 and $1,145, respectively. Foreign exchange gains and losses are treated as discrete items in determining the annual tax rate. Foreign exchange gain and loss are discrete items as it is not possible to estimate their full year effect. During the three months ended March 31, 2012 and 2011, the Company included discrete items for foreign exchange losses of $4,478 and $14,519, respectively. The discrete items for foreign exchange loss resulted in a tax benefit of $1,614 and $2,958, respectively, for the three months ended March 31, 2012 and 2011.
The Company has net liabilities related to unrecognized tax benefits of $21,911 and $21,007 at March 31, 2012 and December 31, 2011 of which $12,904 and $12,000, if recognized, would impact the Company’s effective tax rate. The Company estimates that $41 of the total unrecognized benefits will reverse within the next twelve months.
The Company recognizes interest and penalties related to unrecognized tax benefits as income tax expense. Accrued interest and penalties are included with the related liability for unrecognized tax benefits in its Consolidated Balance Sheets.
F-73
Table of Contents
MACDERMID, INCORPORATED AND SUBSIDIARIES
NOTES TO CONSOLIDATED FINANCIAL STATEMENTS—(CONTINUED)
(In thousands, except share and per share amounts)
10. DEBT AND CAPITAL LEASES
MacDermid’s debt and capital lease obligations as of March 31, 2012 and December 31, 2011:
| March 31, 2012 | December 31, 2011 | |||||||
| Borrowings under lines of credit |
$ | — | $ | — | ||||
|
|
|
|
|
|||||
| Senior secured credit facility, tranche B due 2014, LIBOR plus 2.00%, weighted average interest rate of 2.33% and 2.27%, respectively |
220,355 | 229,982 | ||||||
| Senior secured credit facility, tranche C due 2014, EURIBOR plus 2.25%, weighted average interest rate of 3.07% and 3.41%, respectively |
150,991 | 153,115 | ||||||
| Senior subordinated notes due 2017, 9.5% interest rate |
350,000 | 350,000 | ||||||
| Japanese senior secured bank debt, due in 2012 and 2014, weighted average interest rate of 1.88% and 1.85%, respectively |
8,000 | 10,108 | ||||||
| Other |
1,090 | 1,167 | ||||||
|
|
|
|
|
|||||
| Total debt and capital lease obligations |
730,436 | 744,372 | ||||||
| Less: current portion debt and capital lease obligations |
(11,024 | ) | (26,141 | ) | ||||
|
|
|
|
|
|||||
| Total long-term debt and capital lease obligations |
$ | 719,412 | $ | 718,231 | ||||
|
|
|
|
|
|||||
Senior Secured Credit Facility
On April 12, 2007, the Company closed three new senior secured credit facilities consisting of (i) a $360,000 tranche B term loan credit facility denominated in U.S. Dollars (“tranche B”), (ii) a $250,000 tranche C term loan credit facility denominated in Euros (“tranche C”) and (iii) a $50,000 revolving credit facility denominated in U.S. Dollars. The loans under the tranche B facility and the revolving credit facility bear interest at the LIBOR based rate, 0.241% at March 31, 2012, plus 2.00% or an alternate base rate at the Company’s option. The Company has chosen the LIBOR based rate. The loans under the tranche C credit facility bear interest at EUROBOR, 0.361% at March 31, 2012, plus 2.25%. Under the tranche B and C term loans the Company is required to make quarterly interest and principal payments and the tranche B and C term loans mature in 2014.
During the three months ended March 31, 2012, principal and interest payments of $900 and $1,312, respectively, were made on the tranche B term loan and $661 and $1,170 of principal and interest payments, respectively, were made on the tranche C term loan.
During the three months ended March 31, 2011, principal and interest payments of $900 and $1,399, respectively, were made on the tranche B term loans and $709 and $1,353 of principal and interest payments, respectively, were made on the tranche C term loans.
During the three months ended March 31, 2012, the Company recorded $4,597 of other expense related to the foreign currency impact of the Euro denominated tranche C term loan. During the three months ended March 31, 2012, the realized portion of the remeasurement gain related to the Euro denominated tranche C term loan was $169.
During the three months ended March 31, 2011, the Company recorded $9,739 of other expense related to the foreign currency impact of the Euro denominated tranche C term loan. During the three months ended March 31, 2011, the realized portion of the remeasurement loss related to the Euro denominated tranche C term loan was $557.
F-74
Table of Contents
MACDERMID, INCORPORATED AND SUBSIDIARIES
NOTES TO CONSOLIDATED FINANCIAL STATEMENTS—(CONTINUED)
(In thousands, except share and per share amounts)
10. DEBT AND CAPITAL LEASES (CONTINUED)
In addition to scheduled repayments, the tranche B and tranche C loans contain mandatory prepayment provisions, whereby the Company is required to reduce the outstanding principal amounts of these loans based on excess cash flow (as defined in the credit agreement for the tranche B and tranche C loans) as of the most recent completed fiscal year. During the three months ended March 31, 2012, the Company made a mandatory excess cash flow prepayment, based on 2011 operating results, of $8,727 on the tranche B loan and $5,882 on the tranche C loan.
During the three months ended March 31, 2011, the Company made a mandatory excess cash flow prepayment, based on 2010 operating results, of $13,938 on the tranche B loan and $10,282 on the tranche C loan.
The Senior Secured Credit Facility is guaranteed by MacDermid Holdings, LLC and certain of its direct and indirect wholly owned domestic subsidiaries and is secured by 65% of the stock of the Company’s first tier foreign subsidiaries, subject to customary exceptions, exclusions and release mechanisms.
Revolving Credit Facility
As discussed above, on April 12, 2007, the Company entered into a $50,000 revolving credit facility. In May 2012, revolving credit facility was amended and extended. The revolving credit facility, as amended, will mature in April 2014. There were no balances outstanding under the revolving credit facility as of March 31, 2012 or December 31, 2011. During the three months ended March 31, 2012 and 2011, the Company paid commitment fees of $62 and $79, respectively, for the revolving credit facility.
MacDermid also has letters of credit outstanding of $3,874 at March 31, 2012 and December 31, 2011, respectively. The letters of credit reduce the borrowings available under the revolving credit facility.
Senior Subordinated Notes
On April 12, 2007, the Company issued $350,000 of senior subordinated notes with a fixed interest rate of 9.50% at par. The senior subordinated notes mature in 2017. Interest is payable semi-annually under the senior subordinated notes (October 15th and April 15th) and the principal amount is payable at maturity in 2017. During the three months ended March 31, 2012 and 2011, no principal or interest payments were made on the senior subordinated notes. The senior subordinated notes are guaranteed by the Company’s wholly owned domestic subsidiaries (“Guarantors”).
Japanese Senior Secured Bank Debt
On February 26, 2007, the predecessor company borrowed approximately $15,000 denominated in Japanese Yen in three separate notes and as described in Note 3, these notes were assumed by Matrix in the merger. The first note of $8,397 has a maturity date of February 26, 2012 and a fixed interest rate of 1.37%. Under the first note, interest and principal payments are due on a semi-annual basis. During 2009, this note was paid in full. The second note of $5,878, which is the first outstanding note, has a maturity date of March 26, 2014 and a fixed interest rate of 1.47%. Under the second note, interest and principal payments are due on a semi-annual basis. The third note of $840, which was the second outstanding note, has a maturity date of March 27, 2012 and a fixed interest rate of 1.31%. The third note, formerly the second outstanding note, was paid in full on March 27, 2012.
F-75
Table of Contents
MACDERMID, INCORPORATED AND SUBSIDIARIES
NOTES TO CONSOLIDATED FINANCIAL STATEMENTS—(CONTINUED)
(In thousands, except share and per share amounts)
10. DEBT AND CAPITAL LEASES (CONTINUED)
On May 7, 2007 the Company borrowed an additional $7,557, denominated in Japanese Yen, which was formerly the third outstanding note, is now the remaining second outstanding note. The May 2007 note has a maturity date of May 28, 2012 and a fixed interest rate of 1.41%. Interest and principal payments are due on a semi-annual basis.
On September 26, 2007, the Company borrowed an additional $2,519 denominated in Japanese Yen, which was formerly the fourth outstanding note, is now the remaining third outstanding note. The September 2007 note has a maturity date of September 26, 2014 and a fixed interest rate of 1.47%. Interest and principal payments are due on a semi-annual basis.
On October 1, 2009, the Company borrowed $5,569 denominated in Japanese Yen, which was formerly the fifth outstanding note is now the remaining fourth outstanding note. This note has a maturity date of August 20, 2014, and a fixed interest rate of 2.40%. Under this note, interest and principal payments are due on a monthly basis.
On February 15, 2010, the Company borrowed $1,111 denominated in Japanese Yen. The note had a maturity date of March 31, 2010 and a fixed interest rate of 1.725% and was paid in full on March 31, 2010.
During the three months ended March 31, 2012, the Company made principal and interest payments of $1,406 and $55, respectively. During the three months ended March 31, 2011, the Company made principal and interest payments of $1,414 and $78, respectively.
During the three months ended March 31, 2012, the Company recorded $0 of other income related to the remeasurement gain or loss on foreign denominated Japanese debt.
During the three months ended March 31, 2011, the Company recorded $161 of other income related to the remeasurement gain on the foreign denominated Japanese debt.
Capital Leases
During the three months ended March 31, 2012, the Company entered into equipment capital lease agreements totaling $59 with interest rates from 4.4% to 4.6%. Payments on capital leases were $163 and $0 for the three months ended March 31, 2012 and 2011, respectively.
Debt Covenants
The senior secured credit facility and senior subordinated notes contain various covenants including limitations on additional indebtedness, dividends and other distributions, entry into new lines of business, use of loan proceeds, capital expenditures, restricted payments, restrictions on liens, transactions with affiliates, amendments to organizational documents, accounting changes, sale and leaseback transactions and dispositions. In addition, the revolving credit facility requires the Company to comply with certain financial covenants, including consolidated leverage, interest coverage ratios and limitations on capital expenditures if the Company’s funding under the revolving credit facility exceeds $10,000 for ten or more days in any fiscal quarter. As of March 31, 2012 and December 31, 2011, the Company was in compliance with the debt covenants contained in the senior secured credit facility and senior subordinated notes.
F-76
Table of Contents
MACDERMID, INCORPORATED AND SUBSIDIARIES
NOTES TO CONSOLIDATED FINANCIAL STATEMENTS—(CONTINUED)
(In thousands, except share and per share amounts)
10. DEBT AND CAPITAL LEASES (CONTINUED)
Other debt facilities
MacDermid carries various short-term debt facilities worldwide which are used to fund short-term cash needs as the need arises. As of March 31, 2012 and December 31, 2011, there was $0 and $0, respectively, outstanding under these other debt facilities. The Company also has various overdraft facilities available. At March 31, 2012 and December 31, 2011, the capacity under these overdraft facilities was approximately $23,385 and $22,762, respectively. As of March 31, 2012, MacDermid’s overdraft lines bore interest rates ranging from 1.0% to 6.3%.
11. DERIVATIVE INSTRUMENTS
In the normal course of business, MacDermid is exposed to risks such as changes in foreign currency exchange rates, interest rates and commodity prices. Derivative financial instruments, such as interest rate swaps, are used to manage changes in market conditions related to debt obligations. All derivatives are recognized on the consolidated balance sheets at fair value at the end of each year. The counterparty to the Company’s derivative agreements is a major international financial institution. The Company continually monitors its positions and the credit ratings of its counterparties, and does not anticipate nonperformance by the counterparties.
Interest Rates
In June 2007, the Company entered into an interest rate collar agreement (“collar”). The collar helps protect the Company’s floating rate U.S. dollar denominated debt. The collar has a floor of 5.20% and a ceiling of 6.25%, a notional amount of $100,000 and covers the period from June 30, 2010 through June 30, 2012.
Changes in the fair value of a derivative that is designated as and meets all the required criteria for a cash flow hedge are recorded in accumulated other comprehensive income (loss) and reclassified into earnings as the underlying hedged item affects earnings. Amounts reclassified into earnings related to interest rate swap agreements are included in interest expense. As of March 31, 2012 and December 31, 2011, approximately $1,169 and $2,234, of unrealized losses, net of tax, respectively, related to the interest rate derivative instruments were included in accumulated other comprehensive income (loss) with a corresponding offset to current liabilities. During the three months ended March 31, 2012 and 2011, the Company recorded $702 and $619 respectively, in unrealized gains to other comprehensive income (loss) (“OCI”). There was hedge effectiveness of approximately $26 and $80, as of March 31, 2012 and December 31, 2011, respectively, included in OCI. Additionally, $13 and $33, respectively was recorded as other expense in the statement of operations for hedge ineffectiveness for the three months ended March 31, 2012 and 2011, respectively.
During the three months ended March 31, 2012, the Company made payments of $1,168 related to the difference between the interest rate collar agreement rate of 5.20% and the actual interest rate on the Company’s floating rate U.S. dollar denominated debt. During the three months ended March 31, 2011, the Company made payments of $1,224 related to the difference between the interest rate collar agreement rate of 5.20% and the actual interest rate on the Company’s floating rate U.S. dollar denominated debt.
Foreign Currency
The Company conducts a significant portion of its business in currencies other than the U.S. dollar, the currency in which the consolidated financial statements are reported. Correspondingly, the Company’s operating results could be affected by foreign currency exchange rate volatility relative to the U.S. dollar. The Company’s
F-77
Table of Contents
MACDERMID, INCORPORATED AND SUBSIDIARIES
NOTES TO CONSOLIDATED FINANCIAL STATEMENTS—(CONTINUED)
(In thousands, except share and per share amounts)
11. DERIVATIVE INSTRUMENTS (CONTINUED)
Autotype subsidiary in the United Kingdom uses the Great Britain Pound (“GBP”) as its functional currency for paying labor and other operating costs, while approximately 25 percent of its revenues are U.S. dollar denominated. To hedge against the risk of a stronger GBP, the Corporate Treasury Group contracted in 2012 and 2011, on behalf of the Autotype foreign subsidiary, with a financial institution to deliver U.S. dollars at a fixed GBP rate and to receive GBP in exchange for the U.S. dollar. The Company did not pay up-front premiums to obtain the hedge.
While the Company has implemented certain strategies to mitigate risks related to the impact of fluctuations in currency exchange rates, it cannot ensure that it will not recognize gains or losses from international transactions, as this is part of transacting business in an international environment. Not every exposure is or can be hedged and, where hedges are put in place based on expected foreign exchange exposure, they are based on forecasts for which actual results may differ from the original estimate. Failure to successfully hedge or anticipate currency risks properly could adversely affect impact or benefit the Company’s consolidated operating results.
As of March 31, 2012, the aggregate United States dollar notional amount of foreign currency forward contracts, designated as hedges, was $14,000. The Company uses the discounted period-end forward rates methodology to determine market value of its forward and option contracts.
During the three months ended March 31, 2012 $385 was recorded as unrealized gains to OCI related to foreign currency hedges. During the three months ended March 31, 2012, the Company recorded realized (loss) of $(32) in miscellaneous expense related to the settlement of hedged foreign exchange contracts.
During the three months ended March 31, 2011, $227 was recorded as unrealized gains to OCI related to foreign currency hedges. During the three months ended March 31, 2011, the Company recorded realized gain of $266 in miscellaneous income related to the settlement of hedged foreign exchange contracts.
The following table summarizes derivative instrument amounts as of March 31, 2012, by currency and the portion of the asset that settles within the next twelve months.
| Local Currency Amount |
U.S. Dollar Amount |
Percentage Settled Within One Year |
Dates Contracts are Through |
|||||||||||||
| Derivative Assets |
||||||||||||||||
| Great Britain Pound |
£3,105 | $ | 5,000 | 100 | % | June 29, 2012 | ||||||||||
| Great Britain Pound |
£3,148 | $ | 5,000 | 100 | % | September 27, 2012 | ||||||||||
| Great Britain Pound |
£2,572 | $ | 4,000 | 100 | % | December 19, 2012 | ||||||||||
|
|
|
|||||||||||||||
| $ | 14,000 | |||||||||||||||
|
|
|
|||||||||||||||
F-78
Table of Contents
MACDERMID, INCORPORATED AND SUBSIDIARIES
NOTES TO CONSOLIDATED FINANCIAL STATEMENTS—(CONTINUED)
(In thousands, except share and per share amounts)
11. DERIVATIVE INSTRUMENTS (CONTINUED)
The following table summarizes the fair value of derivative instruments reported in the Consolidated Balance Sheets:
| Assets Balance Sheet Location |
March 31, 2012 U.S. Dollar Amount |
December 31, 2011 U.S. Dollar Amount |
Liabilities Balance Sheet Location |
March 31, 2012 U.S. Dollar Amount |
December 31, 2011 U.S. Dollar Amount |
|||||||||||||||||
| Derivatives designated as hedging instruments: |
||||||||||||||||||||||
| Interest rate collar |
$ | — | $ | — | |
Other current liabilities |
|
$ | 1,169 | $ | 2,234 | |||||||||||
| Foreign exchange contracts |
Other current assets |
130 | — | |
Other current liabilities |
|
— | 463 | ||||||||||||||
|
|
|
|
|
|
|
|
|
|||||||||||||||
| $ | 130 | $ | — | $ | 1,169 | $ | 2,697 | |||||||||||||||
|
|
|
|
|
|
|
|
|
|||||||||||||||
| Total derivative contracts |
$ | 130 | $ | — | $ | 1,169 | $ | 2,697 | ||||||||||||||
|
|
|
|
|
|
|
|
|
|||||||||||||||
The effect of derivative instruments on the Consolidated Statements of Operations for the three months ended March 31, 2012 and 2011 are as follows:
| For the three months ended March 31, 2012 |
For the three months ended March 31, 2011 |
|||||||||||||||||||||||
| Cash Flow Derivative Instrument |
Interest Rates |
Foreign Currency |
Total |
Interest Rates |
Foreign Currency |
Total |
||||||||||||||||||
| Amount of gain (loss) recognized in OCI—effective portion |
$ | 702 | $ | 385 | $ | 1,087 | $ | 619 | $ | 227 | $ | 846 | ||||||||||||
| Amount of net income (loss) reclassified from accumulated OCI to Other (expense) income—effective portion |
$ | — | $ | (32 | ) | $ | (32 | ) | $ | — | $ | 266 | $ | 266 | ||||||||||
| Amount of net gain reclassified from accumulated OCI to Other income (expense)—ineffective portion |
$ | (13 | ) | $ | — | $ | (13 | ) | $ | (33 | ) | $ | — | $ | (33 | ) | ||||||||
12. FAIR VALUE MEASUREMENTS
The Company determines fair value measurements used in its consolidated financial statements based upon the exit price that would be received to sell an asset or paid to transfer a liability in an orderly transaction between market participants exclusive of any transaction costs, as determined by either the principal market or the most advantageous market. The principal market is the market with the greatest level of activity and volume for the asset or liability. Absent a principal market to measure fair value, the Company has used the most advantageous market, which is the market in which the Company would receive the highest selling price for the asset or pay the lowest price to settle the liability, after considering transaction costs. However, when using the most advantageous market, transaction costs are only considered to determine which market is the most advantageous and these costs are then excluded when applying a fair value measurement.
F-79
Table of Contents
MACDERMID, INCORPORATED AND SUBSIDIARIES
NOTES TO CONSOLIDATED FINANCIAL STATEMENTS—(CONTINUED)
(In thousands, except share and per share amounts)
12. FAIR VALUE MEASUREMENTS (CONTINUED)
Inputs used in the valuation techniques to derive fair values are classified based on a three-level hierarchy. The basis for fair value measurements for each level within the hierarchy is described below with Level 1 having the highest priority and Level 3 having the lowest.
The three levels of the fair value hierarchy are as follows:
| • | Level 1—quoted prices (unadjusted) in active markets for identical assets or liabilities that the Company has the ability to access at the measurement date. |
| • | Level 2—quoted prices for similar instruments in active markets; quoted prices for identical or similar instruments in non-active markets; and model derived valuations whose inputs are observable or whose significant valuation drivers are observable. |
| • | Level 3—significant inputs to the valuation model are unobservable and/or reflect the Company’s market assumptions. |
The following table presents the Company’s financial instruments, assets and liabilities that are measured at fair value on a recurring basis as of March 31, 2012 and December 31, 2011:
| Fair Value Measurement Using | ||||||||||||||||
| March 31, 2012 | Quoted prices in active markets (Level 1) |
Significant other observable inputs (Level 2) |
Significant unobservable inputs (Level 3) |
|||||||||||||
| Assets: |
||||||||||||||||
| Money market accounts |
$ | 72,043 | $ | 72,043 | $ | — | $ | — | ||||||||
| Derivatives |
130 | — | 130 | — | ||||||||||||
| Available for sale equity securities |
2,289 | 2,289 | — | — | ||||||||||||
|
|
|
|
|
|
|
|
|
|||||||||
| Total |
$ | 74,462 | $ | 74,332 | $ | 130 | $ | — | ||||||||
|
|
|
|
|
|
|
|
|
|||||||||
| Liabilities: |
||||||||||||||||
| Derivatives |
$ | 1,169 | $ | — | $ | 1,169 | $ | — | ||||||||
|
|
|
|
|
|
|
|
|
|||||||||
| Total |
$ | 1,169 | $ | — | $ | 1,169 | $ | — | ||||||||
|
|
|
|
|
|
|
|
|
|||||||||
| Fair Value Measurement Using | ||||||||||||||||
| December 31, 2011 | Quoted prices in active markets (Level 1) |
Significant other observable inputs (Level 2) |
Significant unobservable inputs (Level 3) |
|||||||||||||
| Assets: |
||||||||||||||||
| Money market accounts |
$ | 87,365 | $ | 87,365 | $ | — | $ | — | ||||||||
| Available for sale equity securities |
1,941 | 1,941 | — | — | ||||||||||||
|
|
|
|
|
|
|
|
|
|||||||||
| Total |
$ | 89,306 | $ | 89,306 | $ | — | $ | — | ||||||||
|
|
|
|
|
|
|
|
|
|||||||||
| Liabilities: |
||||||||||||||||
| Derivatives |
$ | 2,697 | $ | — | $ | 2,697 | $ | — | ||||||||
|
|
|
|
|
|
|
|
|
|||||||||
| Total |
$ | 2,697 | $ | — | $ | 2,697 | $ | — | ||||||||
|
|
|
|
|
|
|
|
|
|||||||||
Money market accounts are included in cash and cash equivalents in the balance sheet. Available for sale equity securities are included in other long term assets in the balance sheets.
F-80
Table of Contents
MACDERMID, INCORPORATED AND SUBSIDIARIES
NOTES TO CONSOLIDATED FINANCIAL STATEMENTS—(CONTINUED)
(In thousands, except share and per share amounts)
12. FAIR VALUE MEASUREMENTS (CONTINUED)
Nonrecurring Fair Value Measurements
The following table presents the carrying value and estimated fair value of the Company’s tranche B, tranche C and senior subordinated notes debt:
| March 31, 2012 | December 31, 2011 | |||||||||||||||
| Carrying value | Fair Value | Carrying value | Fair Value | |||||||||||||
| Tranche B, tranche C and senior subordinated notes debt including current portion |
$ | 721,346 | $ | 732,909 | $ | 733,097 | $ | 727,883 | ||||||||
|
|
|
|
|
|
|
|
|
|||||||||
The carrying value of the Company’s Japanese senior secured bank debt approximates fair value as of March 31, 2012 and December 31, 2011.
The following methods and assumptions were used to estimate the fair value of each class of the Company’s financial instruments, assets and liabilities:
Money market accounts—The Company invests in various money market funds which are managed by financial institutions. These money market funds are not publicly traded, but historically have been highly liquid. The fair value of the money market accounts is determined by the banks based upon the funds’ net asset values (“NAV”). All of the money market accounts currently permit daily investments and redemptions at $1.00 NAV.
Derivatives—The fair value of derivatives are determined using pricing models based upon market observable inputs including interest rate curves and both forward and spot prices for currencies. Derivative assets include foreign exchange contracts and derivative liabilities include interest rate swaps and an interest rate collar.
Available for sale equity securities—Equity securities classified as available for sale are measured using quoted market prices at the reporting date multiplied by the quantity held.
Tranche B, Tranche C and senior subordinated notes debt—The Tranche B, Tranche C and senior subordinated debt are measured using quoted market prices at the reporting date multiplied by the carrying amount of the related debt.
During the three months ended March 31, 2012 and 2011, there were no significant transfers of assets and liabilities between the fair value categories Level 1 and Level 2.
13. MISCELLANEOUS INCOME (EXPENSE)
The major components of miscellaneous income (expense) for the three months ended March 31, 2012 and 2011:
| For the three months ended | ||||||||
| March 31, 2012 | March 31, 2011 | |||||||
| Miscellaneous income: |
||||||||
| Gain on remeasurement of foreign denominated intercompany loans |
$ | 112 | $ | — | ||||
| Gain on settled foreign currency derivative |
— | 266 | ||||||
| Other |
142 | 92 | ||||||
|
|
|
|
|
|||||
| Total other income |
$ | 254 | $ | 358 | ||||
|
|
|
|
|
|||||
F-81
Table of Contents
MACDERMID, INCORPORATED AND SUBSIDIARIES
NOTES TO CONSOLIDATED FINANCIAL STATEMENTS—(CONTINUED)
(In thousands, except share and per share amounts)
13. MISCELLANEOUS INCOME (EXPENSE) (CONTINUED)
| For the three months ended | ||||||||
| March 31, 2012 | March 31, 2011 | |||||||
| Miscellaneous expense: |
||||||||
| Loss on remeasurement of foreign denominated debt |
$ | (4,428 | ) | $ | (10,135 | ) | ||
| Loss on remeasurement of foreign denominated intercompany loans |
— | (6,313 | ) | |||||
| Loss on settled foreign currency derivative |
(32 | ) | — | |||||
| Foreign exchange loss |
(8 | ) | (29 | ) | ||||
| Unrealized loss on interest rate derivative |
(13 | ) | (33 | ) | ||||
| Other |
(126 | ) | (20 | ) | ||||
|
|
|
|
|
|||||
| Total other expense |
(4,607 | ) | (16,530 | ) | ||||
|
|
|
|
|
|||||
| Net miscellaneous (expense) |
$ | (4,353 | ) | $ | (16,172 | ) | ||
|
|
|
|
|
|||||
14. RESTRUCTURING ACTIVITIES
MacDermid continuously evaluates all operations to identify opportunities to improve profitability by leveraging existing infrastructure to reduce operating costs and respond to overall economic conditions. MacDermid implemented certain consolidation actions during the three months ended March 31, 2012 and 2011. These actions are intended to better align the Company’s manufacturing capacity, eliminate excess capacity by lowering operating costs, and streamline the organizational structure for improved long-term profitability. The restructuring actions consist of facility consolidations and closures, inventory and equipment write offs and employee terminations. The Company expects to incur incremental manufacturing inefficiency costs at the operating locations impacted by the restructuring actions during the related restructuring implementation period. The restructuring plans initiated in 2011 primarily related to the consolidation of certain back office functions in the Industrial Europe reporting unit. The restructuring plans initiated in 2010 primarily related to the closure of one manufacturing facility. Restructuring charges totaled $114 and $(181), respectively, during the three months ended March 31, 2012 and 2011.
During the three months ended March 31, 2012, the Company recorded $114 of restructuring expense. The Company reversed, $(12) related to accrued benefits in the Printing Europe business unit as the amounts were no longer due to employees. Additionally, the Company reversed $(81) related to accrued other for estimated legal costs that were no longer required in the Printing Europe business unit as the amounts were no longer due. The Company recorded restructuring expense of $179 related to the elimination of three positions in the Industrial Europe business unit. Also, the Company reversed $(45) related to accrued other for estimated lease termination costs that were no longer required in the Industrial Europe business unit as the amounts were no longer due. As of March 31, 2012, the Company has accrued restructuring costs of $1,130 that are anticipated to be paid out by December 31, 2012.
During the three months ended March 31, 2011, the Company recorded $(181) of restructuring expense. The Company reversed $(120) related to accrued benefits in the Industrial Europe business unit as the amounts were no longer due to employees. Additionally, the Company reversed $(61) related to accrued other for estimated legal costs that were no longer required.
F-82
Table of Contents
MACDERMID, INCORPORATED AND SUBSIDIARIES
NOTES TO CONSOLIDATED FINANCIAL STATEMENTS—(CONTINUED)
(In thousands, except share and per share amounts)
14. RESTRUCTURING ACTIVITIES (CONTINUED)
The activity in the accrued restructuring was as follows for the three months ended March 31, 2012 and 2011, by segment:
| For the three months ended | ||||||||
| March 31, 2012 |
March 31, 2011 |
|||||||
| Severance and other benefits |
$ | 167 | $ | (120 | ) | |||
| Other |
(53 | ) | (61 | ) | ||||
|
|
|
|
|
|||||
| Total restructuring |
$ | 114 | $ | (181 | ) | |||
|
|
|
|
|
|||||
| Balance December 31, 2011 |
For the three months ended March 31, 2012 |
Total costs and adjustments for the three months ended March 31, 2012 |
Total costs as of March 31, 2012 |
|||||||||||||||||||||
| Charges to Expense |
Cash payments |
Non-cash Adjustments |
||||||||||||||||||||||
| Printing: |
||||||||||||||||||||||||
| Severance and other benefits |
$ | 12 | $ | (12 | ) | $ | — | $ |
— |
|
$ | (12 | ) | $ | — | |||||||||
| Site clean-up costs |
8 | (8 | ) | — | — | (8 | ) | — | ||||||||||||||||
|
|
|
|
|
|
|
|
|
|
|
|
|
|||||||||||||
| Total Printing |
20 | (20 | ) | — | — | (20 | ) | — | ||||||||||||||||
|
|
|
|
|
|
|
|
|
|
|
|
|
|||||||||||||
| Industrial: |
||||||||||||||||||||||||
| Severance and other benefits |
1,012 | 179 | (190 | ) | 29 | 18 | 1,030 | |||||||||||||||||
| Other |
215 | (45 | ) | (10 | ) | 5 | (50 | ) | 165 | |||||||||||||||
|
|
|
|
|
|
|
|
|
|
|
|
|
|||||||||||||
| Total Industrial |
1,227 | 134 | (200 | ) | 34 | (32 | ) | 1,195 | ||||||||||||||||
|
|
|
|
|
|
|
|
|
|
|
|
|
|||||||||||||
| Total restructuring charges |
$ | 1,247 | $ | 114 | $ | (200 | ) | $ | 34 | $ | (52 | ) | $ | 1,195 | ||||||||||
|
|
|
|
|
|
|
|
|
|
|
|
|
|||||||||||||
| Balance December 31, 2010 |
For the three months ended March 31, 2011 |
Total costs and adjustments for the three months ended March 31, 2011 |
Total costs as of March 31, 2011 |
|||||||||||||||||||||
| Charges to Expense |
Cash payments |
Non-cash Adjustments |
||||||||||||||||||||||
| Printing: |
||||||||||||||||||||||||
| Severance and other benefits |
$ | 24 | $ | — | $ | — | $ | — | $ | — | $ | 24 | ||||||||||||
| Site clean-up costs |
10 | — | — | — | — | 10 | ||||||||||||||||||
|
|
|
|
|
|
|
|
|
|
|
|
|
|||||||||||||
| Total Printing |
34 | — | — | — | — | 34 | ||||||||||||||||||
|
|
|
|
|
|
|
|
|
|
|
|
|
|||||||||||||
| Industrial: |
||||||||||||||||||||||||
| Severance and other benefits |
1,912 | (120 | ) | (1,121 | ) | 64 | (1,177 | ) | 735 | |||||||||||||||
| Other |
442 | (61 | ) | (44 | ) | 24 | (81 | ) | 361 | |||||||||||||||
|
|
|
|
|
|
|
|
|
|
|
|
|
|||||||||||||
| Total Industrial |
2,354 | (181 | ) | (1,165 | ) | 88 | (1,258 | ) | 1,096 | |||||||||||||||
|
|
|
|
|
|
|
|
|
|
|
|
|
|||||||||||||
| Total restructuring charges |
$ | 2,388 | $ | (181 | ) | $ | (1,165 | ) | $ | 88 | $ | (1,258 | ) | $ | 1,130 | |||||||||
|
|
|
|
|
|
|
|
|
|
|
|
|
|||||||||||||
F-83
Table of Contents
MACDERMID, INCORPORATED AND SUBSIDIARIES
NOTES TO CONSOLIDATED FINANCIAL STATEMENTS—(CONTINUED)
(In thousands, except share and per share amounts)
15. RELATED PARTY TRANSACTIONS
For the three months ended March 31, 2012 and 2011, the Company paid management fees of $0 and $102, respectively, to Court Square. Court Square was owed $102 as of March 31, 2012 for a portion of its annual management fee. Three of MacDermid’s board members are employees of Court Square.
For the three months ended March 31, 2012 and 2011, the Company paid management fees to Weston Presidio of $47 and $23, respectively. Weston Presidio was owed $23 as of December 31, 2011 for a portion of its annual management fee. One of MacDermid’s board members is an employee of Weston Presidio.
16. SEGMENT REPORTING
The Company operates on a worldwide basis, developing technological solutions using chemistry for the metal and plastic plating, electronic, graphic arts and offshore production and drilling industries. The Company’s Industrial segment supplies technological solutions and chemistry used for finishing metals and non-metallic surfaces for automotive and other industrial applications, electro-plating metal surfaces, etching and imagining to created electrical patterns on circuit boards for the electronic industry and offshore lubricants and cleaners for the offshore oil and gas markets. The Printing segment supplies flexographic plates for use in commercial printing and packaging industries and newspaper plates for the newspaper industry. The profitability of the Company’s reportable segments is evaluated by management based upon operating profit.
The operating profit for each reportable segment include corporate operating costs which are allocated based on the relative burden each segment bears on those corporate operating costs. Transactions between the Company’s reportable segments are recorded on a basis similar to external transactions.
The following table gives relevant information regarding each segment’s results of operations for the three months ended March 31, 2012 and 2011.
| For the three months ended | ||||||||
| March 31, 2012 |
March 31, 2011 |
|||||||
| Net sales |
||||||||
| Industrial |
||||||||
| External sales for the segment |
$ | 140,466 | $ | 140,435 | ||||
| Printing |
||||||||
| External sales for the segment |
41,729 | 38,086 | ||||||
|
|
|
|
|
|||||
| Consolidated external sales |
$ | 182,195 | $ | 178,521 | ||||
|
|
|
|
|
|||||
| Depreciation and amortization |
||||||||
| Industrial |
$ | 8,987 | $ | 9,503 | ||||
| Printing |
2,162 | 1,952 | ||||||
|
|
|
|
|
|||||
| Consolidated depreciation and amortization |
$ | 11,149 | $ | 11,455 | ||||
|
|
|
|
|
|||||
| Operating profit |
||||||||
| Industrial |
$ | 20,744 | $ | 19,747 | ||||
| Printing |
6,334 | 5,625 | ||||||
|
|
|
|
|
|||||
| Consolidated operating profit |
$ | 27,078 | $ | 25,372 | ||||
|
|
|
|
|
|||||
F-84
Table of Contents
MACDERMID, INCORPORATED AND SUBSIDIARIES
NOTES TO CONSOLIDATED FINANCIAL STATEMENTS—(CONTINUED)
(In thousands, except share and per share amounts)
17. EARNINGS PER SHARE
Basic net loss per share is calculated in accordance with ASC Topic 260, “Earnings Per Share,” by dividing net loss attributable to common stockholders by the weighted average shares outstanding during the period, without consideration for common stock equivalents. Diluted net loss per share is calculated by adjusting weighted average shares outstanding for the dilutive effect of common share equivalents outstanding for the period, determined using the treasury-stock method. For purposes of the diluted net loss per share calculation, the A Shares and B Shares are not considered to be common stock equivalents and are excluded from the calculation of diluted net loss per share because the A Shares and B Shares do not participate in the earnings of the Company.
The following table presents the historical computation of basic and diluted net loss per share (in thousands, except share and per share amounts):
| For the three months ended March 31, |
||||||||
| Historical net loss per share | 2012 | 2011 | ||||||
| Numerator: |
||||||||
|
|
|
|
|
|||||
| Net loss attributable to common shares |
$ | (5,901 | ) | $ | (15,887 | ) | ||
|
|
|
|
|
|||||
| Denominator: |
||||||||
| Weighted average number of shares outstanding, basic and diluted |
9,946,419 | 9,932,132 | ||||||
|
|
|
|
|
|||||
| Net loss attributable to common shares, basic and diluted |
$ | (0.59 | ) | $ | (1.60 | ) | ||
|
|
|
|
|
|||||
18. SUBSEQUENT EVENTS
The Company has evaluated subsequent events through May 2, 2012, the date of these financial statements. There were no events or transactions during this evaluation that require recognition or disclosure in the financial statements.
F-85
Table of Contents
Dealer Prospectus Delivery Obligation
Until , 2012 (the 25th day after the date of this prospectus), all dealers that effect transactions in these securities, whether or not participating in this offering, may be required to deliver a prospectus. This is in addition to the dealers’ obligation to deliver a prospectus when acting as underwriters and with respect to their unsold allotments or subscriptions.
Shares
MacDermid Group, Inc.
Common Stock
Preliminary Prospectus
Credit Suisse
Morgan Stanley
Deutsche Bank Securities
Lazard Capital Markets
Stifel Nicolaus Weisel
Oppenheimer & Co.
RBC Capital Markets
, 2012
Table of Contents
PART II
INFORMATION NOT REQUIRED IN PROSPECTUS
| Item 13. | Other Expenses of Issuance and Distribution. |
The following table sets forth the expenses (other than underwriting compensation expected to be incurred) in connection with this offering. All of such amounts (except the SEC registration fee and FINRA filing fee) are estimated.
| SEC registration fee |
$ | 23,220 | ||
| Listing fee |
* | |||
| FINRA filing fee |
$ | 20,500 | ||
| Blue Sky fees and expenses |
* | |||
| Printing and engraving costs |
* | |||
| Legal fees and expenses |
* | |||
| Accounting fees and expenses |
* | |||
| Transfer Agent and Registrar fees and expenses |
* | |||
| Miscellaneous |
* | |||
| Total |
* |
| * | To be provided by amendment |
| Item 14. | Indemnification of Directors and Officers. |
Section 102(b)(7) of the Delaware General Corporation Law, or DGCL, allows a corporation to provide in its certificate of incorporation that a director of the corporation will not be personally liable to the corporation or its stockholders for monetary damages for breach of fiduciary duty as a director, except where the director breached the duty of loyalty, failed to act in good faith, engaged in intentional misconduct or knowingly violated a law, authorized the payment of a dividend or approved a stock repurchase in violation of Delaware corporate law or obtained an improper personal benefit. The company’s certificate of incorporation provides for this limitation of liability.
Section 145 of the DGCL provides that a corporation may indemnify any person who was or is a party or is threatened to be made a party to any threatened, pending or completed action, suit or proceeding whether civil, criminal, administrative or investigative (other than an action by or in the right of the corporation) by reason of the fact that he is or was a director, officer, employee or agent of the corporation, or is or was serving at the request of the corporation as a director, officer, employee or agent of another corporation, partnership, joint venture, trust or other enterprise, against expenses (including attorneys’ fees), judgments, fines and amounts paid in settlement actually and reasonably incurred by him in connection with such action, suit or proceeding if he acted in good faith and in a manner he reasonably believed to be in or not opposed to the best interests of the corporation, and, with respect to any criminal action or proceeding, had no reasonable cause to believe his conduct was unlawful. Section 145 further provides that a corporation similarly may indemnify any such person serving in any such capacity who was or is a party or is threatened to be made a party to any threatened, pending or completed action or suit by or in the right of the corporation to procure a judgment in its favor by reason of the fact that he is or was a director, officer, employee or agent of the corporation or is or was serving at the request of the corporation as a director, officer, employee or agent of another corporation, partnership, joint venture, trust or other enterprise, against expenses (including attorney’s fees) actually and reasonably incurred in connection with the defense or settlement of such action or suit if he acted in good faith and in a manner he reasonably believed to be in or not opposed to the best interests of the corporation and except that no indemnification shall be made in respect of any claim, issue or matter as to which such person shall have been adjudged to be liable to the corporation unless and only to the extent that the Delaware Court of Chancery or such other court in which such action or suit was brought shall determine upon application that, despite the adjudication of liability but in view of all of the circumstances of the case, such person is fairly and reasonably entitled to indemnity for such expenses which the Delaware Court of Chancery or such other court shall deem proper.
II-1
Table of Contents
The company’s by-laws provide for the indemnification of officers and directors of the company to the fullest extent permitted by law.
We also expect to obtain officers’ and directors’ liability insurance, which insures against liabilities that officers and directors of the registrant may, in such capacities, incur. Section 145(g) of the DGCL provides that a corporation shall have power to purchase and maintain insurance on behalf of any person who is or was a director, officer, employee or agent of the corporation, or is or was serving at the request of the corporation as a director, officer, employee or agent of another corporation, partnership, joint venture, trust or other enterprise against any liability asserted against such person and incurred by such person in any such capacity, or arising out of such person’s status as such, whether or not the corporation would have the power to indemnify such person against such liability under that section.
Section 145(f) of the DGCL provides that the indemnification and advancement of expenses provided by, or granted pursuant to, the other subsections of Section 145 of the DGCL shall not be deemed exclusive of any other rights to which those seeking indemnification or advancement of expenses may be entitled under any bylaw, agreement, vote of stockholders or disinterested directors or otherwise, both as to action in such person’s official capacity and as to action in another capacity while holding such office.
We expect to enter into indemnification agreements with each of our directors and officers. These agreements will require us to indemnify these individuals to the fullest extent permitted under Delaware law against liabilities that may arise by reason of their service to us, and to advance expenses incurred as a result of any proceeding against them as to which they could be indemnified.
Reference is made to the form of underwriting agreement to be filed as Exhibit 1.1 hereto for provisions providing that the underwriters are obligated under certain circumstances to indemnify our directors, officers and controlling persons against certain liabilities under the Securities Act.
| Item 15. | Recent Sales of Unregistered Securities. |
The registrant was formed on June 17, 2011 and, until the consummation of the Corporate Reorganization, will not have issued any securities, other than to MacDermid Holdings, LLC upon its formation. In connection with the offering of the securities being registered hereby, the registrant will issue an aggregate of shares of its common stock to MacDermid Holdings, LLC and the Savings Plan in connection with its corporate reorganization, as described in “The Corporate Reorganization”. This issuance will be made in reliance upon Section 4(a)(2) of the Securities Act, as amended, and will not involve any underwriters, underwriting discounts or commissions, or any public offering. The persons and entities who will receive such securities have represented their intention to acquire these securities for investment only and not with a view to or for sale in connection with any distribution thereof, and appropriate legends will be affixed to any share certificates issued. All recipients have adequate access through their relationship with us to information about us.
| Item 16. | Exhibits and Financial Statement Schedules. |
| Exhibit |
Description | |
| 1.1* | Form of Underwriting Agreement. | |
| 3.1** | Form of Restated Certificate of Incorporation of MacDermid Group, Inc. | |
| 3.2** | Form of Amended and Restated Bylaws of MacDermid Group, Inc. | |
| 4.1** | Specimen Common Stock certificate. | |
| 4.2** | Credit Agreement, dated as of April 12, 2007, among MacDermid Holdings, LLC, Matrix Acquisition Corp. and MacDermid, Incorporated (as successor to Matrix Acquisition Corp.), as borrower, certain subsidiaries of the borrower, the lenders party thereto, Credit Suisse, as administrative agent and collateral agent, Goldman Sachs Credit Partners L.P., as syndication agent, and CIBC World Markets Corp. and Bear Stearns & Co. Inc., as co-documentation agents. | |
II-2
Table of Contents
| Exhibit |
Description | |
| 4.3** | First Amendment to Credit Agreement, dated as of October 24, 2007, among, inter alia, MacDermid Holdings, LLC, Matrix Acquisition Corp., MacDermid, Incorporated (as successor to Matrix Acquisition Corp., the borrower), the lenders from time to time parties thereto and Credit Suisse, as administrative agent and collateral agent. | |
| 4.4** | Consent, Waiver and Amendment to Credit Agreement, dated as of July 28, 2008 to the Credit Agreement, among, inter alia, MacDermid Holdings, LLC, Matrix Acquisition Corp., and MacDermid, Incorporated (as successor to Matrix Acquisition Corp., the borrower), the lenders from time to time parties thereto and Credit Suisse, as administrative agent and as collateral agent. | |
| 4.5** | Pledge and Security Agreement made by MacDermid Holdings, LLC, Matrix Acquisition Corp. and MacDermid, Incorporated (as successor to Matrix Acquisition Corp.), and certain subsidiaries of MacDermid, Incorporated in favor of Credit Suisse, as collateral agent, dated as of April 12, 2007. | |
| 4.6** | Indenture, dated as of April 12, 2007, between Matrix Acquisition Corp., MacDermid, Incorporated, and certain subsidiaries of MacDermid, Incorporated and The Bank of New York as trustee for $350,000,000 of 9 1/2% Senior Subordinated Notes Due 2017, including Form of Note. | |
| 4.7** | Supplemental Indenture, dated as of April 12, 2007, among MacDermid, Incorporated, as successor to Matrix Acquisition Corp., the guaranteeing subsidiaries and The Bank of New York, as trustee under the indenture. | |
| 4.8** | Third Consent, Waiver and Amendment to Credit Agreement, dated as of November 29, 2011 to the Credit Agreement, among, inter alia, MacDermid Holdings, LLC, Matrix Acquisition Corp., and MacDermid, Incorporated (as successor to Matrix Acquisition Corp., the borrower), the lenders from time to time parties thereto and Credit Suisse, as administrative agent and as collateral agent. | |
| 4.9** | Fourth Amendment to the Credit Agreement, dated as of May 18, 2012, among, inter alia, MacDermid Holdings, LLC, Matrix Acquisition Corp., MacDermid, Incorporated (as successor to Matrix Acquisition Corp., the borrower), the subsidiaries of the borrower from time to time parties thereto, the lenders from time to time parties thereto and Credit Suisse AG, as administrative agent and as collateral agent. | |
| 5.1** | Form of Opinion of Cravath, Swaine & Moore LLP. | |
| 9.1* | Form of Securityholders’ Agreement by and among MacDermid Group, Inc., Court Square Capital Partners II, L.P., Court Square Capital Partners II-A, L.P., Court Square Capital Partners (Offshore) II, L.P., Court Square Co-Investors, Weston Presidio V, L.P., Daniel H. Leever, management investors, MacDermid Holdings, LLC and certain other persons. | |
| 10.1** | Severance Agreement Letter, dated as of May 23, 2011, between MacDermid, Incorporated and Daniel H. Leever. | |
| 10.2** | Severance Agreement Letter, dated as of January 7, 2003, between MacDermid, Incorporated and Frank J. Monteiro. | |
| 10.3** | Severance Agreement Letter, dated as of July 22, 2002, between MacDermid, Incorporated and John L. Cordani. | |
| 10.4** | Memorandum of Agreement, dated as of July 9, 2001, between MacDermid, Incorporated and John L. Cordani. | |
| 10.5** | MacDermid, Incorporated Profit Sharing and Employee Savings Plan (as amended and restated generally effective January 1, 2010). | |
| 10.6** | MacDermid, Incorporated Employees’ Pension Plan (as amended and restated generally effective January 1, 2009). | |
| 10.7** | MacDermid, Incorporated Supplemental Executive Retirement Plan, effective April 1, 1994, as amended on February 25, 2005. | |
II-3
Table of Contents
| Exhibit |
Description | |
| 10.8** | Amended and Restated Limited Liability Company Operating Agreement of MacDermid Holdings, LLC, a Delaware Limited Liability Company, dated as of April 12, 2007. | |
| 10.9** | First Amendment to Amended and Restated Limited Liability Company Operating Agreement of MacDermid Holdings, LLC, a Delaware Limited Liability Company, dated as of February 28, 2011. | |
| 10.10** | MacDermid Holdings LLC Equity Incentive Plan. | |
| 10.11** | Form of Award Agreement with respect to the MacDermid Holdings LLC Equity Incentive Plan. | |
| 10.12** | Advisory Agreement, entered into as of April 12, 2007 by and among MacDermid Holdings, LLC, all of the direct and indirect subsidiaries of MacDermid Holdings, LLC, CSC Manager, L.P., as advisor and Weston Presidio Service Company, LLC. | |
| 10.13** | Advisory Agreement, entered into as of April 12, 2007 by and among MacDermid Holdings, LLC, all of the direct and indirect subsidiaries of MacDermid Holdings, LLC, Weston Presidio Service Company, LLC, as advisor, and CSC Manager, L.P. | |
| 10.14** | Form of Director and Officer Indemnification Agreement. | |
| 10.15** | Amendment No. 1 to the 2010 Restatement of the MacDermid, Incorporated Profit Sharing and Employee Savings Plan, dated as of March 13, 2012. | |
| 10.16** | Form of Amendment No. 2 to the 2010 Restatement of the MacDermid, Incorporated Profit Sharing and Employee Savings Plan. | |
| 10.17** | Form of First Clarifying Amendment to the Amended and Restated Limited Liability Company Operating Agreement of MacDermid Holdings, LLC. | |
| 10.18** | Form of Contribution and Exchange Agreement by and among MacDermid, Incorporated, MacDermid Group, Inc., MacDermid Holdings, LLC and MacDermid, Incorporated Profit Sharing and Employee Savings Plan. | |
| 16.1** | Letter from Grant Thornton LLP, dated July 11, 2011, regarding change in certifying accountant. | |
| 16.2** | Letter from Grant Thornton LLP, dated August 26, 2011, regarding change in certifying accountant. | |
| 21.1** | Subsidiaries of the registrant. | |
| 23.1 | Consent of KPMG LLP. | |
| 23.2 | Consent of KPMG LLP. | |
| 23.3** | Consent of Cravath, Swaine & Moore LLP (form contained in Exhibit 5.1). | |
| 24.1** | Powers of Attorney (included in signature page to Registration Statement filed on July 11, 2011). | |
| 99.1** | Consent of T. Quinn Spitzer. | |
| * | To be filed by amendment. |
| ** | Previously filed |
| (b) | Financial Statement Schedules |
| Item 17. | Undertakings. |
The undersigned registrant hereby undertakes that:
| (1) | The undersigned will provide to the underwriters at the closing specified in the underwriting agreement certificates in such denominations and registered in such names as required by the underwriters to permit prompt delivery to each purchaser. |
| (2) | For purposes of determining any liability under the Securities Act of 1933, as amended, the information omitted from the form of prospectus filed as part of this registration statement in reliance upon Rule 430A and contained in a form of prospectus filed by the registrant pursuant to Rule 424(b)(1) or (4) or 497(h) under the Securities Act of 1933, as amended, shall be deemed to be part of this registration statement as of the time it was declared effective. |
II-4
Table of Contents
| (3) | For the purpose of determining any liability under the Securities Act of 1933, as amended, each post-effective amendment that contains a form of prospectus shall be deemed to be a new registration statement relating to the securities offered therein, and the offering of such securities at that time shall be deemed to be the initial bona fide offering thereof. |
Insofar as indemnification for liabilities arising under the Securities Act of 1933, as amended, may be permitted to directors, officers and controlling persons of the registrant pursuant to the foregoing provisions, or otherwise, the registrant has been advised that in the opinion of the SEC such indemnification is against public policy as expressed in the Securities Act of 1933, as amended, and is, therefore, unenforceable. In the event that a claim for indemnification against such liabilities (other than the payment by the registrant of expenses incurred or paid by a director, officer or controlling person of the registrant in the successful defense of any action, suit or proceeding) is asserted by such director, officer or controlling person in connection with the securities being registered, the registrant will, unless in the opinion of its counsel the matter has been settled by controlling precedent, submit to a court of appropriate jurisdiction the question whether such indemnification by it is against public policy as expressed in the Securities Act of 1933, as amended, and will be governed by the final adjudication of such issue.
II-5
Table of Contents
SIGNATURES
Pursuant to the requirements of the Securities Act of 1933, the registrant has duly caused this Amendment No. 8 to the Registration Statement to be signed on its behalf by the undersigned, thereunto duly authorized in the City of Denver, State of Colorado on the 22nd day of June, 2012.
| MACDERMID GROUP, INC. | ||
| By: |
/s/ Daniel H. Leever | |
| Name: | Daniel H. Leever | |
| Title: | Chief Executive Officer | |
| (Principal Executive Officer) | ||
Pursuant to the requirements of the Securities Act of 1933, this Amendment No. 8 to the Registration Statement has been signed by the following persons in the capacities indicated on the 22nd day of June, 2012.
| Signature |
Title | |
| /s/ Daniel H. Leever Daniel H. Leever |
Director and Chairman and Chief Executive Officer (Principal Executive Officer) | |
| /s/ Frank J. Monteiro Frank J. Monteiro |
Senior Vice President, Chief Financial Officer (Principal Financial and Accounting Officer) | |
| * Joseph M. Silvestri |
Director | |
| * Kevin D. Brown |
Director | |
| * David L. Ferguson |
Director | |
| * Michael F. Finley |
Director | |
| *By: | /s/ Daniel H. Leever | |
| Name: |
Daniel H. Leever | |
| Title: |
Attorney-in-Fact | |
II-6
Table of Contents
EXHIBIT INDEX
| Exhibit |
Description | |
| 1.1* | Form of Underwriting Agreement. | |
| 3.1** | Form of Restated Certificate of Incorporation of MacDermid Group, Inc. | |
| 3.2** | Form of Amended and Restated Bylaws of MacDermid Group, Inc. | |
| 4.1** | Specimen Common Stock certificate. | |
| 4.2** | Credit Agreement, dated as of April 12, 2007, among MacDermid Holdings, LLC, Matrix Acquisition Corp. and MacDermid, Incorporated (as successor to Matrix Acquisition Corp.), as borrower, certain subsidiaries of the borrower, the lenders party thereto, Credit Suisse, as administrative agent and collateral agent, Goldman Sachs Credit Partners L.P., as syndication agent, and CIBC World Markets Corp. and Bear Stearns & Co. Inc., as co-documentation agents. | |
| 4.3** | First Amendment to Credit Agreement, dated as of October 24, 2007, among, inter alia, MacDermid Holdings, LLC, Matrix Acquisition Corp., MacDermid, Incorporated (as successor to Matrix Acquisition Corp., the borrower), the lenders from time to time parties thereto and Credit Suisse, as administrative agent and collateral agent. | |
| 4.4** | Consent, Waiver and Amendment to Credit Agreement, dated as of July 28, 2008 to the Credit Agreement, among, inter alia, MacDermid Holdings, LLC, Matrix Acquisition Corp., and MacDermid, Incorporated (as successor to Matrix Acquisition Corp., the borrower), the lenders from time to time parties thereto and Credit Suisse, as administrative agent and as collateral agent. | |
| 4.5** | Pledge and Security Agreement made by MacDermid Holdings, LLC, Matrix Acquisition Corp. and MacDermid, Incorporated (as successor to Matrix Acquisition Corp.), and certain subsidiaries of MacDermid, Incorporated in favor of Credit Suisse, as collateral agent, dated as of April 12, 2007. | |
| 4.6** | Indenture, dated as of April 12, 2007, between Matrix Acquisition Corp., MacDermid, Incorporated, and certain subsidiaries of MacDermid, Incorporated and The Bank of New York as trustee for $350,000,000 of 9 1/2% Senior Subordinated Notes Due 2017, including Form of Note. | |
| 4.7** | Supplemental Indenture, dated as of April 12, 2007, among MacDermid, Incorporated, as successor to Matrix Acquisition Corp., the guaranteeing subsidiaries and The Bank of New York, as trustee under the indenture. | |
| 4.8** | Third Consent, Waiver and Amendment to Credit Agreement, dated as of November 29, 2011 to the Credit Agreement, among, inter alia, MacDermid Holdings, LLC, Matrix Acquisition Corp., and MacDermid, Incorporated (as successor to Matrix Acquisition Corp., the borrower), the lenders from time to time parties thereto and Credit Suisse, as administrative agent and as collateral agent. | |
| 4.9** | Fourth Amendment to the Credit Agreement, dated as of May 18, 2012, among, inter alia, MacDermid Holdings, LLC, Matrix Acquisition Corp., MacDermid, Incorporated (as successor to Matrix Acquisition Corp., the borrower), the subsidiaries of the borrower from time to time parties thereto, the lenders from time to time parties thereto and Credit Suisse AG, as administrative agent and as collateral agent. | |
| 5.1** | Form of Opinion of Cravath, Swaine & Moore LLP. | |
| 9.1* | Form of Securityholders’ Agreement by and among MacDermid Group, Inc., Court Square Capital Partners II, L.P., Court Square Capital Partners II-A, L.P., Court Square Capital Partners (Offshore) II, L.P., Court Square Co-Investors, Weston Presidio V, L.P., Daniel H. Leever, management investors, MacDermid Holdings, LLC and certain other persons. | |
| 10.1** | Severance Agreement Letter, dated as of May 23, 2011, between MacDermid, Incorporated and Daniel H. Leever. | |
| 10.2** | Severance Agreement Letter, dated as of January 7, 2003, between MacDermid, Incorporated and Frank J. Monteiro. | |
Table of Contents
| Exhibit |
Description | |
| 10.3** | Severance Agreement Letter, dated as of July 22, 2002, between MacDermid, Incorporated and John L. Cordani. | |
| 10.4** | Memorandum of Agreement, dated as of July 9, 2001, between MacDermid, Incorporated and John L. Cordani. | |
| 10.5** | MacDermid, Incorporated Profit Sharing and Employee Savings Plan (as amended and restated generally effective January 1, 2010). | |
| 10.6** | MacDermid, Incorporated Employees’ Pension Plan (as amended and restated generally effective January 1, 2009). | |
| 10.7** | MacDermid, Incorporated Supplemental Executive Retirement Plan, effective April 1, 1994, as amended on February 25, 2005. | |
| 10.8** | Amended and Restated Limited Liability Company Operating Agreement of MacDermid Holdings, LLC, a Delaware Limited Liability Company, dated as of April 12, 2007. | |
| 10.9** | First Amendment to Amended and Restated Limited Liability Company Operating Agreement of MacDermid Holdings, LLC, a Delaware Limited Liability Company, dated as of February 28, 2011. | |
| 10.10** | MacDermid Holdings LLC Equity Incentive Plan. | |
| 10.11** | Form of Award Agreement with respect to the MacDermid Holdings LLC Equity Incentive Plan. | |
| 10.12** | Advisory Agreement, entered into as of April 12, 2007 by and among MacDermid Holdings, LLC, all of the direct and indirect subsidiaries of MacDermid Holdings, LLC, CSC Manager, L.P., as advisor and Weston Presidio Service Company, LLC. | |
| 10.13** | Advisory Agreement, entered into as of April 12, 2007 by and among MacDermid Holdings, LLC, all of the direct and indirect subsidiaries of MacDermid Holdings, LLC, Weston Presidio Service Company, LLC, as advisor, and CSC Manager, L.P. | |
| 10.14** | Form of Director and Officer Indemnification Agreement. | |
| 10.15** | Amendment No. 1 to the 2010 Restatement of the MacDermid, Incorporated Profit Sharing and Employee Savings Plan, dated as of March 13, 2012. | |
| 10.16** | Form of Amendment No. 2 to the 2010 Restatement of the MacDermid, Incorporated Profit Sharing and Employee Savings Plan. | |
| 10.17** | Form of First Clarifying Amendment to the Amended and Restated Limited Liability Company Operating Agreement of MacDermid Holdings, LLC. | |
| 10.18** | Form of Contribution and Exchange Agreement by and among MacDermid, Incorporated, MacDermid Group, Inc., MacDermid Holdings, LLC and MacDermid, Incorporated Profit Sharing and Employee Savings Plan. | |
| 16.1** | Letter from Grant Thornton LLP, dated July 11, 2011, regarding change in certifying accountant. | |
| 16.2** | Letter from Grant Thornton LLP, dated August 26, 2011, regarding change in certifying accountant. | |
| 21.1** | Subsidiaries of the registrant. | |
| 23.1 | Consent of KPMG LLP. | |
| 23.2 | Consent of KPMG LLP. | |
| 23.3** | Consent of Cravath, Swaine & Moore LLP (form contained in Exhibit 5.1). | |
| 24.1** | Powers of Attorney (included in signature page to Registration Statement filed on July 11, 2011). | |
| 99.1** | Consent of T. Quinn Spitzer. | |
| * | To be filed by amendment. |
| ** | Previously filed |