Attached files
| file | filename |
|---|---|
| EX-10.1 - EXHIBIT 10-32 - LML PAYMENT SYSTEMS INC | exh10_32.htm |
| EX-21.1 - EXHIBIT 21 - LML PAYMENT SYSTEMS INC | exh21.htm |
| EX-32.1 - EXHIBIT 32-1 - LML PAYMENT SYSTEMS INC | exh32_1.htm |
| EX-31.2 - EXHIBIT 31-2 - LML PAYMENT SYSTEMS INC | exh31_2.htm |
| EX-23.1 - EXHIBIT 23-1 - LML PAYMENT SYSTEMS INC | exh23_1.htm |
| EX-31.1 - EXHIBIT 31-1 - LML PAYMENT SYSTEMS INC | exh31_1.htm |
| EX-10.2 - EXHIBIT 10-33 - LML PAYMENT SYSTEMS INC | exh10_33.htm |
UNITED STATES SECURITIES AND EXCHANGE COMMISSION
Washington, D.C. 20549
Form 10-K
|
[X]
|
ANNUAL REPORT PURSUANT TO SECTION 13 OR 15(d) OF THE SECURITIES EXCHANGE ACT OF 1934
|
For the Fiscal Year Ended March 31, 2012
OR
|
[ ]
|
TRANSITION REPORT PURSUANT TO SECTION 13 OR 15(d) OF THE SECURITIES EXCHANGE ACT OF 1934
|
For the Transition Period from ________ to ________
Commission File Number: 0-13959
LML PAYMENT SYSTEMS INC.
(Exact name of registrant as specified in its charter)
|
Yukon Territory
|
###-##-####
|
|
|
(State or other jurisdiction of incorporation or organization)
|
(I.R.S. Employer Identification No.)
|
|
|
1680-1140 West Pender Street
Vancouver, British Columbia Canada
|
V6E 4G1
|
|
|
(Address of principal executive offices)
|
(Zip Code)
|
Registrant’s Telephone Number, Including Area Code: (604) 689-4440
Securities registered pursuant to Section 12(b) of the Act:
|
Title of Each Class
|
Name of Each Exchange on Which Registered
|
|
|
Common Stock, without par value
|
The NASDAQ Capital Market
|
Securities registered pursuant to Section 12(g) of the Act:
None
(Title of each class)
Indicate by check mark if the registrant is a well-known seasoned issuer, as defined in Rule 405 of the Securities Act. Yes [ ] No [X]
Indicate by check mark if the registrant is not required to file reports pursuant to Section 13 or Section 15(d) of the Act. Yes [ ] No [X]
Indicate by check mark whether the registrant (1) has filed all reports required to be filed by Section 13 or 15(d) of the Securities Exchange Act of 1934 during the preceding 12 months (or for such shorter period that the registrant was required to file such reports), and (2) has been subject to such filing requirements for the past 90 days. Yes [X] No [ ]
Indicate by check mark whether the registrant has submitted electronically and posted on its corporate Web site, if any, every Interactive Data File required to be submitted and posted pursuant to Rule 405 of Regulation S-T during the preceding 12 months (or for such shorter period that the registrant was required to submit and post such files).Yes [ ] No [X] (not applicable to the registrant)
Indicate by check mark if disclosure of delinquent filers pursuant to Item 405 of Regulation S-K is not contained herein, and will not be contained, to the best of Registrant's knowledge, in definitive proxy or information statements incorporated by reference in Part III of this Form 10-K or any amendment to this Form 10-K. [X]
Indicate by check mark whether the registrant is a large accelerated filer, an accelerated filer, a non-accelerated filer or a smaller reporting company. See the definitions of “large accelerated filer”, “accelerated filer”, “non-accelerated filer” and “smaller reporting company” in rule 12b-2 of the Exchange Act.
|
Large Accelerated Filed
|
[ ]
|
Accelerated Filer
|
[ ]
|
Non-Accelerated Filer
|
[ ]
|
Smaller Reporting Company
|
[X]
|
|
|
(Do not check if a smaller reporting company)
|
||||||||
Indicate by check mark whether the registrant is a shell company (as defined in Rule 12b-2 of the Exchange Act). Yes [ ] No [X]
As of September 30, 2011, the last business day of the registrant's most recently completed second fiscal quarter, the aggregate market value of the Common Stock of the registrant held by non-affiliates based upon the closing sale price of the Common Stock on such date as reported on the NASDAQ Capital Market was approximately $37.6 million.
As of June 15, 2012, the Registrant had 28,246,684 shares of Common Stock outstanding.
DOCUMENTS INCORPORATED BY REFERENCE
Portions of the registrant’s proxy statement for its 2012 Annual Meeting of Shareholders, which will be filed with the Commission within 120 days after the end of the registrant’s fiscal year ended March 31, 2012, are incorporated by reference into Part III of this Annual Report on Form 10-K.
LML PAYMENT SYSTEMS INC.
2012 FORM 10-K ANNUAL REPORT
TABLE OF CONTENTS
|
Page
|
||
|
PART I
|
||
|
Item 1.
|
1
|
|
|
Item 1A.
|
7
|
|
|
Item 1B.
|
18
|
|
|
Item 2.
|
18
|
|
|
Item 3.
|
18
|
|
|
Item 4.
|
20
|
|
|
PART II
|
||
|
Item 5.
|
21
|
|
|
Item 6.
|
24
|
|
|
Item 7.
|
25
|
|
|
Item 7A.
|
40
|
|
|
Item 8.
|
41
|
|
|
Item 9.
|
41
|
|
|
Item 9A.
|
41
|
|
|
Item 9B.
|
42
|
|
|
PART III
|
||
|
Item 10.
|
43
|
|
|
Item 11.
|
43
|
|
|
Item 12.
|
43
|
|
|
Item 13.
|
43
|
|
|
Item 14.
|
43
|
|
|
PART IV
|
||
|
Item 15.
|
44
|
|
|
48
|
||
PART I
|
ITEM 1.
|
Business
|
Unless the context otherwise requires, references in this report on Form 10-K to the “Company”, “LML,” “we,” “us” or “our” refer to LML Payment Systems Inc. and its direct and indirect subsidiaries. LML Payment Systems Inc.’s subsidiaries are Beanstream Internet Commerce Inc.(“Beanstream”), LML Corp. and Legacy Promotions Inc.. LML Corp.’s subsidiaries are LML Patent Corp., LML Payment Systems Corp. and Beanstream Internet Commerce Corp. Unless otherwise specified herein, all references herein to “$” are to United States (“U.S.”) Dollars. From time to time the Company has made and may continue to make written or oral “forward-looking statements” including those contained in this Annual Report on Form 10-K. These forward-looking statements represent the Company’s present expectations or beliefs concerning future events. The Company cautions that such statements are qualified by important factors that could cause actual results to differ materially from those in the forward-looking statements including those factors identified below in Item 1A – “Risk Factors”.
Overview
We are a leading provider of payment processing solutions including electronic payment processing, risk management and authentication services, primarily to businesses and organizations that use the Internet to receive or send payments.
We link merchants selling products or services to customers wanting to buy them and financial institutions who allow the transfer of payments to occur. We have partnership arrangements and certified connections to financial institutions, payment processors and other payment service providers in order to enable our customers to safely and reliably accept or make payments electronically primarily using the Internet. We provide electronic payment, authentication and risk management services to over 13,000 businesses and organizations in Canada and the United States.
We operate three separate lines of business: transaction payment processing, intellectual property licensing and check processing. Our transaction payment processing services consist predominantly of Internet-based services, while our check processing services involve predominantly traditional and electronic check processing and recovery services that do not utilize the Internet. While we have historically generated significant amounts of non-recurring revenue associated with our intellectual property licensing initiatives, our transaction payment processing services are (and are expected to be for the foreseeable future) our principal line of business, while our other lines of business (including our electronic check processing services and intellectual property licensing initiatives) are less significant to the financial performance of our company. See “Item 7 – Management’s Discussion and Analysis of Financial Condition and Results of Operations -- Overview” and Note 17 to our Consolidated Financial Statements included in this report.
Our headquarters are located at Suite 1680, 1140 West Pender Street, Vancouver, British Columbia, Canada and we have office locations in Victoria, British Columbia in Canada and Wichita, Kansas in the United States.
Transaction Payment Processing (“TPP”) Operations
Products and Services
Our TPP services link merchants selling products or services to customers wanting to buy them and financial institutions who allow the transfer of payments to occur. We have partnership arrangements and certified connections to financial institutions, payment processors and other payment service providers in order to enable our customers to safely and reliably accept or make payments electronically primarily using the Internet. We provide our electronic payment, authentication and risk management services to over 13,000 businesses and organizations in Canada and the United States.
Our payment services allow our customers to accept or process a wide array of payments including credit cards, debit cards, electronic fund transfers and Automated Clearing House (“ACH”) transactions. We process Mastercard, VISA, American Express, Diners, JCB, and Discover cards on behalf of the majority of Canadian and American merchant account acquirers. We also offer leading risk management solutions to both online and brick and mortar customers who wish to use the Internet as a cost effective means of communicating with their own bank or credit reporting agency.
Our TPP customers range in size from small, sole proprietorships to large corporations. However, most of our transaction payment processing business comes from services we provide to small to medium size firms. We support this market in three separate ways: first by providing services that can be integrated to a customer’s website or financial platform through software plug-ins and application programming interfaces (API’s); second, by providing hosted services where we can provide a turn-key e-Commerce website for a merchant; and third, by having our transaction payment processing services integrated directly into third party software solutions. In each instance, our products and services are designed to provide this market segment with bundled payment, risk management, authentication, shopping cart products, reporting forms and other value-added services that allow our customers to sell goods and services and receive payment in an efficient and secure manner.
Our customers include both online merchants and brick and mortar merchants, including government and financial institutions. We provide electronic payment and risk management solutions for brick and mortar retailers and mail-order and telephone-order call-centers (“MOTO”) that allow these businesses to streamline payment processing. Our payment services can be integrated into a customer’s accounting or financial system, thereby reducing administrative costs and removing some of the complexity of a paper-based environment.
We provide solutions for e-merchants where we integrate our services to the website of the e-merchant and their shopping cart or application software provider, which allows e-merchants to accept credit card and debit card payments, electronic funds transfers (EFT) and ACH payments. Our payment solutions have been integrated into many shopping cart and application service providers who integrate our payment services into their own products in order to provide their customers secure access to financial payment networks. Our payment products support both Canadian and U.S. dollar settlement and are available in both French and English.
Our hosted solutions offered to customers include a connection between the merchant’s website and our host system that provides the merchant with a shopping cart with secure payment processing for credit cards and debit cards, EFT and ACH payments, a secure order management interface, multi-currency options, multiple shipping options and sophisticated reporting and reconciliation tools. All required forms and images are hosted on our servers and are secured using secured socket layer (SSL) encryption. We operate equipment in three separate data centers to provide greater reliability to our merchants and customers.
In addition, we provide a robust selection of authentication tools for merchants to reduce the risk inherent in card-not-present credit card transactions. Our merchants are entitled to the fraud protection services offered by the card associations such as Mastercard’s Securecode and Verified by Visa in addition to our own risk-management tools and applications. We also provide additional easy to use authentication services that provide our merchants with information that ranges from the validation of credit card orders to the fraud screening of applications by consumers. Our authentication services allow certification of addresses and telephone numbers and can identify addresses that have been known to be used as mail drops, and high risk postal codes. Our highest level of authentication involves the consumer providing answers to “out-of-wallet” questions as part of the transaction process (“out-of-wallet” questions, such as questions about places someone has lived, cars they have owned or people that they know, refer to questions based on information that cannot be found in a wallet or a purse making it difficult for anyone other than the actual person to know the answer). Finally, we supply merchants with a variety of risk management tools that, when combined with our cardholder authentication services, provide leading class functionality in the battle against payments fraud.
e-Commerce Market
Statistics from both the United States Department of Commerce and Statistics Canada give clear indications of the steady increase in the growth of e-Commerce in both the U.S. and Canada since 2001. In addition, market research in the payments industry is showing strong indications of continued growth in electronic commerce.
In September 2011, Statistics Canada released the results of the 2010 Canadian Internet Use Survey, reporting that Canadians purchased goods and services over the Internet valued at approximately $15.3 billion in 2010. Statistics Canada also reported that 51% of Canadian Internet users used the Internet to place orders for goods or services. Moreover, the number of orders they placed increased from 95 million in 2009 to over 113 million orders in 2010, clearly indicating that Canadian commerce is moving online.
On February 16, 2012, the United States Department of Commerce reported that online retail sales in the United States grew by an estimated 16.1% to $194.3 billion in 2011 compared to 2010, while total retail sales increased by just 7.9% over the same period. In addition, estimates released by the Department of Commerce on May 17, 2012 for the first quarter of 2012 show online retail sales increased approximately 15.4% from the first quarter of 2011 while total retail sales increased 6.5% in the same period. It was also reported that online retail sales now comprise approximately 4.9% of total retail sales.
According to Forrester Research, a leading global research and advisory firm, online shopping in the United States are expected to reach $327 billion in 2016, up 45% from the projected $226 billion in online spending in 2012. Furthermore, online retail sales are expected to account for 9% of total retail sales in 2016, up from a projected 7% in 2012. Forrester also forecasts steady growth in the number of online shoppers, reporting that approximately 192 million U.S. consumers are expected to shop online in 2016, up 15% from the expected 167 million online shoppers in 2012. One of the key factors driving ecommerce growth is the average amount U.S. consumers will spend online which is expected to increase from an average of approximately $1,207 in 2012 to an average of approximately $1,738 in 2016 – a 44% increase.
We believe that the electronic payments and e-Commerce markets will continue to grow as more and more businesses decide to sell products or make payments electronically over the Internet.
Technology and Data Centers
We operate a transaction processing platform that is designed for reliability, scalability and security. We operate equipment at three separate data centers, one in each of Victoria, B.C., Saanich, B.C. and Toronto, Ontario. These secure data centers contain the technology necessary to provide our services to merchants over the Internet and to our financial institutions and payment processing partners. Our data centers contain our enterprise servers, network firewalls, routers and other technology we use to provide services to our merchants and partners. Our processing software is certified to process financial transactions with a majority of Canadian and US merchant acquirers, which allows us to act as a single point of integration and point of contact for our customers and the customers of our channel partners and the financial payments network.
Our systems are monitored 24 hours per day, 7 days per week, 365 days per year. We are also certified as a level 1 service provider under the Payment Card Industry (PCI) Data Security Standard (DSS) which is a comprehensive set of requirements for enhancing payment account data security that was developed by the PCI Security Standards Council including American Express, Discover Financial Services, JCB International, Mastercard Worldwide and VISA Inc., to help facilitate the broad adoption of consistent data security measures.
Sales and Marketing
Our products and services are primarily sold indirectly through both channel and technology partners, directly through our website and directly by an internal sales staff of five people.
We obtain new business as a result of our relationships with channel partners and our own internal marketing efforts. These channel partners can be payment processors, financial institutions, independent sales organizations or software application vendors who, in many cases, may provide a value-added service to our merchants. We typically pay either a referral fee or commission or residual fee for each merchant referred to us by our channel partners. We rely on the success of our more than 800 channel partners for new sales.
Competitive Strengths
We believe our competitive strengths in our TPP operations include:
|
·
|
Single Proprietary and Payments Technology Platform
|
We operate a single proprietary, scalable payments technology platform that provides our merchant clients with differentiated multi-payment processing solutions while also providing us with significant operational leverage benefits.
|
·
|
Comprehensive Suite of Services
|
We currently offer a broad suite of payment processing and value-added services that allow our merchant clients to address their payment needs using a single payments technology provider. Our services include merchant account acquisition and a wide range of innovative gateway value-added services such as dynamic transaction reporting, security and authentication features such CAV, SafeScan, eID verifier, tokenization, risk scoring and multi-currency products allowing merchant clients to sell products safely and securely in over 200 countries world-wide. We have also developed industry specific solutions that alone, or in combination with proprietary services, contain features and functionality to meet specific requirements of various industry verticals such as subscription based businesses, governments, e-commerce and mobile.
|
·
|
Easy Merchant Client Access to Payment Platform
|
Small and mid-size merchants are able to easily access our payment platform. Payment services can be integrated to a merchant customer’s website or financial platform through software plug-ins and API’s. Hosted turnkey payment services where small merchants are provided with a complete e-commerce website and our transaction payment services can be integrated directly into third-party software solutions.
|
·
|
Industry Leading Customer Service
|
Knowing that good customer service is the life blood of any business, we currently offer industry leading customer service levels. We staff our own bilingual (French and English) customer support center and provide direct inbound access to highly qualified and trained customer service representatives who are fully capable of handling technical and non-technical inquiries. Our customer service desk is staffed by 12 people. Emergency support is available 24 hours a day, 7 days a week. Over 95% of our incoming calls are answered within 30 seconds by a live operator who in most cases can address a question immediately.
|
·
|
Diverse Distribution Channels
|
We sell our payment solutions and services to merchant clients of all types through diverse distribution channels. Our direct channel includes an in-house sales force that targets regional and national merchants. Our indirect channel is highly diverse and includes relationships with a broad range of technology/value-added resellers who target merchant clients with an integrated offering. We have arrangements with financial institutions and other payment processors who we partner with and who then sell our integrated payment solutions. We provide customized white label services and solutions that are hosted on our payment platform but are marketed and sold under our partners’ (usually financial institutions) brand. We also integrate our payment services with other third-party software providers who include payment processing services with their core products.
Competition
The market for our TPP products and services is highly competitive and is characterized by rapidly changing technology, changing industry standards, merchant requirements, pricing competition and rapid rates of product obsolescence. Our competitors include other payment gateways, merchant acquirers, payment processors, technology service providers, Internet commerce providers and financial institutions. In Canada, our primary competition is Moneris and Paymentech. In the U.S. market we compete against other third party processors and gateways such as Cybersource, Authorize.net, and Verisign/Paypal.
We believe we compete on certain factors including:
|
·
|
Customer service
|
|
·
|
Features and functionality
|
|
·
|
Strategic partnerships and channel partners
|
|
·
|
Ease of product integration for customers
|
|
·
|
Broad range of certified connections to financial institutions and payment processors
|
We believe that we compete favorably with respect to these factors, however we believe that part of our success will be our ability to successfully market existing services. We operate in a market that is rapidly changing and we may not be able to successfully compete against current or future competitors. Many of our competitors have greater technical, financial and marketing resources than us and, as a result, may be able to respond more quickly to changes in technology, industry standards and merchant requirements or may be able to devote greater resources to product development and marketing than us. There can be no assurance that our current services will not become obsolete or that we will have the financial, technical and marketing resources and support facilities to compete successfully in the future. Our failure to compete favorably could materially and adversely affect our business, results of operations and financial condition.
Strategy
Growing our TPP business in the future requires us to continue to execute on the following key strategies:
|
·
|
Increase Client Base
|
One of our key growth strategies is to increase our small to mid-size merchant client base. Currently we have over 13,000 merchant clients who are predominantly small in nature as opposed to having a national presence. We believe that leveraging cost efficient, value-added services is expected to lead to high merchant retention rates. In addition, margin opportunities provided by this merchant client segment generally provide more profit on a per transaction basis than do larger merchants.
|
·
|
Develop New Services
|
In addition to increasing the number of merchant clients we serve, our growth strategy also includes increasing the level of business we conduct with our existing clients. We plan to implement this growth strategy by leveraging our single payments technology platform and industry knowledge, emerging payment trends and third-party partnerships that address evolving merchant customer demands in order to provide new products and services as has been recently the case with our new security, multi-currency and mobile applications and services.
|
·
|
Broaden And Deepen Distribution Channels
|
We also plan to broaden and deepen both our direct and indirect distribution channels to reach new merchant clients and to introduce new services to existing merchant clients. We plan to grow indirect channels through new partner and referral arrangements with third-party technology providers, payment processors and financial institutions.
|
·
|
Expand Into High Growth Segments And Verticals
|
As part of our growth strategy, we plan to concentrate on expanding further into high growth payment segments such as online businesses, e-commerce, mobile, information provision solutions and industry verticals such as business-to-business, healthcare and government.
|
·
|
Enter New Geographic Markets
|
By leveraging our payments technology platform and our comprehensive suite of payment services, third-party technology partners and financial institutions, we plan to expand our direct and indirect distribution channels to additional geographic regions.
Intellectual Property Licensing (“IPL”) Operations
Our IPL segment operations involve licensing our intellectual property estate, which includes U.S. patent nos. 5,484,988, 6,164,528, 6,283,366, 6,354,491, and RE40,220, all of which describe methods and systems for processing checks electronically. Moreover, our patent estate addresses, among other issues, the electronic submission and approval of transactions through a centralized database and authorization system, electronic debiting of consumer bank accounts and electronic crediting of designated merchant accounts in real-time or off-line modes using the facilities of the ACH Network or any competing network.
Licenses to our intellectual property estate are generally provided to clients based on usage of the technology embodied in the patent(s) being licensed. Some licensees pay ‘running royalties,’ which is a pay-as-you-go model, and other licensees pay a ‘one-time,’ fully paid-up royalty amount, also based on usage. Clients’ usage pertaining to these one-time, fully paid-up licenses is contractually determined and in some cases, in order to determine usage and to facilitate the negotiation of a license agreement, the commencement of litigation and the discovery process inherent therein (to determine usage), is employed. These one-time, fully paid-up licenses are also non-exclusive, similar to the non-exclusive nature of many software licensing arrangements treated as product sales, and the consideration is fixed and non-refundable with no trailing royalties or other variable consideration. In addition, these licenses do not contain refund, return or cancellation rights, nor continuing performance obligations and no when-and-if available deliverables are required to be provided by us. During the fiscal year ended March 31, 2012, we entered into six settlement and license agreements with respect to litigation we brought against multiple defendants in 2008 and 2009 (see Item 3 – Legal Proceedings), all of which involved non-recurring, one-time payments for fully paid-up licenses.
We rely upon a combination of patent, trademark, copyright, trade secret law and contractual provisions to establish and protect our proprietary rights in our trademarks, software and inventions. Our success will depend, in part, on our ability to protect and enforce intellectual property protection for the technology contained in our patents and trademarks. To protect and maximize the value of our patent estate, we have in the past, and expect to in the future, filed patent litigation against third parties that we believe are infringing our patents. In addition, we intend to continue to file additional patent applications to expand our intellectual property estate, seeking coverage of our developments in our business areas. There can be no assurance that these protections will be adequate to deter misappropriation of our technologies or independent third-party development of similar technologies.
Although we do not believe that our technology, products or services infringe the patent rights of others, we have in the past been accused of infringing the patent rights of others. There can be no assurance that infringement claims will not be made against us in the future or that the validity or enforceability of any patent issued to us will be sustained if judicially tested in a court of law or reexamined by the United States Patent and Trademark Office. The cost of both prosecuting a claim of infringement against others and defending a patent infringement claim may be substantial and there can be no assurance that we will have the resources necessary to successfully prosecute or defend a patent infringement claim. See “Item 3 – Legal Proceedings.”
Check Processing (“CP”) Operations
Our CP segment operations involve primary and secondary check collection services including electronic check re-presentment (RCK) and return check management such as traditional and electronic recovery services to retail clients. When we provide return check management services, we typically receive revenue when we are successful at recovering the principal amount of the original transaction on behalf of the client. In some instances we also earn a percentage of the principal amount and in other instances our secondary recovery services provide for us to earn additional fees when legal action is required. Our check processing services are provided in the United States and are operated from our Wichita, Kansas location.
Regulatory Matters
Various aspects of our lines of business are either subject to or may be affected by current and future governmental and other regulations in many different jurisdictions. The rules, regulations, policies and procedures affecting our business are constantly subject to change. See Item 1A. “Risk Factors – We and our clients must comply with complex and changing laws and regulations.”
The products and services that we provide to clients are subject to privacy legislation (including the Gramm-Leach-Bliley Act and regulations thereunder and the Personal Information Protection and Electronic Documents Act in Canada) as well as provincial and state laws relating to our ability to collect, monitor and disseminate information subject to privacy protection. In addition, certain of our services may be subject to the Dodd-Frank Wall Street Reform and Consumer Protection Act, and certain of our services in Canada may be subject to federal legislation called the Proceeds of Crime and Terrorist Financing Act. We also comply on a voluntary basis with the Code of Conduct for the Credit and Debit Card Industry in Canada
Certain check collection and electronic check re-presentment services that we provide in the U.S. are governed by the Federal Fair Debt Collection Practices Act and the Federal Fair Credit Reporting Act and other similar state laws. Electronic check re-presentment transactions are subject to applicable National Automated Clearing House Association (“NACHA”) Operating Rules, and applicable Uniform Commercial Code statutes. Our electronic check re-presentment transactions currently utilize the facilities of the Automated Clearing House Network and therefore are governed by and subject to NACHA Operating Rules and Regulation E. We use commercially reasonable efforts to oversee compliance with the requirements of these acts and regulations.
Corporate History
We were originally incorporated under the laws of the Province of British Columbia, Canada, as a “specially limited company” on January 24, 1974. In October 1997, after receipt of shareholder approval, our directors elected to change our governing corporate jurisdiction to the Yukon Territory, which change became effective in November 1997. Under the Yukon Business Corporations Act, we are a corporation that enjoys limited liability for its shareholders, is governed by its Board of Directors and generally has the powers and capacity attributable to a corporation.
Employees
There exists competition for personnel in the financial payment processing industry. We believe that our future success will depend in part on our continued ability to hire and retain qualified personnel. There can be no assurance that we will be successful in attracting and retaining a sufficient number of qualified employees to conduct our business in the future. As of March 31, 2012, we had 64 full-time employees including 5 employees in sales and marketing and 18 employees in administration and finance. We also employ consultants to perform services for us from time to time.
Business Concentration
During the fiscal year ended March 31, 2012, we earned revenue from three licensees resulting from settlement and license agreements amounting to approximately 36% of total revenue. Because this revenue is non-recurring, we do not believe that we are economically dependent on future revenue from these licensees. See “Part I, Item 3 – Legal Proceedings” and “Part II, Item 7 – Management’s Discussion and Analysis of Financial Condition and Results of Operations”.
Available Information
We maintain investor relations pages on our Internet website at http://www.lmlpayment.com. On these pages, we make available our annual, quarterly and other current reports filed or furnished with the SEC as soon as practicable. These reports may be reviewed or downloaded free of charge. Alternatively, if you would like a paper copy of any such SEC report (without exhibits) or document, write to the Corporate Secretary, LML Payment Systems Inc., Suite 1680, 1140 West Pender Street, Vancouver, BC V6E 4G1, and a copy of such requested document will be provided to you, free of charge.
|
Risk Factors
|
Introduction
In addition to the normal risks of business, we are subject to significant risks and uncertainties, including those listed below and others described elsewhere in this Annual Report on Form 10-K. Any of the risks described herein could result in a significant adverse effect on our results of operations and financial condition and could cause our actual results of operations to differ materially from the results contemplated by the forward-looking statements contained in this report.
We could be subject to liability as a result of security breaches, service interruptions by cyber terrorists or fraudulent or illegal use of our services.
Because some of our operating activities involve the storage and transmission of confidential personal or proprietary information, such as credit card numbers and bank account numbers, and because we are a link in the chain of e-Commerce, we are vulnerable to internal and external security breaches, service interruptions and third-party and employee fraud schemes that could damage our reputation and expose us to a risk of loss or litigation and monetary damages. Our payment services may be susceptible to credit card and other payment fraud schemes, including unauthorized use of credit cards, debit cards or bank account information, identity theft or merchant fraud. We expect that technically sophisticated criminals will continue to attempt to circumvent our anti-fraud systems. If such fraud schemes are successful or otherwise cause merchants, customers or partners to lose confidence in our services in particular, or in Internet systems generally, our business could be materially adversely affected.
Although we generally require that our agreements with our service providers who have access to merchant and customer data include confidentiality obligations that restrict these parties from using or disclosing any customer or merchant data except as necessary to perform their services under the applicable agreements, there can be no assurance that these contractual measures will prevent the unauthorized use or disclosure of data. In addition, our business may also be susceptible to potentially illegal or improper uses. These uses may include illegal online gambling, fraudulent sales of goods or services, illicit sales of prescription medications or controlled substances, software and other intellectual property piracy, money laundering, bank fraud, child pornography trafficking, prohibited sales of alcoholic beverages and tobacco products and online securities fraud. Despite measures we have taken to detect and lessen the risk of this kind of conduct, there can be no assurance that these measures will succeed.
We have been certified as and believe we are compliant with the Payment Card Industry’s (PCI) Security Standard which incorporates Visa’s Cardholder Information Security Program (CISP) and MasterCard’s Site Data Protection (SDP) standard. However, there is no guarantee that we will maintain such compliance or that compliance will prevent illegal or improper use of our payment system.
Our security measures may not prevent security breaches, service interruptions and fraud schemes and the failure to do so may disrupt our business, damage our reputation and expose us to risk of loss or litigation and possible monetary damages that could materially adversely affect our business, results of operation and financial condition.
Merchant fraud with respect to Internet-based bankcard and EFT transactions could cause us to incur significant losses.
We believe that we have significant experience in assessing the risks associated with providing payment processing services to small and medium-sized merchants. These risks include the limited operating history of many of the small and medium-sized merchants we serve and the risk that these merchants could be subject to a higher rate of insolvency, which could adversely affect us financially. We apply varying levels of scrutiny in our application evaluation and underwriting of prospective merchant accounts, ranging from basic due diligence for merchants with a low risk profile to a more thorough and detailed review for higher risk merchants.
As a result of our exposure to potential liability for merchant fraud, chargebacks, reject and other losses created by our merchant services business, we view our risk management and fraud avoidance practices as integral to our operations and overall success.
For our merchants conducting card-not-present transactions, which we view as having a higher risk profile, we employ an extended underwriting and due diligence period and special account monitoring procedures. The underwriting process for these merchants’ applications may take three to five days while we evaluate the applicants’ financials, previous processing history and credit reports.
Effective risk management helps us minimize merchant losses for the mutual benefit of our merchants and ourselves. Our risk management procedures also help protect us from fraud perpetrated by our merchants. We believe our knowledge and experience in dealing with attempted fraud has resulted in our development and implementation of effective risk management and fraud prevention systems and procedures for the types of fraud discussed in this section.
We have potential liability for fraudulent bankcard transactions initiated by merchants. Merchant fraud occurs when a merchant knowingly uses a stolen or counterfeit bankcard or card number to record a false sales transaction, processes an invalid bankcard or intentionally fails to deliver the merchandise or services sold in an otherwise valid transaction. We rely significantly on the processing revenue derived from bankcard and EFT transactions and, as a result, if any merchant or customer were to submit or process unauthorized or fraudulent bankcard or EFT transactions, depending on the dollar amount, we could incur significant losses which could have a material adverse effect on our business and results of operations and liquidity.
In addition, criminals are using increasingly sophisticated methods to engage in illegal activities such as counterfeit and fraud and, while we have systems and procedures designed to manage such risk and detect and reduce the impact of fraud, we cannot guarantee that our systems will prevent fraudulent transactions from being submitted and processed or that the funds set aside to address such activity will be adequate to cover all potential situations that might occur. We do not have insurance to protect us from these losses. There is no assurance that any chargeback or processing reserve will be adequate to offset against any unauthorized or fraudulent processing losses that we may incur. Accordingly, should we experience such fraudulent activity and such losses, our results of operations could be immediately and materially adversely affected.
Excessive chargeback losses could significantly affect our results of operations and liquidity.
Our agreements with our sponsoring financial institutions and certain payment processors require us to assume and bear the risk of “chargeback” losses. Under the rules of Visa and MasterCard, when a merchant processor acquires card transactions, it has certain contingent liabilities for the transactions processed. This contingent liability arises in the event of a billing dispute between the merchant and a cardholder that is ultimately resolved in the cardholder’s favor. In such a case, the disputed transaction is charged back to the merchant and the disputed amount is credited or otherwise refunded to the cardholder. If we are unable to collect this amount from the merchant’s account, or if the merchant refuses or is unable to reimburse us for the chargeback due to merchant fraud, breach of contract, bankruptcy, insolvency or other reasons, we will bear the loss for the amount of the refund paid to the cardholders. In addition, if we are unable to recover these chargeback amounts from merchants, the obligation to pay the aggregate of any such amounts could have a material adverse effect on our results of operations and liquidity.
Our business is highly dependent on the efficient and uninterrupted operation of our computer network systems and data centers, and any disruption or material breach of security of our systems could materially harm our business.
Our ability to provide reliable service largely depends on the efficient and uninterrupted operation of our computer network systems and data centers. Any significant interruptions or security or privacy breaches in our facilities, computer networks, firewalls and databases could harm our business and reputation, result in a loss of customers or cause inquiries and fines or penalties from regulatory or governmental authorities. Our systems and operations could be exposed to damage or interruption from fire, natural disaster, power loss, telecommunications failure, unauthorized entry or physical break-ins, computer viruses and hackers. The measures we have enacted, such as the implementation of security access and disaster recovery plans, may not be successful and we may experience problems other than system failures. We may also experience software defects, development delays and installation difficulties, which could harm our business and reputation and expose us to potential liability and increased operating expenses.
Global economics, political and other conditions may adversely affect trends in consumer spending, which may adversely impact our revenue and profitability
The global electronic payments industry depends heavily upon the overall level of consumer, business and government spending. The industry also relies in part on the number and size of consumer transactions. Since the worldwide recession of 2008-2009, worldwide economic conditions have been adversely impacted by the global macroeconomic downturn, high unemployment rates, ongoing volatility and, most recently, concerns over the downgrade of U.S. sovereign debt and the continued sovereign debt uncertainties in Europe and other foreign countries. A sustained deterioration or sluggish recovery in the general economic conditions in Canada, the United States or globally (including Europe) could adversely affect our financial performance by reducing the number of as well as the average purchase amount of transactions involving payment cards. If our merchants make fewer sales of their products and services, we will have fewer transactions to process, resulting in lower revenue. In addition, we have a certain amount of fixed and semi-fixed costs, including rent and salaries, which could limit our ability to quickly adjust costs and respond to changes in our business and the economy. As a result, a reduction in the amount of consumer spending could result in a decrease of our revenue and profits.
In addition, in a recessionary or sluggish economic environment, our merchants could also experience a higher rate of business closures. In the event of a closure of a merchant, we are unlikely to receive our fees for any transactions processed by that merchant in its final month of operation, which could adversely affect our business and financial condition. We cannot predict the recurrence of any economic slowdown or the strength or sustainability of any economic recovery, whether worldwide, in Canada or the United States, or in our industry. The uncertainty of these economic factors makes it particularly difficult to predict demand for our services, makes it more likely that our actual results could differ materially from expectations and could have a material adverse effect on our financial condition and operating results.
We may not be able to attract, retain or integrate key personnel, including executive officers, which may prevent us from successfully operating our business.
We may not be able to retain our key personnel or attract other qualified personnel in the future. Our success will depend upon the continued service of key management personnel as well as the skills, experience and efforts of our executive officers. The loss of services of any of the key members of our management team or our failure to attract and retain other key personnel could disrupt operations and have a negative effect on employee productivity and morale and have a material adverse impact upon our financial results. The loss of any of our executive officers could impair our ability to successfully manage our current business or implement our planned business objectives and our future operations may be adversely affected.
If we do not continue to enhance our existing products and services and develop or acquire new ones, we will not be able to compete effectively.
As part of our business strategy, we are seeking to further penetrate into the transaction payment processing market and to expand our business into new markets or markets that are complementary to our existing transaction payment processing segment operations. If we are not able to successfully expand our penetration into the existing transaction payment processing market or into new or complementary markets, our financial results and future prospects may be harmed. Our ability to increase market penetration and enter new or complementary markets depends on a number of factors, including growth in our existing and targeted markets, our ability to provide products and services to address the needs of those markets and competition in those markets.
The industries in which we do business or intend to do business have been changing rapidly as a result of increasing competition, technological advances, changing consumer payment habits, regulatory changes and evolving industry practices and standards, and we expect these changes will continue. Current and potential clients have also experienced significant changes as the result of competition and economic conditions. In addition, the business practices and technical requirements of our clients are subject to changes that may require modifications to our products and services. In order to remain competitive and successfully address the evolving needs of our clients, we must commit a significant portion of our resources to:
|
·
|
identify and anticipate emerging technological and market trends affecting the markets in which we do business;
|
|
·
|
enhance our current products and services in order to increase their functionality, features and cost-effectiveness to clients that are seeking to control costs and to meet regulatory requirements;
|
|
·
|
develop or acquire new products and services that meet emerging client needs, such as products and services for the online market and the emerging mobile commerce market;
|
|
·
|
modify our products and services in response to changing business practices and technical requirements of our clients, as well as to new regulatory requirements;
|
|
·
|
integrate our current and future products with third-party products; and
|
|
·
|
create and maintain interfaces to changing client and third party systems.
|
We must achieve these goals in a timely and cost-effective manner and successfully market our new and enhanced products and services to clients. There is no assurance that our current products and services will stay competitive with those of our competitors or that we will be able to introduce new products and services to compete successfully in the future. If we are unable to expand or appropriately enhance or modify our products and services quickly and efficiently, our business and operating results will be adversely affected.
We face competition from a broad and increasing range of vendors that could reduce or eliminate demand for our products and services.
The market for products and services offered to participants in online transactions is highly competitive and is characterized by rapid technological change, evolving industry standards, merchant requirements, pricing competition, rapid rates of product obsolescence, and rapid rates of new product introduction. This market is fragmented and a number of companies offer one or more products or services competitive with ours. We face competition from several providers of online payment processing services, including Moneris, CyberSource Corporation, Plug & Pay Technologies, Inc., Verisign/PayPal, Inc., Google, Inc. and LinkPoint International, Inc., a subsidiary of First Data Corporation, as well as financial services companies, credit card and payment processing companies. We anticipate continued growth and the formation of new alliances in the market in which we compete, which could result in the entrance of new or the creation of bigger competitors in the future.
Many of our current and potential competitors have significantly greater financial, marketing, technical and other competitive resources than we do. As a result, these competitors may be able to adapt more quickly to new or emerging technologies and changes in client requirements, or may be able to devote greater resources to the promotion and sale of their products and services. In addition, in order to meet client requirements, we must often work cooperatively with companies that are, in other circumstances, competitors. The need for us to work cooperatively with such companies may limit our ability to compete aggressively with those companies in other circumstances. If we lose customers, our business operations may be materially adversely affected, which could cause us to cease our business or curtail our business to a point where we are no longer able to generate sufficient revenue to fund operations.
If we are unable to protect our intellectual property rights or if others claim that we are infringing on their intellectual property, we could lose any competitive advantage we may have with respect to our intellectual property or we may be required to incur significant costs with respect to the infringement of the intellectual property rights of others.
We may be unable to successfully assert patent infringement actions against others and could incur significant costs with respect to asserting such actions. The failure to successfully assert our patent infringement actions could have a material adverse effect upon our business and our financial results.
We have in the past asserted patent infringement actions against others and could again in the future. The cost of prosecuting a patent infringement action against others is complex, carries a high degree of uncertainly and is expensive. While we believe our patents and claims therein to be valid, we face the risk that our patents could ultimately be determined to be invalid or otherwise not infringed by a court, jury or the United States Patent and Trademark Office (“USPTO”). In addition, one of our patents and certain claims therein currently is, and others in the future could be, subject to a re-examination proceeding as a result of a request made by a third party with the USPTO, which could ultimately result in such patent or certain claims therein being determined to be invalid (see “Item 3 – Legal Proceedings”). Furthermore, all patents have an expiration date and our patent nos. 5,484,988, 6,164,528, 6,283,366, 6,354,491 and RE40,220, regarding electronic check processing, expire on January 16, 2013. Failure to prevail in a patent infringement action against others, or having any of our patents or certain claims therein, determined to be invalid prior to their expiration, could have a material adverse impact on our business and our financial results and our stock price.
We may also be unable to successfully defend patent infringement actions brought against us by others which could cause us to incur significant costs. We have successfully defended patent infringement actions in the past, and may have to defend patent infringement actions in the future, brought against us by others regarding our technology, products or services. An unfavorable resolution of these infringement actions could result in our being restricted from delivering the related product or service or result in an unfavorable monetary settlement or damage awards that could have a material adverse effect upon our business and our financial results.
We rely on partnerships with financial institutions and payment processors, which have substantial discretion with respect to certain elements of our business practices, in order to process bankcard transactions. If these partnerships are terminated and we are unable to secure new partnerships with financial institutions and payment processors, we will not be able to conduct certain aspects of our business.
Because we are not a bank, we are not eligible for membership in the Visa and MasterCard networks and are, therefore, unable to directly access the bankcard networks, which are required to process Visa and MasterCard transactions. Visa and MasterCard operating regulations require us to be sponsored by a member bank in order to process bankcard transactions. We are currently registered with Visa and MasterCard through certain financial institutions and payment processors in Canada and the United States. If our partnership agreements are terminated and we are unable to secure other bank partnership agreements, we may not be able to process Visa and MasterCard transactions. Furthermore, some agreements give the financial institutions or payment processors substantial discretion in approving certain aspects of our business practices, including our solicitation, application and qualification procedures for merchants, the terms of our agreements with merchants and our customer service levels. Discretionary actions by our financial institution or payment processor partners under these agreements could have a detrimental effect on our operations.
Changes to credit card association, debit networks and ACH rules or practices could adversely impact our business.
We do not belong to nor can we directly access the bank card associations. As a result, we must rely on banks and their processing providers to process our credit, debit, EFT and ACH transactions. However, we must comply with the operating rules of the credit card associations and other payment networks such as debit networks and ACH networks. The associations’ member banks and network owners set these rules and the associations and network owners interpret them. Some of those member banks and network owners compete with us in certain situations. Visa, MasterCard, American Express, Discover, Interac or the Automated Clearing House could adopt new operating rules or interpretations of existing rules which we might find difficult or even impossible to comply with, resulting in our inability to give customers the option of using credit cards, debit cards, EFT and ACH facilities to fund their payments. If we were unable to provide a gateway for these payment services, our business could be materially and adversely affected.
If we cannot pass increases in bankcard network interchange fees, assessments and transaction fees along to our merchants, our operating margins could be reduced.
In some instances, we pay interchange fees and other network fees set by the bankcard networks indirectly or directly to the card issuing bank, the bankcard networks and payment processors for transactions we process. From time to time, the bankcard networks increase the interchange fees and other network fees that they charge payment processors and the sponsor banks. At its sole discretion, our sponsor bank and/or payment processor, as the case may be, has the right to pass any increases in interchange and other fees on to us and they have consistently done so in the past. Generally, we are allowed to, and in the past we have been able to, pass these fee increases along to our merchants through corresponding increases in our processing fees. However, if we are unable to do so in the future, our operating margins could be reduced.
Our business depends on the services of skilled software engineers who can develop, maintain and enhance our products, consultants who can undertake complex client projects and sales and marketing personnel. In general, only highly qualified, highly educated personnel have the training and skills necessary to perform these tasks successfully. In order to maintain the competitiveness of our products and services and to meet client requirements, we need to attract, motivate and retain a significant number of software engineers, consultants and sales and marketing personnel. Qualified personnel such as these are in short supply and we face significant competition for these employees from, not only our competitors, but also clients and other enterprises. Other employers may offer software engineers, consultants and sales and marketing personnel significantly greater compensation and benefits or more attractive career paths than we are able to offer. Any failure on our part to hire, train and retain a sufficient number of qualified personnel could seriously damage our business.
If our internal controls over financial reporting are not effective, current and potential stockholders could lose confidence in our financial reporting.
Section 404 of the Sarbanes-Oxley Act of 2002 requires companies to conduct a comprehensive evaluation of their internal control over financial reporting. To comply with this statute, we are required to document and test our internal control over financial reporting and our management is required to assess and issue a report concerning our internal control over financial reporting. Any failure to maintain or implement required new or improved controls, any difficulties we encounter in implementation and any failure to maintain the adequacy of our internal controls on an ongoing basis could cause us to not be able to conclude on an ongoing basis that we have effective internal controls and could cause us to fail to meet our periodic reporting obligations or result in material misstatements in our financial statements, and substantial costs and resources may be required to rectify these or other internal control deficiencies. If we cannot produce reliable financial reports, investors could lose confidence in our reported financial information, the market price of our common stock could decline significantly, and our business and financial condition could be harmed.
We and our clients must comply with complex and changing laws and regulations.
Government regulation influences our activities and the activities of our current and prospective clients, as well as our clients’ expectations and needs in relation to our products and services. Businesses that handle consumers’ funds, such as ours, are subject to numerous state, federal, provincial and international regulations, including those related to banking, credit cards, electronic transactions, communication, escrow, fair credit reporting, privacy of personal information and financial records, internet gambling and others. State, federal and provincial money transmitter regulations and federal and international anti-money laundering and money services business regulations can also apply under some circumstances. The application of many of these laws with regard to electronic commerce is unclear. In addition, it is possible that a number of laws and regulations may be applicable or may be adopted in the future with respect to conducting business over the Internet concerning matters such as taxes, pricing, content and distribution. If applied to us, any of the foregoing rules and regulations could require us to change the way we do business in a way that increases costs or makes our business more complex. In addition, violation of some statutes may result in severe penalties or restrictions on our ability to engage in e-Commerce, which could have a material adverse effect on our business.
In July 2010, Congress passed the Dodd-Frank Wall Street Reform and Consumer Protection Act (the “Dodd-Frank Act”) which significantly changed financial regulation. Changes included restricting amounts of debit card fees that certain issuer banks can charge merchants and allowing merchants to offer discounts for different payment methods. The impact which new requirements imposed by the Dodd-Frank Act or other new regulation will have on our operating results is difficult to determine, as their implementation could result in the need for us to modify our services and processing platforms. As new requirements are mandated, these regulations could adversely affect our operating results and financial condition.
The Dodd-Frank Act also created a new Consumer Financial Protection Bureau, which will assume responsibility for most federal consumer protection laws in the area of financial services, including consumer credit. The creation of the bureau and its actions may make payment card transactions less attractive to card issuers, and thus negatively impact our business.
In addition to the Dodd-Frank Act, privacy legislation (including the Gramm-Leach-Bliley Act and regulations thereunder and the Personal Information Protection and Electronic Documents Act and the Code of Conduct for the Credit and Debit Card Industry in Canada), as well as provincial and state laws may also affect the nature and extent of the products or services that we can provide to clients as well as our ability to collect, monitor and disseminate information subject to privacy protection. Furthermore, certain of our services in Canada may be subject to federal legislation called the Proceeds of Crime and Terrorist Financing Act, while certain check collection and electronic check re-presentment services that we provide in the U.S. are governed by the Federal Fair Debt Collection Practices Act and the Federal Fair Credit Reporting Act and other similar state laws, and our electronic check re-presentment transactions are subject to applicable National Automated Clearing House Association (“NACHA”) Operating Rules and applicable Uniform Commercial Code statutes.
Consumer protection laws in the areas of privacy of personal information and credit and financial transactions have been evolving rapidly at the state, federal, provincial and international levels. As the electronic transmission, processing and storage of financial information regarding consumers continues to grow and develop, it is likely that more stringent consumer protection laws may impose additional burdens on companies involved in such transactions including, without limitation, notification of unauthorized disclosure of personal information of individuals. Uncertainty and new laws and regulations, as well as the application of existing laws, could limit our ability to operate in our markets, expose us to compliance costs, fines, penalties and substantial liability, and result in costly and time-consuming litigation. Furthermore, the growth and development of the market for e-Commerce may prompt more stringent consumer protection laws that may impose additional regulatory burdens on companies that provide services to online businesses. The adoption of additional laws or regulations, or taxation requirements may affect the ability to offer, or cost effectiveness of offering, goods or services online, which could, in turn, decrease the demand for our products and services and increase our cost of doing business.
The Canadian Securities Administrators in Canada and the Securities and Exchange Commission and the National Association of Securities Dealers, Inc. in the United States have also enacted regulations affecting our corporate governance, securities disclosure and compliance practices. We expect these regulations to increase our compliance costs and require additional time and attention. If we fail to comply with any of these regulations, we could be subject to legal actions by regulatory authorities or private parties.
Our business may be harmed by errors in our software.
The software that we develop and use in providing our transaction payment processing products and services is extremely complex and contains thousands of lines of computer code. Complex software systems such as ours are susceptible to errors. We believe our software design, development and testing processes are adequate to detect errors in our software prior to its release. Because of the complexity of our systems and the large volume of transactions we process on a daily basis, it is possible that we may not detect software errors until after they have affected a significant number of transactions. Software errors can have the effect of causing merchants, customers or partners who utilize our products and services to fail to comply with their intended business policies, or to fail to comply with legal, credit card, debit card and banking requirements, such as those under the Fair Credit Reporting Act, Gramm-Leach-Bliley Act, NACHA rules, MasterCard’s Site Data Protection (SDP) Standard, Visa’s Cardholder Information Security Program (CISP) and Payment Card Industry’s (PCI) Data Security Standard.
Our future revenues may be uncertain because of reliance on third parties for marketing and distribution.
We distribute our service offerings primarily through third party sales distribution partners and our revenues are derived predominantly through these relationships. We intend to continue to market and distribute our current and future products and services through existing and other relationships both in and outside of Canada and the U.S. There are no minimum purchase obligations applicable to any existing distributor or other sales and marketing partners and we do not expect to have any guarantees of continuing orders. Failure by our existing and future distributors or other sales and marketing partners to generate significant revenues, our failure to establish additional distribution or sales and marketing alliances, changes in the industry that render third party distribution networks obsolete, termination of relationships with significant distributors or marketing partners could have a material adverse effect on our business, operating results and financial condition. In addition, we may be required to pay higher commission rates in order to maintain loyalty among our third-party distribution partners, which may have a material adverse impact on our profitability.
Our ability to expand through acquisitions involves risks and may not be successful.
As part of our growth strategy, we have made business acquisitions in the past and we expect to be an active business acquirer in the future. We will continue to evaluate and may, from time to time, seek to acquire complementary businesses, products and services in the future. We cannot provide assurance that we will be able to consummate any such transactions or that any future acquisitions will be consummated at acceptable prices or terms. In addition, the acquisition and integration of businesses involves a number of risks and challenges, including:
|
·
|
Maintaining the acquired business’ customer relationships;
|
|
·
|
Demonstrating to the customers of the acquired business that the acquisition has not resulted in changes that would adversely impact the ability of the acquired business to address the needs of its customers;
|
|
·
|
The operations, technology and personnel of an acquired business may be difficult to integrate;
|
|
·
|
An acquired business may not achieve anticipated revenues, earnings or cash flow;
|
|
·
|
The allocation of management resources to complete a business acquisition may divert management resources from our business and disrupt our day-to-day operations.
|
There can be no assurance that we will be able to fully integrate all aspects of an acquired business successfully or fully realize the potential benefits of any business combination and our failure to successfully integrate acquired businesses may have a material adverse effect on our financial results and stock price.
We may require additional capital, which may not be available on commercially reasonable terms, or at all. Failure to obtain such additional capital could have a materially adverse impact on our business.
Our future business activities, the development or acquisition of new or enhanced products and services, the acquisition of additional computer and network equipment, the costs of compliance with government regulations and future expansions including acquisitions will require us to make significant capital expenditures. We currently have no credit line or credit facility and rely solely on cash on hand, investments and cash from operations to fund our business. If our available cash resources prove to be insufficient because of unanticipated expenses, previous acquisitions, revenue shortfalls or otherwise, we may need to obtain credit, bank loans, contractual lending agreements or other funding sources or seek additional equity or debt financing. There can be no assurance that credit, bank loans, contractual lending agreements or other funding sources would be available on reasonable terms, or at all. If we obtain equity financing for any reason, then the sale or issuance of equity securities to raise such capital may result in dilution to our shareholders. If we obtain debt financing, our business could become subject to restrictions that affect our operations or increase the level of risk in our business. If we were not able to fund operations, then our level of services, staffing, resources or equipment might need to be reduced or eliminated and our expansion activities might need to be curtailed, which could negatively impact our revenue and results of operations.
Currency exchange rate fluctuations could adversely affect our financial results, which may have an adverse impact on our business, results of operations and financial condition as well as the value of our foreign assets.
Fluctuations in foreign currency exchange rates may have an adverse impact on our business, results of operations and financial condition, as well as the value of our foreign assets, which, in turn, may adversely affect reported earnings or losses and the comparability of period-to-period results of operations. With the exception of our Canadian Beanstream subsidiary, the U.S. dollar currently is, and has historically been, the functional and reporting currency of our operations. As a result, when we are paying any obligation that is denominated in a foreign currency, we must generate the equivalent amount of cash in U.S dollars that, when exchanged at the then-prevailing applicable foreign currency exchange rate, will equal the amount of the obligation to be paid (which means that we may pay more U.S. dollars than initially anticipated if the foreign currency strengthens against the U.S. dollar between the time we incur the obligation and the time we are required to pay the obligation). Changes in the U.S./Canadian currency exchange rate could have a significant adverse impact on our current liquidity and capital resources and could also have a material adverse impact on our profitability and results of operations.
Because a small number of customers have historically accounted for a substantial portion of our revenue, our financial results would be materially adversely affected if we are unable to retain customers.
We have had in the past, and may have in the future, a small number of customers that have accounted for a significant portion of our revenue. During the fiscal year ended March 31, 2012, we earned revenue from three licensees pursuant to settlement and license agreements, resulting mostly from litigation, amounting to approximately 36% of total revenue. Revenue from these licensees is non-recurring. We anticipate that, in future periods, revenue derived from the licensing of our intellectual property estate may fluctuate significantly. Our revenue could materially decline because of a failure to enter into new licensing agreements.
We have historically experienced fluctuations in our operating results and expect these fluctuations to continue in future periods, which may result in volatility in our stock price.
Our operating results may fluctuate in the future based upon a number of factors, many of which are not within our control. Our revenue model for our TPP segment is based largely on recurring revenues, billed monthly, predominately derived from growth in customers and the numbers of transactions processed within a monthly billing period. The number of transactions processed is affected by many factors, several of which are beyond our control, including general consumer trends and holiday shopping in the fourth quarter of the calendar year. Our revenue model in our IPL segment is based predominantly on fully paid-up or non-recurring revenues and we anticipate revenue amounts from this segment to fluctuate to a large degree in future periods.
Our operating results may also fluctuate in the future due to a variety of other factors, including the timing and extent of restructuring, impairment and other charges that may occur in a given fiscal year, the final disposition of any patent litigation and new changes in accounting rules. As a result of these factors, we believe that our fiscal year results are not predictable with any significant degree of certainty, and year-to-year comparisons of our results of operations are not necessarily meaningful. Our fiscal year results of operations should not be relied upon to predict our future performance.
If our operating results fall below the expectations of investors or public market analysts, the price of our common stock could fall dramatically. Our common stock price could also fall dramatically if investors or public market analysts reduce their estimates of our future quarterly operating results, whether as a result of information we disclose, or based on industry, market or economic trends, or other factors.
We have a general history of losses and may not operate profitably in the future.
We have incurred losses for two of the last five fiscal years. As of March 31, 2012, our accumulated deficit was approximately $12,835,486. We believe that our planned growth and profitability will depend in large part on our ability to expand our client base. Accordingly, we intend to invest in marketing, development of our client base and development of our marketing technology and operating infrastructure. If we are not successful in expanding our client base, it will have a material adverse effect on our financial condition and our ability to continue to operate our business.
We may be required to offset future deferred tax assets with a valuation allowance.
If we fail to achieve future taxable income assumed in the calculation of our deferred tax assets or if we fail to implement feasible and prudent tax planning strategies, we may be required to offset deferred tax assets with a valuation allowance, resulting in an additional tax expense. The change in the valuation could have a material adverse impact on our profitability and results of operations. If we do not achieve sufficient Canadian taxable income in future years to utilize all or some of our net operating loss carryforwards, they will expire.
If our goodwill, indefinite-life intangible assets or other long-term assets become impaired, we will be required to record additional impairment charges, which may be significant.
A significant portion of our long-term assets continues to consist of goodwill and other definite and indefinite-life intangible assets recorded as a result of our 2007 acquisition of Beanstream. We do not amortize goodwill and indefinite-life intangible assets, but rather review them for impairment on an annual basis or more frequently whenever events or changes in circumstances indicate that their carrying value may not be recoverable. We consider whether circumstances or conditions exist which suggest that the carrying value of our goodwill and other long-lived assets might be impaired. If such circumstances or conditions exist, further steps are required in order to determine whether the carrying value of each of the individual assets exceeds its fair market value. If analysis indicates that an individual asset’s carrying value does exceed its recoverable amount, the next step is to record a loss equal to the excess of the individual asset’s carrying value over its recoverable amount. The steps required by International Financial Reporting Standards (“IFRS”) entail significant amounts of judgment and subjectivity. We complete our analysis of the carrying value of our goodwill and other intangible assets during the fourth quarter of each fiscal year, or more frequently whenever events or changes in circumstances indicate that their carrying value may not be recoverable. Events and changes in circumstances that may indicate that there is impairment and which may indicate that interim impairment testing is necessary include, but are not limited to, strategic decisions to exit a business or dispose of an asset made in response to changes in economic, political and competitive conditions, the impact of the economic environment on our customer base and on broad market conditions that drive valuation considerations by market participants, our internal expectations with regard to future revenue growth and the assumptions we make when performing our impairment reviews, a significant decrease in the market price of our assets, a significant adverse change in the extent or manner in which our assets are used, a significant adverse change in legal factors or the business climate that could affect our assets, an accumulation of costs significantly in excess of the amount originally expected for the acquisition of an asset, and significant changes in the cash flows associated with an asset. We analyze these assets at the individual asset, reporting unit and corporate levels. As a result of such events and changes in circumstances, we may be required to record a significant charge to earnings in our consolidated financial statements during the period in which any impairment of our goodwill, indefinite-life intangible assets or other long-term assets is determined. Any such impairment charges could have a material adverse effect on our financial condition and operating results.
The demand for many of our products and services could be negatively affected by reduced growth of e-Commerce, delays in the development of the Internet infrastructure, a general economic slowdown or any other event causing a material slowing of consumer spending.
A significant portion of our revenue is derived from transaction processing fees. Any changes in economic factors that adversely affect consumer spending and related consumer debt, or a reduction in check writing or credit and debit card usage, could reduce the volume of transactions that we process, and have a materially adverse effect on our business, financial condition and results of operations. We depend on the growing use and acceptance of the Internet by merchants and customers in Canada and the United States as a means to grow our business. We cannot be certain that acceptance and use of the Internet will continue to grow or that a sufficiently broad base of merchants and consumers will adopt, and continue to use, the Internet as a medium of commerce. It is also possible that continued growth in the number of Internet users, and the use of the Internet generally, may overwhelm the existing Internet infrastructure. Delays in the development or adoption of new standards and protocols required to handle increased levels of Internet activity could also have a detrimental effect on the Internet and correspondingly on our business. These factors could adversely affect usage of the Internet and lower demand for our products and services.
We may become subject to additional federal, state, provincial or local taxes that cannot be passed through to our merchants, which could negatively affect our results of operations.
Companies in the payment processing industry, including us, may become subject to taxation in various tax jurisdictions on our net income or revenues. Application of these taxes is an emerging issue in our industry and taxing jurisdictions have not yet adopted uniform positions on this topic. If we are required to pay additional taxes and are unable to pass the tax expense through to our merchants, our costs would increase and our net income could be reduced.
Estimates of future financial results are inherently unreliable.
From time to time, we may make public estimates or forecasts regarding our future results, including estimates regarding future revenues, expense levels, tax rates, acquisition expenses, capital expenditures, earnings or earnings from operations. Any forecast regarding our future performance reflects various assumptions and judgments by management regarding the likelihood that certain possible future events will in fact occur. These assumptions and judgments are subject to significant uncertainties and shifting market dynamics, and, as a matter of course, many of them will prove to be incorrect. Further, events that may seem unlikely or relatively certain at the time a given estimate is made may, in fact, occur or fail to occur. Many of the factors that can influence the outcome of any estimate or projection are beyond our control. As a result, there can be no assurance that our performance will be consistent with any management forecasts or that the variation from such forecasts will not be material and adverse. Investors are cautioned that any estimate, projection or other forward looking statement made by us should be considered current only as of the date made. Investors are encouraged to utilize the entire available mix of historical and forward-looking information made available by us, and other information relating to our Corporation and our products and services, when evaluating our prospective results of operations.
Our common stock price is volatile.
The market price of our common stock has been volatile in the past and may change rapidly in the future. The following factors, among others, may cause significant volatility in our stock price:
|
·
|
Actual or anticipated fluctuations in our operating results;
|
|
·
|
Financial or business announcements by us, our competitors or our customers;
|
|
·
|
Announcements of the introduction of new or enhanced products and services by us or our competitors;
|
|
·
|
Announcements of mergers, joint development efforts or corporate partnerships in the electronic commerce market;
|
|
·
|
Market conditions in the banking, telecommunications, technology and emerging growth sectors;
|
|
·
|
Rumors relating to our competitors or us;
|
|
·
|
Rumors relating to our intellectual property generally and specifically surrounding enforcement and/or legal or administrative action pertaining to our intellectual property; and
|
|
·
|
General market or economic conditions.
|
In addition, the U.S. stock markets have, in recent years, experienced significant price and volume fluctuations, which have particularly affected the trading price of equity securities of many technology companies.
|
Unresolved Staff Comments
|
None.
|
ITEM 2.
|
Properties
|
As of June 1, 2012, we leased office space containing approximately 15,302 square feet for our operations. Our principal facilities include:
|
Location
|
Approximate Square Feet
|
Lease
Expiration Date
|
Description
|
|||
|
Wichita, Kansas
|
5,785
|
November, 2013
|
CP Segment Operations
|
|||
|
Vancouver, British Columbia
|
3,155
|
September, 2013
|
Administration
|
|||
|
Victoria, British Columbia
|
5,962
|
January, 2014
|
Data Center/TPP Segment Operations
|
We consider our current facilities to be adequate for our current needs and believe that suitable additional space will be available, as needed, to accommodate further physical expansion of our operations.
|
Legal Proceedings
|
2008 Patent Litigation
On November 19, 2008, we filed a patent infringement lawsuit in the U.S. district court for the Eastern District of Texas against multiple financial institutions operating in the United States (the “2008 Patent Litigation”). In the suit, we alleged that the defendants were infringing U.S. Patent No. RE40,220 (the “40,220 Patent”) and we sought damages and injunctive and other relief for the alleged infringement of this patent. The 40,220 Patent covers 100 patent claims. However, at the request of the trial court and for purposes of expediency, we limited the number of patent claims that we sought to enforce in the litigation to 16 patent claims, which we believed to be among the core claims described by the 40,220 Patent. During the fiscal year ended March 31, 2012 we settled and entered into license agreements with Northern Trust Company, Wells Fargo, Capital One, JP Morgan Chase Bank N.A. and Deutsche Bank (the “2012 License Agreements”). These licensees were all of the defendants that remained in the 2008 Patent Litigation. The 2012 License Agreements provide each of the respective licensees with a fully paid-up license from us to use certain of our patents for electronic check conversion transactions including “ARC”, “WEB”, “POP”, “TEL” and “BOC”. In connection with the 2012 License Agreements, we received compensation totaling $14,100,000 for the releases, licenses, covenants and all other rights granted under the 2012 License Agreements and, pursuant to the 2012 License Agreements, the lawsuit against each of the respective licensees was dismissed. Pursuant to a retention agreement with our legal firm, we paid approximately $5,364,000 in legal fees for the firm’s services in connection with the 2012 License Agreements. As a result of settlements being reached with all of the defendants, the 2008 Patent Litigation was closed on March 13, 2012.
2009 Patent Litigation
On June 4, 2009, we filed another patent infringement lawsuit in the U.S. district court for the Eastern District of Texas against six financial institutions operating in the United States (the “2009 Patent Litigation”). In the 2009 Patent Litigation, we alleged that the defendants were infringing the 40,220 Patent and we sought damages and injunctive and other relief for the alleged infringement of this patent. On September 9, 2011, we entered into a Settlement and License Agreement with Comerica Incorporated (“Comerica”) (the “Comerica Agreement”), the last remaining defendant in the 2009 Patent Litigation. The Comerica Agreement provides Comerica with a fully paid-up license from us to use our patents for electronic check conversion transactions including “ARC”, “WEB”, “POP”, “TEL” and “BOC”. In connection with the Comerica Agreement, we received compensation totaling $350,000 for the releases, licenses, covenants and all other rights granted under the Comerica Agreement and, pursuant to the Comerica Agreement, the lawsuit against Comerica was dismissed. Pursuant to a retention agreement with our legal firm, we paid approximately $140,000 in legal fees for the firm’s services in connection with the Comerica Agreement. As a result of settlements reached with four of the defendants and the dismissal of claims against the remaining three defendants in the 2009 Patent Litigation, the 2009 Patent Litigation was closed on October 11, 2011.
Inter-partes Reexamination Proceeding relating to the 2008 Patent Litigation
On May 11, 2010, four of the defendants in the 2008 Patent Litigation submitted a request for an inter-partes reexamination to the United States Patent and Trademark Office (“USPTO”) regarding the 40,220 Patent. Generally, an inter-partes reexamination is a USPTO administrative proceeding requested by a third party (in this case, the four defendants in the 2008 Patent Litigation, who are referred to as the “Third Party Requesters”) to challenge the validity of patents that have already been issued. On July 26, 2010, the USPTO posted a non-final office action on its public Patent Application Information Retrieval (“PAIR”) website ordering an inter-partes reexamination proceeding with respect to the 40,220 Patent pursuant to which 16 of the 100 claims described by the 40,220 Patent were rejected (the “Rejected Claims”). The Rejected Claims, which continue to be subject to re-examination and included all of the patent claims that we had asserted and sought to enforce in the 2008 Patent Litigation, remain valid and enforceable until the 40,220 Patent expires on January 16, 2013 unless they are cancelled prior to that date.
During the three months ended December 31, 2010, we filed a response to this non-final office action with the USPTO, following which the Third Party Requesters filed a response to our response with the USPTO. The Examiner issued a non-final “Action Closing Prosecution” on March 14, 2011 pursuant to which the Rejected Claims continued to be subject to reexamination. On April 14, 2011, we filed a response to the non-final Action Closing Prosecution and on May 16, 2011, the Third Party Requesters filed comments in response to our response to the non-final Action Closing Prosecution. On August 8, 2011 the USPTO issued a “Right of Appeal Notice” which is a final but appealable office action, pursuant to which the Rejected Claims continued to be subject to reexamination. On September 8, 2011, we filed a notice of appeal with respect to the decision to the Patent Office Board of Appeals and Interferences (“Board”). On November 22, 2011, we filed our opening appeal brief and on December 22, 2011 the Third Party Requesters filed a response brief. On January 13, 2012 the Examiner issued an Answer in response to our appeal pursuant to which the Rejected Claims continued to be subject to reexamination. We filed a rebuttal brief to the Examiner’s Answer on February 13, 2012 and on March 13, 2012 we filed a Request for Oral Hearing with the Board with respect to the inter-partes reexamination. As of the date of this Form 10-K, the Board has not yet responded to our Request for Oral Hearing. Once the Board renders its final decision in the inter-partes reexamination proceeding, any further appeals by any of the parties involved in such proceeding would be made to the Court of Appeals for the Federal Circuit (“Federal Circuit) and, if such appeal were made, any decision by the Federal Circuit would then be final and binding on the parties and non-appealable.
The ultimate outcome of the inter-partes reexamination proceeding (including any appeals that have been or may be made) is indeterminable at this time. A final, non-appealable decision in the inter-partes reexamination proceeding that is adverse to us could negatively impact our enforcement of the 40,220 Patent in the future. However, such an outcome would not require the repayment of any of the consideration already received by us with respect to either the 2008 or the 2009 Patent Litigation nor are there any forms of monetary penalties or fines that could occur upon cancellation of any of the 40,220 Patent’s claims pursuant to the inter-partes reexamination proceeding. While there can be no assurances, we do not believe that the final result of the inter-partes reexamination proceeding will have a material adverse effect on us.
Ex-partes Reexamination Proceeding
In response (in part) to the inter-partes reexamination proceeding, on June 17, 2011, we filed a separate ex-parte reexamination request with the USPTO with respect to other claims described in the 40,220 Patent. As part of this request, we requested amendments to certain claims and also requested the addition of new claims and the cancellation of certain claims described in the 40,220 Patent. On September 13, 2011, the USPTO issued an order granting an ex-partes reexamination with respect to the 40,220 Patent. On January 4, 2012, the USPTO issued a non-final office action in the ex-parte reexamination proceeding pursuant to which: (i) certain claims described by the 40,220 Patent were subject to reexamination; (ii) certain other claims were cancelled (as we requested); (iii) certain other claims were rejected, and (iv) new claims were added. Following our February 1, 2012 response and an examiner interview, the USPTO issued a Notice of Intent to Issue a Reexam Certificate on March 20, 2012. On May 2, 2012, subsequent to the fiscal year ended March 31, 2012, the USPTO issued an Ex-Parte Reexamination Certificate. On the Certificate, certain amended and added claims were confirmed and other claims were cancelled, as we had requested in our originally filed ex-parte re-examination request. As a result of the issuance of the Ex-Parte Reexamination Certificate, the ex-parte re-examination proceeding is closed. The Third Party Requesters did not have the right to participate in the ex-parte reexamination proceeding.
Incidental Litigation
Other than as described herein, we are not currently involved in any material legal proceedings. However, we are party from time to time to additional ordinary litigation incidental to our business, none of which is expected to have a material adverse effect on the results of our operations, financial position or liquidity.
|
Mine Safety Disclosures
|
Not applicable.
PART II
|
Market For Registrant's Common Equity, Related Stockholder Security Matters and Issuer Purchases of Equity Securities
|
Our common stock is traded on The NASDAQ Stock Market’s Capital Market under the symbol "LMLP". Our common stock is neither listed nor traded on any foreign trading market. The following table sets forth the range of high and low prices for our common stock during the fiscal periods indicated. The prices set forth below represent quotations between dealers and do not include retail markups, markdowns or commissions and may not represent actual transactions.
|
Fiscal Year Ended March 31:
|
High
|
Low
|
|||
|
2012
|
1Q
|
$3.96
|
$2.11
|
||
|
2Q
|
4.18
|
1.45
|
|||
|
3Q
|
2.46
|
1.49
|
|||
|
4Q
|
3.33
|
1.77
|
|||
|
2011
|
1Q
|
$2.55
|
$1.47
|
||
|
2Q
|
2.48
|
1.38
|
|||
|
3Q
|
3.85
|
1.46
|
|||
|
4Q
|
6.14
|
2.81
|
|||
The prices set forth above are not necessarily indicative of liquidity of the trading market for our common stock. Trading in our common stock is limited and sporadic.
Holders of Common Stock
As of June 15, 2012, there were approximately 330 record holders of our common stock, with approximately 28,246,684 shares outstanding. The number of holders of record is based on the actual number of holders registered on the books of our transfer agent and does not reflect holders of shares in "street name" or persons, partnerships, associations, corporations or other entities identified in security position listings maintained by depository trust companies.
Dividend Policy
We have not paid any dividends on our common stock in the past and have no current plan to pay dividends in the future. We intend to devote all funds to the operation of our businesses.
Canadian Federal Tax Considerations
General
There are no foreign or currency controls in Canada, and there are no exchange restrictions on borrowing from abroad, on the repatriation of capital, or the ability to remit dividends, profits, interests, royalties, or other payments to non-resident holders of our common stock. However, any such remittance to a resident of the U.S. is subject to a reduced withholding tax pursuant to various Articles of the Canada-U.S. Income Tax Convention, 1980 (the “Treaty”) between Canada and the U.S.
Dividends
Generally, dividends that are paid or credited by Canadian corporations to non-resident shareholders are subject to a nonresident tax of 25%. However, the Treaty provides that dividends paid by a Canadian corporation to a corporation resident of the U.S. with no permanent establishment in Canada, which owns at least 10% of our voting stock paying the dividend, are subject to the Canadian non-resident withholding tax of 5%. In all other cases, when a dividend is paid by a Canadian corporation to the beneficial owner resident in the U.S., the Canadian non-resident withholding tax is 15% of the amount of the dividend.
The reduced withholding tax rates do not apply if the beneficial owner of the shares carries on business through a permanent establishment in Canada and the stock holding in respect of which the dividends are paid is effectively connected with such permanent establishment. In such a case, the dividends are taxable in Canada as general business profits at rates that may exceed the 5% or 15% rates applicable to dividends that are not effectively connected with a Canadian permanent establishment.
The Treaty permits Canada to apply its domestic law rules for differentiating dividends from interest and other disbursements. Stock dividends are subject to the normal Canadian non-resident withholding tax rules on the amount of the dividend. The amount of a stock dividend is equal to the increase in our paid-up capital by virtue of the dividend.
Interest
Effective January 1, 2008, changes have been made to the Canadian Income Tax Act that eliminate withholding taxes on interest paid (excluding participating debt interest) to arm’s lengths residents of the U.S. by a Canadian corporation.
Historically, interest paid or credited to a non-resident is subject to a 25% Canadian withholding tax. If, at a time when interest has accrued but is not yet payable, the holder of the debt transfers it to a Canadian resident or, in certain circumstances, a non-resident who carries on business in Canada, part of the proceeds of the disposition may be considered to be interest for Canadian income tax purposes. Previously, under the Treaty, the rate of withholding tax on interest paid to a U.S. resident is 10%.
For Treaty purposes, interest includes interest as defined by domestic Canadian income tax rules in the jurisdiction in which interest arises. The withholding tax applies to the gross amount of the interest payment.
Non-residents are subject to Canadian income tax on dispositions of “taxable Canadian property.” Taxable Canadian property includes shares of a publicly traded Canadian corporation if, at any time during the preceding five years, the non-resident and persons with whom the non-resident did not deal at arm’s length owned at least 25% of the issued and outstanding shares of any class of stock.
The applicable tax rate on capital gains realized by a non-resident is 30% for corporations and 21.85% for individuals. Under the Treaty, capital gains realized by a U.S. resident on the disposition of shares of a Canadian corporation are exempt from Canadian income tax, unless (i) the value of the shares is derived principally from Canadian real property, or (ii) the shares are effectively connected with a permanent Canadian establishment of such non-resident, the capital gains are attributable to such permanent establishment, and the gains are realized not later than twelve months after the termination of such permanent establishment.
Securities Authorized for Issuance Under Equity Compensation Plans
The following table provides information as of March 31, 2012 about our common stock that may be issued upon the exercise of options, warrants and rights under all of our existing equity compensation plans, including the 1996 Stock Option Plan, the 1998 Stock Incentive Plan and the 2009 Stock Incentive Plan:
|
(A)
|
(B)
|
(C)
|
|
|
PLAN CATEGORY
|
Number of securities to be issued upon exercise of outstanding options, warrants and rights
|
Weighted-average exercise price of outstanding options, warrants and rights
|
Number of securities remaining available for future issuance under equity compensation plans (excluding securities reflected in column (A))
|
|
Equity compensation plans approved by security holders(1)
|
5,082,800
|
$2.48
|
4,752,000 (2)
|
|
Equity compensation plans not approved by security holders(3)
|
70,000
|
$3.40
|
N/A
|
|
|
______________________________
|
|
(1)
|
These plans consist of: (i) the 1996 Stock Option Plan, (ii) the 1998 Stock Incentive Plan and (iii) the 2009 Stock Incentive Plan.
|
|
(2)
|
Represents the 389,500 shares that remain available for grant under the 1996 Stock Option Plan and 4,362,500 shares that remain available for grant under the 2009 Stock incentive Plan. The 10-year term of the 1998 Stock Incentive Plan has expired and, accordingly, no additional options or other equity awards may be granted under that plan (however, outstanding awards under the 1998 Stock Incentive Plan are not affected by the expiration of the term and will continue to be governed by the provisions of the plan).
|
|
(3)
|
These securities consist of warrants issued to Ladenburg Thalmann & Co., Inc. which acted as placement agent and financial advisor to us in connection with the private placement transaction with Millennium Partners LLP completed on March 31, 2008. A total of 400,000 warrants were issued on March 26, 2008 (the “Issue Date”), exercisable for 400,000 shares of our common stock for a period of five years from the Issue Date at an exercise price of $3.40 per share. Between February 11, 2011 and March 10, 2011, Ladenburg Thalmann & Co., Inc. exercised a total of 330,000 warrants and paid us an aggregate exercise price of $1,122,000, resulting in the issuance of 330,000 shares of our common stock (the shares were issued by us in reliance upon an exemption from registration provided by Section 4(2) of the Securities Act of 1933, as amended).
|
Stock Performance Graph
The graph set forth below compares the cumulative total shareholder return on our common stock between March 31, 2007 and March 31, 2012 with the cumulative return of (i) the NASDAQ Stock Market Index (US) and (ii) the NASDAQ Computer and Data Processing Index (US and Foreign), over the same period. This graph assumes the investment of $100 on March 31, 2007 in our common stock, the NASDAQ Stock Market Index (US) and the NASDAQ Computer and Data Processing Index (US and Foreign), and assumes the reinvestment of dividends, if any.
The comparisons shown in the graph below are based upon historical data. We caution that the share price performance shown in the graph below is not indicative of, nor intended to forecast, the potential future performance of our common stock.
Notwithstanding anything to the contrary set forth in any of our previous or future filings under the Securities Act of 1933 or the Securities Exchange Act of 1934 that might incorporate this Annual Report on Form 10-K or future filings made by us under those statutes, the stock price performance graph is not considered "soliciting material," is not deemed "filed" with the SEC and is not deemed to be incorporated by reference into any of those prior filings or into any future filings made by us under those statutes.
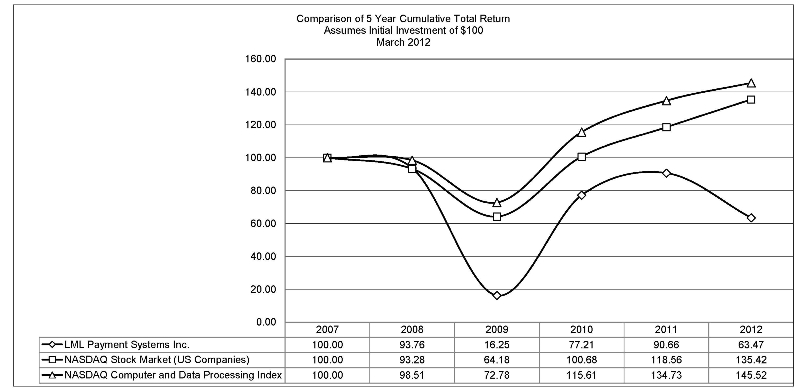
Note: Data complete through last fiscal year.
Note: Index Data: calcuclated (or derived) based from CRSP NASDAQ Stock Market (US Companies) and CRSP NASDAQ Computer and Data Processing. Center for research in Security Prices (CRSP®). Graduate School of Business, The University of Chicago. Copyright 2012. Used with permission. All rights reserved.
|
Selected Financial Data
|
The selected financial data set forth below should be read together with “Management’s Discussion and Analysis of Financial Condition and Results of Operations” and our financial statements and related notes. We have derived the statement of earnings data for the fiscal years ended March 31, 2012 and 2011 and the statement of financial position data as at March 31, 2012 and 2011 from the audited financial statements included elsewhere in this report. The statement of earnings data for the fiscal years ended March 31, 2010, 2009 and 2008 and the statement of financial position data as at March 31, 2010, 2009 and 2008 were derived from audited financial statements that are not included in this report. Historical results are not necessarily indicative of results to be expected for future periods. The information presented below has been presented on the basis of IFRS1, as issued by the International Accounting Standards Board ("IASB"), or previous Canadian GAAP, as specified. These principles differ in certain significant respects from U.S. GAAP.
|
|
______________________________
|
|
1
|
Since we adopted IFRS with effect from April 1, 2010, our financial information for the 2008 to 2010 fiscal years is presented on a previous Canadian GAAP basis. Accordingly, information for such prior fiscal years may not be comparable to financial information for the 2011 and 2012 fiscal years.
|
Table of Selected Financial Data1
Year Ended March 31
(Presented under IFRS and Canadian GAAP)
(Amounts in thousands, except per share data)
|
2012
|
2011
|
2010
|
2009
|
2008
|
||||||||||||||||
|
Statement of operations data:
|
||||||||||||||||||||
|
Revenue
|
$ | 34,917 | $ | 47,160 | $ | 14,826 | $ | 12,379 | $ | 11,328 | ||||||||||
|
Net income (loss) 2
|
6,728 | 9,999 | (126 | ) | 5,455 | (2,221 | ) | |||||||||||||
|
Net income (loss) per share – basic
|
0.24 | 0.37 | - | 0.20 | (0.10 | ) | ||||||||||||||
|
Net income (loss) per share – diluted
|
0.23 | 0.36 | - | 0.20 | (0.10 | ) | ||||||||||||||
|
Weighted average number of common shares outstanding – basic
|
28,214 | 27,343 | 27,116 | 26,834 | 21,869 | |||||||||||||||
|
Weighted average number of common shares outstanding – diluted
|
29,124 | 27,844 | 27,116 | 26,834 | 21,869 | |||||||||||||||
|
Balance sheet data:
|
||||||||||||||||||||
|
Current assets
|
$ | 42,042 | $ | 35,728 | $ | 14,619 | $ | 18,996 | $ | 16,826 | ||||||||||
|
Total assets
|
64,967 | 59,742 | 40,561 | 47,499 | 39,642 | |||||||||||||||
|
Current liabilities
|
13,490 | 15,477 | 9,019 | 16,234 | 13,185 | |||||||||||||||
|
Long-term debt, less current portion
|
5 | 7 | 10 | - | 2,613 | |||||||||||||||
|
|
______________________________
|
|
1
|
The financial information set forth in this table for the fiscal years ended March 31, 2012, 2011, 2010, 2009 and 2008 includes our accounts on a consolidated basis. Since we adopted IFRS with effect from April 1, 2010, our financial information for the 2008 to 2010 fiscal years is presented on a previous Canadian GAAP basis. Accordingly, information for such prior fiscal years may not be comparable to financial information for the 2011 and 2012 fiscal years.
|
|
2
|
Net income (loss) for the fiscal years ended March 31, 2012, 2011, 2010, 2009 and 2008 includes share-based payment expenses of approximately $1,317,000, $1,452,000, $1,238,000, $1,341,000 and $1,287,000, respectively, resulting from fair value accounting for all stock options issued during the year.
|
|
ITEM 7.
|
Management’s Discussion and Analysis of Financial Condition and results of Operations
|
The following discussion and analysis should be read in conjunction with the Consolidated Financial Statements and Notes thereto included in this Form 10-K. See Item 8. “Financial Statements.” This information is not necessarily indicative of future operating results. The Consolidated Financial Statements and Notes thereto have been prepared in accordance with IFRS.
Forward Looking Information
All statements other than statements of historical fact contained in this Annual Report on Form 10-K are forward-looking statements. Forward-looking statements generally are accompanied by words such as “anticipate,” “believe,” “estimate,” “intend,” “project,” “potential” or “expect” or similar statements. The forward-looking statements were prepared on the basis of certain assumptions which relate, among other things, to the demand for and cost of marketing our services, the volume and total value of transactions processed by merchants utilizing our services, the renewal of material contracts in our business, our ability to anticipate and respond to technological changes, particularly with respect to financial payments and e-Commerce, in a highly competitive industry characterized by rapid technological change and rapid rates of product obsolescence, our ability to develop and market new product enhancements and new products and services that respond to technological change or evolving industry standards, no unanticipated developments relating to previously disclosed lawsuits against us, and the cost of protecting our intellectual property. Even if the assumptions on which the forward-looking statements are based prove accurate and appropriate, the actual results of our operations in the future may vary widely due to technological changes, increased competition, new government regulation or intervention in the industry, general economic conditions and other risks described elsewhere in this Annual Report on Form 10-K. See Part I, Item 1A – “Risk Factors”. Accordingly, the actual results of our operations in the future may vary widely from the forward-looking statements included herein. All forward-looking statements included herein are expressly qualified in their entirety by the cautionary statements in this paragraph.
Overview
We are a financial payment processor operating three separate lines of business: transaction payment processing, intellectual property licensing and check processing. Our transaction payment processing services consist predominantly of Internet-based services, while our check processing services involve predominantly traditional and electronic check processing and recovery services that do not utilize the Internet. While we have historically generated significant amounts of non-recurring revenue associated with our intellectual property licensing initiatives, our transaction payment processing services are (and are expected to be for the foreseeable future) our principal line of business, while our other lines of business (including our electronic check processing services and intellectual property licensing initiatives) are less significant to the financial performance of our company.
TPP Segment
Our TPP segment operations involve financial payment processing, authentication and risk management services. We provide a service that acts as a bank neutral interface between businesses and consumers processing financial or authentication transactions. Our transaction payment processing services are accessible via the Internet and are offered in an application service provider (ASP) model. We focus on product development, project management and third tier technical support of our products and services and rely primarily on strategic business partners to sell and market our products and services. In some instances, our transaction payment processing services and payment products are integrated into third party products in target vertical markets. Our revenues are derived from one-time set-up fees, monthly gateway fees, and transaction fees paid to us by merchants. Transaction fees are recognized in the period in which the transaction occurs. Gateway fees are monthly subscription fees charged to our merchant customers for the use of our payment gateway and are recognized in the period in which the service is provided. Set-up fees represent one-time charges for initiating our processing services. Although these fees are generally paid at the commencement of the agreement, they are recognized ratably over the estimated average life of the merchant relationship, which is determined through a series of analyses of active and deactivated merchants. We currently service a merchant base of over 13,000 customers primarily in Canada.
IPL Segment
Our IPL segment operations involve licensing our intellectual property estate, which includes five U.S. patents describing electronic check processing methods. Licenses to our intellectual property estate are generally provided to clients based on usage of the technology embodied in the patent(s) being licensed. Some licensees pay ‘running royalties,’ which is a pay-as-you-go model, and other licensees pay a ‘one-time,’ fully paid-up royalty amount, also based on usage. Clients’ usage pertaining to these one-time, fully paid-up licenses is contractually determined and in some cases, in order to determine usage and to facilitate the negotiation of a license agreement, the commencement of litigation and the discovery process inherent therein (to determine usage), is employed. These one-time, fully paid-up licenses are also non-exclusive, similar to the non-exclusive nature of many software licensing arrangements treated as product sales, and the consideration is fixed and non-refundable with no trailing royalties or other variable consideration. See “Item 1. – Business.”
CP Segment
Our CP segment operations involve primary and secondary check collection including electronic check re-presentment (RCK). Our check processing services involve return check management such as traditional and electronic recovery services to retail clients wherein we typically receive revenue when we are successful at recovering the principal amount of the original transaction on behalf of the client. In some instances we also earn a percentage of the principal amount and in other instances our secondary recovery services provide for us to earn additional fees when legal action is required. Our check processing services are provided in the United States and are operated from our Wichita, Kansas location.
Within these segments, performance is measured based on revenue, factoring in interest income and expenses, amortization and depreciation, and earnings from operations before income taxes from each segment. There are no transactions between segments. We do not generally allocate corporate or centralized marketing and general and administrative expenses to our business unit segments because these activities are managed separately from the business units.
General Market Conditions
We operate in a highly competitive business environment that has many risks. Critical risk factors that affect or may affect us and the financial payment processing industry include changes in the level of spending by and transactions being processed for our customers and the ongoing credit worthiness and financial solvency of our customers. We believe that a prolonged global recession or economic downturn could affect consumer confidence and spending patterns which we believe could have a negative impact on the business of our customers and ultimately have a material adverse effect on our results of operations and financial condition. A full discussion of each of these risk factors (in addition to several other risk factors) is disclosed in Item 1A.
Results of Operations
We qualify as a foreign private issuer in the U.S. for purposes of the Exchange Act. As such, we file our consolidated financial statements with the Securities and Exchange Commission (“SEC”) under IFRS without a reconciliation to generally accepted accounting principles in the U.S. (“U.S. GAAP”). It is possible that certain of our accounting policies under IFRS could be different from U.S. GAAP.
In addition, due to our conversion to IFRS, we are neither able nor required to present a three-year comparative analysis of our statements of earnings, equity and cash flows. As a result, unlike our past Annual Reports on Form 10-K, the following discussion of our Results of Operations in this Form 10-K is limited to a discussion of our fiscal 2012 year compared to our fiscal 2011 year.
Fiscal year 2012 compared to Fiscal year 2011
|
Years ended March 31,
|
Variance
|
|||||||||||||||
|
2012
|
2011
|
$ | % | |||||||||||||
|
Revenue
|
$ | 34,917,000 | $ | 47,160,000 | (12,243,000 | ) | (26.0 | ) | ||||||||
|
Costs of revenue
|
17,269,000 | 22,782,000 | (5,513,000 | ) | (24.2 | ) | ||||||||||
|
Gross profit
|
17,648,000 | 24,378,000 | (6,730,000 | ) | (27.6 | ) | ||||||||||
|
Operating expenses
|
||||||||||||||||
|
General and administrative
|
4,547,000 | 4,632,000 | (85,000 | ) | (1.8 | ) | ||||||||||
|
Sales and marketing
|
1,080,000 | 1,161,000 | (81,000 | ) | (7.0 | ) | ||||||||||
|
Product development and enhancement
|
1,169,000 | 723,000 | 446,000 | 61.7 | ||||||||||||
|
Income before other income (expenses) and income taxes
|
10,852,000 | 17,862,000 | (7,010,000 | ) | (39.2 | ) | ||||||||||
|
Foreign exchange gain (loss)
|
57,000 | (205,000 | ) | 262,000 | - | |||||||||||
|
Other expense
|
- | (5,000 | ) | 5,000 | - | |||||||||||
|
Interest income
|
129,000 | 48,000 | 81,000 | 168.8 | ||||||||||||
|
Income before income taxes
|
11,038,000 | 17,700,000 | (6,662,000 | ) | (37.6 | ) | ||||||||||
|
Income tax expense
|
||||||||||||||||
|
Current
|
4,023,000 | 5,203,000 | (1,180,000 | ) | (22.7 | ) | ||||||||||
|
Deferred
|
287,000 | 2,498,000 | (2,211,000 | ) | (88.5 | ) | ||||||||||
| 4,310,000 | 7,701,000 | (3,391,000 | ) | (44.0 | ) | |||||||||||
|
Net income
|
$ | 6,728,000 | $ | 9,999,000 | (3,271,000 | ) | (32.7 | ) | ||||||||
Revenue
The following table compares the revenue generated by all three of our business segments during the fiscal years ended March 31, 2012 and 2011:
|
Years ended March 31,
|
Variance
|
|||||||||||||||
|
2012
|
2011
|
|||||||||||||||
|
2012
|
2011
|
$ | % | |||||||||||||
|
Revenue
|
||||||||||||||||
|
TPP Segment:
|
||||||||||||||||
|
Transaction fees
|
$ | 13,454,000 | $ | 10,369,000 | 3,085,000 | 29.8 | ||||||||||
|
One-time set-up fees recognized
|
245,000 | 200,000 | 45,000 | 22.5 | ||||||||||||
|
Monthly fees including gateway
|
2,195,000 | 1,589,000 | 606,000 | 38.1 | ||||||||||||
|
Software customization fees
|
244,000 | 299,000 | (55,000 | ) | (18.4 | ) | ||||||||||
|
Other
|
308,000 | 300,000 | 8,000 | 2.7 | ||||||||||||
| 16,446,000 | 12,757,000 | 3,689,000 | 28.9 | |||||||||||||
|
IPL Segment:
|
||||||||||||||||
|
Non-recurring licensing
|
14,450,000 | 30,299,000 | (15,849,000 | ) | (52.3 | ) | ||||||||||
|
Ongoing/Recognized deferred
|
1,719,000 | 1,771,000 | (52,000 | ) | (2.9 | ) | ||||||||||
| 16,169,000 | 32,070,000 | (15,901,000 | ) | (49.6 | ) | |||||||||||
|
CP Segment:
|
||||||||||||||||
|
Secondary check collections
|
1,958,000 | 1,977,000 | (19,000 | ) | (1.0 | ) | ||||||||||
|
Primary check collections
|
332,000 | 344,000 | (12,000 | ) | (3.5 | ) | ||||||||||
|
Other
|
12,000 | 12,000 | - | - | ||||||||||||
| 2,302,000 | 2,333,000 | (31,000 | ) | (1.3 | ) | |||||||||||
|
Total revenue
|
$ | 34,917,000 | $ | 47,160,000 | (12,243,000 | ) | (26.0 | ) | ||||||||
The decrease is total revenue for fiscal 2012 is primarily attributable to the decrease in our non-recurring IPL segment revenue of approximately $15,849,000 offset by an increase in our TPP segment revenue of approximately $3,689,000.
TPP Segment
Revenue pertaining to our TPP segment consists of transaction fees, one-time set-up fees, monthly fees including gateway fees and software customization fees. Total revenue from our TPP segment increased by approximately $3,689,000, or approximately 28.9%. Transaction fees for fiscal year 2012 increased approximately $3,085,000 or approximately 29.8%; the amortized portion of one-time set-up fees recognized increased approximately $45,000 or approximately 22.5%; and monthly fees including gateway fees for fiscal year 2012 increased approximately $606,000 or approximately 38.1%. The increase in these components of TPP segment revenue was primarily attributable to a 28% increase in our merchant base during fiscal year 2012 as compared to fiscal year 2011.
IPL Segment
Revenue from licensing our patented intellectual property decreased by approximately $15,901,000 or approximately 49.6% primarily due to the recognition of approximately $14,450,000 in non-recurring revenue from the License Agreements entered into during our fiscal year 2012 as compared to approximately $30,299,000 in non-recurring revenue recognized from the License Agreements entered into during our fiscal year 2011.
CP Segment
CP segment revenue for fiscal year 2012 decreased approximately $31,000 or approximately 1.3% primarily due to a decrease in collections of the principal amount and related fees of returned checks assigned for primary and secondary recovery.
Costs of revenue
The following table compares the costs of revenue incurred by all three of our business segments during the fiscal years ended March 31, 2012 and 2011:
|
Years ended March 31,
|
Variance
|
|||||||||||||||
|
2012
|
2011
|
$ | % | |||||||||||||
|
Costs of revenue
|
||||||||||||||||
|
TPP Segment
|
$ | 9,876,000 | $ | 7,706,000 | 2,170,000 | 28.2 | ||||||||||
|
IPL Segment
|
5,708,000 | 13,316,000 | (7,608,000 | ) | (57.1 | ) | ||||||||||
|
CP Segment
|
1,454,000 | 1,561,000 | (107,000 | ) | (6.9 | ) | ||||||||||
|
Share-based payments
|
180,000 | 139,000 | 41,000 | 29.5 | ||||||||||||
|
Depreciation of property and equipment
|
51,000 | 60,000 | (9,000 | ) | (15.0 | ) | ||||||||||
|
Total
|
$ | 17,269,000 | $ | 22,782,000 | (5,513,000 | ) | (24.2 | ) | ||||||||
Costs of revenue consists primarily of costs incurred by the TPP, IPL and CP operating segments. Within our TPP segment, these costs are incurred in the delivery of electronic payment transaction services and customer service support and include processing and interchange fees paid, other third-party fees, personnel costs and associated benefits. IPL segment costs of revenue are primarily legal retention fees and legal disbursement costs incurred in generating licensing revenue. CP segment costs of revenue are primarily incurred in the delivery of check collection services and include third-party fees, personnel costs and associated benefits.
Costs of revenue decreased for fiscal year 2012 by approximately $5,513,000 or approximately 24.2%. This decrease was primarily attributable to a decrease of approximately $7,608,000 in IPL segment costs of revenue which was primarily due to a decrease of approximately $7,355,000 in the costs (primarily legal costs) incurred in connection with the License Agreements entered into during fiscal year 2012 as compared to fiscal year 2011. TPP segment costs of revenue increased approximately $2,170,000 or approximately 28.2%, primarily due to an increase of approximately 21.9% in our transaction costs which include interchange, assessments and other transaction fees which coincided with increased transaction processing revenue. CP segment costs of revenue decreased approximately $107,000 or approximately 6.9% which coincided with the decrease in CP segment revenue for fiscal year 2012. In fiscal year 2012, costs of revenue was approximately $3,322,000, $5,611,000, $3,015,000 and $5,321,000 in each of the first, second, third and fourth quarters, respectively.
General and administrative expenses
The following table compares general and administrative expenses incurred by all three of our business segments as well as our corporate and support functions during the fiscal years ended March 31, 2012 and 2011:
|
Years ended March 31,
|
Variance
|
|||||||||||||||
|
2012
|
2011
|
|||||||||||||||
|
2012
|
2011
|
$ | % | |||||||||||||
|
General and administrative expenses
|
||||||||||||||||
|
TPP Segment
|
$ | 1,022,000 | $ | 1,085,000 | (63,000 | ) | (5.8 | ) | ||||||||
|
IPL Segment
|
38,000 | 76,000 | (38,000 | ) | (50.0 | ) | ||||||||||
|
CP Segment
|
372,000 | 517,000 | (145,000 | ) | (28.0 | ) | ||||||||||
|
Share-based payments
|
1,002,000 | 985,000 | 17,000 | 1.7 | ||||||||||||
|
Depreciation of property and equipment
|
29,000 | 39,000 | (10,000 | ) | (25.6 | ) | ||||||||||
|
Amortization of patents
|
167,000 | 167,000 | - | - | ||||||||||||
|
Other unallocated general and administrative expenses
|
1,917,000 | 1,763,000 | 154,000 | 8.7 | ||||||||||||
|
Total
|
$ | 4,547,000 | $ | 4,632,000 | (85,000 | ) | (1.8 | ) | ||||||||
General and administrative expenses consist primarily of personnel costs including associated share-based payments and employment benefits, office facilities, travel, public relations and professional service fees, which include legal fees, audit fees and SEC and related compliance costs. General and administrative expenses also include the costs of corporate and support functions including our executive leadership and administration groups, finance, information technology, legal, human resources and corporate communication costs.
General and administrative expenses decreased approximately $85,000 or approximately 1.8% for fiscal year 2012 compared to fiscal year 2011. TPP segment general and administrative expenses decreased approximately $63,000 or 5.8% primarily as a result of a decrease in legal fees associated with the patent infringement complaint filed against our subsidiary, Beanstream Internet Commerce Inc. in April 2009 of approximately $157,000 or approximately 73.7%. CP segment expenses decreased approximately $145,000 or approximately 28% primarily attributable to a decrease of approximately $132,000 in legal fees associated with the patent infringement complaint filed against our subsidiary, LML Payment Systems Corp. in April 2009. This complaint was dismissed with prejudice during the second quarter of fiscal 2011.
Sales and Marketing
Sales and marketing expenses consist primarily of salaries paid to sales staff, sales commissions, sales operations and other personnel-related expenses, travel and related expenses, trade shows, costs of lead generation, consulting fees and costs of marketing programs, such as internet, print and direct mail advertising costs. Sales and marketing expenses also include the amortization expense for partner relationships and merchant contracts.
Sales and marketing expense decreased to approximately $1,080,000 from approximately $1,161,000 for fiscal year 2012 and 2011 respectively, a decrease of approximately $81,000 or approximately 7.0% which was primarily attributable to a decrease of approximately $172,000 in share-based payments offset by an increase of approximately $91,000 in our TPP segment sales and marketing expenses from approximately $557,000 for fiscal year 2011 to approximately $648,000 for fiscal year 2012. The increase in TPP segment sales and marketing expenses is primarily attributable to an increase in wages and commissions of approximately $77,000 or approximately 16.1%, resulting from an increase in staffing levels. Amortization expense for partner relationships and merchant contracts were approximately $389,000 for fiscal year 2012 and 2011 respectively.
Product Development and Enhancement
Product development and enhancement expenses consist primarily of compensation and related costs of employees engaged in the research, design and development of new services and in the improvement and enhancement of the existing product and service lines. Product development and enhancement expenses also include the amortization expense for existing technology.
Product development and enhancement expenses were approximately $1,169,000 for fiscal year 2012 as compared to approximately $723,000 for fiscal year 2011, an increase of approximately $446,000 or approximately 61.7%. The increase is primarily attributable to an increase in our TPP segment product development and enhancement expenses of approximately $430,000 from approximately $498,000 for fiscal year 2011 to approximately $928,000 for fiscal year 2012. The increase in TPP product development and enhancement expenses is primarily attributable to an increase in wages and benefits of approximately $394,000 or approximately 85.7%, resulting from an increase in staffing levels for the fiscal year 2012 as compared to the fiscal year 2011. The increase in staff was required to support the development of our software customization business as well as supporting new and existing product and service lines. Amortization expense for existing technology was approximately $106,000 for fiscal years 2012 and 2011, respectively.
Foreign exchange gain (loss)
Foreign exchange gain was approximately $57,000 for fiscal year 2012 compared to a foreign exchange loss of approximately $205,000 for fiscal year 2011. The current fiscal year foreign exchange gain was primarily attributable to a strengthening U.S. dollar in relation to the Canadian dollar. The U.S. dollar strengthened by approximately 2.9% from the prior fiscal year end date of March 31, 2011, to the current fiscal year end date of March 31, 2012. As our TPP segment’s functional currency is the Canadian dollar, net assets originating in U.S. dollars have exposure with a strengthening U.S. dollar and resulted in foreign exchange gains of approximately $161,000. The foreign exchange gain for our TPP segment was offset by a foreign exchange loss of approximately $79,000 on short-term investments originating in Canadian dollars.
Interest income
Interest income for fiscal year 2012 increased to approximately $129,000 from approximately $48,000 for fiscal year 2011 primarily due to an increase in interest bearing cash and short-term investments.
Income Tax Expense
Income tax expense consists of current income taxes of approximately $4,023,000 for the fiscal year 2012 compared to approximately $5,203,000 for the fiscal year 2011, a decrease of approximately $1,180,000 which is primarily attributable to the decrease of income before income taxes of approximately $6,662,000 from approximately $17,700,000 for fiscal year 2011 to approximately $11,038,000 for fiscal year 2012 resulting primarily from the decrease in income attributable to the licensing activity of our IPL segment during fiscal year 2012. Deferred income tax expense was approximately $287,000 for fiscal year 2012 compared to approximately $2,498,000 for fiscal year 2011, a decrease of approximately $2,211,000 or approximately 88.5%. This decrease was primarily attributable to a decrease in deferred income tax assets during fiscal year 2012 resulting from the utilization of prior years’ Canadian non-capital tax losses against current fiscal year taxable income of our TPP segment.
As of March 31, 2012, we had Canadian non-capital loss carry-forwards of approximately $154,000. If we are not able to use these loss carry-forwards, the Canadian loss carry-forwards will expire in 2022.
Net Income
Net income was approximately $6,728,000 for fiscal year 2012 compared to net income of approximately $9,999,000 for fiscal year 2011, a decrease of approximately $3,271,000. This decrease is primarily attributable to the decrease in licensing activity of our IPL segment during fiscal year 2012. Earnings per basic share were approximately $0.24 and per diluted share were approximately $0.23 for fiscal year 2012 as compared to earnings per basic share of approximately $0.37 and per diluted share of approximately $0.36 for fiscal year 2011, a decrease in earnings per both basic and diluted share of approximately $0.13.
Liquidity and Capital Resources
Our liquidity and financial position consisted of approximately $28,552,000 in working capital as of March 31, 2012 compared to approximately $20,251,000 in working capital as of March 31, 2011, an increase of approximately $8,301,000. The increase in working capital was primarily attributable to an increase in cash and cash equivalents and short-term investments of approximately $3,157,000 resulting primarily from compensation received from license agreements entered into during the fiscal year 2012 net of taxes paid of approximately $3,928,000. Cash provided by operating activities decreased by approximately $16,335,000 from approximately $19,458,000 for fiscal year 2011 to approximately $3,123,000 for fiscal year 2012. The decrease in cash provided by operating activities was primarily attributable to a decrease in cash received from license agreements of approximately $8,493,000 for fiscal year 2012 and primarily attributable to a decrease in corporate taxes payable of $9,032,000. Cash used in investing activities was approximately $3,360,000 for fiscal year 2012 as compared to approximately $63,000 for fiscal year 2011, an increase of approximately $3,297,000. This increase was primarily attributable to the acquisition of short-term investments totaling approximately $3,295,000 during fiscal year 2012. Cash provided by financing activities was approximately $224,000 for fiscal year 2012 as compared to approximately $2,238,000 for fiscal year 2011, a decrease of approximately $2,014,000 which was primarily the result of a decrease in proceeds from the exercise of stock options and warrants from approximately $2,249,000 in fiscal year 2011 to approximately $227,000 in fiscal year 2012.
Management tracks projected cash collections and projected cash outflows to monitor short-term liquidity requirements and to make decisions about future resource allocations and take actions to adjust our expenses with the goal of remaining cash flow positive from operations on an annual basis. We believe that, as of March 31, 2012, our cash resources will be sufficient to meet our operating requirements for the next twelve months.
In light of our strategic objective of acquiring electronic payment volume across all our financial payment processing services and strengthening our position as a financial payment processor, our long-term plans may include the strategic acquisition of complementary businesses, products or technologies and may also include instituting actions against other entities who we believe are infringing our intellectual property. While we believe that existing cash and cash equivalent balances and potential cash flows from operations should satisfy our long-term cash requirements, we may nonetheless have to raise additional funds for these purposes, either through equity or debt financing, as appropriate. There can be no assurance that such financing would be available on acceptable terms, if at all.
Contingencies
See Note 14. Commitments and Contingencies, Note 15. Subsequent Events, and Part I, Item 3. Legal Proceedings for a discussion of contingencies.
Contractual Obligations
In our fiscal year ended March 31, 2010, we entered into a lease agreement with Ikon Financial Services to finance an equipment purchase of $11,269. Lease payments are due monthly under the lease term of sixty (60) months. Title to the equipment will transfer to the Corporation at the expiration of the lease.
The following table summarizes our significant contractual obligations and commitments as of March 31, 2012:
|
Payments due by:
|
||||||||||||||||||||
|
(in thousands)
|
||||||||||||||||||||
|
Less than
|
1 to 3
|
4 to 5
|
More than
|
|||||||||||||||||
|
Total
|
1 year
|
years
|
years
|
5 years
|
||||||||||||||||
|
Long-Term Debt Obligations
|
$ | - | $ | - | $ | - | $ | - | $ | - | ||||||||||
|
Capital Lease Obligations
|
7 | 2 | 5 | - | - | |||||||||||||||
|
Operating Lease Obligations
|
565 | 340 | 224 | 1 | - | |||||||||||||||
|
Purchase Obligations
|
22 | 22 | - | - | - | |||||||||||||||
|
Total
|
$ | 594 | $ | 364 | $ | 229 | $ | 1 | $ | - | ||||||||||
Critical Accounting Policies and Estimates
Our financial statements have been prepared in accordance with IFRS and form the basis for the following discussion and analysis of critical accounting policies and estimates. We make estimates and assumptions that affect the reported amounts of assets, liabilities, revenues and expenses and related disclosure of contingent assets and liabilities during the course of preparing these financial statements. On a regular basis, we evaluate our estimates and assumptions including those related to the recognition of revenues, valuation of other long-lived assets and share-based payments.
We base our estimates on historical experience and on various other assumptions that we believe to be reasonable. These estimates form the basis of our judgments about the carrying value of assets and liabilities that are not readily apparent from other sources. Our actual results may differ from those estimates.
The following critical accounting policies reflect the more significant estimates and assumptions we have used in the preparation of our financial statements.
Revenue Recognition
TPP Segment
Our TPP segment revenues are derived from transaction fees paid to us by merchants, monthly gateway fees and one-time set-up fees. Transaction fees are recognized in the period in which the transaction occurs. Gateway fees are monthly subscription fees charged to our merchant customers for the use of our payment gateway. Gateway fees are recognized in the period in which the service is provided. Set-up fees represent one-time charges for initiating our processing services. Although these fees are generally paid at the commencement of the agreement, they are recognized ratably over the estimated average life of the merchant relationship, which is determined through a series of analyses of active and deactivated merchants.
IPL Segment
Our IPL segment revenues are derived from licensing fees paid by licensees of our intellectual property. Licensing fees are based on usage of the technology embodied in the intellectual property being licensed. In some instances, licensees pay licensing fees on a running royalty basis, which is a pay-as-you-go model, and in other instances, licensees pay a one-time, non-recurring license fee amount based upon usage (“Paid-up Licenses”). Fees from Paid-up Licenses are fully due and payable up front at the inception of each licensing arrangement and are non- refundable.
Usage pertaining to Paid-up Licenses is contractually determined and in some cases, in order to determine usage and to facilitate the negotiation of a license agreement, the commencement of litigation and the discovery process inherent therein (to determine usage), is sometimes employed. When we receive licensing payments on a one-time, fully paid-up basis, regardless of whether the licensees entered into license agreements with or without concurrent litigation, we follow the provisions of International Accounting Standard 18, Revenue Recognition (“IAS 18”).
CP Segment
Check recovery fees are recognized in the period when cash is received for the services performed. These services typically consist of recovering the face amount of the original transaction and a service or collection fee. We are typically paid the service fee only when we are successful in the recovery of the face amount of the original transaction on behalf of our client.
Goodwill, Purchased Intangible Assets and Other Long-Lived Assets — Impairment Assessments
We make judgments about the recoverability of purchased intangible assets and other long-lived assets whenever events or changes in circumstances indicate that an other-than-temporary impairment in the remaining value of the assets recorded on our balance sheet may exist. We test the impairment of goodwill and indefinite-life intangibles annually in our fourth fiscal quarter or more frequently if indicators of impairment arise. The timing of the formal annual test may result in charges to our statement of operations in our fourth fiscal quarter that could not have been reasonably foreseen in prior periods. In order to estimate the recoverable amount of long-lived assets, we typically make various assumptions about the future prospects for the business that the asset relates to, consider market factors specific to that business and estimate future cash flows to be generated by that business. Based on these assumptions and estimates, we determine whether we need to record an impairment charge to reduce the value of the asset stated on our balance sheet to reflect its estimated recoverable amount. Assumptions and estimates about future values and remaining useful lives are complex and often subjective. They can be affected by a variety of factors, including external factors such as industry and economic trends, and internal factors such as changes in our business strategy and our internal forecasts. Although we believe the assumptions and estimates we have made in the past have been reasonable and appropriate, different assumptions and estimates could materially impact our reported financial results. More conservative estimates of the anticipated future benefits from these businesses could result in impairment charges, which would decrease net income and result in lower asset values on our balance sheet. Conversely, less conservative estimates could result in smaller or no impairment charges, higher net income and higher asset values. As of March 31, 2012, we had recorded goodwill in connection with our acquisition in 2007 of Beanstream with a carrying value of approximately $17,874,000. Significant judgments could be required to evaluate goodwill for impairment in the future including the determination of reporting units, estimating future cash flows, determining appropriate discount rates and other assumptions. We evaluate the goodwill related to the Beanstream acquisition on an annual basis as of March 31 or when indicators of impairment may exist.
We also evaluate the other intangible assets related to the Beanstream acquisition on an annual basis as of March 31 or when indicators of impairment may exist. As of March 31, 2012, we had recorded other intangible assets in connection with our acquisition of Beanstream, with a carrying value of approximately $3,720,000, consisting of partner relationships, merchant contracts, existing technology and trade names. The value of the partner relationships as well as the merchant contracts were derived by considering, among other factors, the expected income and discounted cash flows to be generated from such contracts and relationships. The value of the existing technology was derived by considering, among other factors, the expected income and discounted cash flows to be generated, taking into account risks related to the characteristics and applications of the technology and assessments of the life cycle state of the technology. The value of the trade name was derived by considering, among other factors, expected income and discounted cash flows to be generated, also taking into account the expected period in which we intend to utilize the trade name.
Share-based payments
We issue stock options to our employees and directors under the terms of our 1996 Stock Option Plan and our 2009 Stock Incentive Plan. We also have a 1998 Stock Incentive Plan, however, its 10-year term has expired and, accordingly, the shares that had remained available for grant pursuant to additional options or other equity awards may no longer be granted under that plan (although, outstanding awards under the 1998 Stock Incentive Plan are not affected by the expiration of the term and will continue to be governed by the provisions of the plan).
We determine the assumptions used in computing the fair value of the stock options by estimating their expected useful lives, giving consideration to the vesting periods, contractual lives, actual employee forfeitures and the relationship between the exercise price and the historical market value of our common stock, among other factors. The risk-free interest rate is the federal government zero-coupon bond rate for the relevant expected life. The fair value of the stock options are estimated on the date of grant using the Black-Scholes option-pricing model.
Deferred Income Taxes and Valuation Allowance
Deferred income taxes reflect the net tax effects of temporary differences between the carrying amount of our assets and liabilities for financial reporting purposes and the amounts used for income tax purposes. We assess the likelihood that our deferred tax assets will be recovered from our future taxable income and, to the extent we believe that recovery is not likely, we establish a valuation allowance. We consider all available positive and negative evidence including our past operating results, the existence of cumulative losses and our forecast of future taxable income. In determining future taxable income, we are responsible for assumptions utilized including the amount of pre-tax operating income, the reversal of temporary differences and the implementation of feasible and prudent tax planning strategies. These assumptions require significant judgment about the forecasts of future taxable income and are consistent with the plans and estimates we use to manage our underlying businesses. Based on various factors, including our taxable income for the past year and estimates of future profitability, we did not record a valuation allowance against our net deferred tax assets. If we fail to achieve future taxable income assumed in the calculation of our deferred tax assets or if we fail to implement feasible and prudent tax planning strategies, we may be required to offset deferred tax assets with a valuation allowance, resulting in an additional tax expense. The change in the valuation could have a material adverse impact on our profitability and results of operations. If we do not achieve sufficient Canadian taxable income in future years to utilize all or some of our net operating loss carry-forwards, they will expire. See Note 13 to our Consolidated Financial Statements included elsewhere in this report.
Foreign Currency Translation
Except as described below, our functional and reporting currency is the United States dollar. Monetary assets and liabilities denominated in foreign currencies are translated in accordance with IAS 21 “The Effect of Changes in Foreign Exchange Rates” (which is consistent with the FASB issued authoritative guidance regarding foreign currency translation) using the exchange rate prevailing at the balance sheet date. Gains and losses arising on settlement of foreign currency denominated transactions or balances are included in the determination of income.
The functional currency of our Canadian Beanstream subsidiary is the Canadian dollar. Beanstream’s financial statements are translated to United States dollars under the current rate method in accordance with IAS 21 (which is consistent with the FASB issued authoritative guidance regarding foreign currency translation). Beanstream’s assets and liabilities are translated into U.S. dollars at rates of exchange in effect at the balance sheet date. Average rates for the year are used to translate Beanstream’s revenues and expenses. The cumulative translation adjustment is reported as a component of accumulated other comprehensive income.
Conversion to IFRS
We adopted IFRS on April 1, 2011 with an effective transition date of April 1, 2010. IFRS 1 First Time Adoption of International Financial Reporting Standards sets forth guidance for the initial adoption of IFRS. Under IFRS 1, the standards are applied retrospectively with all adjustments impacting earlier periods recorded as an adjustment to opening retained earnings on the date of transition to IFRS or, if appropriate, another category of equity unless certain optional exemptions are applied. We have applied the following exemptions to our opening consolidated statement of financial position dated April 1, 2010:
|
·
|
Business Combinations – IFRS 1 indicates that a first-time adopter may elect not to apply IFRS 3 Business Combinations retrospectively to business combinations before the date of transition to IFRS. We have elected to use this election and will apply IFRS 3 to future business combinations.
|
|
·
|
Consolidated and Separate Financial Statements – according to IFRS 1, if a company elects to apply IFRS 3 Business Combinations retrospectively, certain provisions of IAS 27 Consolidated and Separate Financial Statements must also be applied retrospectively. As we have elected to apply IFRS 3 prospectively, we have also elected to apply the provisions of IAS 27 prospectively.
|
|
·
|
Share-Based Payment – IFRS 1 encourages, but does not require, first time adopters to apply IFRS 2 Share-based Payment to equity instruments that were granted on or before November 7, 2002, or equity instruments that were granted subsequent to November 7, 2002 and vested before the later of the date of transition to IFRS and January 1, 2005. We have elected to take advantage of the exemption and not apply IFRS 2 to awards that vested prior to April 1, 2010.
|
IFRS employs a conceptual framework that is similar to Canadian GAAP, however, significant differences exist in certain matters of recognition, measurement and disclosure. While adoption of IFRS has not changed our actual cash flows, it has resulted in changes to our reported financial position, statements of earnings and comprehensive income and statements of cash flows. In order to allow the users of the financial statements to better understand these changes, our Canadian GAAP consolidated statements of financial position as at April 1, 2010 and March 31, 2011, consolidated statements of earnings and comprehensive income for the year ended March 31, 2011 and consolidated statements of cash flows for the year ended March 31, 2011 have been reconciled to IFRS with the resulting differences as explained below:
|
·
|
IFRS 2 “Share-based Payment.” Canadian GAAP allows the preparer to choose from two methods, namely, (a) treating all options granted on a particular date and with the same terms and conditions as one pool (pooling method) and (b) treating options with different vesting dates as different grants (vesting method). The cost of the share-based payment for both methods is calculated according to the Black-Scholes Option Pricing Model. For the pooling method, the total expense is amortized on a straight line basis over the longest vesting period of all of the options in the pool resulting in equal charges to income over the period. The vesting method looks at each vesting tranche and the expense associated with that particular tranche and amortizes the expense in a straight line fashion. While the vesting method does not increase overall expense, it does result in our recognizing a greater portion of the expense earlier in the option term and recognizing a lesser portion of the expense later in the option term compared to the pooling method. Under Canadian GAAP, we had been applying the pooling method. However, under IFRS, the vesting method is the only method available and as a result, we will be recognizing a greater portion of stock option expense earlier in the option terms than we had been recognizing under Canadian GAAP.
|
|
·
|
Using the vesting method as required under IFRS, share-based payments for the year ended March 31, 2011 were approximately $1,452,000 as opposed to approximately $1,163,000 as recorded under Canadian GAAP, a difference of approximately $288,000.
|
|
·
|
Deferred tax assets: Under Canadian GAAP, deferred tax assets were presented as current (expected to be utilized within twelve months) and non-current. Under IFRS, all deferred tax assets are presented as non-current.
|
|
·
|
Warrants: Under Canadian GAAP, warrants were included in contributed surplus, whereas, under IFRS, warrants are presented as a separate component of equity in the consolidated statements of financial position.
|
|
·
|
Amortization and depreciation expense: Under Canadian GAAP, depreciation of property and equipment and amortization of patents and intangible assets were separately presented in the consolidated statements of earnings and comprehensive income. Under IFRS, amortization and depreciation expenses are included within the appropriate operating expense category and not separately presented.
|
The Canadian GAAP consolidated statement of financial position and equity reconciliation at April 1, 2010 has been reconciled to IFRS as follows:
|
Previously reported under Canadian GAAP
|
Reclassifications under IFRS
|
Share-based payments
|
Restated under IFRS
|
|||||||||||||
|
ASSETS
|
||||||||||||||||
|
Current assets
|
||||||||||||||||
|
Cash and cash equivalents
|
$ | 5,069,763 | $ | 5,069,763 | ||||||||||||
|
Funds held for merchants
|
5,804,752 | 5,804,752 | ||||||||||||||
|
Restricted cash
|
175,000 | 175,000 | ||||||||||||||
|
Accounts receivable, less allowance of $31,463
|
799,584 | 799,584 | ||||||||||||||
|
Corporate taxes receivable
|
1,072,930 | 1,072,930 | ||||||||||||||
|
Prepaid expenses
|
416,507 | 416,507 | ||||||||||||||
|
Current portion of deferred tax assets
|
1,280,860 | $ | (1,280,860 | ) | - | |||||||||||
|
Total current assets
|
14,619,396 | (1,280,860 | ) | - | 13,338,536 | |||||||||||
|
Property and equipment, net
|
219,580 | 219,580 | ||||||||||||||
|
Patents
|
455,304 | 455,304 | ||||||||||||||
|
Restricted cash
|
255,247 | 255,247 | ||||||||||||||
|
Deferred tax assets
|
2,406,473 | 1,280,860 | 3,687,333 | |||||||||||||
|
Goodwill
|
17,874,202 | 17,874,202 | ||||||||||||||
|
Other intangible assets
|
4,710,337 | 4,710,337 | ||||||||||||||
|
Other assets
|
20,641 | 20,641 | ||||||||||||||
|
Total assets
|
$ | 40,561,180 | $ | - | $ | - | $ | 40,561,180 | ||||||||
|
LIABILITIES
|
||||||||||||||||
|
Current liabilities
|
||||||||||||||||
|
Accounts payable
|
$ | 836,274 | $ | 836,274 | ||||||||||||
|
Accrued liabilities
|
1,040,443 | 1,040,443 | ||||||||||||||
|
Corporate taxes payable
|
- | - | ||||||||||||||
|
Funds due to merchants
|
5,804,752 | 5,804,752 | ||||||||||||||
|
Current portion of obligations under finance lease
|
11,195 | 11,195 | ||||||||||||||
|
Current portion of deferred revenue
|
1,325,983 | 1,325,983 | ||||||||||||||
|
Total current liabilities
|
9,018,647 | - | - | 9,018,647 | ||||||||||||
|
Obligations under finance lease
|
9,840 | 9,840 | ||||||||||||||
|
Deferred revenue
|
2,155,162 | 2,155,162 | ||||||||||||||
|
Total liabilities
|
11,183,649 | - | - | 11,183,649 | ||||||||||||
|
EQUITY
|
||||||||||||||||
|
Capital stock
|
||||||||||||||||
|
Class A, preferred stock, $1.00 CDN par value, 150,000,000 shares authorized, issuable in series, none issued or outstanding
|
- | - | ||||||||||||||
|
Class B, preferred stock, $1.00 CDN par value, 150,000,000 shares authorized, issuable in series, none issued or outstanding
|
- | - | ||||||||||||||
|
Common shares, no par value, 100,000,000 shares authorized, 27,241,408 issued and outstanding
|
50,152,385 | 50,152,385 | ||||||||||||||
|
Contributed surplus
|
7,952,343 | $ | (649,500 | ) | $ | 684,884 | 7,987,727 | |||||||||
|
Warrants
|
- | 649,500 | 649,500 | |||||||||||||
|
Deficit
|
(28,877,282 | ) | (684,884 | ) | (29,562,166 | ) | ||||||||||
|
Accumulated other comprehensive income
|
150,085 | 150,085 | ||||||||||||||
|
Total equity
|
29,377,531 | - | - | 29,377,531 | ||||||||||||
|
Total liabilities and equity
|
$ | 40,561,180 | $ | - | $ | - | $ | 40,561,180 | ||||||||
The Canadian GAAP consolidated statement of financial position and equity reconciliation at March 31, 2011 has been reconciled to IFRS as follows:
|
Previously reported under Canadian GAAP
|
Reclassifications under IFRS
|
Share-based payments
|
Restated under IFRS
|
|||||||||||||
|
ASSETS
|
||||||||||||||||
|
Current assets
|
||||||||||||||||
|
Cash and cash equivalents
|
$ | 26,917,491 | $ | 26,917,491 | ||||||||||||
|
Funds held for merchants
|
7,164,420 | 7,164,420 | ||||||||||||||
|
Restricted cash
|
175,000 | 175,000 | ||||||||||||||
|
Accounts receivable, less allowance of $28,152
|
1,103,529 | 1,103,529 | ||||||||||||||
|
Corporate taxes receivable
|
101,162 | 101,162 | ||||||||||||||
|
Prepaid expenses
|
266,066 | 266,066 | ||||||||||||||
|
Current portion of deferred tax assets
|
428,240 | $ | (428,240 | ) | - | |||||||||||
|
Total current assets
|
36,155,908 | (428,240 | ) | - | 35,727,668 | |||||||||||
|
Property and equipment, net
|
163,222 | 163,222 | ||||||||||||||
|
Patents
|
287,877 | 287,877 | ||||||||||||||
|
Restricted cash
|
262,644 | 262,644 | ||||||||||||||
|
Deferred tax assets
|
761,507 | 428,240 | 1,189,747 | |||||||||||||
|
Goodwill
|
17,874,202 | 17,874,202 | ||||||||||||||
|
Other intangible assets
|
4,215,187 | 4,215,187 | ||||||||||||||
|
Other assets
|
21,041 | 21,041 | ||||||||||||||
|
Total assets
|
$ | 59,741,588 | $ | - | $ | - | $ | 59,741,588 | ||||||||
|
LIABILITIES
|
||||||||||||||||
|
Current liabilities
|
||||||||||||||||
|
Accounts payable
|
$ | 702,820 | $ | 702,820 | ||||||||||||
|
Accrued liabilities
|
1,390,847 | 1,390,847 | ||||||||||||||
|
Corporate taxes payable
|
4,796,157 | 4,796,157 | ||||||||||||||
|
Funds due to merchants
|
7,164,420 | 7,164,420 | ||||||||||||||
|
Current portion of obligations under finance lease
|
2,460 | 2,460 | ||||||||||||||
|
Current portion of deferred revenue
|
1,420,228 | 1,420,228 | ||||||||||||||
|
Total current liabilities
|
15,476,932 | - | - | 15,476,932 | ||||||||||||
|
Obligations under finance lease
|
7,380 | 7,380 | ||||||||||||||
|
Deferred revenue
|
935,979 | 935,979 | ||||||||||||||
|
Total liabilities
|
16,420,291 | - | - | 16,420,291 | ||||||||||||
|
EQUITY
|
||||||||||||||||
|
Capital stock
|
||||||||||||||||
|
Class A, preferred stock, $1.00 CDN par value, 150,000,000 shares authorized, issuable in series, none issued or outstanding
|
- | - | ||||||||||||||
|
Class B, preferred stock, $1.00 CDN par value, 150,000,000 shares authorized, issuable in series, none issued or outstanding
|
- | - | ||||||||||||||
|
Common shares, no par value, 100,000,000 shares authorized, 28,127,184 issued and outstanding
|
53,557,276 | 53,557,276 | ||||||||||||||
|
Contributed surplus
|
7,959,595 | $ | (113,662 | ) | $ | 973,072 | 8,819,006 | |||||||||
|
Warrants
|
- | 113,662 | 113,662 | |||||||||||||
|
Deficit
|
(18,590,128 | ) | (973,072 | ) | (19,563,201 | ) | ||||||||||
|
Accumulated other comprehensive income
|
394,554 | 394,554 | ||||||||||||||
|
Total equity
|
43,321,297 | - | - | 43,321,297 | ||||||||||||
|
Total liabilities and equity
|
$ | 59,741,588 | $ | - | $ | - | $ | 59,741,588 | ||||||||
The Canadian GAAP consolidated statement of earnings and comprehensive income for the fiscal year ended March 31, 2011 has been reconciled to IFRS as follows:
|
Previously reported under Canadian GAAP
|
Reclassification under IFRS
|
Share-based payments
|
Restated under IFRS
|
|||||||||||||
|
REVENUE
|
$ | 47,160,490 | $ | - | $ | - | $ | 47,160,490 | ||||||||
|
COSTS OF REVENUE
|
22,701,437 | 60,229 | 20,305 | 22,781,971 | ||||||||||||
|
GROSS PROFIT
|
24,459,053 | (60,229 | ) | (20,305 | ) | 24,378,519 | ||||||||||
|
OPERATING EXPENSES
|
||||||||||||||||
|
General and administrative
|
4,337,980 | 206,685 | 87,401 | 4,632,066 | ||||||||||||
|
Sales and marketing
|
624,930 | 402,670 | 133,556 | 1,161,156 | ||||||||||||
|
Product development and enhancement
|
559,041 | 117,062 | 46,927 | 723,030 | ||||||||||||
|
Amortization of property and equipment
|
124,070 | (124,070 | ) | - | ||||||||||||
|
Amortization of intangible assets
|
662,576 | (662,576 | ) | - | ||||||||||||
|
INCOME BEFORE OTHER INCOME (EXPENSES) AND INCOME TAXES
|
18,150,456 | - | (288,189 | ) | 17,862,267 | |||||||||||
|
Foreign exchange loss
|
(205,472 | ) | (205,472 | ) | ||||||||||||
|
Other expenses
|
(5,549 | ) | (5,549 | ) | ||||||||||||
|
Interest income
|
48,330 | 48,330 | ||||||||||||||
|
INCOME BEFORE INCOME TAXES
|
17,987,765 | (288,189 | ) | 17,699,576 | ||||||||||||
|
Income tax expense
|
||||||||||||||||
|
Current
|
5,203,025 | 5,203,025 | ||||||||||||||
|
Deferred
|
2,497,586 | 2,497,586 | ||||||||||||||
| 7,700,611 | 7,700,611 | |||||||||||||||
|
NET INCOME
|
$ | 10,287,154 | $ | (288,189 | ) | $ | 9,998,965 | |||||||||
|
OTHER COMPREHENSIVE INCOME
|
||||||||||||||||
|
Unrealized foreign exchange gain on translation of foreign operations
|
244,469 | 244,469 | ||||||||||||||
|
TOTAL COMPREHENSIVE INCOME
|
$ | 10,531,623 | $ | (288,189 | ) | $ | 10,243,434 | |||||||||
|
EARNINGS PER SHARE, basic
|
$ | 0.38 | $ | (0.01 | ) | $ | 0.37 | |||||||||
|
EARNINGS PER SHARE, diluted
|
$ | 0.37 | $ | (0.01 | ) | $ | 0.36 | |||||||||
|
WEIGHTED AVERAGE NUMBER OF SHARES OUTSTANDING
|
||||||||||||||||
|
Basic
|
27,342,799 | 27,342,799 | ||||||||||||||
|
Diluted
|
27,844,113 | 27,844,113 | ||||||||||||||
The Canadian GAAP consolidated statement of cash flows for the fiscal year ended March 31, 2011 has been reconciled to IFRS as follows:
|
Previously reported under Canadian GAAP
|
Share-based payments
|
Restated under IFRS
|
||||||||||
|
Operating Activities:
|
||||||||||||
|
Net income
|
$ | 10,287,154 | $ | (288,189 | ) | $ | 9,998,965 | |||||
|
Adjustments to reconcile net income to net cash provided by operating activities
|
||||||||||||
|
Amortization of property and equipment
|
124,070 | 124,070 | ||||||||||
|
Amortization of intangible assets
|
662,576 | 662,576 | ||||||||||
|
Share-based payments
|
1,163,496 | 288,189 | 1,451,685 | |||||||||
|
Foreign exchange gain
|
(3,592 | ) | (3,592 | ) | ||||||||
|
Deferred income taxes
|
2,497,586 | 2,497,586 | ||||||||||
|
Changes in non-cash operating working capital
|
||||||||||||
|
Accounts receivable
|
(262,848 | ) | (262,848 | ) | ||||||||
|
Corporate taxes receivable
|
1,002,041 | 1,002,041 | ||||||||||
|
Prepaid expenses
|
154,307 | 154,307 | ||||||||||
|
Accounts payable and accrued liabilities
|
170,393 | 170,393 | ||||||||||
|
Corporate taxes payable
|
4,796,157 | 4,796,157 | ||||||||||
|
Deferred revenue
|
(1,133,735 | ) | (1,133,735 | ) | ||||||||
|
Net cash provided by operating activities
|
19,457,605 | - | 19,457,605 | |||||||||
|
Investing Activities:
|
||||||||||||
|
Acquisition of property and equipment
|
(63,473 | ) | (63,473 | ) | ||||||||
|
Net cash used in investing activities
|
(63,473 | ) | - | (63,473 | ) | |||||||
|
Financing Activities:
|
||||||||||||
|
Principal payments on finance leases
|
(11,047 | ) | (11,047 | ) | ||||||||
|
Proceeds from exercise of stock options
|
1,126,648 | 1,126,648 | ||||||||||
|
Proceeds from exercise of warrants
|
1,122,000 | 1,122,000 | ||||||||||
|
Net cash provided by financing activities
|
2,237,601 | - | 2,237,601 | |||||||||
|
Effects of foreign exchange rate changes on cash and cash equivalents
|
215,995 | - | 215,995 | |||||||||
|
INCREASE IN CASH AND CASH EQUIVALENTS
|
21,847,728 | - | 21,847,728 | |||||||||
|
Cash and cash equivalents, beginning of year
|
5,069,763 | - | 5,069,763 | |||||||||
|
Cash and cash equivalents, end of year
|
$ | 26,917,491 | $ | - | $ | 26,917,491 | ||||||
New Accounting Guidance
Note 3 in the accompanying consolidated financial statements in this report contain a discussion of new accounting pronouncements and their potential impact on our consolidated results of operations and financial position.
Off-Balance Sheet Arrangements
We do not currently have any off-balance sheet arrangements as such term is defined in Item 303(a)(4) of Regulation S-K.
Summary Quarterly Financial Data (Unaudited)
The following summarizes our unaudited quarterly financial results for the fiscal years ended March 31, 2012 and March 31, 2011 (in thousands, except share data):
|
Year Ended March 31, 2012
|
||||||||||||||||
|
First Quarter
|
Second Quarter
|
Third Quarter
|
Fourth Quarter
|
|||||||||||||
|
Net revenue
|
$ | 5,976 | $ | 13,006 | $ | 5,251 | $ | 10,684 | ||||||||
|
Gross profit
|
2,654 | 7,396 | 2,236 | 5,362 | ||||||||||||
|
Net income
|
692 | 3,477 | 265 | 2,294 | ||||||||||||
|
Basic net earnings per common share
|
0.02 | 0.12 | 0.01 | 0.09 | ||||||||||||
|
Diluted net earnings per common share
|
0.02 | 0.12 | 0.01 | 0.08 | ||||||||||||
|
Year Ended March 31, 2011
|
||||||||||||||||
|
First Quarter
|
Second Quarter
|
Third Quarter
|
Fourth Quarter
|
|||||||||||||
|
Net revenue
|
$ | 5,131 | $ | 5,819 | $ | 11,060 | $ | 25,150 | ||||||||
|
Gross profit
|
2,525 | 2,653 | 6,014 | 13,187 | ||||||||||||
|
Net income
|
541 | 184 | 2,037 | 7,237 | ||||||||||||
|
Basic net earnings per common share
|
0.02 | 0.01 | 0.07 | 0.27 | ||||||||||||
|
Diluted net earnings per common share
|
0.02 | 0.01 | 0.07 | 0.26 | ||||||||||||
|
Quantitative and Qualitative Disclosures About Market Risk
|
We are exposed to market risk from changes in marketable securities (which consist of money market and commercial paper). At March 31, 2012, our marketable securities were recorded at a fair value of approximately $1,875,000 with an overall weighted average return of 1.17% and an overall weighted average life of less than three months. Any exposure to price risk would have an immaterial effect on the recorded value of the marketable securities.
We are not exposed to material future earnings or cash flow fluctuations from changes in interest rates on long-term debt since we had no long-term debt as of March 31, 2012. To date, we have not entered into any derivative financial instruments to manage interest rate risk and are currently not evaluating the future use of any such financial instruments.
Foreign Exchange Risk
The U.S. dollar is the functional currency of our operations. As a result, when we are paying any obligation that is denominated in a foreign currency, we must generate the amount of cash in U.S. dollars that, when exchanged at the then-prevailing applicable foreign currency exchange rate, will equal the amount of the obligation to be paid (which means that we may pay more U.S. dollars than initially anticipated if the foreign currency strengthens against the U.S. dollar between the time we incur the obligation and the time we are required to pay the obligation). Accordingly, we are exposed to the risk of future currency exchange rate fluctuations, which are accounted for as an adjustment to equity until realized. Therefore, changes from reporting period to reporting period in the exchange rates between the Canadian currency and the U.S. dollar might have a material adverse effect on our results of operations and financial condition.
|
ITEM 8.
|
Financial Statements and Supplementary Data
|
Information called for by this item is set forth in our Consolidated Financial Statements contained in this report beginning in Item 7 – “Management’s Discussion and Analysis of Financial Condition and Results of Operations” and at page F-1.
|
ITEM 9.
|
Changes in and Disagreements With Accountants on Accounting and Financial Disclosures
|
Not applicable
|
Controls and Procedures
|
Evaluation of Disclosure Controls and Procedures. As required by Rule 13a-15(b) under the Securities and Exchange Act of 1934 (the “Exchange Act”), our management, including our Chief Executive Officer (“CEO”) and Chief Accounting Officer (“CAO”), carried out an evaluation of the effectiveness of the design and operation of our “disclosure controls and procedures” as of the end of the period covered by this report. As defined in Rules 13a-15(e) and 15d-15(e) under the Exchange Act, disclosure controls and procedures are controls and other procedures of our Corporation that are designed to ensure that information required to be disclosed by our Corporation in the reports we file or submit under the Exchange Act is recorded, processed, summarized and reported within the time periods specified in the SEC’s rules and forms. Disclosure controls and procedures include, without limitation, controls and procedures designed to ensure that information required to be disclosed by our Corporation in the reports we file or submit under the Exchange Act is accumulated and communicated to our Corporation’s management, including our CEO and CAO, as appropriate, to allow timely decisions regarding required disclosure.
Based on their evaluation, our CEO and CAO concluded that our disclosure controls and procedures were effectively designed to provide reasonable assurance that information required to be disclosed by our Corporation in the reports we file or submit under the Exchange Act is recorded, processed, summarized and reported within the time periods specified in the rules and forms of the SEC and to provide reasonable assurance that such information is accumulated and communicated to our Corporation’s management, including our CEO and CAO, as appropriate, to allow timely decisions regarding required disclosure. Based on their evaluation, our CEO and CAO also concluded that our disclosure controls and procedures were operating effectively at the reasonable assurance level. It should be noted that any system of controls, however well designed and operated, is based in part upon certain assumptions and can provide only reasonable, and not absolute, assurance that the objectives of the system are met.
Changes in Internal Control over Financial Reporting. As required by Rule 13a-15(d) under the Exchange Act, our management, including our CEO and CAO, also conducted an evaluation of our internal control over financial reporting to determine whether any change occurred during our most recent fiscal quarter that has materially affected, or is reasonably likely to materially affect, our internal control over financial reporting. Based on our evaluation, during our most recent fiscal quarter there were no changes in our internal control over financial reporting that have materially affected, or are reasonably likely to materially affect, our internal control over financial reporting.
MANAGEMENT'S ANNUAL REPORT ON INTERNAL CONTROL OVER FINANCIAL REPORTING
Our management is responsible for establishing and maintaining adequate internal control over financial reporting, as such term is defined in the Exchange Act Rules 13a-15(f) and 15d-15(f). Those rules define internal control over financial reporting as a process designed to provide reasonable assurance regarding the reliability of financial reporting and the preparation of financial statements for external purposes in accordance with International Financial Reporting Standards ("IFRS"). It includes policies and procedures that:
|
·
|
Pertain to the maintenance of records that in reasonable detail accurately and fairly reflect the transactions and dispositions of our assets;
|
|
·
|
Provide reasonable assurance that transactions are recorded as necessary to permit preparation of financial statements in accordance with IFRS, and that our receipts and expenditures are being made only in accordance with authorizations of management and directors; and
|
|
·
|
Provide reasonable assurance regarding prevention or timely detection of unauthorized acquisition, use or disposition of our assets that could have a material effect on the financial statements.
|
Because of its inherent limitations, internal control over financial reporting may not prevent or detect misstatements. Also, projections of any evaluation of effectiveness to future periods are subject to the risk that controls may become inadequate because of changes in conditions, or that the degree of compliance with the policies or procedures may deteriorate.
Management assessed the effectiveness of the Corporation’s internal control over financial reporting as of March 31, 2012 based on the criteria set forth in the Internal Control-Integrated Framework by the Committee of Sponsoring Organizations of the Treadway Commission (“COSO”). Based on this assessment and those criteria, management has concluded that our internal control over financial reporting was effective at a reasonable assurance level as of March 31, 2012.
This annual report on Form 10-K does not include an attestation report of our independent registered public accounting firm regarding internal control over financial reporting. Pursuant to Item 308(b) of Regulation S-K, as amended September 21, 2010, management’s report was not subject to attestation by our independent registered public accounting firm because the Company is neither an “accelerated filer” nor a “large accelerated filer” as those terms are defined by the SEC.
|
Other Information
|
Not applicable.
PART III
|
ITEM 10.
|
Directors, Executive Officers and Corporate Governance
|
Information on our directors, executive officers, and audit committee, compliance with Section 16(a) of the Exchange Act and our code of ethics applicable to our Chief Executive Officer and Chief Accounting Officer will be contained in our Proxy Statement for our 2012 Annual Meeting of Shareholders, to be filed with the SEC within 120 days after the end of our fiscal year 2012, and is incorporated herein by reference.
We have adopted a Code of Business Conduct and Ethics applicable to our principal executive officer, principal financial officer, controller and others performing similar functions. Our Code of Business Conduct and Ethics also applies to all of our other employees and to our directors and is available on our website located at www.lmlpayment.com under the heading “Investor Relations; Corporate Governance”. We intend to satisfy any disclosure requirements pursuant to Item 5.05 of Form 8-K regarding any amendment to, or a waiver from, certain provisions of our Code of Ethics by posting such information on our website (unless we are otherwise required to file a Form 8-K under the rules and regulations of The NASDAQ Stock Market).
There were no material changes to the procedures by which our stockholders may recommend nominees to our Board of Directors implemented during fiscal year 2012.
|
ITEM 11.
|
Executive Compensation
|
Information on compensation of our directors and executive officers will be contained in our Proxy Statement for our 2012 Annual Meeting of Shareholders, to be filed with the SEC within 120 days after the end of our fiscal year 2012, and is incorporated herein by reference.
|
Security Ownership of Certain Beneficial Owners and Management and Related Stockholder Security Matters
|
Information on the securities ownership of certain beneficial owners and our management will be contained in our Proxy Statement for our 2012 Annual Meeting of Shareholders, to be filed with the SEC within 120 days after the end of our fiscal year 2012, and is incorporated herein by reference.
Information required by Item 201(d) of Regulation S-K is set forth under Item 5. “Market for Registrant’s Common Equity, Related Stockholder Matters and Issuer Purchases of Equity Securities”.
|
ITEM 13.
|
Certain Relationships and Related Transactions and Director Independence
|
Information on certain relationships, related transactions and director independence will be contained in our Proxy Statement for our 2012 Annual Meeting of Shareholders, to be filed with the SEC within 120 days after the end of our fiscal year 2012, and is incorporated herein by reference.
|
ITEM 14.
|
Principal Accountant Fees and Services
|
Information regarding principal accountant fees and services will be contained in our Proxy Statement for our 2012 Annual Meeting of Shareholders, to be filed with the SEC within 120 days after the end of our fiscal year 2012, and is incorporated herein by reference.
PART IV
|
ITEM 15.
|
Exhibits and Financial Statement Schedules
|
|
|
(a)
|
The following documents are filed as part of this report:
|
|
|
(1)
|
Consolidated Financial Statements
|
|
Page
|
Description
|
|
|
F-1
|
||
|
F-2
|
||
|
F-3
|
||
|
F-4
|
||
|
F-5
|
||
|
F-6
|
All other schedules are omitted because they are not applicable or the required information is shown in the Consolidated Financial Statements or Notes thereto.
|
|
(b)
|
Exhibits:
|
|
Exhibit Number
|
Description of Document
|
|
|
2.1
|
Arrangement Agreement dated as of April 30, 2007, between LML Payment Systems Inc. and Beanstream Internet Commerce Inc. and the schedules thereto (incorporated by reference to Exhibit 2.1 to the Form 8-K dated April 30, 2007 of LML (file No. 000-13959)).
|
|
|
2.2
|
Amending Agreement between LML Payment Systems Inc. and Beanstream Internet Commerce Inc. dated as of May 24, 2007 (incorporated by reference to Exhibit 99.2 to the Form 8-K dated June 4, 2007 of LML
(file No. 000-13959)).
|
|
|
3.1
|
Restated Articles of Incorporation (incorporated by reference to Exhibit 3.1 to the Annual Report on Form 10-K for the period ended March 31, 2011 as filed with the SEC on June 16, 2011 (file No. 000-13959)).
|
|
|
3.2
|
Bylaws of LML, as amended (incorporated by reference to Exhibit 3.2 to the Quarterly Report on Form 10-Q for the period ended September 30, 2007 of LML (File No. 000-13959)).
|
|
|
10.1
|
Securities Purchase Agreement dated as of March 26, 2008, between LML Payment Systems Inc. and Millennium Partners, L.P. (incorporated by reference to Exhibit 10.1 to the Form 8-K dated March 26, 2008 of LML (file 000-13959)).
|
|
|
10.2
|
Registration Rights Agreement dated as of March 26, 2008, between LML Payment Systems Inc. and Millennium Partners, L.P. (incorporated by reference to Exhibit 10.2 to the Form 8-K dated March 26, 2008 of LML
(file 000-13959)).
|
|
|
10.3
|
Warrant dated as of March 26, 2008, between LML Payment Systems Inc. and Ladenburg Thalmann & Co., Inc. (incorporated by reference to Exhibit 10.3 to the Form 8-K dated March 26, 2008 of LML (file 000-13959)).
|
|
|
10.4†
|
Employment agreement between LML Payment Systems Inc. and Patrick H. Gaines dated March 31, 2008 (incorporated by reference to Exhibit 10.1 to the Form 8-K dated March 31, 2008 of LML (file 000-13959)).
|
|
|
10.5†
|
Employment agreement between LML Payment Systems Inc. and Richard R. Schulz dated March 31, 2008 (incorporated by reference to Exhibit 10.2 to the Form 8-K dated March 31, 2008 of LML (file 000-13959)).
|
|
|
10.6†
|
Employment agreement between LML Payment Systems Inc. and Carolyn L. Gaines dated March 31, 2008 (incorporated by reference to Exhibit 10.3 to the Form 8-K dated March 31, 2008 of LML (file 000-13959)).
|
|
|
10.7†
|
Employment agreement between LML Payment Systems Inc. and Craig Thomson dated February 5, 2009 (incorporated by reference to Exhibit 10.1 to the Form 8-K dated February 5, 2009 of LML (file 000-13959)).
|
|
|
10.8†
|
Employment agreement between LML Payment Systems Inc. and Chris Koide dated February 5, 2009 (incorporated by reference to Exhibit 10.2 to the Form 8-K dated February 5, 2009 of LML (file 000-13959)).
|
|
|
10.9†
|
Amending agreement to the employment agreement between LML Payment Systems Inc. and Patrick H. Gaines dated February 5, 2009 (incorporated by reference to Exhibit 10.3 to the Form 8-K dated February 5, 2009 of LML
(file 000-13959)).
|
|
|
10.10†
|
Amending agreement to the employment agreement between LML Payment Systems Inc. and Richard R. Schulz dated February 5, 2009 (incorporated by reference to Exhibit 10.4 to the Form 8-K dated February 5, 2009 of LML
(file 000-13959)).
|
|
|
10.11†
|
1996 Stock Option Plan and amendments to 1996 Stock Option Plan dated August 31, 1998, September 30, 1999 and September 18, 2000 (incorporated by reference to Appendix A to the Schedule 14A of LML dated August 8, 2007 (file 000-13959)).
|
|
|
(b)
|
Exhibits (continued)
|
|
10.12†
|
1998 Stock Incentive Plan and amendment to 1998 Stock Incentive Plan dated September 18, 2000 (incorporated by reference to Appendix B to the Schedule 14A of LML dated August 8, 2007 (file 0-13959)).
|
|
|
10.13†
|
2009 Stock Incentive Plan dated June 17, 2009 (incorporated by reference to Appendix A to the Schedule 14A of LML dated August 6, 2010 (file 000-13959)).
|
|
|
10.14††
|
Settlement and License Agreement between LML Patent Corp and RBS Citizens Bank N.A. dated December 29, 2009 (incorporated by reference to Exhibit 10.1 to the Quarterly Report on Form 10-Q for the period ended December 31, 2009, as filed with the SEC on February 12, 2010 (File No. 000-13959)).
|
|
|
10.15
|
Settlement and License Agreement effective as of June 2, 2010 among LML Patent Corp. and PNC Financial Services Group Inc., PNC Bank N.A. and PNC Bank N.A. as successor in interest for National City Bank (collectively, “PNC”) (incorporated by reference to Exhibit 10.15 to the Annual Report on Form 10-K for the period ended March 31, 2010, as filed with the SEC on June 24, 2010 (File No. 000-13959)).
|
|
|
10.16
|
Settlement and License Agreement effective as of July 23, 2010 among LML Patent Corp. and Union Bank N.A. (incorporated by reference to Exhibit 10.1 to the Quarterly Report on Form 10-Q for the period ended June 30, 2010, as filed with the SEC on November 15, 2010 (File No. 000-13959)).
|
|
|
10.17
|
Settlement and License Agreement effective as of September 22, 2010 among LML Patent Corp. and M&T Bank corporation, M&T Bank and M&T Bank N.A. (collectively “M&T Bank”) (incorporated by reference to Exhibit 10.1 to the Quarterly Report on Form 10-Q for the period ended September 30, 2010, as filed with the SEC on November 15, 2010 (File No. 000-13959)).
|
|
|
10.18
|
Settlement and License Agreement effective as of October 4, 2010 among LML Patent Corp. and The Bank of New York Mellon (incorporated by reference to Exhibit 10.2 to the Quarterly Report on Form 10-Q for the period ended September 30, 2010, as filed with the SEC on November 15, 2010 (File No. 000-13959)).
|
|
|
10.19
|
Settlement and License Agreement effective as of October 4, 2010 among LML Patent Corp. and First National Bank of Omaha and First National Merchant Solutions LLC (f/k/a/ SPC Inc.) (collectively “First National”) (incorporated by reference to Exhibit 10.3 to the Quarterly Report on Form 10-Q for the period ended September 30, 2010, as filed with the SEC on November 15, 2010 (File No. 000-13959)).
|
|
|
10.20
|
Settlement and License Agreement effective as of November 10, 2010 among LML Patent Corp. and Fifth Third Bank (incorporated by reference to Exhibit 10.3 to the Quarterly Report on Form 10-Q for the period ended December 31, 2010, as filed with the SEC on February 14, 2011 (File No. 000-13959)).
|
|
|
10.21
|
Settlement and License Agreement effective as of November 12, 2010 among LML Patent Corp. and Regions Bank (incorporated by reference to Exhibit 10.1 to the Quarterly Report on Form 10-Q for the period ended December 31, 2010, as filed with the SEC on February 14, 2011 (File No. 000-13959)).
|
|
|
10.22
|
Settlement and License Agreement effective as of November 12, 2010 among LML Patent Corp. and M & I Marshall & Ilsley Bank (incorporated by reference to Exhibit 10.2 to the Quarterly Report on Form 10-Q for the period ended December 31, 2010, as filed with the SEC on February 14, 2011 (File No. 000-13959)).
|
|
|
10.23
|
Settlement and License Agreement effective as of February 28, 2011 among LML Patent Corp. and HSBC North America Holdings Inc. (incorporated by reference to Exhibit 10.23 to the Annual Report on Form 10-K for the fiscal year ended March 31, 2011, as filed with the SEC on June 16, 2011 (File No. 000-13959))
|
|
|
10.24
|
Settlement and License Agreement effective as of March 7, 2011 among LML Patent Corp. and Citigroup Inc. (incorporated by reference to Exhibit 10.24 to the Annual Report on Form 10-K for the fiscal year ended March 31, 2011, as filed with the SEC on June 16, 2011 (File No. 000-13959))
|
|
|
(b)
|
Exhibits (continued)
|
|
10.25
|
Settlement and License Agreement effective as of March 16, 2011 among LML Patent Corp. and PayPal (incorporated by reference to Exhibit 10.25 to the Annual Report on Form 10-K for the fiscal year ended March 31, 2011, as filed with the SEC on June 16, 2011 (File No. 000-13959)).
|
|
|
10.26†
|
Amending agreement to the employment agreement between LML Payment Systems Inc. and Carolyn Gaines dated June 9, 2011 (incorporated by reference to Exhibit 10.1 to the Quarterly Report on Form 10-Q for the period ended June 30, 2011, as filed with the SEC on August 12, 2011 (File No. 000-13959)).
|
|
|
10.27
|
Settlement and License Agreement effective as of June 30, 2011 among LML Patent Corp. and The Northern Trust Company and Northern Trust Corporation (collectively, “Northern Trust”) (incorporated by reference to Exhibit 10.2 to the Quarterly Report on Form 10-Q for the period ended June 30, 2011, as filed with the SEC on August 12, 2011 (File No. 000-13959)).
|
|
|
10.28
|
Settlement and License Agreement effective as of September 8, 2011 among LML Patent Corp. and Capital One National Association and Capital One Services LLC (collectively “Capital One”) (incorporated by reference to Exhibit 10.1 to the Quarterly Report on Form 10-Q for the period ended December 31, 2010, as filed with the SEC on February 14, 2011 (File No. 000-13959)).
|
|
|
10.29
|
Settlement and License Agreement effective as of September 6, 2011 among LML Patent Corp. and Wells Fargo Bank N.A. (incorporated by reference to Exhibit 10.2 to the Quarterly Report on Form 10-Q for the period ended December 31, 2010, as filed with the SEC on February 14, 2011 (File No. 000-13959)).
|
|
|
10.30†
|
Amending agreement to the employment agreement between LML Payment Systems Inc. and Craig Thomson dated November 8, 2011 (incorporated by reference to Exhibit 10.1 to the Form 8-K dated November 15, 2011 of LML
(file 000-13959)).
|
|
|
10.31†
|
Amending agreement to the employment agreement between LML Payment Systems Inc. and Chris Koide dated November 8, 2011 (incorporated by reference to Exhibit 10.2 to the Form 8-K dated November 15, 2011 of LML
(file 000-13959)).
|
|
|
10.32*
|
Settlement and License Agreement effective March 5, 2012 among LML Patent Corp. and JP Morgan Chase Bank N.A.
|
|
|
10.33*
|
Settlement and License Agreement effective March 12, 2012 among LML Patent Corp. and Deutsche Bank Trust Company Americas
|
|
|
21*
|
Subsidiaries of LML.
|
|
|
23.1*
|
Consent of Grant Thornton LLP.
|
|
|
31.1*
|
Rule 13a-14(a) Certification of Principal Executive Officer.
|
|
|
31.2*
|
Rule 13a-14(a) Certification of Principal Financial Officer.
|
|
|
32*
|
Section 1350 Certification of Principal Executive Officer and Principal Financial Officer.
|
_______
* filed herewith.
† Management contract or compensatory plan or arrangement.
†† Confidential Treatment has been granted.
LML PAYMENT SYSTEMS INC.
Pursuant to the requirements of Section 13 or 15(d) of the Securities Exchange Act of 1934, the registrant has duly caused this report to be signed on its behalf by the undersigned thereunto duly authorized.
|
LML PAYMENT SYSTEMS INC.
|
|
|
/s/ Patrick Gaines
|
|
|
Patrick H. Gaines
|
|
|
Chairman of the Board and Chief Executive Officer
|
|
|
Date: June 20, 2012
|
|
Pursuant to the requirements of the Securities Exchange Act of 1934, this report has been signed below by the following persons on behalf of the Registrant and in the capacities indicated and on the dates indicated below.
|
Title
|
Date
|
|||
|
/s/ Patrick Gaines
|
Chairman of the Board, Chief Executive Officer and Director
|
June 20, 2012
|
||
|
Patrick H. Gaines
|
(Principal Executive Officer)
|
|||
|
/s/ Craig Thomson
|
President
|
June 20, 2012
|
||
|
A. Craig Thomson
|
||||
|
/s/ Richard Schulz
|
Controller and Chief Accounting Officer
|
June 20, 2012
|
||
|
Richard R. Schulz
|
(Principal Financial and Accounting Officer)
|
|||
|
/s/ David Cooke
|
Director
|
June 20, 2012
|
||
|
David C. Cooke
|
||||
|
/s/ Jacqueline Pace
|
Director
|
June 20, 2012
|
||
|
Jacqueline Pace
|
||||
|
/s/ Greg MacRae
|
Director
|
June 20, 2012
|
||
|
Greg A. MacRae
|
To the Shareholders of LML Payment Systems Inc.
We have audited the accompanying consolidated financial statements of LML Payment Systems Inc., which comprises the consolidated statements of financial position as at March 31, 2012, March 31, 2011 and April 1, 2010, the consolidated statements of earnings and comprehensive income, consolidated statements of equity, and consolidated statements of cash flows for the years ended March 31, 2012 and March 31, 2011 and a summary of significant accounting policies and other explanatory information.
Management’s responsibility for the financial statements
Management is responsible for the preparation and fair presentation of these consolidated financial statements in accordance with International Financial Reporting Standards as issued by the International Accounting Standards Board, and for such internal control as management determines is necessary to enable the preparation of consolidated financial statements that are free from material misstatement, whether due to fraud or error.
Auditor’s responsibility
Our responsibility is to express an opinion on these consolidated financial statements based on our audits. We conducted our audits in accordance with Canadian generally accepted auditing standards and the standards of the Public Company Accounting Oversight Board (United States). Those standards require that we comply with ethical requirements and plan and perform the audit to obtain reasonable assurance about whether the consolidated financial statements are free from material misstatement.
An audit involves performing procedures to obtain audit evidence about the amounts and disclosures in the consolidated financial statements.
The procedures selected depend on the auditor’s judgment, including the assessment of the risks of material misstatement of the consolidated financial statements, whether due to fraud or error. An audit also includes evaluating the appropriateness of accounting policies used and the reasonableness of accounting estimates made by management, as well as evaluating the overall presentation of the consolidated financial statements. We were not engaged to perform an audit of the Company’s internal control over financial reporting. Our audits included consideration of internal control over financial reporting as a basis for designing audit procedures that are appropriate in the circumstances, but not for the purpose of expressing an opinion on the effectiveness of the Company’s internal control over financial reporting. Accordingly we express no such opinion.
We believe that the audit evidence we have obtained in our audits is sufficient and appropriate to provide a basis for our audit opinion.
Opinion
In our opinion, the consolidated financial statements present fairly, in all material respects, the consolidated financial position of LML Payment Systems Inc. as at March 31, 2012, March 31, 2011 and April 1, 2010, and its financial performance and its cash flows for the years ended March 31, 2012 and March 31, 2011 in accordance with International Financial Reporting Standards as issued by the International Accounting Standards Board.
|
Vancouver, Canada
|
/s/ GRANT THORNTON LLP
|
|
June 15, 2012
|
Chartered Accountants
|
LML PAYMENT SYSTEMS INC.
CONSOLIDATED STATEMENTS OF FINANCIAL POSITION
(In U.S. Dollars)
|
March 31,
|
March 31,
|
April 1,
|
||||||||||
|
2012
|
2011
|
2010
|
||||||||||
|
ASSETS
|
(Note 18)
|
(Note 18)
|
||||||||||
|
Current Assets
|
||||||||||||
|
Cash and cash equivalents (Note 5)
|
$ | 26,783,754 | $ | 26,917,491 | $ | 5,069,763 | ||||||
|
Funds held for merchants (Note 5)
|
9,485,182 | 7,164,420 | 5,804,752 | |||||||||
|
Short-term investments
|
3,290,393 | - | - | |||||||||
|
Restricted cash (Note 4(b))
|
175,000 | 175,000 | 175,000 | |||||||||
|
Accounts receivable, less allowance of $27,397 (2011: $28,152; April 1, 2010: $31,463)
|
1,602,485 | 1,103,529 | 799,584 | |||||||||
|
Corporate taxes receivable
|
373,939 | 101,162 | 1,072,930 | |||||||||
|
Prepaid expenses
|
331,361 | 266,066 | 416,507 | |||||||||
|
Total current assets
|
42,042,114 | 35,727,668 | 13,338,536 | |||||||||
|
Property and equipment, net (Notes 6 and 9)
|
121,496 | 163,222 | 219,580 | |||||||||
|
Patents (Note 7)
|
120,457 | 287,877 | 455,304 | |||||||||
|
Restricted cash (Note 4(b))
|
258,095 | 262,644 | 255,247 | |||||||||
|
Deferred tax assets (Note 13)
|
809,951 | 1,189,747 | 3,687,333 | |||||||||
|
Goodwill
|
17,874,202 | 17,874,202 | 17,874,202 | |||||||||
|
Other intangible assets (Note 8)
|
3,720,037 | 4,215,187 | 4,710,337 | |||||||||
|
Other assets
|
20,796 | 21,041 | 20,641 | |||||||||
|
Total assets
|
$ | 64,967,148 | $ | 59,741,588 | $ | 40,561,180 | ||||||
|
LIABILITIES
|
||||||||||||
|
Current Liabilities
|
||||||||||||
|
Accounts payable
|
$ | 720,666 | $ | 702,820 | $ | 836,274 | ||||||
|
Accrued liabilities
|
1,445,490 | 1,390,847 | 1,040,443 | |||||||||
|
Corporate taxes payable
|
465,044 | 4,796,157 | - | |||||||||
|
Funds due to merchants (Note 5)
|
9,485,182 | 7,164,420 | 5,804,752 | |||||||||
|
Current portion of obligations under finance lease (Note 9)
|
2,460 | 2,460 | 11,195 | |||||||||
|
Current portion of deferred revenue
|
1,371,096 | 1,420,228 | 1,325,983 | |||||||||
|
Total current liabilities
|
13,489,938 | 15,476,932 | 9,018,647 | |||||||||
|
Obligations under finance lease (Note 9)
|
4,920 | 7,380 | 9,840 | |||||||||
|
Deferred revenue
|
- | 935,979 | 2,155,162 | |||||||||
|
Total liabilities
|
13,494,858 | 16,420,291 | 11,183,649 | |||||||||
|
EQUITY
|
||||||||||||
|
Capital stock (Note 10(a))
|
||||||||||||
|
Class A, preferred stock, $1.00 CDN par value, 150,000,000 shares authorized, issuable in series, none issued or outstanding
|
- | - | - | |||||||||
|
Class B, preferred stock, $1.00 CDN par value, 150,000,000 shares authorized, issuable in series, none issued or outstanding
|
- | - | - | |||||||||
|
Common shares, no par value, 100,000,000 shares authorized, 28,246,684 issued and outstanding (2011: 28,127,184; April 1, 2010: 27,241,408) (Note 10(a))
|
53,918,912 | 53,557,276 | 50,152,385 | |||||||||
|
Contributed surplus
|
10,001,594 | 8,819,006 | 7,987,727 | |||||||||
|
Warrants (Note 10(d))
|
113,662 | 113,662 | 649,500 | |||||||||
|
Deficit
|
(12,835,486 | ) | (19,563,201 | ) | (29,562,166 | ) | ||||||
|
Accumulated other comprehensive income
|
273,608 | 394,554 | 150,085 | |||||||||
|
Total equity
|
51,472,290 | 43,321,297 | 29,377,531 | |||||||||
|
Total liabilities and equity
|
$ | 64,967,148 | $ | 59,741,588 | $ | 40,561,180 | ||||||
See accompanying notes to the consolidated financial statements.
LML PAYMENT SYSTEMS INC.
CONSOLIDATED STATEMENTS OF EARNINGS AND COMPREHENSIVE INCOME
(In U.S. Dollars, except share data)
|
Years ended March 31,
|
||||||||
|
2012
|
2011
|
|||||||
|
REVENUE
|
$ | 34,916,802 | $ | 47,160,490 | ||||
|
COSTS OF REVENUE
|
17,268,762 | 22,781,971 | ||||||
|
GROSS PROFIT
|
17,648,040 | 24,378,519 | ||||||
|
OPERATING EXPENSES
|
||||||||
|
General and administrative (Note 7)
|
4,546,970 | 4,632,066 | ||||||
|
Sales and marketing (Note 8)
|
1,079,567 | 1,161,156 | ||||||
|
Product development and enhancement (Note 8)
|
1,168,973 | 723,030 | ||||||
|
INCOME BEFORE OTHER INCOME (EXPENSES) AND INCOME TAXES
|
10,852,530 | 17,862,267 | ||||||
|
Foreign exchange gain (loss)
|
56,892 | (205,472 | ) | |||||
|
Other expense
|
- | (5,549 | ) | |||||
|
Interest income
|
128,863 | 48,330 | ||||||
|
INCOME BEFORE INCOME TAXES
|
11,038,285 | 17,699,576 | ||||||
|
Income tax expense (Note 13)
|
||||||||
|
Current
|
4,023,193 | 5,203,025 | ||||||
|
Deferred
|
287,377 | 2,497,586 | ||||||
| 4,310,570 | 7,700,611 | |||||||
|
NET INCOME
|
$ | 6,727,715 | $ | 9,998,965 | ||||
|
OTHER COMPREHENSIVE INCOME
|
||||||||
|
Unrealized foreign exchange (loss) gain on translation of foreign operations
|
(120,946 | ) | 244,469 | |||||
|
TOTAL COMPREHENSIVE INCOME
|
$ | 6,606,769 | $ | 10,243,434 | ||||
|
EARNINGS PER SHARE, basic
|
$ | 0.24 | $ | 0.37 | ||||
|
EARNINGS PER SHARE, diluted
|
$ | 0.23 | $ | 0.36 | ||||
|
WEIGHTED AVERAGE NUMBER OF SHARES OUTSTANDING, (Note 10(b))
|
||||||||
|
Basic
|
28,213,961 | 27,342,799 | ||||||
|
Diluted
|
29,123,877 | 27,844,113 | ||||||
See accompanying notes to the consolidated financial statements.
LML PAYMENT SYSTEMS INC.
CONSOLIDATED STATEMENTS OF EQUITY
(In U.S. Dollars)
|
Accumulated
|
||||||||||||||||||||||||||||
|
Other
|
||||||||||||||||||||||||||||
|
Common
|
Contributed
|
Comprehensive
|
||||||||||||||||||||||||||
|
Shares
|
Amount
|
Surplus
|
Warrants
|
Income (Loss)
|
Deficit
|
Total
|
||||||||||||||||||||||
|
Balance as at April 1, 2010
|
27,241,408 | $ | 50,152,385 | $ | 7,987,727 | $ | 649,500 | $ | 150,085 | $ | (29,562,166 | ) | $ | 29,377,531 | ||||||||||||||
|
Net income
|
- | - | - | - | - | 9,998,965 | 9,998,965 | |||||||||||||||||||||
|
Unrealized foreign exchange gain on translation of foreign operations
|
- | - | - | - | 244,469 | - | 244,469 | |||||||||||||||||||||
|
Exercise of stock options
|
545,200 | 1,126,648 | - | - | - | - | 1,126,648 | |||||||||||||||||||||
|
Exercise of warrants
|
330,000 | 1,122,000 | - | - | - | - | 1,122,000 | |||||||||||||||||||||
|
Previous capital consolidation adjustment (Note 10(e))
|
10,576 | - | - | - | - | - | - | |||||||||||||||||||||
|
Reallocation of contributed surplus on exercise of options and warrants (Note 10(a))
|
- | 1,156,243 | (620,405 | ) | (535,838 | ) | - | - | - | |||||||||||||||||||
|
Share-based payments (Note 10(c))
|
- | - | 1,451,684 | - | - | - | 1,451,684 | |||||||||||||||||||||
|
Balance as at March 31, 2011
|
28,127,184 | 53,557,276 | 8,819,006 | 113,662 | 394,554 | (19,563,201 | ) | 43,321,297 | ||||||||||||||||||||
|
Net income
|
- | - | - | - | - | 6,727,715 | 6,727,715 | |||||||||||||||||||||
|
Unrealized foreign exchange loss on translation of foreign operations
|
- | - | - | - | (120,946 | ) | - | (120,946 | ) | |||||||||||||||||||
|
Exercise of stock options
|
119,500 | 226,840 | - | - | - | - | 226,840 | |||||||||||||||||||||
|
Reallocation of contributed surplus on exercise of options (Note 10(a))
|
- | 134,796 | (134,796 | ) | - | - | - | - | ||||||||||||||||||||
|
Share-based payments (Note 10(c))
|
- | - | 1,317,384 | - | - | - | 1,317,384 | |||||||||||||||||||||
|
Balance as at March 31, 2012
|
28,246,684 | $ | 53,918,912 | $ | 10,001,594 | $ | 113,662 | $ | 273,608 | $ | (12,835,486 | ) | $ | 51,472,290 | ||||||||||||||
See accompanying notes to the consolidated financial statements
LML PAYMENT SYSTEMS INC.
CONSOLIDATED STATEMENTS OF CASH FLOWS
(In U.S. Dollars)
|
Years ended March 31,
|
||||||||
|
2012
|
2011
|
|||||||
|
OPERATING ACTIVITIES:
|
||||||||
|
Net income
|
$ | 6,727,715 | $ | 9,998,965 | ||||
|
Adjustments to reconcile net income to net cash provided by operating activities
|
||||||||
|
Depreciation of property and equipment
|
104,750 | 124,070 | ||||||
|
Amortization of intangible assets
|
662,570 | 662,576 | ||||||
|
Share-based payments
|
1,317,384 | 1,451,685 | ||||||
|
Deferred taxes
|
287,377 | 2,497,586 | ||||||
|
Foreign exchange loss (gain)
|
889 | (3,592 | ) | |||||
|
Changes in non-cash operating working capital
|
||||||||
|
Accounts receivable
|
(526,469 | ) | (262,848 | ) | ||||
|
Corporate taxes receivable
|
(275,606 | ) | 1,002,041 | |||||
|
Prepaid expenses
|
(68,083 | ) | 154,307 | |||||
|
Accounts payable and accrued liabilities
|
107,042 | 170,393 | ||||||
|
Corporate taxes payable
|
(4,236,314 | ) | 4,796,157 | |||||
|
Deferred revenue
|
(978,571 | ) | (1,133,735 | ) | ||||
|
Net cash provided by operating activities
|
3,122,684 | 19,457,605 | ||||||
|
INVESTING ACTIVITIES:
|
||||||||
|
Acquisition of short-term investments
|
(3,294,525 | ) | - | |||||
|
Acquisition of property and equipment
|
(65,002 | ) | (63,473 | ) | ||||
|
Net cash used in investing activities
|
(3,359,527 | ) | (63,473 | ) | ||||
|
FINANCING ACTIVITIES:
|
||||||||
|
Principal payments on finance leases
|
(2,460 | ) | (11,047 | ) | ||||
|
Proceeds from exercise of stock options
|
226,840 | 1,126,648 | ||||||
|
Proceeds from exercise of warrants
|
- | 1,122,000 | ||||||
|
Net cash provided by financing activities
|
224,380 | 2,237,601 | ||||||
|
Effects of foreign exchange rate changes on cash and cash equivalents
|
(121,274 | ) | 215,995 | |||||
|
(DECREASE) INCREASE IN CASH AND CASH EQUIVALENTS
|
(133,737 | ) | 21,847,728 | |||||
|
Cash and cash equivalents, beginning of year
|
26,917,491 | 5,069,763 | ||||||
|
Cash and cash equivalents, end of year
|
$ | 26,783,754 | $ | 26,917,491 | ||||
|
Cash and cash equivalents consist of:
|
||||||||
|
Cash
|
$ | 24,908,396 | $ | 22,091,702 | ||||
|
Money market fund
|
109,988 | 109,905 | ||||||
|
Commercial paper
|
1,765,370 | 4,715,884 | ||||||
| $ | 26,783,754 | $ | 26,917,491 | |||||
See accompanying notes to the consolidated financial statements.
LML PAYMENT SYSTEMS INC.
NOTES TO CONSOLIDATED FINANCIAL STATEMENTS
(unless otherwise indicated, all amounts are U.S. dollars)
|
|
1.
|
NATURE OF OPERATIONS
|
LML Payment Systems Inc. is domiciled in the Yukon Territory with a principal place of business at suite 1680, 1140 West Pender Street, Vancouver, B.C. LML Payment Systems Inc. and its subsidiaries (the "Corporation"), see Note 2, is a financial payment processor providing electronic payment, risk management, and authentication services primarily to businesses and organizations who use the Internet to receive or send payments. The Corporation links merchants selling products or services to customers wanting to buy them and financial institutions who allow the transfer of payments to occur. The Corporation has partnership arrangements and certified connections to financial institutions, payment processors and other payment service providers in order to enable its customers to safely and reliably conduct e-Commerce. The Corporation provides its electronic payment, authentication and risk management services to over 13,000 businesses and organizations in Canada and the United States of America (“U.S.”). The Corporation also provides check processing solutions including primary and secondary check collection including electronic check re-presentment (RCK) to retailers in the U.S.
The Corporation also provides licenses to its intellectual property. The Corporation’s intellectual property estate, owned by subsidiary LML Patent Corp., includes U.S. Patent No. 6,354,491, No. 6,283,366, No. 6,164,528, No. 5,484,988, and No. RE40,220, all of which describe electronic check processing methods.
The Corporation is incorporated under the Yukon Business Corporations Act and qualifies as a foreign private issuer in the U.S. for purposes of the Securities Exchange Act of 1934, as amended (the “Exchange Act”). While not required to do so, the Corporation continues to voluntarily report utilizing domestic forms, including annual reports on Form 10-K, quarterly reports on Form 10-Q, and current reports on Form 8-K, with the Securities and Exchange Commission (“SEC”) instead of filing the reporting forms available to foreign private issuers.
|
|
2.
|
BASIS OF PRESENTATION
|
Statement of Compliance
These consolidated financial statements have been prepared in accordance with International Financial Reporting Standards (“IFRS”) as issued by the International Accounting Standards Board (“IASB”). These are the Corporation’s first consolidated financial statements prepared under IFRS and IFRS 1, First-time Adoption of International Financial Reporting Standards (“IFRS1”) has been applied.
Subject to certain transition elections disclosed in Note 18, these consolidated financial statements have consistently applied the same accounting policies in the opening IFRS statement of financial position as at April 1, 2010, the effective date of the Corporation’s transition to IFRS, and throughout all years presented, as if the policies had always been in effect. Note 18 discloses the impact of the transition from Canadian generally accepted accounting principles (“Canadian GAAP”) to IFRS on our reported consolidated statement of financial position, consolidated statement of earnings and comprehensive income and consolidated statement of cash flows, including the nature and effect of significant changes in accounting policies from those used in our consolidated financial statements for the year ended March 31, 2011. IFRS 1, which governs the first-time adoption of IFRS, generally requires accounting policies to be applied retrospectively to determine the opening statement of financial position on our transition date of April 1, 2010 and allows certain exemptions on transition to IFRS. The elections that are considered significant to the Corporation and which have been applied are disclosed in Note 18. As disclosed in Note 1, the Corporation qualifies as a foreign private issuer in the U.S. for purposes of the Exchange Act. As such, the Corporation is permitted to file its consolidated financial statements with the Securities and Exchange Commission (“SEC”) under IFRS without a reconciliation to generally accepted accounting principles in the U.S. (“U.S. GAAP”). As a result, the Corporation no longer prepares a reconciliation of its results to U.S. GAAP. It is possible that certain of the Corporation’s accounting policies under IFRS could be different from U.S. GAAP.
LML PAYMENT SYSTEMS INC.
NOTES TO CONSOLIDATED FINANCIAL STATEMENTS
(unless otherwise indicated, all amounts are U.S. dollars)
|
|
2.
|
BASIS OF PRESENTATION (continued)
|
These consolidated financial statements for the year ended March 31, 2012 (including comparatives) were approved and authorized for issuance by the board of directors on June 15, 2012.
These consolidated financial statements include the financial statements of the Corporation and its wholly owned subsidiaries as set out below. All significant inter-company balances and transactions have been eliminated on consolidation.
|
CANADA
|
UNITED STATES
|
|
|
Legacy Promotions Inc.
|
LHTW Properties Inc.
|
|
|
Beanstream Internet Commerce Inc. (“Beanstream”)
|
LML Corp.
|
|
|
0858669 B.C. Ltd.
|
LML Patent Corp.
|
|
|
LML Payment Systems Corp.
|
||
|
Beanstream Internet Commerce Corp.
|
|
|
3.
|
SIGNIFICANT ACCOUNTING POLICIES
|
|
|
(a)
|
Use of Estimates and Management Judgment
|
The preparation of consolidated financial statements in conformity with IFRS requires the Corporation’s management to make estimates and assumptions that affect amounts reported in the consolidated financial statements and notes thereto. Actual amounts may ultimately differ from these estimates.
The following are significant management judgments, estimates and assumptions in applying the accounting policies of the Corporation that have the most significant effect on recognition and measurement of assets, liabilities, income and expenses:
Recognition of deferred tax assets
The extent to which deferred tax assets can be recognized is based on an assessment of the probability of the Corporation’s future taxable income against which the deferred tax assets can be utilized. In addition, significant judgment is required in assessing the impact of any legal or economic limits or uncertainties in various tax jurisdictions.
Impairment of long-lived assets
In assessing impairment, management estimates the recoverable amount of each asset or cash generating units based on expected future cash flows and uses an interest rate to discount them. Estimation uncertainty relates to assumptions about future operating results and the determination of a suitable discount rate.
Useful lives of depreciable assets
The Corporation reviews its estimate of the useful lives of depreciable assets at each reporting date, based on the expected utilization of the assets. Uncertainties in these estimates relate to technical obsolescence that may change the utilization of certain software and equipment.
Share-based payment
The Corporation measures the cost of equity settled transactions by reference to the fair value of the equity instruments at the date at which they are granted. Estimating fair value for share-based payment transactions requires determining the most appropriate valuation model, which is dependent on the terms and conditions of the grant. This estimate also requires determining the most appropriate inputs to the valuation model including the expected life of the share option, volatility and dividend yield and making assumptions about them.
LML PAYMENT SYSTEMS INC.
NOTES TO CONSOLIDATED FINANCIAL STATEMENTS
|
|
(unless otherwise indicated, all amounts are U.S. dollars)
|
|
|
3.
|
SIGNIFICANT ACCOUNTING POLICIES (continued)
|
Allowance account for credit losses
The Corporation provides for bad debt by establishing an allowance for doubtful accounts based on its best estimate of any potentially uncollectible accounts. Uncertainty relates to the actual collectibility of customer balances that can vary from the Corporation’s estimation.
|
|
(b)
|
Cash and Cash Equivalents
|
|
|
Cash and cash equivalents include cash on hand and all highly liquid debt instruments purchased with a maturity of three months or less at the date of purchase.
|
|
|
(c)
|
Short-term Investments
|
|
|
Included in short-term investments are securities typically with terms of maturity of three months or more, but one year or less when acquired.
|
|
|
(d)
|
Accounts Receivable
|
Accounts receivable are stated net of allowances for uncollectible accounts. Management develops the estimate of the allowance based on the Corporation’s experience with specific customers, its understanding of their current economic circumstances and its own judgment as to the likelihood of their ultimate payment. Management also considers the Corporation’s collection experience with the balance of its receivables portfolio and makes estimates regarding collectability based on trends in aging.
|
|
(e)
|
Property and Equipment
|
Property and equipment are recorded at cost less accumulated depreciation. The straight-line method is used to depreciate assets over their estimated useful lives as follows:
|
Computer equipment
|
3 – 5 years
|
|
Computer software
|
3 – 5 years
|
|
Furniture and fixtures
|
3 years
|
|
Leasehold improvements
|
Lesser of the term of the lease or the useful life of the leasehold improvement
|
|
Office equipment
|
5 years
|
|
|
(f)
|
Leases
|
Leases are classified as either finance or operating leases. A lease that transfers substantially all of the risks and rewards incidental to the ownership of property is classified as a finance lease. All other leases are accounted for as operating leases wherein rental payments are expensed on a straight-line basis. At the inception of a finance lease, an asset and an obligation are recorded at an amount equal to the lesser of the present value of the future minimum lease payments and the property’s fair value at the beginning of such lease. Depreciation of the equipment under a finance lease is on the same basis as similar property and equipment.
|
|
(g)
|
Research and Development Costs
|
The Corporation incurs costs to research and develop its proprietary software products to be sold, licensed or otherwise marketed. Costs incurred in the research phase are expensed as incurred. Costs incurred in the development phase are expensed as incurred unless a project meets the criteria for deferral and amortization, in which case the development costs are deferred and amortized over the estimated useful life of the software product developed. Amortization commences when development of the software is complete and the product is available for sale to customers. During the fiscal years ended March 31, 2012 and 2011 and as of April 1, 2010, the Corporation did not defer any development costs.
LML PAYMENT SYSTEMS INC.
NOTES TO CONSOLIDATED FINANCIAL STATEMENTS
(unless otherwise indicated, all amounts are U.S. dollars)
|
|
3.
|
SIGNIFICANT ACCOUNTING POLICIES (continued)
|
|
|
(h)
|
Patents
|
Patent costs are amortized using the straight-line method over the estimated useful life of 15 years.
|
|
(i)
|
Goodwill
|
Goodwill represents the future economic benefits arising from a business combination that are not individually identified and separately recognized. Goodwill is stated after separate recognition of identifiable intangible assets. It is calculated as the excess of the sum of a) fair value of consideration transferred, b) the recognized amount of any non-controlling interest in the acquiree and c) acquisition-date fair value of any existing equity interest in the acquiree, over the acquisition-date fair values of identifiable net assets. If the fair values of identifiable net assets exceed the sum calculated above, the excess amount (i.e. gain on a bargain purchase) is recognized in profit or loss immediately. Goodwill is carried at cost less accumulated impairment losses. Refer to Note 3(k) for a description of impairment testing procedures.
|
|
(j)
|
Other Intangible Assets
|
Other intangible assets relate to the acquisition of partner relationships, merchant contracts, existing technology and trade names. The partner relationships and merchant contracts are amortized over ten years on a straight-line basis. The existing technology is amortized over five years on a straight-line basis. Trade names are words, phrases or symbols that distinguish or identify an enterprise as a whole or its products or services. They create consumer awareness and product recognition in the marketplace thereby enhancing the marketability of products and services and creating continuous value for the Corporation. They are, therefore, considered indefinite in nature and, as such, are not amortized. Trade names are tested for impairment at least annually or more frequently if an event or circumstance occurs that reduces the recoverable amount of the asset below its carrying amount.
|
|
(k)
|
Impairment testing of goodwill, other intangible assets and property and equipment
|
For the purposes of assessing impairment, assets are grouped at the lowest levels for which there are largely independent cash inflows (cash-generating units). As a result, some assets are tested individually for impairment and some are tested together with other assets. Goodwill is allocated to those cash-generating units that are expected to benefit from synergies of the related business combination and represent the lowest level within the Corporation at which management monitors goodwill.
Cash-generating units to which goodwill has been allocated are tested for impairment at least annually. All other individual assets or cash-generating units are tested for impairment whenever events or changes in circumstances indicate that the carrying amount may not be recoverable.
An impairment loss is recognized in profit or loss for the amount by which the asset's or cash-generating unit's carrying amount exceeds its recoverable amount, which is the higher of fair value less costs to sell and value-in-use. To determine the value-in-use, management estimates expected future cash flows from each cash-generating unit and determines a suitable interest rate in order to calculate the present value of those cash flows. The data used for impairment testing procedures are directly linked to the Corporation's latest approved budget, adjusted as necessary to exclude the effects of future reorganizations and asset enhancements. Discount factors are determined individually for each cash-generating unit and reflect their respective risk profiles as assessed by management.
LML PAYMENT SYSTEMS INC.
NOTES TO CONSOLIDATED FINANCIAL STATEMENTS
(unless otherwise indicated, all amounts are U.S. dollars)
|
|
3.
|
SIGNIFICANT ACCOUNTING POLICIES (continued)
|
Impairment losses for cash-generating units reduce first the carrying amount of any goodwill allocated to that cash-generating unit. Any remaining impairment loss is charged pro rata to the other assets in the cash-generating unit.
With the exception of goodwill, all assets are subsequently reassessed for indications that an impairment loss previously recognized may no longer exist. An impairment loss is reversed only if there has been a change in the estimates used to determine the asset’s recoverable amount since the last impairment loss was recognized. If this is the case, the carrying amount of the asset is increased to its recoverable amount to the extent that the increased carrying amount of the asset does not exceed the carrying amount that would have been determined had no impairment loss been recognized for the asset. An impairment charge is reversed in profit or loss.
|
|
(l)
|
Revenue Recognition
|
The Corporation’s revenue is derived from three separate lines of business: (i) transaction payment processing (“TPP”); (ii) intellectual property licensing (“IPL”) and (iii) check processing (“CP”).
Revenue from the Corporation’s TPP segment is derived from transaction fees, monthly gateway fees and one-time set-up fees paid by merchants. Transaction fees are recognized in the period in which the transaction occurs. Gateway fees are monthly subscription fees charged to the merchant customers for the use of the Corporation’s payment gateway and are recognized in the period in which the service is provided. Set-up fees represent one-time charges for initiating the processing services. Although these fees are generally paid at the commencement of the agreement, they are recognized ratably over the estimated average life of the merchant relationship, which is determined through a series of analyses of active and deactivated merchants.
The Corporation’s IPL segment revenues are derived from licensing fees paid by licensees of the Corporation’s intellectual property. Licensing fees are based on usage of the technology embodied in the intellectual property being licensed. In some instances, licensees pay licensing fees on a running royalty basis, which is a pay-as-you-go model, and in other instances, licensees pay a one-time, non-recurring license fee amount based upon usage (“Paid-up Licenses”). Fees from Paid-up Licenses are fully due and payable up front at the inception of each licensing arrangement and are non- refundable.
Usage pertaining to Paid-up Licenses is contractually determined and in some cases, in order to determine usage and to facilitate the negotiation of a license agreement, the commencement of litigation and the discovery process inherent therein (to determine usage), is sometimes employed. When the Corporation receives licensing payments on a one-time, fully paid-up basis, regardless of whether the licensees entered into license agreements with or without concurrent litigation, the Corporation follows the provisions of International Accounting Standard 18, Revenue Recognition (“IAS 18”).
Revenues derived from sales of Paid-up Licenses comprise the following three components:
|
·
|
Licenses – licenses are issued for the use of existing patents;
|
|
·
|
Release from litigation – the Corporation releases the licensees from any claims or causes of action for patent infringement as of the effective date of the underlying agreement; and
|
|
·
|
Covenant-not-to-sue provision – the Corporation agrees to a covenant-not-to-sue provision for infringement of any patents for a specified period commencing on the effective date of the underlying agreement.
|
As all of these components are considered to be fully delivered upon inception of each arrangement, the Corporation does not separately allocate revenue to each individual component.
All of the above components of Paid-up Licenses result in the recognition of revenue rather than gains, including the release from litigation and covenant-not-to-sue provisions, since the payments received arise from activities representing the ongoing major or central operations of the Corporation’s IPL segment rather than incidental or peripheral transactions of that segment.
LML PAYMENT SYSTEMS INC.
NOTES TO CONSOLIDATED FINANCIAL STATEMENTS
(unless otherwise indicated, all amounts are U.S. dollars)
|
|
3.
|
SIGNIFICANT ACCOUNTING POLICIES (continued)
|
The following facts and circumstances are also considered when determining whether payments received with respect to the above components of a Paid-up License should be classified as revenue and recognized upon the effective date of the license agreement granting a Paid-up License:
|
·
|
the attributes of the arrangement are similar to that of a product sale in that delivery occurs on the effective date of the Paid-up License and not over a specified time or usage period and the license agreement covers the duration of the legal life of the intellectual property;
|
|
·
|
all elements of the Paid-up License are delivered as of the effective date of the license agreement and no further deliverables are required of the Corporation;
|
|
·
|
all risks and rewards of ownership of the intellectual property are fully transferred to the licensee, with the licensee able to obtain the full benefit of the Paid-up License to the intellectual property as of the effective date of the license agreement;
|
|
·
|
the license to the intellectual property is non-exclusive, similar to the non-exclusive nature of many software-licensing arrangements treated as product sales under IFRS and U.S. GAAP;
|
|
·
|
the consideration received for a Paid-up License is fixed and non-refundable with no trailing royalties or other variable consideration present in the license agreement.
|
There are no undelivered separately identifiable components, refund, return or cancellation rights, no continuing performance obligations and no when-and-if available deliverables required to be provided by the Corporation as licensor.
Revenue from the Corporation’s CP segment consists primarily of transaction charges from primary and secondary check collection, including electronic check re-presentment. Fees associated with the primary and secondary check collection business, including electronic check re-presentment, are contingent upon successful recovery and, accordingly, revenue is recognized as cash is received.
|
|
(m)
|
Income Taxes
|
Tax expense recognized in profit or loss comprises the sum of deferred tax and current tax not recognized in other comprehensive income or directly in equity.
Current tax assets and/or liabilities comprise those obligations to, or claims from, fiscal authorities relating to the current or prior reporting periods, that are recoverable or unpaid at the reporting date. Current tax is payable on taxable profit, which differs from profit or loss in the consolidated financial statements. Calculation of current tax is based on tax rates and tax laws that have been enacted or substantively enacted by the end of the reporting period.
Deferred taxes are calculated using the liability method on temporary differences between the carrying amounts of assets and liabilities and their tax bases. However, deferred tax is not provided on the initial recognition of goodwill or on the initial recognition of an asset or liability unless the related transaction is a business combination or affects tax or accounting profit. Deferred tax on temporary differences associated with investments in subsidiaries and joint ventures is not provided if reversal of these temporary differences can be controlled by the Corporation and it is probable that reversal will not occur in the foreseeable future.
Deferred tax assets and liabilities are calculated, without discounting, at tax rates that are expected to apply to their respective period of realization, provided they are enacted or substantively enacted by the end of the reporting period.
Deferred tax assets are recognized to the extent that it is probable that they will be able to be utilized against future taxable income.
LML PAYMENT SYSTEMS INC.
NOTES TO CONSOLIDATED FINANCIAL STATEMENTS
(unless otherwise indicated, all amounts are U.S. dollars)
|
|
3.
|
SIGNIFICANT ACCOUNTING POLICIES (continued)
|
Deferred tax assets and liabilities are offset only when the Corporation has a right and intention to set off current tax assets and liabilities from the same taxation authority.
Changes in deferred tax assets or liabilities are recognized as a component of tax income or expense in profit or loss, except where they relate to items that are recognized in other comprehensive income or directly in equity, in which case the related deferred tax is also recognized in other comprehensive income or equity, respectively.
|
|
(n)
|
Earnings Per Common Share
|
Basic earnings per share is computed by dividing net income by the weighted average number of common shares outstanding during the period.
Diluted earnings per share is computed similar to basic earnings per share, except that the weighted average number of common shares outstanding is increased to include additional shares for the assumed exercise of stock options and warrants at the beginning of the reporting period, or at the grant date if later, if dilutive. The number of additional shares is calculated assuming that outstanding stock options and warrants were exercised and the proceeds from such exercises were used to repurchase common shares at the average market price during the reporting period. Stock options and warrants are dilutive when the market price of the common shares for the average of the period exceeds the exercise price of the options and warrants and the Corporation has generated positive net income for the period.
|
|
(o)
|
Share-based Payment Plans
|
The Corporation has three share-based payment plans, described more fully in Note 10 (c). The Corporation recognizes compensation expense for stock options awarded based on the fair value of the options at the grant date using the Black-Scholes option pricing method. The Corporation recognizes share-based payments expense over the requisite service period during which an employee is required to provide service in exchange for the equity instrument award, which generally is the vesting period with the offsetting credit to contributed surplus. Upon the exercise of an equity instrument award, any amounts originally credited to contributed surplus are credited to capital stock. The impact of forfeitures that may occur prior to vesting is also estimated and considered in the amount of expense recognized. Forfeiture estimates are revised, if necessary, in subsequent periods when actual forfeitures differ from those estimates.
Any consideration paid on the exercise of equity awards or purchase of equity is credited to capital stock.
|
|
(p)
|
Foreign currency translation
|
Except as described below, the Corporation’s functional and reporting currency is the U.S. dollar. Monetary assets and liabilities denominated in foreign currencies are translated using the exchange rate prevailing at the reporting date and non-monetary assets and liabilities are translated at exchange rates prevailing at the historical transaction date. Average rates for the period are used to translate the Corporation’s revenue and expenses. Gains and losses arising on settlement of foreign currency denominated transactions or balances are included in profit or loss.
The functional currency of the Corporation’s Canadian Beanstream subsidiary is the Canadian dollar. Beanstream’s assets and liabilities are translated into U.S. dollars at rates of exchange in effect at the reporting date. Average rates for the period are used to translate Beanstream’s revenues and expenses. Gains and losses arising on the translation of Beanstream’s financial statements are reported as other comprehensive income which is a component of accumulated other comprehensive income.
LML PAYMENT SYSTEMS INC.
NOTES TO CONSOLIDATED FINANCIAL STATEMENTS
(unless otherwise indicated, all amounts are U.S. dollars)
|
|
3.
|
SIGNIFICANT ACCOUNTING POLICIES (continued)
|
|
|
(q)
|
Financial Instruments
|
All financial instruments are classified into one of five categories: fair value through profit and loss, held-to-maturity investments, loans and receivables, available-for-sale financial assets or other financial liabilities. All financial instruments are initially recognized at fair value. All financial instruments are subsequently measured at fair value except for loans and receivables, held-to-maturity investments and other financial liabilities which are measured at amortized cost using the effective interest method. Changes in fair value of profit and loss financial instruments are recognized in profit or loss. Changes in fair value of available-for-sale financial assets are recorded in other comprehensive income until the instrument is derecognized or impaired.
|
|
(r)
|
New standards and interpretations not yet adopted
|
Standards issued but not yet effective up to the date of issuance of the Corporation’s consolidated financial statements are listed below. This listing is of standards and interpretations issued which the Corporation reasonably expects to be applicable at a future date. The Corporation intends to adopt those standards when they become effective. The Corporation has yet to assess the full impact of these standards.
IFRS 9 - Financial instrument: Classification and Measurement
IFRS 9 was issued in November 2009. This standard is the first step in the process to replace IAS 39 Financial Instruments: Recognition and Measurements. IFRS 9 introduces new requirements for classifying and measuring assets and liabilities, which may affect the Corporation’s accounting for its financial instruments. The standard is not applicable until annual periods beginning on or after January 1, 2015 but is available for early adoption, however, the Corporation does not currently intend to early adopt this standard.
IFRS 10 - Consolidated Financial Statements
The Corporation will be required to adopt IFRS 10 Consolidated Financial Statements (“IFRS 10”) effective for annual periods beginning on or after January 1, 2013, with earlier application permitted. IFRS 10 replaces the consolidation requirements in IAS 27 Consolidated and Separate Financial Statements (“IAS 27”) and interpretation SIC-12 Consolidation—Special Purpose Entities (“SIC-12”). IFRS 10 provides a revised definition of control and related application guidance so that a single control model can be applied to all entities. IFRS 10 also enhances disclosures about consolidated and unconsolidated entities to be published in a separate comprehensive disclosure standard related to involvement in other entities. The Corporation has not early adopted this standard and is currently assessing the impact that this standard will have on the consolidated financial statements.
IFRS 12 - Disclosure of Interests in Other Entities
IFRS 12 provides the required disclosures for interests in subsidiaries and joint arrangements. These disclosures will require information that will assist users of financial statements to evaluate the nature, risks and financial effects associated with an entity’s interests in subsidiaries and joint arrangements. This standard is not applicable until annual periods beginning on or after January 1, 2013.
LML PAYMENT SYSTEMS INC.
NOTES TO CONSOLIDATED FINANCIAL STATEMENTS
(unless otherwise indicated, all amounts are U.S. dollars)
|
|
3.
|
SIGNIFICANT ACCOUNTING POLICIES (continued)
|
IFRS 13 – Fair Value Measurement
IFRS 13 is a comprehensive standard for fair value measurement and disclosure requirements for use across all IFRS standards. The new standard clarifies that fair value is the price that would be received to sell an asset, or paid to transfer a liability in an orderly transaction between market participants, at the measurement date. It also establishes disclosures about fair value measurement. Under existing IFRS, guidance on measuring and disclosing fair value is dispersed among the specific standards requiring fair value measurement and in many cases does not reflect a clear measurement basis or consistent disclosures. This standard is not applicable until annual periods beginning on or after January 1, 2013.
IAS 1 Financial Statement Presentation
The Corporation will be required to adopt the amendments to IAS 1 Financial Statement Presentation (“IAS 1”) effective for annual periods beginning on or after July 1, 2012. These amendments improve the presentation of components of other comprehensive income (“OCI”). The amendments to this standard do not change the nature of the items that are currently recognized in OCI, but requires presentational changes. The Corporation is currently assessing the impact that this standard will have on the consolidated financial statements.
|
|
4.
|
FINANCIAL INSTRUMENTS
|
|
|
(a)
|
The Corporation classifies its cash and cash equivalents, funds held for merchants, short-term investments, restricted cash and accounts receivable as loans and receivables measured at amortized cost using the effective interest method. Accounts payable, certain accrued liabilities and funds due to merchants are classified as other financial liabilities measured at amortized cost using the effective interest method.
|
The carrying value of the Corporation’s financial assets and liabilities is considered to be a reasonable approximation of fair value due to their immediate or short term maturity or their ability for liquidation at comparable amounts.
Carrying value and fair value of financial assets and liabilities as at March 31, 2012 and 2011 and April 1, 2010 are summarized as follows:
|
March 31, 2012
|
March 31, 2011
|
April 1, 2010
|
||||||||||||||||||||||
|
Carrying Value
|
Fair
Value
|
Carrying Value
|
Fair
Value
|
Carrying Value
|
Fair
Value
|
|||||||||||||||||||
|
Loans and receivables
|
$ | 41,594,909 | $ | 41,594,909 | $ | 35,623,084 | $ | 35,623,084 | $ | 12,104,346 | $ | 12,104,346 | ||||||||||||
|
Other financial liabilities
|
$ | 11,651,338 | $ | 11,651,338 | $ | 9,258,087 | $ | 9,258,087 | $ | 7,681,469 | $ | 7,681,469 | ||||||||||||
|
|
(b)
|
Restricted cash
|
Under the terms of the processing agreement with one of the Corporation’s processing banks, the Corporation pledged a deposit of $175,000 (March 31, 2011 - $175,000; April 1, 2010 - $175,000) against charge back losses. Non-current restricted cash represents funds held by a third party processor as security for the Corporation’s merchant accounts.
LML PAYMENT SYSTEMS INC.
NOTES TO CONSOLIDATED FINANCIAL STATEMENTS
(unless otherwise indicated, all amounts are U.S. dollars)
|
|
4.
|
FINANCIAL INSTRUMENTS (continued)
|
|
|
(c)
|
Market Risk
|
Currency Risk
The Corporation’s functional currency is the U.S. dollar except for the Corporation’s Canadian Beanstream subsidiary whose functional currency is the Canadian dollar. Movements in the foreign currency exchange rate between the Canadian and U.S. dollar will give rise to gains and losses to the Corporation due to the existence of cash balances and other monetary assets and liabilities denominated in a currency other than the functional currency of each entity within the consolidated group. Significant losses may occur due to significant balances of cash and cash equivalents and short-term investments held in Canadian dollars (U.S. dollars for Beanstream) that may be affected negatively by an increase in the value of the U.S. dollar as compared to the Canadian dollar (Canadian dollar as compared to the U.S. dollar for Beanstream). The Corporation has not hedged its exposure to foreign currency fluctuations.
As at March 31, 2012 and 2011 and April 1, 2010, the Corporation was exposed to currency risk through its cash and cash equivalents, restricted cash, funds held for merchants, short-term investments, accounts receivable, accounts payable, accrued liabilities, and funds due to merchants denominated in Canadian dollars (U.S. dollars for Beanstream).
Based on the foreign currency exposure as at March 31, 2012 and 2011 and April 1, 2010, and assuming all other variables remain constant, a 10% depreciation or appreciation of the Canadian dollar against the U.S. dollar would result in an increase/decrease of $87,918, $453,920 and $243,571, respectively, in the Corporation’s foreign currency loss/gain.
As at March 31, 2012 and 2011 and April 1, 2010, the Corporation’s Canadian Beanstream subsidiary was exposed to currency risk on the translation of its financial instruments to U.S. dollars. Beanstream’s financial instruments are translated into U.S. dollars at rates of exchange in effect at the reporting date. Gains and losses arising on the translation of Beanstream’s financial instruments are reported as other comprehensive income which is a component of accumulated other comprehensive income. Based on the foreign currency exposure as at March 31, 2012, 2011 and April 1, 2010, and assuming all other variables remain constant, a 10% depreciation or appreciation of the Canadian dollar against the U.S. dollar would result in an increase/decrease of $241,633, $6,461 and $18,922, respectively, in the Corporation’s other comprehensive income.
Interest Rate Risk
Interest rate risk is the risk that the fair value or future cash flows of a financial instrument will fluctuate because of changes in market interest rates. The Corporation’s exposure to interest rate risk is limited as its cash and payment processing accounts earn minimal interest and short-term investments bear fixed rates of interest.
Other Price Risk
Other price risk is the risk that the future value or cash flows of a financial instrument will fluctuate because of changes in market prices. Exposure to price risk is low as the Corporation’s cash management policy is to invest excess cash in high grade/low risk investments over short periods of time.
|
|
(d)
|
Credit Risk
|
Credit risk is the risk of a financial loss if a customer or counter party to a financial instrument fails to meet its contractual obligations. Any credit risk exposure on cash balances and short-term investments is considered negligible as the Corporation places funds or deposits only with major established banks in the countries in which it has payment processing services. The credit risk arises primarily from the Corporation’s trade receivables from customers.
LML PAYMENT SYSTEMS INC.
NOTES TO CONSOLIDATED FINANCIAL STATEMENTS
(unless otherwise indicated, all amounts are U.S. dollars)
|
|
4.
|
FINANCIAL INSTRUMENTS (continued)
|
On a regular basis, the Corporation reviews the collectability of its trade accounts receivable and establishes an allowance for doubtful accounts based on its best estimates of any potentially uncollectible accounts. As at March 31, 2012, the balance of the Corporation’s allowance for doubtful accounts was $27,397 (March 31, 2011 - $28,152; April 1, 2010 - $31,463). The Corporation has good credit history with its customers and the amounts due from them are received as expected.
Pursuant to their respective terms, accounts receivable are aged as follows at March 31, 2012:
|
0-30 days
|
$1,295,178
|
|
31-60 days
|
190,321
|
|
61-90 days
|
-
|
|
Over 90 days due
|
144,383
|
|
$1,629,882
|
Concentration of credit risk
Financial instruments that potentially subject the Corporation and its subsidiaries to concentrations of credit risk consist principally of cash and cash equivalents, short-term investments and accounts receivable.
Cash and cash equivalents and short-term investments are invested in major financial institutions in the U.S. and Canada. Such deposits may be in excess of insured limits and are not insured in other jurisdictions. Management believes that the financial institutions that hold the Corporation’s investments are financially sound and, accordingly, relatively minimal credit risk exists with respect to these investments.
The accounts receivable of the Corporation and its subsidiaries are derived from sales to customers located primarily in the U.S. and Canada. The Corporation performs ongoing credit evaluations of its customers. The Corporation generally does not require collateral.
An allowance for doubtful accounts is determined with respect to those amounts that the Corporation has determined to be doubtful of collection. At March 31, 2012, three customers accounted for 17%, 9% and 7% of the Corporation’s accounts receivable balance (March 31, 2011 – 19%, 13% and 10%; April 1, 2010 – 25%, 19% and 2%).
LML PAYMENT SYSTEMS INC.
NOTES TO CONSOLIDATED FINANCIAL STATEMENTS
(unless otherwise indicated, all amounts are U.S. dollars)
|
|
4.
|
FINANCIAL INSTRUMENTS (continued)
|
|
|
(e)
|
Liquidity Risk
|
Liquidity risk is the risk that the Corporation will not be able to meet its financial obligations as they are due. The Corporation continuously monitors actual and forecasted cash flows to ensure, as far as possible, there is sufficient working capital to satisfy its operating requirements.
|
Total
|
Less than 1 year
|
1-3 years
|
4-5 years
|
After 5 years
|
||||||||||||||||
|
Contractual Obligations, at March 31, 2012
|
||||||||||||||||||||
|
Accounts payable and accrued liabilities
|
$ | 2,166,156 | $ | 2,166,156 | $ | - | $ | - | $ | - | ||||||||||
|
Funds due to merchants
|
9,485,182 | 9,485,182 | - | - | - | |||||||||||||||
|
Finance lease obligations
|
7,380 | 2,460 | 4,920 | - | - | |||||||||||||||
|
Total
|
$ | 11,658,718 | $ | 11,653,798 | $ | 4,920 | $ | - | $ | - | ||||||||||
|
Total
|
Less than 1 year
|
1-3 years
|
4-5 years
|
After 5 years
|
||||||||||||||||
|
Contractual Obligations, at March 31, 2011
|
||||||||||||||||||||
|
Accounts payable and accrued liabilities
|
$ | 2,093,667 | $ | 2,093,667 | $ | - | $ | - | $ | - | ||||||||||
|
Funds due to merchants
|
7,164,420 | 7,164,420 | - | - | - | |||||||||||||||
|
Finance lease obligations
|
9,840 | 2,460 | 4,920 | 2,460 | - | |||||||||||||||
|
Total
|
$ | 9,267,927 | $ | 9,260,547 | $ | 4,920 | $ | 2,460 | $ | - | ||||||||||
|
Total
|
Less than 1 year
|
1-3 years
|
4-5 years
|
After 5 years
|
||||||||||||||||
|
Contractual Obligations, at April 1, 2010
|
||||||||||||||||||||
|
Accounts payable and accrued liabilities
|
$ | 1,876,717 | $ | 1,876,717 | $ | - | $ | - | $ | - | ||||||||||
|
Funds due to merchants
|
5,804,752 | 5,804,752 | - | - | - | |||||||||||||||
|
Finance lease obligations
|
21,035 | 11,195 | 4,920 | 4,920 | - | |||||||||||||||
|
Total
|
$ | 7,702,504 | $ | 7,692,664 | $ | 4,920 | $ | 4,920 | $ | - | ||||||||||
LML PAYMENT SYSTEMS INC.
NOTES TO CONSOLIDATED FINANCIAL STATEMENTS
(unless otherwise indicated, all amounts are U.S. dollars)
|
|
5.
|
CASH AND CASH EQUIVALENTS AND FUNDS HELD FOR/DUE MERCHANTS
|
Cash and cash equivalents
At March 31, 2012, the Corporation held $26,783,754 (March 31, 2011: $26,917,491; April 1, 2010 - $5,069,763) in cash and cash equivalents. Included in this balance is $1,207,000 (March 31, 2011: $1,000,000; April 1, 2010 - $1,000,000) in cash and cash equivalents used as continuing collateral security with the Corporation’s primary financial institution which is available for use by the Corporation.
Funds held for/due to merchants
At March 31, 2012, the Corporation was holding funds due to merchants in the amount of $9,485,182 (March 31, 2011 – $7,164,420; April 1, 2010 - $5,804,752). The funds held for/due to merchants are comprised of the following:
|
·
|
funds held in reserves calculated by applying contractually determined percentages of the gross transaction volume for a hold-back period of up to six months;
|
|
·
|
funds from transaction payment processing which may be held for up to approximately fifteen days, the actual number of days depends on the contractual terms with each merchant; and
|
|
·
|
funds from payroll/pre-authorized debit services provided on behalf of merchants, which may be held for up to approximately two days.
|
|
|
6.
|
PROPERTY AND EQUIPMENT
|
|
Computer Equipment
|
Computer software
|
Furniture and fixtures
|
Leasehold improvements
|
Office equipment
|
Websites and trademarks
|
Total
|
||||||||||||||||||||||
|
Gross carrying amount
|
||||||||||||||||||||||||||||
|
Balance as at April 1, 2011
|
$ | 130,472 | $ | 136,334 | $ | 4,560 | $ | 2,954 | $ | 143,395 | $ | - | $ | 417,715 | ||||||||||||||
|
Additions
|
32,693 | 27,909 | - | - | 3,998 | - | 64,600 | |||||||||||||||||||||
|
Disposals
|
(66,320 | ) | (54,178 | ) | - | - | (72,226 | ) | - | (192,724 | ) | |||||||||||||||||
|
Net exchange differences
|
- | - | - | (82 | ) | - | - | (82 | ) | |||||||||||||||||||
|
Balance as at March 31, 2012
|
96,845 | 110,065 | 4,560 | 2,872 | 75,167 | - | 289,509 | |||||||||||||||||||||
|
Depreciation and impairment
|
||||||||||||||||||||||||||||
|
Balance as at April 1, 2011
|
(74,432 | ) | (76,132 | ) | (3,420 | ) | (2,186 | ) | (98,323 | ) | - | (254,493 | ) | |||||||||||||||
|
Disposals
|
66,320 | 54,178 | - | - | 72,226 | - | 192,724 | |||||||||||||||||||||
|
Depreciation
|
(34,549 | ) | (42,308 | ) | (912 | ) | (602 | ) | (25,258 | ) | - | (103,629 | ) | |||||||||||||||
|
Net exchange differences
|
(1,560 | ) | (596 | ) | - | 60 | (519 | ) | - | (2,615 | ) | |||||||||||||||||
|
Balance as at March 31, 2012
|
(44,221 | ) | (64,858 | ) | (4,332 | ) | (2,728 | ) | (51,874 | ) | - | (168,013 | ) | |||||||||||||||
|
Carrying amount as at March 31, 2012
|
$ | 52,624 | $ | 45,207 | $ | 228 | $ | 144 | $ | 23,293 | $ | - | $ | 121,496 | ||||||||||||||
|
Gross carrying amount
|
||||||||||||||||||||||||||||
|
Balance as at April 1, 2010
|
$ | 156,662 | $ | 207,003 | $ | 4,560 | $ | 2,820 | $ | 155,072 | $ | 1,932 | $ | 528,049 | ||||||||||||||
|
Additions
|
34,218 | 18,772 | - | - | 11,442 | - | 64,432 | |||||||||||||||||||||
|
Disposals
|
(60,408 | ) | (89,441 | ) | - | - | (23,119 | ) | (1,932 | ) | (174,900 | ) | ||||||||||||||||
|
Net exchange differences
|
- | - | - | 134 | - | - | 134 | |||||||||||||||||||||
|
Balance as at March 31, 2011
|
130,472 | 136,334 | 4,560 | 2,954 | 143,395 | - | 417,715 | |||||||||||||||||||||
|
Depreciation and impairment
|
||||||||||||||||||||||||||||
|
Balance as at April 1, 2010
|
(95,075 | ) | (117,828 | ) | (2,508 | ) | (1,551 | ) | (89,689 | ) | (1,817 | ) | (308,468 | ) | ||||||||||||||
|
Disposals
|
60,408 | 89,441 | - | - | 23,119 | 1,932 | 174,900 | |||||||||||||||||||||
|
Depreciation
|
(42,259 | ) | (48,792 | ) | (912 | ) | (544 | ) | (32,587 | ) | (115 | ) | (125,209 | ) | ||||||||||||||
|
Net exchange differences
|
2,494 | 1,047 | - | (91 | ) | 834 | - | 4,284 | ||||||||||||||||||||
|
Balance as at March 31, 2011
|
(74,432 | ) | (76,132 | ) | (3,420 | ) | (2,186 | ) | (98,323 | ) | - | (254,493 | ) | |||||||||||||||
|
Carrying amount as at March 31, 2011
|
$ | 56,040 | $ | 60,202 | $ | 1,140 | $ | 768 | $ | 45,072 | $ | - | $ | 163,222 | ||||||||||||||
LML PAYMENT SYSTEMS INC.
NOTES TO CONSOLIDATED FINANCIAL STATEMENTS
(unless otherwise indicated, all amounts are U.S. dollars)
|
|
6.
|
PROPERTY AND EQUIPMENT (continued)
|
Depreciation expense on property and equipment totaled $104,750 in 2012 with $50,495 included in costs of revenue, $29,179 in general and administrative expenses, $13,791 in sales and marketing expenses and $11,285 in product development and enhancement expenses. Depreciation expense on property and equipment totaled $124,070 in 2011 with $60,228 included in costs of revenue, $39,259 in general and administrative expenses, $13,521 in sales and marketing expenses and $11,062 in product development and enhancement expenses. Property and equipment include $12,300 and $12,300 of assets that are financed under finance leases as at March 31, 2012 and March 31, 2011, respectively. Accumulated depreciation on these assets totals $4,920 and $2,460 for the years ended March 31, 2012 and March 31, 2011, respectively. Depreciation of assets under finance leases is included in depreciation expense and totaled $2,460 in 2012 and $2,460 in 2011.
|
|
7.
|
PATENTS
|
|
Patents
|
||||
|
Gross carrying amount
|
||||
|
Balance as at April 1, 2011
|
$ | 2,045,715 | ||
|
Amortization and impairment
|
||||
|
Balance as at April 1, 2011
|
1,757,838 | |||
|
Amortization
|
167,420 | |||
|
Balance as at March 31, 2012
|
1,925,258 | |||
|
Carrying amount as at March 31, 2012
|
$ | 120,457 | ||
|
Patents
|
||||
|
Gross carrying amount
|
||||
|
Balance as at April 1, 2010
|
$ | 2,045,715 | ||
|
Amortization and impairment
|
||||
|
Balance as at April 1, 2010
|
1,590,411 | |||
|
Amortization
|
167,427 | |||
|
Balance as at March 31, 2011
|
1,757,838 | |||
|
Carrying amount as at March 31, 2011
|
$ | 287,877 | ||
Patent amortization expense is included in general and administrative expenses in the consolidated statements of earnings and comprehensive income.
The remaining unamortized portion of $120,457 will be fully amortized in fiscal 2013.
LML PAYMENT SYSTEMS INC.
NOTES TO CONSOLIDATED FINANCIAL STATEMENTS
(unless otherwise indicated, all amounts are U.S. dollars)
|
|
8.
|
OTHER INTANGIBLE ASSETS
|
The components of other intangible assets are as follows:
|
Amortizable Intangible Assets
|
Unamortizable Intangible Assets
|
|
||||||||||||||||||
|
Partner Relationships
|
Merchant contracts
|
Existing technology
|
Trade names
|
Total | ||||||||||||||||
|
Gross carrying amount
|
||||||||||||||||||||
|
Balance as at April 1, 2011
|
$ | 928,000 | $ | 2,963,500 | $ | 530,000 | $ | 1,650,500 | $ | 6,072,000 | ||||||||||
|
Amortization and impairment
|
||||||||||||||||||||
|
Balance as at April 1, 2011
|
348,000 | 1,111,313 | 397,500 | - | 1,856,813 | |||||||||||||||
|
Amortization
|
92,800 | 296,350 | 106,000 | - | 495,150 | |||||||||||||||
|
Balance as at March 31, 2012
|
440,800 | 1,407,663 | 503,500 | - | 2,351,963 | |||||||||||||||
|
Carrying amount as at March 31, 2012
|
$ | 487,200 | $ | 1,555,837 | $ | 26,500 | $ | 1,650,500 | $ | 3,720,037 | ||||||||||
|
Amortizable Intangible Assets
|
Unamortizable Intangible Assets
|
|
||||||||||||||||||
|
Partner Relationships
|
Merchant contracts
|
Existing technology
|
Trade names
|
Total | ||||||||||||||||
|
Gross carrying amount
|
||||||||||||||||||||
|
Balance as at April 1, 2010
|
$ | 928,000 | $ | 2,963,500 | $ | 530,000 | $ | 1,650,500 | $ | 6,072,000 | ||||||||||
|
Amortization and impairment
|
||||||||||||||||||||
|
Balance as at April 1, 2010
|
255,200 | 814,963 | 291,500 | - | 1,361,663 | |||||||||||||||
|
Amortization
|
92,800 | 296,350 | 106,000 | - | 495,150 | |||||||||||||||
|
Balance as at March 31, 2011
|
348,000 | 1,111,313 | 397,500 | - | 1,856,813 | |||||||||||||||
|
Carrying amount as at March 31, 2011
|
$ | 580,000 | $ | 1,852,187 | $ | 132,500 | $ | 1,650,500 | $ | 4,215,187 | ||||||||||
Amortization expense for partner relationships and merchant contracts is included in sales and marketing expenses and amortization expense for existing technology is included in product development and enhancement expense in the consolidated statements of earnings and comprehensive income.
|
|
9.
|
OBLIGATIONS UNDER FINANCE LEASE
|
In March 2010, the Corporation entered into a lease agreement with Ikon Financial Services to finance an equipment purchase of $11,269. Lease payments are due monthly under the lease term of sixty (60) months. Title to the equipment will transfer to the Corporation at the expiration of the lease. Accordingly, these amounts have been recorded as a finance lease. The lease is collateralized by the equipment under finance lease.
LML PAYMENT SYSTEMS INC.
NOTES TO CONSOLIDATED FINANCIAL STATEMENTS
(unless otherwise indicated, all amounts are U.S. dollars)
|
|
9.
|
OBLIGATIONS UNDER FINANCE LEASE (continued)
|
In September 2009, the Corporation entered into a lease agreement with Dell Financial Services Canada to finance an equipment purchase of $17,470. Lease payments were due monthly under the lease term of twelve (12) months. Title to the equipment transferred to the Corporation at the expiration of the lease. Accordingly, these amounts have been recorded as a finance lease.
|
Future minimum payments due
|
March 31, 2012
|
March 31, 2011
|
April 1, 2010
|
|||||||||
|
2011
|
$ | - | $ | - | $ | 12,226 | ||||||
|
2012
|
- | 2,460 | 2,460 | |||||||||
|
2013
|
2,460 | 2,460 | 2,460 | |||||||||
|
2014
|
2,460 | 2,460 | 2,460 | |||||||||
|
2015
|
2,460 | 2,460 | 2,460 | |||||||||
|
Less amount representing interest
|
- | - | (1,031 | ) | ||||||||
|
Net principal balance
|
7,380 | 9,840 | 21,035 | |||||||||
|
Less current portion
|
(2,460 | ) | (2,460 | ) | (11,195 | ) | ||||||
| $ | 4,920 | $ | 7,380 | $ | 9,840 | |||||||
The lease is collateralized by the equipment under the finance lease.
|
|
10.
|
SHARE CAPITAL
|
|
|
(a)
|
Shares issued and outstanding
|
|
Shares issued and outstanding
|
Number of Shares
|
Amount
|
|
Balance, April 1, 2010
|
27,241,408
|
$50,152,385
|
|
Previous capital consolidation adjustment (Note 10(e))
|
10,576
|
-
|
|
Exercise of stock options (Note 10(c))
|
545,200
|
1,126,648
|
|
Exercise of warrants (Note 10(d))
|
330,000
|
1,122,000
|
|
Reallocation of contributed surplus on exercise of options
|
-
|
620,405
|
|
Reallocation of warrants reserve on exercise of warrants (Note 10(d))
|
-
|
535,838
|
|
Balance, March 31, 2011
|
28,127,184
|
53,557,276
|
|
Exercise of stock options (Note 10(c))
|
119,500
|
226,840
|
|
Reallocation of contributed surplus on exercise of options
|
-
|
134,796
|
|
Balance, March 31, 2012
|
28,246,684
|
$53,918,912
|
|
|
(b)
|
Weighted average number of common shares outstanding
|
Dilutive securities included in the determination of the weighted average number of common shares outstanding for the purposes of computing diluted earnings per common share for the fiscal year ended March 31, 2012 included 2,673,300 shares issuable pursuant to outstanding stock option awards and resulted in an additional 909,916 common shares being included in the computation of diluted earnings per share.
LML PAYMENT SYSTEMS INC.
NOTES TO CONSOLIDATED FINANCIAL STATEMENTS
(unless otherwise indicated, all amounts are U.S. dollars)
|
|
10.
|
SHARE CAPITAL (continued)
|
Dilutive securities included in the determination of the weighted average number of common shares outstanding for the purposes of computing diluted earnings per common share for the fiscal year ended March 31, 2011 included 1,775,300 shares issuable pursuant to outstanding stock option awards and resulted in an additional 501,314 common shares being included in the computation of diluted earnings per share.
|
|
(c)
|
Stock Options
|
The Corporation maintains three stock option plans; the 1996 Stock Option Plan (the “1996 Plan”), the 1998 Stock Incentive Plan (the “1998 Plan”) and the 2009 Stock Incentive Plan (the “2009 Plan”). The 10-year term of the 1998 Plan expired on July 28, 2008 and, accordingly, the 4,825,217 shares that had remained available for grant pursuant to additional stock options or other equity awards may no longer be granted under that plan (although, outstanding awards under the 1998 Plan are not affected by the expiration of the term and will continue to be governed by the provisions of the plan). At March 31, 2012, 389,500 common shares were reserved for issuance pursuant to the 1996 Plan and 4,362,500 common shares were reserved for issuance pursuant to the 2009 Plan. These amounts reflect the limit of shares collectively that may be issued pursuant to stock options and/or other equity awards that are granted pursuant to the 1996 Plan and the 2009 Plan, respectively, less the number of shares subject to stock options and/or other equity awards that have been granted and are still outstanding and the number of shares subject to stock options and/or other equity awards that have been granted and exercised.
All director, officer and employee stock options or equity awards are granted under either the 1996 Plan or the 2009 Plan. The exercise price of stock options granted under the 1996 Plan and the 2009 Plan is equivalent to the closing price of the Corporation’s shares as quoted on the NADSAQ Stock Market on the date the stock option is granted. Stock options granted to independent directors vest one year from the date of grant and are exercisable for a period of five years in accordance with the compensation plan adopted for the Corporation’s independent directors during the fiscal year ended March 31, 2005. Stock options granted to executive officers have varying vesting schedules, which range from immediate vesting of all of the stock options granted to vesting over a five-year period, and are exercisable for periods ranging from five to ten years. Stock options granted to employees normally vest over a three-year period and are exercisable for a period of five years from the date of grant. Generally, stock options granted to employees are forfeited 30 days after leaving the employment of the Corporation.
Stock option activity for the fiscal years ended March 31, 2012 and 2011 is as follows:
|
2012
|
2011
|
|||||||||||||||
|
Total # of Shares
|
Weighted average exercise price
|
Total # of Shares
|
Weighted average exercise price
|
|||||||||||||
|
Stock options outstanding, beginning of year
|
4,487,300 | $ | 2.59 | 3,640,000 | $ | 3.11 | ||||||||||
|
Granted
|
1,105,000 | 2.14 | 1,745,000 | 1.62 | ||||||||||||
|
Expired
|
(232,500 | ) | 3.44 | (275,000 | ) | 4.31 | ||||||||||
|
Forfeited
|
(157,500 | ) | 2.27 | (77,500 | ) | 2.80 | ||||||||||
|
Exercised
|
(119,500 | ) | 1.90 | (545,200 | ) | 2.07 | ||||||||||
|
Stock options outstanding, end of year
|
5,082,800 | 2.48 | 4,487,300 | 2.59 | ||||||||||||
The weighted average share price at the date of exercise of stock options was $3.21 (2011 - $4.86).
The stock options granted during the fiscal year ended March 31, 2012 have a grant date fair value of $1.63 per stock option for 75,000 stock option grants and $1.45 per stock option for 1,030,000 stock option grants. The stock options granted during the fiscal year ended March 31, 2011 have a grant date fair value of $1.04 per stock option.
LML PAYMENT SYSTEMS INC.
NOTES TO CONSOLIDATED FINANCIAL STATEMENTS
(unless otherwise indicated, all amounts are U.S. dollars)
|
|
10.
|
SHARE CAPITAL (continued)
|
The fair value for each stock option granted was estimated at the date of grant using a Black-Scholes Option Pricing Model with the following assumptions:
|
Years ended March 31
|
|||
|
2012
|
2011
|
||
|
Risk-free interest rate
|
1.83% - 2.51%
|
2.79%
|
|
|
Expected volatility
|
94.39% - 97.35%
|
88.09%
|
|
|
Expected life of stock option (in years)
|
4
|
4
|
|
|
Expected forfeiture rate
|
0%
|
0%
|
|
|
Dividend yield
|
0%
|
0%
|
|
The total fair value of share-based payments is amortized over the vesting of issued stock options and resulted in share-based payments of $1,317,384 for the fiscal year ended March 31, 2012 (2011 - $1,451,684).
The following table summarizes information about the stock options outstanding at March 31, 2012:
|
Options outstanding
|
Options exercisable
|
|||||||||||||||||||||||||
|
Range ($)
|
Total # of Shares
|
Weighted average exercise price
|
Weighted average contract life remaining (years)
|
Total # of Shares
|
Weighted average exercise price
|
Weighted average contract life remaining (years)
|
||||||||||||||||||||
| 0.65 | 229,800 | $ | 0.65 | 2.37 | 198,550 | $ | 0.65 | 2.37 | ||||||||||||||||||
| 1.62 | 1,338,500 | 1.62 | 3.37 | 824,750 | 1.62 | 3.37 | ||||||||||||||||||||
| 2.12 – 2.43 | 1,105,000 | 2.14 | 4.61 | 257,500 | 2.12 | 4.62 | ||||||||||||||||||||
| 3.00 – 3.90 | 2,409,500 | 3.29 | 4.19 | 2,409,500 | 3.29 | 4.19 | ||||||||||||||||||||
| 5,082,800 | 2.48 | 3.98 | 3,690,300 | 2.69 | 3.94 | |||||||||||||||||||||
|
|
(d)
|
Warrants
|
In March 2008, the Corporation completed a private placement of common stock. The private placement consisted of 4,000,000 common shares at a purchase price of $1.80 per common share, from which the Corporation realized $7,200,000. The Corporation paid a financial advisor a 6.5% fee in cash as well as warrants to acquire 400,000 shares of the Corporation’s common stock. The warrants are exercisable at $3.40 per share for a period of five years from March 26, 2008.
The fair value of the private placement warrants was calculated as $1.62 per share, based on the Black-Scholes Option Pricing Model with the following assumptions:
|
·
|
Risk-free interest rate of 3.825%;
|
|
·
|
Expected volatility of 57.5%;
|
|
·
|
Expected life of the warrants of 4 years; and
|
|
·
|
No dividend yields.
|
The total fair value of the warrants was approximately $649,500. During the fiscal year ended March 31, 2011, 330,000 warrants were exercised resulting in the issuance of 330,000 shares of the Corporation’s common stock. The fair value of $535,838 attributable to these exercised warrants was allocated to common share value. As of March 31, 2012, 70,000 warrants remain outstanding.
LML PAYMENT SYSTEMS INC.
NOTES TO CONSOLIDATED FINANCIAL STATEMENTS
(unless otherwise indicated, all amounts are U.S. dollars)
|
|
10.
|
SHARE CAPITAL (continued)
|
|
|
(e)
|
Capital adjustment
|
Due to fractional rounding resulting from ongoing exchanges processed for previous capital consolidations of the shares in the capital of the Corporation and its corporate predecessors, the recorded total of issued and outstanding shares in the capital of the Corporation (“Common Shares”) as of dates in April and May 2003 was 10,576 Common Shares less than should have been recorded on the share register of the Corporation at that time.
As a result, during the year ended March 31, 2011, the Corporation’s board of directors ratified the issuance of the following numbers of Common Shares on the following dates in respect of shareholders in the following predecessor corporations of the Corporation who had not, by that time, exchanged their shares in such predecessor corporations for Common Shares:
|
Predecessor Corporation
|
Date of Issuance
|
Number of
Common Shares
|
||
|
Solid Gold Capital Corp.
|
May 13, 2003
|
79
|
||
|
Ruskin Developments Ltd.
|
May 13, 2003
|
208
|
||
|
Leisureways Marketing Ltd.
|
May 13, 2003
|
225
|
||
|
Santa Sarita Mining Company Limited
|
April 7, 2003
|
10,064
|
|
|
11.
|
EMPLOYEE BENEFIT PLAN
|
The Corporation has a defined contribution 401(k) plan (the "Plan") for eligible employees. The Plan requires that the Corporation match 50% of eligible employees’ contributions, up to 6% of their compensation. The Corporation recorded matching contribution expenses for the years ended March 31, 2012 and 2011 of $5,028 and $3,204, respectively.
|
|
12.
|
RELATED PARTY TRANSACTIONS
|
Compensation of key management personnel consisting of the Corporation’s Chief Executive Officer, President, Chief Accounting Officer and Executive V.P. of Operations for the years ended March 31, 2012 and 2011 are as follows:
|
2012
|
2011
|
|||||||
|
Short-term employee benefits
|
$ | 922,686 | $ | 709,532 | ||||
|
Share-based payments
|
794,976 | 666,288 | ||||||
|
Total
|
$ | 1,717,662 | $ | 1,375,820 | ||||
The amounts disclosed in the table are the amounts recognized as an expense during the reporting period related to key management personnel.
|
|
13.
|
INCOME TAXES
|
At March 31, 2012, the Corporation has Canadian non-capital loss carry-forwards for income tax purposes of approximately $153,545 expiring in 2022. Due to Canadian tax "change of ownership" rules, the loss carry-forwards are restricted in their use.
LML PAYMENT SYSTEMS INC.
NOTES TO CONSOLIDATED FINANCIAL STATEMENTS
(unless otherwise indicated, all amounts are U.S. dollars)
|
|
13.
|
INCOME TAXES (continued)
|
Deferred taxes reflect the net tax effects of temporary differences between the carrying amounts of assets and liabilities for financial reporting purposes and the amounts used for income tax purposes. Significant components of the Corporation’s deferred tax assets as of March 31, 2012 and 2011 and April 1, 2010 are as follows:
|
March 31, 2012
|
March 31, 2011
|
April 1, 2010
|
||||||||||
|
Deferred tax assets:
|
||||||||||||
|
Excess of tax value over the net book value for capital assets
|
$ | 612,680 | $ | 663,663 | $ | 708,083 | ||||||
|
Canadian non-capital loss carry-forwards
|
39,922 | 335,821 | 858,167 | |||||||||
|
U.S. federal net operating loss carry-forwards
|
- | - | 2,028,665 | |||||||||
|
U.S. alternative minimum tax carry-forwards
|
- | 92,419 | 92,418 | |||||||||
|
Other
|
157,349 | 97,844 | - | |||||||||
|
Total deferred tax assets
|
$ | 809,951 | $ | 1,189,747 | $ | 3,687,333 | ||||||
The reconciliation of income tax attributable to operations computed at the statutory tax rates to income tax expense (recovery), using statutory tax rates of 26% and 29% at March 31, 2012 and 2011, respectively, is as follows:
|
2012
|
2011
|
|||||||
|
Income taxes at statutory rates
|
$ | 2,869,954 | $ | 5,216,452 | ||||
|
Share-based payments and other permanent differences
|
503,928 | 545,349 | ||||||
|
Effect of U.S. tax rates
|
1,297,900 | 1,627,215 | ||||||
|
Expiration of loss carry-forwards
|
- | 74,965 | ||||||
|
Effect of foreign exchange translation of foreign currency denominated deferred income tax assets
|
29,826 | (96,615 | ) | |||||
|
Effect of change in tax rates and other
|
326,012 | 428,160 | ||||||
|
Change to deferred tax assets not recognized
|
(717,050 | ) | (94,915 | ) | ||||
| $ | 4,310,570 | $ | 7,700,611 | |||||
During the Corporation’s 2012 assessment of the realizability of its deferred tax assets, the Corporation considered all available positive and negative evidence including its past operating results, the existence of cumulative losses and its forecast of future taxable income. In determining future taxable income, the Corporation is responsible for assumptions utilized including the amount of pre-tax operating income, the reversal of temporary differences and the implementation of feasible and prudent tax planning strategies. These assumptions require significant judgment about the forecasts of future taxable income and are consistent with the plans and estimates it uses to manage the underlying businesses.
|
|
14.
|
COMMITMENTS AND CONTINGENCIES
|
|
|
(a)
|
2008 Patent Litigation
|
On November 19, 2008, a subsidiary of the Corporation filed a patent infringement lawsuit in the U.S. district court for the Eastern District of Texas against multiple financial institutions operating in the United States (the “2008 Patent Litigation”). In the suit, the subsidiary of the Corporation alleged that the defendants were infringing U.S. Patent No. RE40,220 (the “40,220 Patent”) and sought damages and injunctive and other relief for the alleged infringement of this patent. The 40,220 Patent covers 100 patent claims. However, at the request of the trial court and for purposes of expediency, the subsidiary of the Corporation limited the number of patent claims that it sought to enforce in the litigation to 16 patent claims, which it believed to be among the core claims described by the 40,220 Patent. During the fiscal year ended March 31, 2012 the subsidiary of the Corporation settled and entered into license agreements with Northern Trust Company, Wells Fargo, Capital One, JP Morgan Chase Bank N.A. and Deutsche Bank (the “2012 License Agreements”). These licensees were all of the defendants that remained in the 2008 Patent Litigation. The 2012 License Agreements provide each of the respective licensees with a fully paid-up license from the subsidiary of the Corporation to use certain of its patents for electronic check conversion transactions including “ARC”, “WEB”, “POP”, “TEL” and “BOC”.
LML PAYMENT SYSTEMS INC.
NOTES TO CONSOLIDATED FINANCIAL STATEMENTS
(unless otherwise indicated, all amounts are U.S. dollars)
|
|
14.
|
COMMITMENTS AND CONTINGENCIES (continued)
|
In connection with the 2012 License Agreements, the subsidiary of the Corporation received compensation totaling $14,100,000 for the releases, licenses, covenants and all other rights granted under the 2012 License Agreements and, pursuant to the 2012 License Agreements, the lawsuit against each of the respective licensees was dismissed. Pursuant to a retention agreement with the subsidiary of the Corporation’s legal firm, the subsidiary of the Corporation paid approximately $5,363,570 in legal fees for the firm’s services in connection with the 2012 License Agreements. As a result of settlements being reached with all of the defendants, the 2008 Patent Litigation was closed on March 13, 2012.
|
|
(b)
|
2009 Patent Litigation
|
On June 4, 2009, the subsidiary of the Corporation filed another patent infringement lawsuit in the U.S. district court for the Eastern District of Texas against six financial institutions operating in the United States (the “2009 Patent Litigation”). In the 2009 Patent Litigation, the subsidiary of the Corporation alleged that the defendants were infringing the 40,220 Patent and it sought damages and injunctive and other relief for the alleged infringement of this patent. On September 9, 2011, the subsidiary of the Corporation entered into a Settlement and License Agreement with Comerica Incorporated (“Comerica”) (the “Comerica Agreement”), the last remaining defendant in the 2009 Patent Litigation. The Comerica Agreement provides Comerica with a fully paid-up license from the subsidiary of the Corporation to use its patents for electronic check conversion transactions including “ARC”, “WEB”, “POP”, “TEL” and “BOC”. In connection with the Comerica Agreement, the subsidiary of the Corporation received compensation totaling $350,000 for the releases, licenses, covenants and all other rights granted under the Comerica Agreement and, pursuant to the Comerica Agreement, the lawsuit against Comerica was dismissed.
Pursuant to a retention agreement with the subsidiary of the Corporation’s legal firm, the subsidiary of the Corporation paid approximately $140,000 in legal fees for the firm’s services in connection with the Comerica Agreement. As a result of settlements reached with four of the defendants and the dismissal of claims against the remaining three defendants in the 2009 Patent Litigation, the 2009 Patent Litigation was closed on October 11, 2011.
Total consideration received with respect to the 2012 License Agreements and the Comerica Agreement has been allocated to each of the following deliverables using the relative selling price method:
|
·
|
Licenses – the Corporation has issued a license for the use of existing patents. This revenue has been recognized in the respective period.
|
|
·
|
Release from litigation – the Corporation has agreed to release the Released Defendants, Heritage, PlainsCapital and First from any claims or causes of action for patent infringement as of the effective date of their respective License Agreements. This revenue has been recognized in the respective period.
|
|
·
|
Covenant-not-to-sue provision – the Corporation has agreed to a covenant-not-to-sue provision for infringement of any patents for a specified period commencing on the effective dates of the License Agreements. This revenue has been deferred and will be recognized ratably over the specified period.
|
All of the above elements of 2012 License Agreements and the Comerica Agreement are recognized as revenue, including the release from litigation and covenant-not-to-sue provisions, since the payments received arise from activities representing the ongoing major or central operations of the Corporation’s IPL segment rather than incidental or peripheral transactions of that segment (see Note 3(l) Revenue Recognition).
LML PAYMENT SYSTEMS INC.
NOTES TO CONSOLIDATED FINANCIAL STATEMENTS
(unless otherwise indicated, all amounts are U.S. dollars)
|
|
14.
|
COMMITMENTS AND CONTINGENCIES (continued)
|
|
|
(c)
|
Inter-partes Reexamination Proceeding relating to the 2008 Patent Litigation
|
On May 11, 2010, four of the defendants in the 2008 Patent Litigation submitted a request for an inter-partes reexamination to the United States Patent and Trademark Office (“USPTO”) regarding the 40,220 Patent. Generally, an inter-partes reexamination is a USPTO administrative proceeding requested by a third party (in this case, the four defendants in the 2008 Patent Litigation, who are referred to as the “Third Party Requesters”) to challenge the validity of patents that have already been issued. On July 26, 2010, the USPTO posted a non-final office action on its public Patent Application Information Retrieval (“PAIR”) website ordering an inter-partes reexamination proceeding with respect to the 40,220 Patent pursuant to which 16 of the 100 claims described by the 40,220 Patent were rejected (the “Rejected Claims”). The Rejected Claims, which continue to be subject to re-examination and included all of the patent claims that the subsidiary of the Corporation had asserted and sought to enforce in the 2008 Patent Litigation, remain valid and enforceable until the 40,220 Patent expires on January 16, 2013 unless they are cancelled prior to that date.
During the three months ended December 31, 2010, the subsidiary of the Corporation filed a response to this non-final office action with the USPTO, following which the Third Party Requesters filed a response to the subsidiary of the Corporation’s response with the USPTO. The Examiner issued a non-final “Action Closing Prosecution” on March 14, 2011 pursuant to which the Rejected Claims continued to be subject to reexamination. On April 14, 2011, the subsidiary of the Corporation filed a response to the non-final Action Closing Prosecution and on May 16, 2011, the Third Party Requesters filed comments in response to the subsidiary of the Corporation’s response to the non-final Action Closing Prosecution. On August 8, 2011 the USPTO issued a “Right of Appeal Notice” which is a final but appealable office action, pursuant to which the Rejected Claims continued to be subject to reexamination. On September 8, 2011, the subsidiary of the Corporation filed a notice of appeal with respect to the decision to the Patent Office Board of Appeals and Interferences (“Board”). On November 22, 2011, the subsidiary of the Corporation filed its opening brief and on December 22, 2011 the Third Party Requesters filed a response brief. On January 13, 2012 the Examiner issued an Answer in response to the subsidiary of the Corporation’s appeal pursuant to which the Rejected Claims continued to be subject to reexamination. The subsidiary of the Corporation filed a rebuttal brief to the Examiner’s Answer on February 13, 2012 and on March 13, 2012 the subsidiary of the Corporation filed a Request for Oral Hearing with the Board with respect to the inter-partes re-examination. As of the date of this Form 10-K, the Board has not yet responded to the subsidiary of the Corporation’s Request for Oral Hearing. Once the Board renders its final decision in the inter-partes reexamination proceeding, any further appeals by any of the parties involved in such proceeding would be made to the Court of Appeals for the Federal Circuit (“Federal Circuit”) and, if such an appeal were made, any decision by the Federal Circuit would then be final and binding on the parties and non-appealable.
The ultimate outcome of the inter-partes reexamination proceeding (including any appeals that have been or may be made) is indeterminable at this time. A final, non-appealable decision in the inter-partes reexamination proceeding that is adverse to the subsidiary of the Corporation could negatively impact the subsidiary of the Corporation’s enforcement of the 40,220 Patent in the future. However, such an outcome would not require the repayment of any of the consideration already received by the subsidiary of the Corporation with respect to either the 2008 or the 2009 Patent Litigation nor are there any forms of monetary penalties or fines that could occur upon cancellation of any of the 40,220 Patent’s claims pursuant to the inter-partes reexamination proceeding. While there can be no assurances, the subsidiary of the Corporation does not believe that the final result of the inter-partes reexamination proceeding will have a material adverse effect on the Corporation.
LML PAYMENT SYSTEMS INC.
NOTES TO CONSOLIDATED FINANCIAL STATEMENTS
(unless otherwise indicated, all amounts are U.S. dollars)
|
|
14.
|
COMMITMENTS AND CONTINGENCIES (continued)
|
|
|
(d)
|
Ex-partes Reexamination Proceeding
|
In response (in part) to the inter-partes reexamination proceeding, on June 17, 2011, the subsidiary of the Corporation filed a separate ex-parte reexamination request with the USPTO with respect to other claims described in the 40,220 Patent. As part of this request, the subsidiary of the Corporation requested amendments to certain claims and also requested the addition of new claims and the cancellation of certain claims described in the 40,220 Patent. On September 13, 2011, the USPTO issued an order granting an ex-partes reexamination with respect to the 40,220 Patent. On January 4, 2012, the USPTO issued a non-final office action in the ex-parte reexamination proceeding pursuant to which: (i) certain claims described by the 40,220 Patent were subject to reexamination; (ii) certain other claims were cancelled (as the subsidiary of the Corporation requested); (iii) certain other claims were rejected, and (iv) new claims were added. Following the February 1, 2012 response of the subsidiary of the Corporation and an examiner interview, the USPTO issued a Notice of Intent to Issue a Reexam Certificate on March 20, 2012 (see Note 15).
|
|
(e)
|
On May 5, 2011, Beanstream received a document from the Canada Revenue Agency (“CRA”) proposing to deny certain expenses deducted by Beanstream on its 2007 income tax return in relation to the sale of Beanstream to the Corporation in 2007 and the tax treatment of the sale with respect to the former shareholders of Beanstream. The denial of these expenses could have resulted in additional taxes owing of approximately $300,000. Further to this, on September 14, 2011, Beanstream received additional documentation from the CRA stating that they are withdrawing their proposal. The Corporation believes this matter has been resolved with no further adjustment required.
|
|
|
(f)
|
The Corporation is a party to additional ordinary litigation incidental to its business, none of which is expected to have a material adverse effect on results of operations, financial position or liquidity of the Corporation
|
|
|
(g)
|
Operating lease obligations
|
Future minimum lease payments for obligations under operating leases, including premises for the next five years and thereafter are as follows:
|
2013
|
$339,987
|
|
|
2014
|
222,671
|
|
|
2015
|
914
|
|
|
2016
|
914
|
|
|
2017
|
685
|
|
|
2018 and thereafter
|
-
|
|
|
$565,171
|
The Corporation’s rent expense totaled $419,506 in 2012 and $372,276 in 2011.
|
|
(h)
|
Purchase obligations
|
Future minimum payments under all other contractual purchase obligations for the next five years and thereafter are as follows:
|
2013
|
$22,139
|
|
|
2014
|
-
|
|
|
2015
|
-
|
|
|
2016
|
-
|
|
|
2017 and thereafter
|
-
|
|
|
$22,139
|
LML PAYMENT SYSTEMS INC.
NOTES TO CONSOLIDATED FINANCIAL STATEMENTS
(unless otherwise indicated, all amounts are U.S. dollars)
|
|
15.
|
SUBSEQUENT EVENTS
|
Subsequent to the fiscal year ended March 31, 2012, on May 2, 2012 the USPTO issued an Ex-Parte Reexamination Certificate in the ex-parte reexamination proceeding. On the Certificate, certain amended and added claims were confirmed and other claims were cancelled, as the subsidiary of the Corporation had requested in its originally filed ex-parte reexamination request. As a result of the issuance of the Ex-Parte Reexamination Certificate, the ex-parte re-examination proceeding is closed. The Third Party Requesters did not have the right to participate in the ex-parte reexamination proceeding.
|
|
16.
|
CAPITAL MANAGEMENT DISCLOSURES
|
The Corporation’s objectives when managing capital are to safeguard its ability to support its normal operating requirements on an ongoing basis, so that it can continue to provide returns for shareholders and benefits for other stakeholders, and to provide an adequate return to shareholders by pricing products and services commensurately with the level of risk.
The capital structure of the Corporation consists of obligations under a finance lease and equity. The Corporation manages its capital structure and makes adjustments to it in light of economic conditions. The Corporation, upon approval from its Board of Directors, will balance its overall capital structure through new share issues or by undertaking other activities as deemed appropriate under the specific circumstances.
The Corporation is not subject to any externally imposed capital requirements. The Corporation’s overall strategy with respect to capital risk management remains unchanged from the year ended March 31, 2011.
|
|
17.
|
INDUSTRY AND GEOGRAPHIC SEGMENTS
|
Based upon the way financial information is provided to the Corporation’s Chief Executive Officer for use in evaluating allocation of resources and assessing performance of the business, the Corporation reports its operations in three distinct operating segments, described as follows:
TPP operations involve financial payment processing, authentication and risk management services provided by Beanstream. The services are accessible via the Internet and are offered in an application service provider (ASP) model.
IPL operations involve licensing an intellectual property estate, which includes five U.S. patents describing electronic check processing methods.
CP operations involve primary and secondary check collection including electronic check re-presentment (RCK).
Within these segments, performance is measured based on revenue, factoring in interest income and expenses and amortization and depreciation as well as income before income taxes from each segment. There are no transactions between segments. The Corporation does not generally allocate corporate or centralized marketing and general and administrative expenses to its business unit segments because these activities are managed separately from the business units.
LML PAYMENT SYSTEMS INC.
NOTES TO CONSOLIDATED FINANCIAL STATEMENTS
(unless otherwise indicated, all amounts are U.S. dollars)
|
|
17.
|
INDUSTRY AND GEOGRAPHIC SEGMENTS (continued)
|
Financial information for each reportable segment for the fiscal years ended March 31, 2012 and 2011 is as follows:
|
Fiscal Year Ended
|
TPP
|
IPL
|
CP
|
Reconciling
|
Consolidated
|
||||||||||||||||
|
March 31, 2012
|
Canada
|
U.S.
|
U.S.
|
Items
|
Total
|
||||||||||||||||
|
Total Revenue
|
$ | 16,445,715 | $ | 16,168,647 | $ | 2,302,440 | $ | - | $ | 34,916,802 | |||||||||||
|
Revenue: major customers
|
1,926,096 | 12,400,000 | 1,473,878 | - | 15,799,974 | ||||||||||||||||
|
Cost of revenue
|
9,875,959 | 5,707,553 | 1,454,271 | 180,483 | 1 | 17,218,266 | |||||||||||||||
|
General and administrative
|
1,021,636 | 38,481 | 371,573 | 2,918,504 | 2 | 4,350,194 | |||||||||||||||
|
Sales and marketing
|
647,972 | - | 17,656 | 10,996 | 1 | 676,624 | |||||||||||||||
|
Product development and enhancement
|
928,008 | - | - | 123,680 | 1 | 1,051,688 | |||||||||||||||
|
Amortization and depreciation
|
62,691 | 167,420 | 35,206 | 502,002 | 3 | 767,319 | |||||||||||||||
|
Income (losses) before income taxes
|
4,127,742 | 10,268,294 | 431,282 | (3,788,853 | ) | 4 | 11,038,465 | ||||||||||||||
|
Property and equipment, net
|
90,091 | - | 28,301 | 3,104 | 121,496 | ||||||||||||||||
|
Patents
|
- | 120,457 | - | - | 120,457 | ||||||||||||||||
|
Goodwill
|
17,874,202 | - | - | - | 17,874,202 | ||||||||||||||||
|
Other Intangible Assets
|
3,720,037 | - | - | - | 3,720,037 | ||||||||||||||||
|
Fiscal Year Ended
|
TPP
|
IPL
|
CP
|
Reconciling
|
Consolidated
|
||||||||||||||||
|
March 31, 2011
|
Canada
|
U.S.
|
U.S.
|
Items
|
Total
|
||||||||||||||||
|
Total Revenue
|
$ | 12,757,634 | $ | 32,070,014 | $ | 2,332,842 | $ | - | $ | 47,160,490 | |||||||||||
|
Revenue: major customers
|
2,295,032 | 24,400,000 | 1,401,822 | - | 28,096,854 | ||||||||||||||||
|
Cost of revenue
|
7,705,536 | 13,316,271 | 1,561,079 | 138,856 | 1 | 22,721,742 | |||||||||||||||
|
General and administrative
|
1,084,579 | 76,274 | 517,123 | 2,747,406 | 2 | 4,425,382 | |||||||||||||||
|
Sales and marketing
|
556,647 | - | 18,603 | 183,236 | 1 | 758,486 | |||||||||||||||
|
Product development and enhancement
|
498,349 | - | - | 107,619 | 1 | 605,968 | |||||||||||||||
|
Amortization and depreciation
|
61,456 | 167,427 | 46,434 | 511,329 | 3 | 786,646 | |||||||||||||||
|
Income (losses) before income taxes
|
2,695,947 | 18,521,163 | 195,274 | (3,712,808 | ) | 4 | 17,699,576 | ||||||||||||||
|
Property and equipment, net
|
96,097 | - | 57,961 | 9,164 | 163,222 | ||||||||||||||||
|
Patents
|
- | 287,877 | - | - | 287,877 | ||||||||||||||||
|
Goodwill
|
17,874,202 | - | - | - | 17,874,202 | ||||||||||||||||
|
Other Intangible Assets
|
4,215,187 | - | - | - | 4,215,187 | ||||||||||||||||
|
As at April 1, 2010
|
TPP
|
IPL
|
CP
|
Reconciling
|
Consolidated
|
|||||||||||||||
|
Canada
|
U.S.
|
U.S.
|
Items
|
Total
|
||||||||||||||||
|
Property and equipment, net
|
$ | 94,591 | $ | - | $ | 101,190 | $ | 23,799 | $ | 219,580 | ||||||||||
|
Patents
|
- | 455,304 | - | - | 455,304 | |||||||||||||||
|
Goodwill
|
17,874,202 | - | - | - | 17,874,202 | |||||||||||||||
|
Other Intangible Assets
|
4,710,337 | - | - | - | 4,710,337 | |||||||||||||||
|
1
|
Represents share-based payments expense.
|
|
2
|
Represents share-based payments expense and other unallocated corporate or centralized marketing, general and administrative expenses
|
|
3
|
Represents amortization and depreciation included in the unallocated corporate or centralized marketing, general and administrative expenses.
|
|
4
|
Represents income (losses) included in the unallocated corporate or centralized marketing, general and administrative expenses.
|
LML PAYMENT SYSTEMS INC.
NOTES TO CONSOLIDATED FINANCIAL STATEMENTS
(unless otherwise indicated, all amounts are U.S. dollars)
|
18.
|
TRANSITION TO IFRS
|
As stated in Note 2, “Basis of Presentation”, these are the Corporation’s first audited consolidated financial statements prepared in accordance with IFRS. The accounting policies set out in Note 3 have been applied consistently to all periods presently in these consolidated financial statements for the fiscal years ended March 31, 2012 and 2011 and in preparation of the opening IFRS statement of financial position at April 1, 2010 (the Corporation’s date of transition to IFRS).
First Time Adoption of IFRS
The Corporation adopted IFRS on April 1, 2011 with an effective transition date of April 1, 2010. IFRS 1 First Time Adoption of International Financial Reporting Standards sets forth guidance for the initial adoption of IFRS. Under IFRS 1, the standards are applied retrospectively with all adjustments impacting earlier periods recorded as an adjustment to opening retained earnings on the date of transition to IFRS or, if appropriate, another category of equity unless certain optional exemptions are applied. The Corporation has applied the following exemptions to its opening consolidated statement of financial position dated April 1, 2010:
|
·
|
Business Combinations – IFRS 1 indicates that a first-time adopter may elect not to apply IFRS 3 Business Combinations retrospectively to business combinations before the date of transition to IFRS. The Corporation has elected to use this election and will apply IFRS 3 to future business combinations.
|
|
·
|
Consolidated and Separate Financial Statements – according to IFRS 1, if a company elects to apply IFRS 3 Business Combinations retrospectively, certain provisions of IAS 27 Consolidated and Separate Financial Statements must also be applied retrospectively. As the Corporation elects to apply IFRS 3 prospectively, the Corporation has also elected to apply these provisions of IAS 27 prospectively.
|
|
·
|
Share-Based Payment – IFRS 1 encourages, but does not require, first time adopters to apply IFRS 2 Share-based Payment to equity instruments that were granted on or before November 7, 2002, or equity instruments that were granted subsequent to November 7, 2002 and vested before the later of the date of transition to IFRS and January 1, 2005. The Corporation has elected to take advantage of the exemption and not apply IFRS 2 to awards that vested prior to April 1, 2010.
|
IFRS employs a conceptual framework that is similar to Canadian GAAP, however, significant differences exist in certain matters of recognition, measurement and disclosure. While adoption of IFRS has not changed the Corporation’s actual cash flows, it has resulted in changes to the Corporation’s reported financial position, statements of earnings and comprehensive income and statements of cash flows. In order to allow the users of the financial statements to better understand these changes, the Corporation’s Canadian GAAP consolidated statements of financial position as at April 1, 2010 and March 31, 2011, consolidated statements of earnings and comprehensive income for the year ended March 31, 2011 and consolidated statements of cash flows for the year ended March 31, 2011 have been reconciled to IFRS with the resulting differences as explained below:
|
·
|
IFRS 2 “Share-based Payment.” Canadian GAAP allows the preparer to choose from two methods, namely, (a) treating all options granted on a particular date and with the same terms and conditions as one pool (pooling method) and (b) treating options with different vesting dates as different grants (vesting method). The cost of the share-based payment for both methods is calculated according to Black-Scholes Option Pricing Model. For the pooling method, the total expense is amortized on a straight line basis over the longest vesting period of all of the options in the pool resulting in equal charges to income over the period. The vesting method looks at each vesting tranche and the expense associated with that particular tranche and amortizes the expense in a straight line fashion. While the vesting method does not increase overall expense, it does result in the Corporation recognizing a greater portion of the expense earlier in the option term compared to the pooling method. Under IFRS, the vesting method is the only method that may be used. Under Canadian GAAP, the Corporation had been applying the pooling method.
|
LML PAYMENT SYSTEMS INC.
NOTES TO CONSOLIDATED FINANCIAL STATEMENTS
(unless otherwise indicated, all amounts are U.S. dollars)
|
18.
|
TRANSITION TO IFRS (continued)
|
|
·
|
Using the vesting method as required under IFRS, share-based payments for the year ended March 31, 2011 were $1,451,685 as opposed to $1,163,496 as recorded under Canadian GAAP, a difference of $288,189.
|
|
·
|
Deferred tax assets: Under Canadian GAAP, deferred tax assets were presented as current (expected to be utilized within twelve months) and non-current. Under IFRS, all deferred tax assets are presented as non-current.
|
|
·
|
Warrants: Under Canadian GAAP, warrants were included in contributed surplus, whereas, under IFRS, warrants are presented as a separate component of equity in the consolidated statements of financial position.
|
|
·
|
Amortization and depreciation expense: Under Canadian GAAP, depreciation of property and equipment and amortization of patents and intangible assets were separately presented in the consolidated statements of earnings and comprehensive income. Under IFRS, amortization and depreciation expenses are included within the appropriate operating expense category and not separately presented.
|
LML PAYMENT SYSTEMS INC.
NOTES TO CONSOLIDATED FINANCIAL STATEMENTS
(unless otherwise indicated, all amounts are U.S. dollars)
|
18.
|
TRANSITION TO IFRS (continued)
|
The Canadian GAAP consolidated statement of financial position and equity reconciliation at April 1, 2010 has been reconciled to IFRS as follows:
|
|
Previously reported under Canadian GAAP
|
Reclassifications under IFRS
|
Share-based payments
|
Restated under IFRS
|
||||||||||||
|
ASSETS
|
||||||||||||||||
|
Current assets
|
||||||||||||||||
|
Cash and cash equivalents
|
$ | 5,069,763 | $ | 5,069,763 | ||||||||||||
|
Funds held for merchants
|
5,804,752 | 5,804,752 | ||||||||||||||
|
Restricted cash
|
175,000 | 175,000 | ||||||||||||||
|
Accounts receivable, less allowance of $31,463
|
799,584 | 799,584 | ||||||||||||||
|
Corporate taxes receivable
|
1,072,930 | 1,072,930 | ||||||||||||||
|
Prepaid expenses
|
416,507 | 416,507 | ||||||||||||||
|
Current portion of deferred tax assets
|
1,280,860 | $ | (1,280,860 | ) | - | |||||||||||
|
Total current assets
|
14,619,396 | (1,280,860 | ) | - | 13,338,536 | |||||||||||
|
Property and equipment, net
|
219,580 | 219,580 | ||||||||||||||
|
Patents
|
455,304 | 455,304 | ||||||||||||||
|
Restricted cash
|
255,247 | 255,247 | ||||||||||||||
|
Deferred tax assets
|
2,406,473 | 1,280,860 | 3,687,333 | |||||||||||||
|
Goodwill
|
17,874,202 | 17,874,202 | ||||||||||||||
|
Other intangible assets
|
4,710,337 | 4,710,337 | ||||||||||||||
|
Other assets
|
20,641 | 20,641 | ||||||||||||||
|
Total assets
|
$ | 40,561,180 | $ | - | $ | - | $ | 40,561,180 | ||||||||
|
LIABILITIES
|
||||||||||||||||
|
Current liabilities
|
||||||||||||||||
|
Accounts payable
|
$ | 836,274 | $ | 836,274 | ||||||||||||
|
Accrued liabilities
|
1,040,443 | 1,040,443 | ||||||||||||||
|
Corporate taxes payable
|
- | - | ||||||||||||||
|
Funds due to merchants
|
5,804,752 | 5,804,752 | ||||||||||||||
|
Current portion of obligations under finance lease
|
11,195 | 11,195 | ||||||||||||||
|
Current portion of deferred revenue
|
1,325,983 | 1,325,983 | ||||||||||||||
|
Total current liabilities
|
9,018,647 | - | - | 9,018,647 | ||||||||||||
|
Obligations under finance lease
|
9,840 | 9,840 | ||||||||||||||
|
Deferred revenue
|
2,155,162 | 2,155,162 | ||||||||||||||
|
Total liabilities
|
11,183,649 | - | - | 11,183,649 | ||||||||||||
|
EQUITY
|
||||||||||||||||
|
Capital stock
|
||||||||||||||||
|
Class A, preferred stock, $1.00 CDN par value, 150,000,000 shares authorized, issuable in series, none issued or outstanding
|
- | - | ||||||||||||||
|
Class B, preferred stock, $1.00 CDN par value, 150,000,000 shares authorized, issuable in series, none issued or outstanding
|
- | - | ||||||||||||||
|
Common shares, no par value, 100,000,000 shares authorized, 27,241,408 issued and outstanding
|
50,152,385 | 50,152,385 | ||||||||||||||
|
Contributed surplus
|
7,952,343 | $ | (649,500 | ) | $ | 684,884 | 7,987,727 | |||||||||
|
Warrants
|
- | 649,500 | 649,500 | |||||||||||||
|
Deficit
|
(28,877,282 | ) | (684,884 | ) | (29,562,166 | ) | ||||||||||
|
Accumulated other comprehensive income
|
150,085 | 150,085 | ||||||||||||||
|
Total equity
|
29,377,531 | - | - | 29,377,531 | ||||||||||||
|
Total liabilities and equity
|
$ | 40,561,180 | $ | - | $ | - | $ | 40,561,180 | ||||||||
LML PAYMENT SYSTEMS INC.
NOTES TO CONSOLIDATED FINANCIAL STATEMENTS
(unless otherwise indicated, all dollar amounts are U.S. dollars)
|
18.
|
TRANSITION TO IFRS (continued)
|
The Canadian GAAP consolidated statement of financial position and equity reconciliation at March 31, 2011 has been reconciled to IFRS as follows:
|
Previously reported under Canadian GAAP
|
Reclassifications under IFRS
|
Share-based payments
|
Restated under IFRS
|
|||||||||||||
|
ASSETS
|
||||||||||||||||
|
Current assets
|
||||||||||||||||
|
Cash and cash equivalents
|
$ | 26,917,491 | $ | 26,917,491 | ||||||||||||
|
Funds held for merchants
|
7,164,420 | 7,164,420 | ||||||||||||||
|
Restricted cash
|
175,000 | 175,000 | ||||||||||||||
|
Accounts receivable, less allowance of $28,152
|
1,103,529 | 1,103,529 | ||||||||||||||
|
Corporate taxes receivable
|
101,162 | 101,162 | ||||||||||||||
|
Prepaid expenses
|
266,066 | 266,066 | ||||||||||||||
|
Current portion of deferred tax assets
|
428,240 | $ | (428,240 | ) | - | |||||||||||
|
Total current assets
|
36,155,908 | (428,240 | ) | - | 35,727,668 | |||||||||||
|
Property and equipment, net
|
163,222 | 163,222 | ||||||||||||||
|
Patents
|
287,877 | 287,877 | ||||||||||||||
|
Restricted cash
|
262,644 | 262,644 | ||||||||||||||
|
Deferred tax assets
|
761,507 | 428,240 | 1,189,747 | |||||||||||||
|
Goodwill
|
17,874,202 | 17,874,202 | ||||||||||||||
|
Other intangible assets
|
4,215,187 | 4,215,187 | ||||||||||||||
|
Other assets
|
21,041 | 21,041 | ||||||||||||||
|
Total assets
|
$ | 59,741,588 | $ | - | $ | - | $ | 59,741,588 | ||||||||
|
LIABILITIES
|
||||||||||||||||
|
Current liabilities
|
||||||||||||||||
|
Accounts payable
|
$ | 702,820 | $ | 702,820 | ||||||||||||
|
Accrued liabilities
|
1,390,847 | 1,390,847 | ||||||||||||||
|
Corporate taxes payable
|
4,796,157 | 4,796,157 | ||||||||||||||
|
Funds due to merchants
|
7,164,420 | 7,164,420 | ||||||||||||||
|
Current portion of obligations under finance lease
|
2,460 | 2,460 | ||||||||||||||
|
Current portion of deferred revenue
|
1,420,228 | 1,420,228 | ||||||||||||||
|
Total current liabilities
|
15,476,932 | - | - | 15,476,932 | ||||||||||||
|
Obligations under finance lease
|
7,380 | 7,380 | ||||||||||||||
|
Deferred revenue
|
935,979 | 935,979 | ||||||||||||||
|
Total liabilities
|
16,420,291 | - | - | 16,420,291 | ||||||||||||
|
EQUITY
|
||||||||||||||||
|
Capital stock
|
||||||||||||||||
|
Class A, preferred stock, $1.00 CDN par value, 150,000,000 shares authorized, issuable in series, none issued or outstanding
|
- | - | ||||||||||||||
|
Class B, preferred stock, $1.00 CDN par value, 150,000,000 shares authorized, issuable in series, none issued or outstanding
|
- | - | ||||||||||||||
|
Common shares, no par value, 100,000,000 shares authorized, 28,127,184 issued and outstanding
|
53,557,276 | 53,557,276 | ||||||||||||||
|
Contributed surplus
|
7,959,595 | $ | (113,662 | ) | $ | 973,072 | 8,819,006 | |||||||||
|
Warrants
|
- | 113,662 | 113,662 | |||||||||||||
|
Deficit
|
(18,590,128 | ) | (973,072 | ) | (19,563,201 | ) | ||||||||||
|
Accumulated other comprehensive income
|
394,554 | 394,554 | ||||||||||||||
|
Total equity
|
43,321,297 | - | - | 43,321,297 | ||||||||||||
|
Total liabilities and equity
|
$ | 59,741,588 | $ | - | $ | - | $ | 59,741,588 | ||||||||
LML PAYMENT SYSTEMS INC.
NOTES TO CONSOLIDATED FINANCIAL STATEMENTS
(unless otherwise indicated, all amounts are U.S. dollars)
|
18.
|
TRANSITION TO IFRS (continued)
|
The Canadian GAAP consolidated statement of earnings and comprehensive income for the fiscal year ended March 31, 2011 has been reconciled to IFRS as follows:
|
Previously reported under Canadian GAAP
|
Reclassification under IFRS
|
Share-based payments
|
Restated under IFRS
|
|||||||||||||
|
REVENUE
|
$ | 47,160,490 | $ | - | $ | - | $ | 47,160,490 | ||||||||
|
COSTS OF REVENUE
|
22,701,437 | 60,229 | 20,305 | 22,781,971 | ||||||||||||
|
GROSS PROFIT
|
24,459,053 | (60,229 | ) | (20,305 | ) | 24,378,519 | ||||||||||
|
OPERATING EXPENSES
|
||||||||||||||||
|
General and administrative
|
4,337,980 | 206,685 | 87,401 | 4,632,066 | ||||||||||||
|
Sales and marketing
|
624,930 | 402,670 | 133,556 | 1,161,156 | ||||||||||||
|
Product development and enhancement
|
559,041 | 117,062 | 46,927 | 723,030 | ||||||||||||
|
Amortization of property and equipment
|
124,070 | (124,070 | ) | - | ||||||||||||
|
Amortization of intangible assets
|
662,576 | (662,576 | ) | - | ||||||||||||
|
INCOME BEFORE OTHER INCOME (EXPENSES) AND INCOME TAXES
|
18,150,456 | - | (288,189 | ) | 17,862,267 | |||||||||||
|
Foreign exchange loss
|
(205,472 | ) | (205,472 | ) | ||||||||||||
|
Other expenses
|
(5,549 | ) | (5,549 | ) | ||||||||||||
|
Interest income
|
48,330 | 48,330 | ||||||||||||||
|
INCOME BEFORE INCOME TAXES
|
17,987,765 | (288,189 | ) | 17,699,576 | ||||||||||||
|
Income tax expense
|
||||||||||||||||
|
Current
|
5,203,025 | 5,203,025 | ||||||||||||||
|
Deferred
|
2,497,586 | 2,497,586 | ||||||||||||||
| 7,700,611 | 7,700,611 | |||||||||||||||
|
NET INCOME
|
$ | 10,287,154 | $ | (288,189 | ) | $ | 9,998,965 | |||||||||
|
OTHER COMPREHENSIVE INCOME
|
||||||||||||||||
|
Unrealized foreign exchange gain on translation of foreign operations
|
244,469 | 244,469 | ||||||||||||||
|
TOTAL COMPREHENSIVE INCOME
|
$ | 10,531,623 | $ | (288,189 | ) | $ | 10,243,434 | |||||||||
|
EARNINGS PER SHARE, basic
|
$ | 0.38 | $ | (0.01 | ) | $ | 0.37 | |||||||||
|
EARNINGS PER SHARE, diluted
|
$ | 0.37 | $ | (0.01 | ) | $ | 0.36 | |||||||||
|
WEIGHTED AVERAGE NUMBER OF SHARES OUTSTANDING
|
||||||||||||||||
|
Basic
|
27,342,799 | 27,342,799 | ||||||||||||||
|
Diluted
|
27,844,113 | 27,844,113 | ||||||||||||||
LML PAYMENT SYSTEMS INC.
NOTES TO CONSOLIDATED FINANCIAL STATEMENTS
(unless otherwise indicated, all amounts are U.S. dollars)
|
18.
|
TRANSITION TO IFRS (continued)
|
The Canadian GAAP consolidated statement of cash flows for the fiscal year ended March 31, 2011 has been reconciled to IFRS as follows:
|
Previously reported under Canadian GAAP
|
Share-based payments
|
Restated under IFRS
|
||||||||||
|
Operating Activities:
|
||||||||||||
|
Net income
|
$ | 10,287,154 | $ | (288,189 | ) | $ | 9,998,965 | |||||
|
Adjustments to reconcile net income to net cash provided by operating activities
|
||||||||||||
|
Amortization of property and equipment
|
124,070 | 124,070 | ||||||||||
|
Amortization of intangible assets
|
662,576 | 662,576 | ||||||||||
|
Share-based payments
|
1,163,496 | 288,189 | 1,451,685 | |||||||||
|
Foreign exchange gain
|
(3,592 | ) | (3,592 | ) | ||||||||
|
Deferred income taxes
|
2,497,586 | 2,497,586 | ||||||||||
|
Changes in non-cash operating working capital
|
||||||||||||
|
Accounts receivable
|
(262,848 | ) | (262,848 | ) | ||||||||
|
Corporate taxes receivable
|
1,002,041 | 1,002,041 | ||||||||||
|
Prepaid expenses
|
154,307 | 154,307 | ||||||||||
|
Accounts payable and accrued liabilities
|
170,393 | 170,393 | ||||||||||
|
Corporate taxes payable
|
4,796,157 | 4,796,157 | ||||||||||
|
Deferred revenue
|
(1,133,735 | ) | (1,133,735 | ) | ||||||||
|
Net cash provided by operating activities
|
19,457,605 | - | 19,457,605 | |||||||||
|
Investing Activities:
|
||||||||||||
|
Acquisition of property and equipment
|
(63,473 | ) | (63,473 | ) | ||||||||
|
Net cash used in investing activities
|
(63,473 | ) | - | (63,473 | ) | |||||||
|
Financing Activities:
|
||||||||||||
|
Principal payments on finance leases
|
(11,047 | ) | (11,047 | ) | ||||||||
|
Proceeds from exercise of stock options
|
1,126,648 | 1,126,648 | ||||||||||
|
Proceeds from exercise of warrants
|
1,122,000 | 1,122,000 | ||||||||||
|
Net cash provided by financing activities
|
2,237,601 | - | 2,237,601 | |||||||||
|
Effects of foreign exchange rate changes on cash and cash equivalents
|
215,995 | - | 215,995 | |||||||||
|
INCREASE IN CASH AND CASH EQUIVALENTS
|
21,847,728 | - | 21,847,728 | |||||||||
|
Cash and cash equivalents, beginning of year
|
5,069,763 | - | 5,069,763 | |||||||||
|
Cash and cash equivalents, end of year
|
$ | 26,917,491 | $ | - | $ | 26,917,491 | ||||||