Attached files
| file | filename |
|---|---|
| 8-K - 8-K - Franchise Group, Inc. | a12-14928_18k.htm |
| EX-99.2 - EX-99.2 - Franchise Group, Inc. | a12-14928_1ex99d2.htm |
Exhibit 99.1
|
|
JEFFERIES GLOBAL CONSUMER CONFERENCE JUNE 20, 2012 JTH HOLDING, INC. PARENT COMPANY OF |
|
|
Safe Harbor Statement 2 This presentation and various comments made in connection with it may contain forward-looking statements within the meaning of the federal securities laws. Forward-looking statements can be identified by the fact that they do not relate strictly to historical or current facts. They often include words such as “expects,” “anticipates,” “intends,” “plans,” “believes,” “seeks,” “estimates,” “would,” “should,” “could,” or “may.” Forward-looking statements provide management’s current expectations or predictions of future conditions, events or results. They may include estimates of revenues, income, earnings per share, capital expenditures, dividends, liquidity, capital structure or other financial items, descriptions of management’s plans or objectives for future operations, products or services, or descriptions of assumptions underlying any of the above. All forward-looking statements speak only as of the date they are made and reflect the company’s good faith beliefs, assumptions and expectations, but they are not guarantees of future performance. Furthermore, the company disclaims any obligation to publicly update or revise any forward-looking statement to reflect changes in underlying assumptions or factors, of new information, data or methods, future events or other changes, except as required by federal securities laws. By their nature, forward-looking statements are subject to risks and uncertainties. For a discussion of these and other factors that could cause the company’s future results to differ materially from any forward-looking statements, see the section entitled “Risk Factors” in the company’s recently effective registration statement on Form 10. |
|
|
Agenda 3 Company Overview Industry Overview Financial Overview |
|
|
Company Overview 4 |
|
|
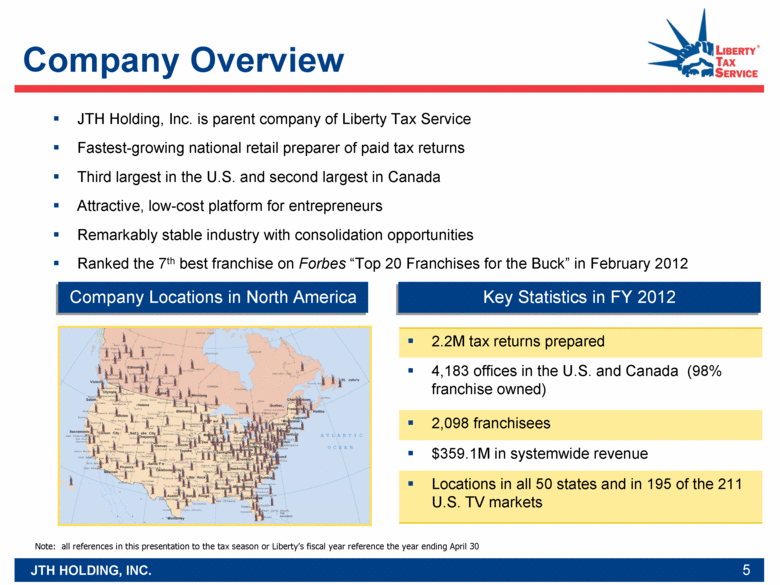
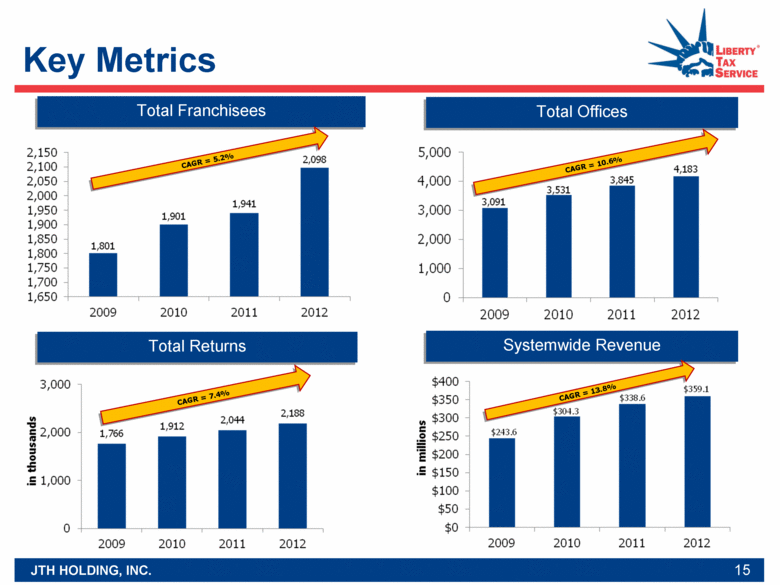
Company Overview 5 JTH Holding, Inc. is parent company of Liberty Tax Service Fastest-growing national retail preparer of paid tax returns Third largest in the U.S. and second largest in Canada Attractive, low-cost platform for entrepreneurs Remarkably stable industry with consolidation opportunities Ranked the 7th best franchise on Forbes “Top 20 Franchises for the Buck” in February 2012 Company Locations in North America Key Statistics in FY 2012 2.2M tax returns prepared 4,183 offices in the U.S. and Canada (98% franchise owned) 2,098 franchisees $359.1M in systemwide revenue Locations in all 50 states and in 195 of the 211 U.S. TV markets Note: all references in this presentation to the tax season or Liberty’s fiscal year reference the year ending April 30 |
|
|
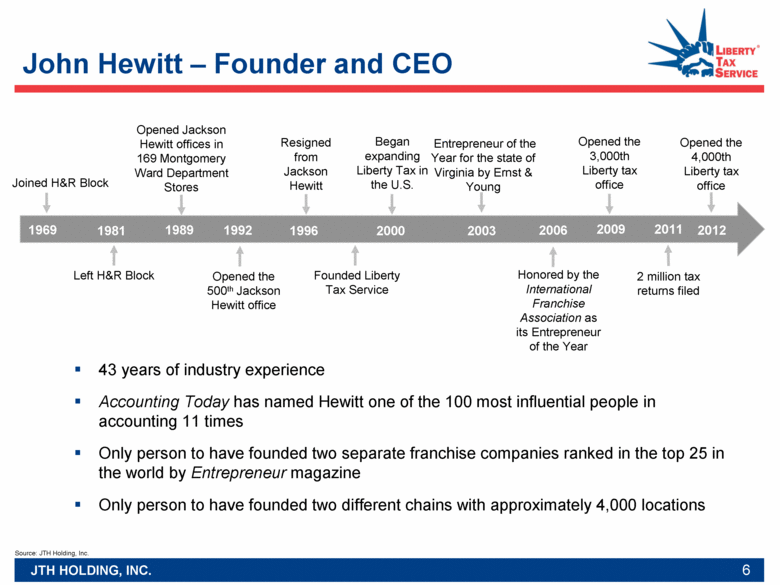
John Hewitt – Founder and CEO Joined H&R Block Opened the 500th Jackson Hewitt office Entrepreneur of the Year for the state of Virginia by Ernst & Young 43 years of industry experience Accounting Today has named Hewitt one of the 100 most influential people in accounting 11 times Only person to have founded two separate franchise companies ranked in the top 25 in the world by Entrepreneur magazine Only person to have founded two different chains with approximately 4,000 locations Honored by the International Franchise Association as its Entrepreneur of the Year 1969 1981 Left H&R Block 1992 Resigned from Jackson Hewitt 1996 2003 2006 1989 Opened Jackson Hewitt offices in 169 Montgomery Ward Department Stores Founded Liberty Tax Service 2000 Began expanding Liberty Tax in the U.S. Source: JTH Holding, Inc. 2009 2011 Opened the 3,000th Liberty tax office 2 million tax returns filed 6 2012 Opened the 4,000th Liberty tax office |
|
|
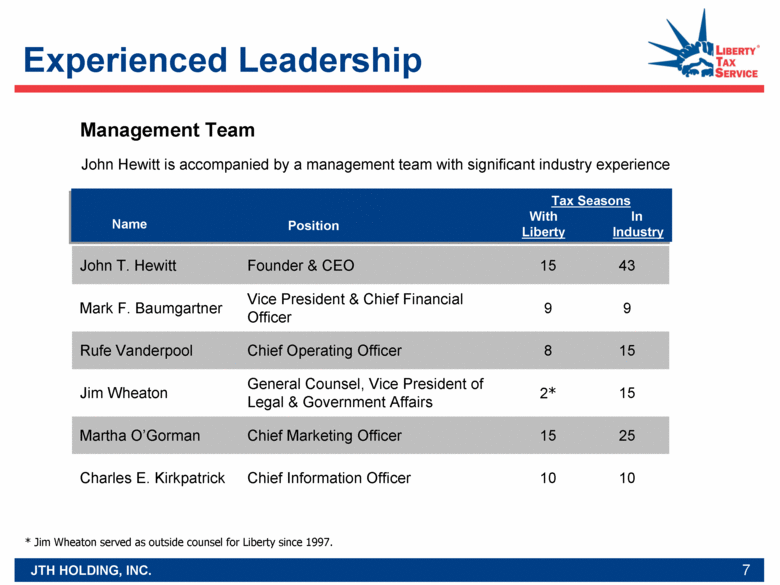
Experienced Leadership 7 Management Team John Hewitt is accompanied by a management team with significant industry experience Name Position Tax Seasons With In Liberty Industry * Jim Wheaton served as outside counsel for Liberty since 1997. John T. Hewitt Founder & CEO 15 43 Mark F. Baumgartner Vice President & Chief Financial Officer 9 9 Rufe Vanderpool Chief Operating Officer 8 15 Jim Wheaton General Counsel, Vice President of Legal & Government Affairs 2* 15 Martha O’Gorman Chief Marketing Officer 15 25 Charles E. Kirkpatrick Chief Information Officer 10 10 |
|
|
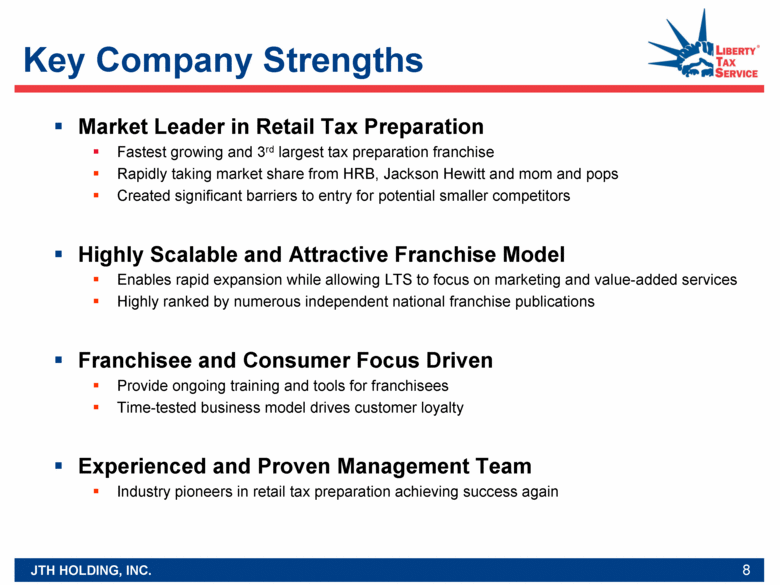
Key Company Strengths 8 Market Leader in Retail Tax Preparation Fastest growing and 3rd largest tax preparation franchise Rapidly taking market share from HRB, Jackson Hewitt and mom and pops Created significant barriers to entry for potential smaller competitors Highly Scalable and Attractive Franchise Model Enables rapid expansion while allowing LTS to focus on marketing and value-added services Highly ranked by numerous independent national franchise publications Franchisee and Consumer Focus Driven Provide ongoing training and tools for franchisees Time-tested business model drives customer loyalty Experienced and Proven Management Team Industry pioneers in retail tax preparation achieving success again |
|
|
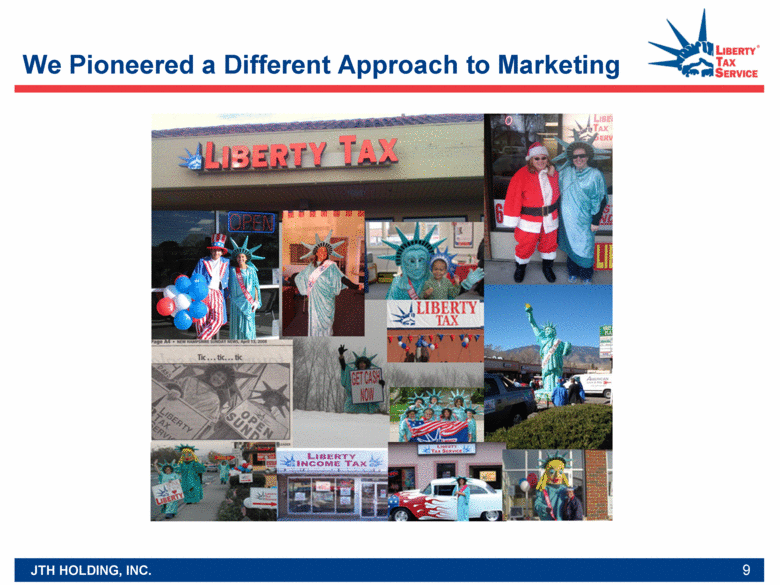
We Pioneered a Different Approach to Marketing 9 |
|
|
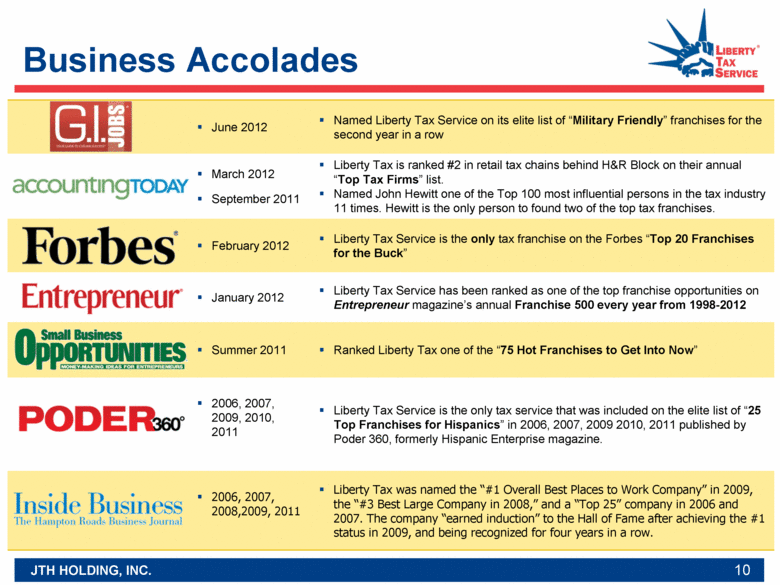
Business Accolades 10 June 2012 Named Liberty Tax Service on its elite list of “Military Friendly” franchises for the second year in a row March 2012 September 2011 Liberty Tax is ranked #2 in retail tax chains behind H&R Block on their annual “Top Tax Firms” list. Named John Hewitt one of the Top 100 most influential persons in the tax industry 11 times. Hewitt is the only person to found two of the top tax franchises. February 2012 Liberty Tax Service is the only tax franchise on the Forbes “Top 20 Franchises for the Buck” January 2012 Liberty Tax Service has been ranked as one of the top franchise opportunities on Entrepreneur magazine’s annual Franchise 500 every year from 1998-2012 Summer 2011 Ranked Liberty Tax one of the “75 Hot Franchises to Get Into Now” 2006, 2007, 2009, 2010, 2011 Liberty Tax Service is the only tax service that was included on the elite list of “25 Top Franchises for Hispanics” in 2006, 2007, 2009 2010, 2011 published by Poder 360, formerly Hispanic Enterprise magazine. 2006, 2007, 2008,2009, 2011 Liberty Tax was named the “#1 Overall Best Places to Work Company” in 2009, the “#3 Best Large Company in 2008,” and a “Top 25” company in 2006 and 2007. The company “earned induction” to the Hall of Fame after achieving the #1 status in 2009, and being recognized for four years in a row. |
|
|
Industry Overview 11 |
|
|
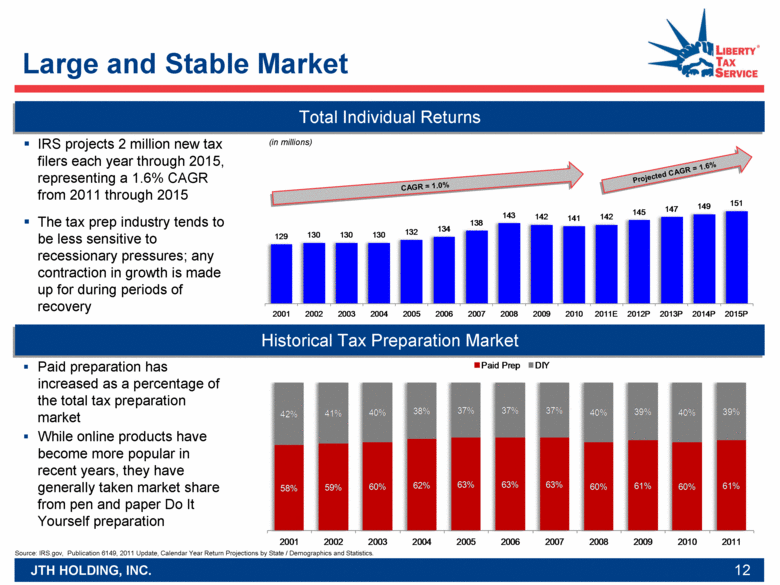
Large and Stable Market Total Individual Returns Historical Tax Preparation Market Source: IRS.gov, Publication 6149, 2011 Update, Calendar Year Return Projections by State / Demographics and Statistics. (in millions) IRS projects 2 million new tax filers each year through 2015, representing a 1.6% CAGR from 2011 through 2015 The tax prep industry tends to be less sensitive to recessionary pressures; any contraction in growth is made up for during periods of recovery Paid preparation has increased as a percentage of the total tax preparation market While online products have become more popular in recent years, they have generally taken market share from pen and paper Do It Yourself preparation CAGR = 1.0% Projected CAGR = 1.6% 12 129 130 130 130 132 134 138 143 142 141 142 145 147 149 151 2001 2002 2003 2004 2005 2006 2007 2008 2009 2010 2011E 2012P 2013P 2014P 2015P 58% 59% 60% 62% 63% 63% 63% 60% 61% 60% 61% 42% 41% 40% 38% 37% 37% 37% 40% 39% 40% 39% 2001 2002 2003 2004 2005 2006 2007 2008 2009 2010 2011 Paid Prep DIY |
|
|
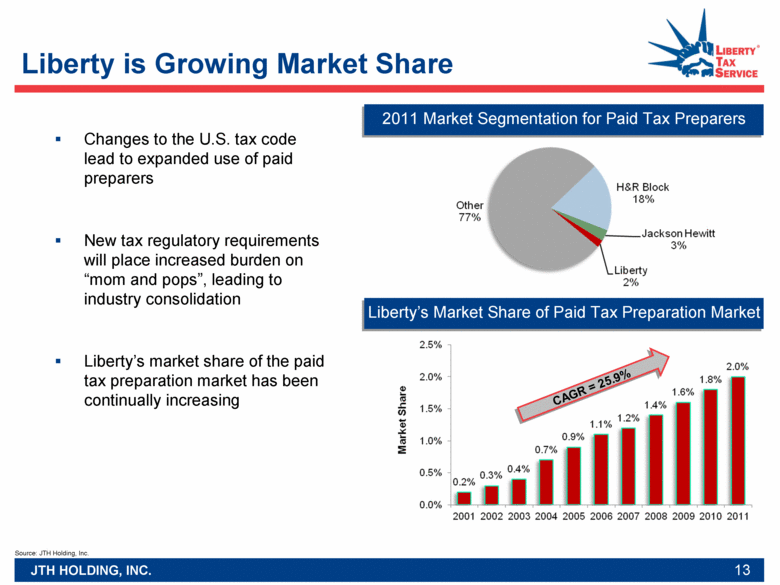
Liberty is Growing Market Share Changes to the U.S. tax code lead to expanded use of paid preparers New tax regulatory requirements will place increased burden on “mom and pops”, leading to industry consolidation Liberty’s market share of the paid tax preparation market has been continually increasing 2011 Market Segmentation for Paid Tax Preparers Liberty’s Market Share of Paid Tax Preparation Market CAGR = 25.9% Source: JTH Holding, Inc. 13 |
|
|
Financial Overview 14 |
|
|
Key Metrics 15 Total Franchisees CAGR = 5.2% Total Offices CAGR = 10.6% Total Returns Systemwide Revenue CAGR = 7.4% CAGR = 13.8% |
|
|
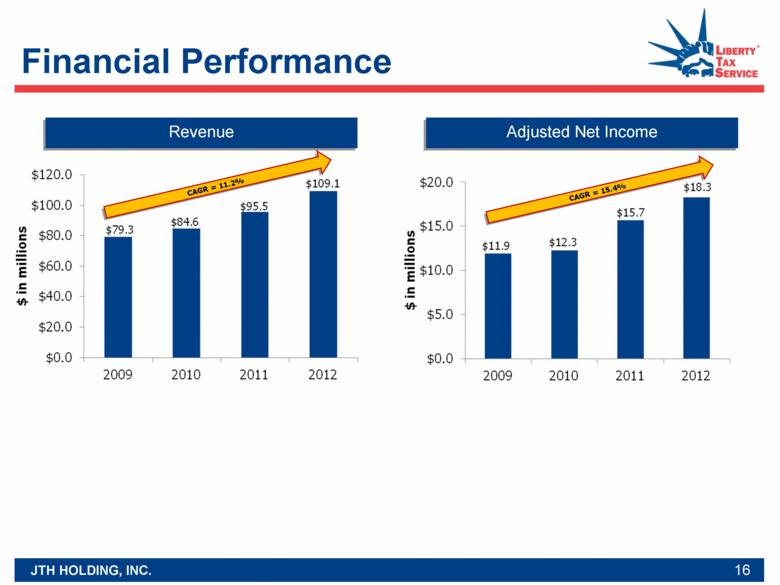
Financial Performance 16 Adjusted Net Income Revenue CAGR = 11.2% CAGR = 15.4% |
|
|
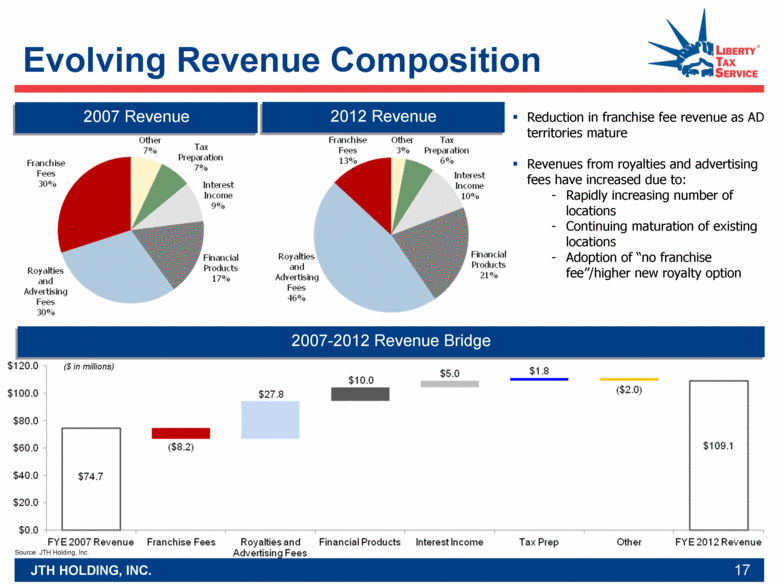
Evolving Revenue Composition 17 2007-2012 Revenue Bridge 2007 Revenue 2012 Revenue Reduction in franchise fee revenue as AD territories mature Revenues from royalties and advertising fees have increased due to: Rapidly increasing number of locations Continuing maturation of existing locations Adoption of “no franchise fee”/higher new royalty option Source: JTH Holding, Inc. ($ in millions) |
|
|
Overview of Financial Products Refund transfer product A direct deposit of the customer’s tax refund into a newly established temporary bank account in the customer’s name that Liberty establishes with one of its banking partners Delivery to the customer of a paper check or a prepaid card containing the balance of the customer’s refund after the payment of tax preparation and other fees Loan-based products The traditional form of refund-based lending has been the Refund Anticipation Loan (RAL) that has traditionally been offered by tax preparers through third-party banks With regulatory uncertainties, Liberty explored the provision of alternative loan-based financial products to tax customers through JTH Financial Engaged in pilot projects designed to provide loans through its Instant Cash Advances (ICAs) to customers in a handful of states Partnered with a non-bank lender and another party to assist in developing underwriting criteria for these loans, and developed its own proprietary processing system to handle these transactions 18 |
|
|
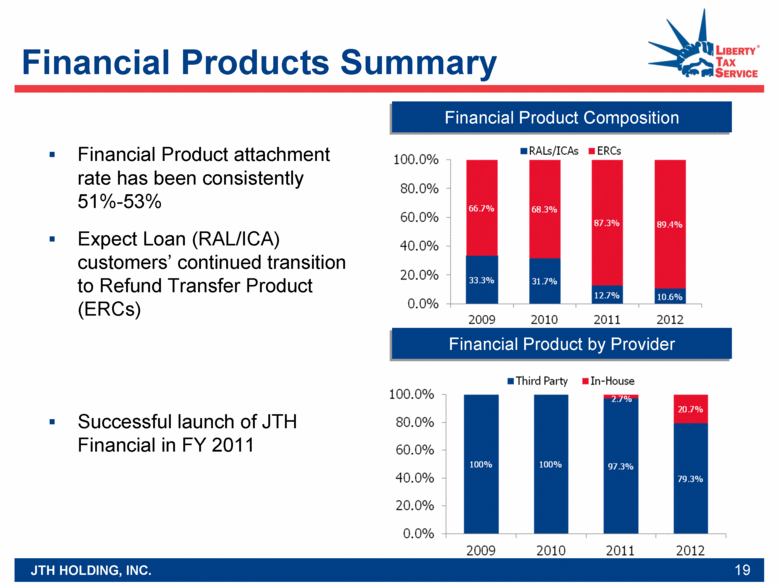
Financial Products Summary 19 Financial Product Composition Financial Product by Provider Financial Product attachment rate has been consistently 51%-53% Expect Loan (RAL/ICA) customers’ continued transition to Refund Transfer Product (ERCs) Successful launch of JTH Financial in FY 2011 |
|
|
Numerous Growth Opportunities Office Growth Innovative franchise programs – “No franchise fee” Potential for more than 6,000 additional offices Franchise expansion programs Industry consolidation Tax Return Growth 42% of 2012 tax season offices operated for 3 or fewer seasons Guerilla marketing approach Innovative tax preparation software – “NextGen” Growing national presence Availability of financial products Reacquisition of Area Developer Territories 20 |
|
|
Summary 21 |
|
|
Appendix June 20, 2012 22 |
|
|
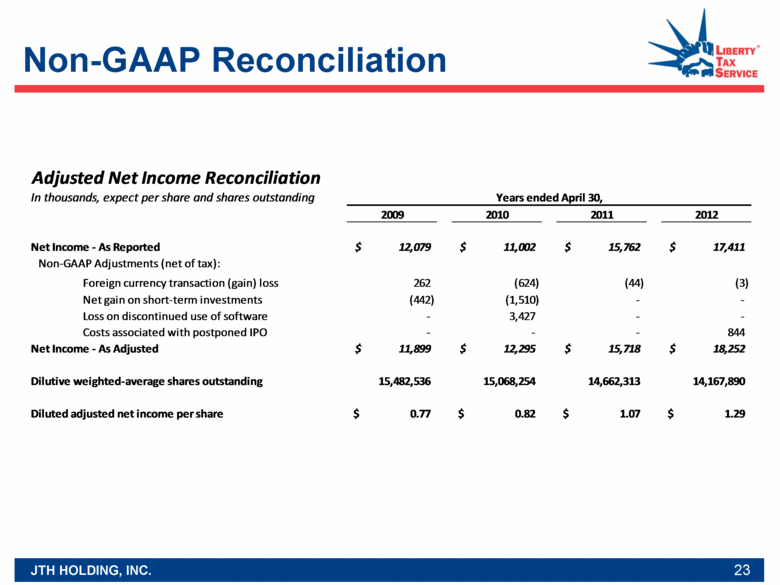
Non-GAAP Reconciliation 23 Adjusted Net Income Reconciliation In thousands, expect per share and shares outstanding 2009 2010 2011 2012 Net Income - As Reported 12,079 $ 11,002 $ 15,762 $ 17,411 $ Non-GAAP Adjustments (net of tax): Foreign currency transaction (gain) loss 262 (624) (44) (3) Net gain on short-term investments (442) (1,510) - - Loss on discontinued use of software - 3,427 - - Costs associated with postponed IPO - - - 844 Net Income - As Adjusted 11,899 $ 12,295 $ 15,718 $ 18,252 $ Dilutive weighted-average shares outstanding 15,482,536 15,068,254 14,662,313 14,167,890 Diluted adjusted net income per share 0.77 $ 0.82 $ 1.07 $ 1.29 $ Years ended April 30, |
|
|
24 |


