Attached files
| file | filename |
|---|---|
| EXCEL - IDEA: XBRL DOCUMENT - InvenSense Inc | Financial_Report.xls |
| EX-31.2 - CERTIFICATION OF THE PRINCIPAL FINANCIAL OFFICER PURSUANT TO SECTION 302 - InvenSense Inc | d342166dex312.htm |
| EX-31.1 - CERTIFICATION OF THE PRINCIPAL EXECUTIVE OFFICER PURSUANT TO SECTION 302 - InvenSense Inc | d342166dex311.htm |
| EX-23.1 - CONSENT OF DELOITTE & TOUCHE LLP - InvenSense Inc | d342166dex231.htm |
| EX-32.1 - CERTIFICATION OF THE PEO AND PFO PURSUANT TO SECTION 906 - InvenSense Inc | d342166dex321.htm |
Table of Contents
UNITED STATES
SECURITIES AND EXCHANGE COMMISSION
Washington, DC 20549
FORM 10-K
(Mark One)
For the fiscal year ended April 1, 2012 For the fiscal year ended April 1, 2012x Annual report pursuant to Section 13 or 15(d) of the Securities Exchange Act of 1934 for the Fiscal year ended April 1, 2012
or
¨ Transition report pursuant to Section 13 or 15(d) of the Securities Exchange Act of 1934 for the transition period from to
Commission File Number 001-35269
INVENSENSE, INC.
(Exact name of registrant as specified in its charter)
| Delaware |
01-0789977 | |
| (State or other jurisdiction of |
(I.R.S. Employer | |
| Incorporation or organization) |
Identification No.) | |
| 1197 Borregas Avenue Sunnyvale, CA |
94089 | |
| (Address of principal executive offices) |
(Zip code) |
(408) 988-7339
(Registrant's telephone number, including area code)
Securities registered pursuant to Section 12(b) of the Act:
| Title of Each Class |
Name of Each Exchange on Which Registered | |
| Common Stock, $0.001 Par Value |
New York Stock Exchange LLC |
Securities registered pursuant to Section 12(g) of the Act: None
Indicate by check mark if the registrant is a well-known seasoned issuer, as defined in Rule 405 of the Securities Act. YES ¨ NO x
Indicate by check mark if the registrant is not required to file reports pursuant to Section 13 or Section 15(d) of the Act. YES ¨ NO x
Indicate by check mark whether the registrant (1) has filed all reports required to be filed by Section 13 or 15(d) of the Securities Exchange Act of 1934 during the preceding 12 months (or for such shorter period that the registrant was required to file such reports), and (2) has been subject to such filing requirements for the past 90 days. YES x NO ¨
Indicate by check mark whether the registrant has submitted electronically and posted on its corporate Web site, if any, every Interactive Data File required to be submitted and posted pursuant to Rule 405 of Regulation S-T during the preceding 12 months (or for such shorter period that the registrant was required to submit and post such files). YES x NO ¨
Indicate by check mark if disclosure of delinquent filers pursuant to Item 405 of Regulation S-K is not contained herein, and will not be contained, to the best of registrant's knowledge, in definitive proxy or information statements incorporated by reference in Part III of this Form 10-K or any amendment to this Form 10-K. ¨
Indicate by check mark whether the registrant is a large accelerated filer, an accelerated filer, a non-accelerated filer, or a smaller reporting company. See the definitions of “large accelerated filer,” “accelerated filer” and “smaller reporting company” in Rule 12b-2 of the Exchange Act:
| Large accelerated filer ¨ |
Accelerated filer ¨ | |
| Non-accelerated filer x |
||
| (Do not check if a smaller reporting company) |
Smaller reporting company ¨ |
Indicate by check mark whether the registrant is a shell company (as defined in Rule 12b-2 of the Act). YES ¨ NO x
As of October 2, 2011, the last day of the registrant’s most recently completed second quarter; the registrant’s common stock was not publicly traded. The registrant’s common stock began trading on the New York Stock Exchange on November 16, 2011. As of April 1, 2012, the last business day of the registrant’s most recently completed fiscal year, the aggregate market value of registrant's voting and non-voting common stock held by non-affiliates was approximately $ 730.8 million, based upon the closing sale price of the common stock as reported on the New York Stock Exchange. This calculation excludes the shares of common stock held by each officer, director and holder of 5% or more of the outstanding common stock as of April 1, 2012. This calculation does not reflect a determination that such persons are affiliates for any other purposes.
As of June 5, 2012, there were approximately 81,365,631 shares of the registrant's common stock, $0.001 par value, outstanding.
DOCUMENTS INCORPORATED BY REFERENCE
Portions of the registrant’s definitive Proxy Statement for its 2012 Annual Meeting of stockholders are incorporated by reference in Part III of this Annual Report on Form 10-K where indicated. Such Proxy Statement will be filed with the Securities and Exchange Commission within 120 days of the registrant’s fiscal year ended April 1, 2012. Except with respect to information specifically incorporated by reference in this Annual Report on Form 10-K, the Proxy Statement is not deemed to be filed as part of this Annual Report on Form 10-K.
Table of Contents
INVENSENSE, INC.
2
Table of Contents
Special Note Regarding Forward-Looking Statements and Industry Data
This Annual Report on Form 10-K, including this Management’s Discussion and Analysis of Financial Condition and Results of Operations, includes a number of forward-looking statements that involve many risks and uncertainties. Forward-looking statements are identified by the use of the words “would,” “could,” “will,” “may,” “expect,” “believe,” “should,” “anticipate,” “outlook,” “if,” “future,” “intend,” “plan,” “estimate,” “predict,” “potential,” “targets,” “seek” or “continue” and similar words and phrases, including the negatives of these terms, or other variations of these terms, that denote future events. These forward-looking statements include: our belief that certain end-markets pose significant unrealized opportunities for motion interface functionality, including large near-term opportunities in the market for handheld devices, such as smartphones and tablet devices, and in particular devices that are enabled by the Android operating system or require optical image stabilization for camera functionality; our expectations as to future sales of consumer electronics devices that could potentially integrate motion processors; our anticipation that we will experience future growth, expand our intellectual property portfolio and increase our research and development expenses; our intention to develop and introduce more highly integrated products in the future that include greater motion sensing functionality and further enhancements to on-board motion interface capabilities; our expectation that our products will remain a component of customers’ products throughout any such product’s life cycle; our ability to protect our intellectual property in the United States and abroad; our belief in the sufficiency of our cash flows to meet our needs; and our future financial and operating results. These statements reflect our current views with respect to future events and our potential financial performance and are subject to risks and uncertainties that could cause our actual results and financial position to differ materially and adversely from what is projected or implied in any forward-looking statements included in this Annual Report on Form 10-K. These factors include, but are not limited to, the risks described under Item 1A of Part I — “Risk Factors,” Item 7 of Part II — “Management’s Discussion and Analysis of Financial Condition and Results of Operations,” elsewhere in this Annual Report on Form 10-K and those discussed in other documents we file with the SEC. We make these forward-looking statements based upon information available on the date of this Annual Report on Form 10-K, and we have no obligation (and expressly disclaim any such obligation) to update or alter any forward-looking statements, whether as a result of new information or otherwise except as otherwise required by securities regulations.
As used herein, “InvenSense,” the “Company,” “we,” “our,” and similar terms refer to InvenSense, Inc., unless the context indicates otherwise.
InvenSense®, AirSign®, MotionCommand®, BlurFree®, MotionTrackingTM, MotionProcessingTM, MotionProcessing UnitTM, MotionProcessorTM, DigitalMotionTM, DigitalMotion ProcessorTM, MotionFusionTM, MotionAppsTM, AirLockTM and LoPedTM are our trademarks. Trade names, trademarks and service marks of other companies appearing in this prospectus are the property of the respective holders.
3
Table of Contents
Overview
We are the pioneer and a global market leader in motion interface devices that detect and track an object’s motion in three-dimensional space. Our MotionTracking devices combine micro-electro-mechanical system, or MEMS, based motion sensors, such as accelerometers and gyroscopes, with mixed-signal integrated circuits (ICs) and proprietary algorithms and firmware that intelligently calibrate, process and synthesize sensor output for use by software applications via an application programming interface (API). Our MotionTracking devices are differentiated by small form factor, high level of integration, performance, reliability and cost effectiveness.
While our solutions have broad applicability across consumer, industrial, military and other industry verticals, we currently target consumer electronics within a variety of end markets that we believe demand a more intuitive and immersive user experience, such as console and portable video gaming devices, smartphones, tablet devices, digital still and video cameras, smart TVs (including digital set-top boxes, televisions and multi-media HDDs), 3D mice, toys, wearable health and fitness monitors and portable navigation devices. We anticipate that there may be a significant near-term opportunity for our products in the market for handheld devices, such as smartphones and tablet devices, and in particular devices that are enabled by the Android operating system or devices with high resolution cameras where optical image stabilization (OIS) is important to producing quality images.
We believe we are the first provider of a MotionTracking device for consumer applications. Our products span increasing levels of integration, from single-axis gyroscopes to fully-integrated, intelligent dual- and three-axis gyroscopes, and the industry’s only integrated six-axis and nine-axis, MotionTracking devices. The majority of our production volume today derives from our integrated three-axis product families. We started volume shipments of our six-axis Motion Tracking product in September 2011 and introduced a nine-axis MotionTracking device in January 2012. We intend to continue develop even more highly integrated products.
We were incorporated in the State of California in June 2003 and reincorporated in the State of Delaware in October 2004. Our principal executive offices are located at 1197 Borregas Avenue, Sunnyvale, CA 94089. Our telephone number is (408) 988-7339. Our website is located at www.invensense.com and our investor relations website is located at ir.invensense.com
Our fiscal year is a 52 or 53 week period ending on the Sunday closest to March 31. Our three most recent fiscal years ended on April 1, 2012 (“fiscal year 2012”), April 3, 2011 (“fiscal year 2011”) and March 28, 2010 (“fiscal year 2010”). Fiscal year 2012 and fiscal year 2010 were comprised of 52 weeks and fiscal year 2011 was comprised of 53 weeks.
Our net revenue was $153.0 million, $96.5 million and $79.6 million for fiscal years 2012, 2011 and 2010, respectively, and our net income was $36.9 million, $9.3 million and $15.1 million for these periods, respectively.
In fiscal years 2012 and 2011, our products were incorporated in multiple smartphones and tablets from leading manufacturers, including Acer, Asus, HTC, LG, Motorola, Samsung and ZTE. Our net revenue was derived from multiple end markets, including smartphones and tablets, video gaming, digital still and video cameras, digital television and set-top box remote controls, 3D mice, toys, wearable health and fitness monitors, portable navigation devices and other consumer electronics. Nintendo incorporates our dual-axis and three-axis gyroscope into its Wii MotionPlus accessory, Wii Remote Plus controllers and its 3D handheld gaming device, the 3DS.
4
Table of Contents
We utilize a fabless business model, working with third parties to manufacture our products, while the critical test and calibration functions are performed in our wholly owned subsidiary located in Hsinchu, Taiwan. We sell our products through our direct worldwide sales organization and through our indirect channel of distributors to manufacturers of consumer electronics devices, original design manufacturers and contract manufacturers. We are headquartered in Sunnyvale, California and had 263 employees worldwide as of April 1, 2012.
Industry Background
Over the last decade, advances in technology have led to a rapid proliferation of consumer electronics devices used for communication, entertainment, convenience and business. In order to differentiate products and increase sales in intensely competitive markets, consumer electronics device manufacturers have been eager to adopt new device functionalities, expand use cases and create new, compelling user interfaces and interactive experiences using technologies, such as touch screen and, more recently, motion-based functions.
Several mass market smartphone manufacturers have successfully introduced consumers to touch screen technology and basic motion-based features, such as tilt control, which enables a screen to switch between portrait and landscape mode based on a device’s orientation. Since then, more advanced motion sensing and processing capabilities that facilitate motion-based video gaming, device control, assisted navigation and advanced display functionality are becoming a part of the standard feature set of smartphones and tablet devices. These capabilities are also being incorporated into a range of other consumer electronics devices. The momentum behind the adoption of motion interfaces in consumer electronics illustrates how technology can change the way consumers interact with electronics devices, as well as their expectations for future consumer products. Nintendo’s Wii was the first mass market video gaming console to incorporate basic motion-based functions, introducing consumers to a motion-based video gaming experience. Since its introduction in November 2006, the Nintendo Wii has sold over 94 million units. Following the introduction of the Wii, Nintendo has continued to innovate and provide consumers with an increasingly immersive motion-based video gaming experience that can interface with natural human motions with the 3D handheld gaming device, the Nintendo 3DS.
The Key Motion Sensors
Sensors that are able to detect motion in three-dimensional space have been commercially available for several decades and have been used in automobiles, aircraft and ships. However, the size, power consumption, cost, manufacturing methods, calibration requirements and other design complexities involved in integration of motion sensors have historically prevented their mass adoption in consumer electronics.
While other kinds of motion sensor technologies may potentially become available commercially, we believe the following four principal types of motion sensors are important for motion interface in free space:
| • | Accelerometers (G-sensors) measure linear acceleration and tilt angle. Single and multi-axis accelerometers detect the combined magnitude and direction of linear, rotational and gravitational acceleration. They can be used to provide limited motion sensing functionality. For example, a device with an accelerometer can detect rotation from vertical to horizontal state in a fixed location. As a result, accelerometers are primarily used for simple motion sensing applications in consumer devices, such as changing the screen of a mobile device from portrait to landscape orientation. |
| • | Gyroscopes (Gyros) measure the angular rate of rotational movement about one or more axes. Gyroscopes can measure complex motion accurately in free space, tracking the position and rotation of a moving object. In contrast, accelerometers primarily detect the fact that an object has moved or is moving in a particular direction. Unlike accelerometers and compasses, gyroscopes are not affected by errors related to external environmental factors, such as gravitational and magnetic fields. Hence, gyroscopes greatly enhance the responsiveness of the motion sensing capabilities of devices and are |
5
Table of Contents
| used for advanced motion sensing applications in consumer devices, such as full gesture recognition, movement detection and motion simulation in video gaming. |
| • | Magnetic Sensors (Compasses) detect magnetic fields and measure their absolute position relative to Earth’s magnetic north and nearby magnetic materials. Information from magnetic sensors can also be used to correct errors from other motion sensors, such as gyroscopes. One example of how compass sensors are used in consumer devices is reorienting a displayed map to match up with the general direction a user is facing. Many smartphones and tablet devices have begun incorporating compasses to enable enhanced gaming and location-based applications. |
| • | Pressure Sensors (Barometers) measure relative and absolute altitude through the analysis of changing atmospheric pressure. Pressure sensors can be used in consumer devices for sports and fitness or location-based applications where information can be used for elevations or floor-specific location. |
Challenges in Adoption of Motion Sensors in Consumer Electronics
Early adoption of motion sensors in consumer electronics was limited primarily to accelerometers that provided basic motion sensing capabilities. Devices incorporating these early motion sensors experienced strong demand, as they provided consumers with applications that included a more intuitive user interface. More recently, consumer devices have expanded their incorporation of other motion sensors, including gyroscopes, compasses and pressure sensors.
As consumers continue to become more accustomed to motion-enabled applications, there is a significant opportunity to deliver a broader spectrum of consumer electronics devices that can provide robust motion interface. However, there are several challenges that motion sensor vendors need to overcome in order to deliver a product that can achieve mass adoption in consumer electronics markets.
In order to digitize full real-life motion, system designers are limited to using discrete motion sensor components, such as gyroscopes, accelerometers and compasses, as well as a separate microcontroller in their already space-constrained products. Such an approach can create many performance, form factor, firmware and software design and cost challenges. In addition, using discrete motion sensors from various suppliers requires customized and costly system-level calibration by customers on the factory floor to meet required performance and precision standards.
Consumer electronics devices typically have significant form factor limitations within which sensors and related digital circuitry must fit. Furthermore, system designers of consumer electronics operate with system-level constraints, such as total system cost, as well as significant time-to-market challenges given the rapid product cycles prevalent in the industry. While system designers may desire to incorporate motion interface capabilities in their devices, adding multiple discrete sensors and additional digital control circuitry to the system design may be unacceptable in terms of total system cost, performance or time-to-market.
To enable multi-sensor integration for full motion interface, system designers also need firmware and software capabilities to receive, process and synthesize motion sensor data. They also need calibration algorithms and APIs that can interpret the motion sensor data and make it easily accessible to application processors for consumption by end applications. Finally, MotionTracking devices must be cost effectively produced in high volume and must overcome significant challenges in sensor design, including precision and noise, vibration and performance requirements. Without these capabilities, the development of compelling motion interface-based applications may be prohibitively difficult for most consumer electronics device manufacturers and application developers.
As a result, we believe most system designers would prefer an intelligent, integrated, scalable system-level motion interface platform that incorporates multiple motion sensors, digital control circuitry, APIs and motion application software together in one solution: a MotionTracking device.
6
Table of Contents
The Opportunity for MotionTracking Devices
Similar to the development of the microprocessor enabling the emergence of the personal computer and the multitude of applications that now run on that platform, as well as the development of the graphics processor enabling compelling, life-like graphics for numerous video gaming and professional applications, we believe the introduction of an intelligent, integrated motion interface platform can enable realization of the full potential of motion sensors and make motion-based applications ubiquitous in consumer electronics.
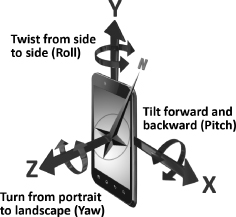
We define motion interface as the ability to detect, measure, synthesize, analyze and digitize an object’s motion in three-dimensional free space. The illustration below shows how a smartphone moves in 3D space, either by rotating around or moving along any of its three principle axes. By incorporating motion sensors, such as a three-axis gyroscope, a three-axis accelerometer and a three-axis compass, the smartphone’s movement can be accurately tracked in free space. The gyroscope tracks the rotation of the smartphone as it tilts forward or backward (pitch), turns from portrait to landscape (yaw) and twists from side to side (roll), while the accelerometer measures the linear movement of the smartphone as it moves up or down (y-axis), left or right (x-axis) and toward or away from the user (z-axis), and the compass measures the device orientation or pointing direction relative to magnetic north. The analog data from the gyroscope, accelerometer and compass can be digitized and synthesized using complex algorithms to support motion-based user interfaces and other applications, such as motion-based video games and on-screen menu navigation.
We define a MotionTracking device as a complete system that integrates various motion sensors with digital control and processing, and provides sensor fusion algorithms, high-level programming interfaces, calibration algorithms and motion application software. Motion interface can offer device designers, consumers and application developers two fundamental benefits: a mechanism to intuitively and seamlessly interface with consumer electronics by translating the full range of natural human motion to digital signals, and an application ecosystem based on motion interface.
Since consumers and application developers were first introduced to motion sensing capabilities in electronics, their desire and vision for more advanced motion-based user interface capabilities in devices has increased and expanded rapidly. As a result, an increasing number of device manufacturers, platform providers and application developers are introducing products and software that take advantage of motion interface capabilities. In particular, motion interfaces have been added to leading operating systems, such as the Android operating system from Google.
There are a number of consumer electronics devices in the market today, such as console and portable video gaming devices, smart TVs, smartphones, tablet devices, digital still and video cameras, toys and navigation devices, toys, and health and fitness accessories, that have incorporated motion interface technologies.
7
Table of Contents
We believe the following consumer electronics end-markets present examples of significant opportunities for motion interface:
| • | Smartphones: While many smartphones use basic motion sensing capabilities to provide tilt sensing, screen rotation and basic video gaming functionality, the latest generation of smartphones are increasingly incorporating complete motion interface technology that can deliver enhanced user experiences in the areas of web, media and menu navigation. In addition, motion interface technology can provide a range of other capabilities, such as more responsive motion-based video gaming, enhanced still and video image stabilization, improved pedestrian navigation, secure authentication through gestures, as well as gesture and character shortcuts that accelerate common tasks on the device. |
| • | Tablets: While still a nascent market, tablet devices are rapidly being adopted by consumers and enterprises. Similar to smartphones, early generations of tablet devices use basic motion sensing capabilities to provide tilt-sensing and screen rotation, but it is expected that newer generations of these devices will incorporate complete motion interface technology to provide a wide range of motion-based capabilities. |
| • | Video gaming: Motion interface technology in console and portable video gaming devices provides an immersive video gaming experience by accurately tracking body and hand movements, and is significantly more intuitive than traditional button and joystick based interfaces. The Nintendo Wii and the recently introduced Nintendo 3DS is representative of this motion interface technology in the video gaming market. |
| • | Smart TVs: Digital televisions (DTVs), set-top boxes and multi-media HDDs, which constitute the smart TV market, are becoming increasingly more interactive through the addition of interactive menus and applications, internet browsing, video-on-demand services and viewing of personal media content. This has created the need for a user interface device with the functionality of a computer mouse and the ability to operate without a desk, for example while sitting on a living room couch. With a motion-based approach to menu and web navigation, users can interface with an on-screen menu or use hand motions in a manner similar to motion- based video gaming controllers. Further, a motion controlled remote would allow additional functionality, including gesture shortcuts and games, to be embedded into the system. |
| • | Optical Image Stabilization (OIS) for Camera Phone Modules: Camera phone modules are a commonly used feature in mobile handset devices today. Current market trends are driving smartphone manufacturers to differentiate their products by including even higher, 8 MP or greater resolution camera phone modules into their devices, thus enabling the smartphone to act as a substitute for traditional digital still cameras (DSCs). Cameras of this resolution benefit from stabilization technologies to eliminate the distortive effects of hand jitter which causes image blur, especially in low lighting conditions. Because these problems are further amplified by the small form factor of handset devices, which are more prone to hand jitter, consumers have been encouraged to continue to use their DSCs. Advancements in camera module assembly and availability of smaller and high performance gyroscopes have made it possible to incorporate the OIS function into handset camera modules while providing image qualities comparable to that of a DSC. |
| • | Other emerging opportunities: There are many other possible applications for motion interface in products used by consumers daily. For example, manufacturers of digital still and video cameras, toys, navigation devices, wearable sensors, healthcare monitoring equipment, health and fitness equipment, and industrial tools have or may in the future expand the use of motion interface technologies. The use of MotionTracking devices in these devices can significantly enhance their performance, intelligence, safety and functionality. |
8
Table of Contents
The InvenSense Solution
We have developed proprietary, intelligent, integrated single-chip MotionTracking devices that enables intuitive and immersive user interfaces. As a result of our modular and scalable platform architecture, our current and planned products span increasing levels of integration, from standalone single-chip gyroscopes to fully integrated multi-sensor, multi-axis digital MotionTracking devices. In fiscal years 2011 and 2012, the majority of our product volume was derived from our two-axis and three-axis gyroscopes. In September 2011, we announced that our six-axis MotionTracking devices were available for high volume shipment and began shipments in our fourth quarter of fiscal year 2012.
Our MotionTracking devices are comprised of several fundamental proprietary components:
| • | Our MEMS-based motion sensors combined with our mixed-signal circuitry for signal processing provide the functionality required to measure motion in three-dimensional space. The high performance of our sensors is enabled by our proprietary Nasiri-Fabrication platform. |
| • | Our MotionFusion technology consists of a hardware acceleration engine we refer to as a Digital Motion Processor (DMP) and sensor fusion firmware. MotionFusion technology enables the conversion of analog signals to digital signals and intelligently assimilates them into usable data. |
| • | Our MotionApps platform provides application programming interfaces (API) and calibration algorithms that simplify access to complex functionality commonly needed by our customers. This platform utilizes the output from the MotionFusion layer to enable system designers to use the sensor data in their applications without the need to understand detailed motion sensor outputs and develop related motion interface algorithms. We are designing our MotionApps platform to be interoperable with major mobile operating systems, such as Google’s Android and Microsoft’s Windows. In addition, we have developed numerous system level APIs for various third-party applications and motion sensors. |
The competitive advantages of our technology and solutions are:
| • | Highly integrated and cost-effective solutions enabled by our patented Nasiri-Fabrication platform. The foundation of our MotionTracking devices is our patented Nasiri-Fabrication platform, which enables integration of standard MEMS with CMOS (also known as CMOS-MEMS) in a small, cost-effective wafer-level solution. Combining a MEMS wafer with an industry standard CMOS wafer reduces the number of MEMS manufacturing steps, perform wafer-level testing, and use wafer-level packaging, thereby reducing back-end costs of packaging and testing and improving overall product yield and performance. In addition to our CMOS-MEMS process, we have developed low-cost, high-throughput proprietary test and calibration systems, which further reduce back-end costs. We believe we have pioneered a technological breakthrough in high-volume manufacturing of low-cost, high-performance MEMS motion processors. Combining this unique high-volume fabrication capability with our other core proprietary technologies, we are able to deliver our MotionTracking devices with industry-leading integration and cost-effectiveness. |
| • | Ability to rapidly accelerate time-to-market by leveraging our MotionApps platform. Our MotionApps platform promotes faster adoption and accelerates time-to-market for our customers. We achieve this by providing easy-to-use APIs that can be easily integrated into different operating systems, calibration algorithms and an applications engine that supports pre-configured motion-processing applications. These features eliminate the need for our customers to develop separate software libraries, thereby reducing the time required to develop motion-based applications. In addition, our MotionApps platform enables device manufacturers with limited motion interface experience to rapidly incorporate higher level motion-enabled applications in their products. To further accelerate adoption of our products, we have been collaborating with major operating systems providers, such as Google, and processor and microcontroller providers to incorporate our solutions into their reference designs. |
9
Table of Contents
| • | Scalable MotionTracking devices with opportunities for continuing integration. Our Nasiri-Fabrication platform enables the integration of multiple motion sensors, such as gyroscopes and accelerometers, on a single chip with processing capability. Our latest generation of MotionTracking devices have both an embedded three-axis gyroscope and three-axis accelerometer on the same chip, enabling integrated six-axis motion interface functionality. As a result of integrating multiple sensors, our products can eliminate the traditional calibration steps required with discrete solutions as well as offload the intensive motion interface computation requirements from the host processor. Over time, we believe we can integrate more advanced features and functionalities into our solution. |
| • | Flexible manufacturing, performance and reliability. Most MEMS devices are manufactured in proprietary in-house fabrication facilities utilizing numerous fabrication steps, esoteric substrates and MEMS-specific manufacturing processes that are not compatible for integration with standard CMOS fabrication processes. Nasiri-Fabrication allows us to utilize a fabless business model without relying on specialty foundries for MEMS manufacturing. Our fabless model enables cost-effective, high-volume production and provides us with the flexibility to quickly react to our customers’ needs. Additionally, our ability to perform wafer-level testing combined with our close collaborative relationships with third-party foundries enables us to better control the manufacturing process and product yields, resulting in lower cost and improved device performance and reliability. |
Technology
Our technology is comprised of five core proprietary components: our Nasiri-Fabrication platform; our advanced MEMS motion sensor designs; our application specific mixed-signal circuitry for sensor signal processing; our sensor fusion algorithms in firmware that intelligently assimilate data from multiple sensors for use by end applications; and finally our MotionApps platform consisting of application programming interfaces (APIs) and calibration algorithms. Although all five components are critical to providing complete MotionTracking devices, our Nasiri-Fabrication platform is the core differentiating technology.
Nasiri-Fabrication Platform
The cornerstone of our technology is our patented Nasiri-Fabrication platform, which we believe gives us a sustainable and differentiated competitive advantage. Nasiri-Fabrication is a standard “six mask” MEMS-specific bulk silicon fabrication process that enables direct bonding of MEMS components with related signal conditioning and logic circuitry that are fabricated using standard complementary metal oxide semiconductor (CMOS) processes. CMOS is a pervasive semiconductor technology used by nearly every semiconductor vendor and available at many foundries for fabrication of semiconductor devices. MEMS is a well established technology that leverages several fundamental principles of semiconductor fabrication to manufacture micron-size physical structures in small form factors. We use MEMS processes to create wafers containing the structural layers used for our motion sensors, and standard CMOS fabrication technology to create wafers to provide drive and signal conditioning circuits, as well as the logic circuitry that processes sensor signals to deliver complete MotionTracking devices.
Our Nasiri-Fabrication platform combines separately manufactured MEMS and CMOS wafers, forming a complete and integrated wafer in a single bonding step. Though this bonding process uses off-the-shelf semiconductor processing equipment, the bonding technology itself is patented. Following the bonding process, the combined wafer (also known as a CMOS-MEMS wafer) undergoes another patented pad-opening step, which uses a standard sawing technique to open electrical wire bond pads, allowing wafer-level testing.
The resulting CMOS-MEMS wafers are then tested using standard automated wafer probers, after which the wafers are diced into thousands of individual chips, which are then packaged. These finished products then go through one final testing and calibration operation using in-house proprietary testers before being shipped to
10
Table of Contents
customers. We have successfully employed our Nasiri-Fabrication platform in the high-volume production of 150 mm and 200 mm wafers.
One of the significant advantages of our Nasiri-Fabrication platform is its impact on product packaging and testing. The back-end cost of packaging and testing MEMS products fabricated with competing processes accounts for a significant percentage of total product cost. Our Nasiri-Fabrication platform was developed specifically to address this fundamental challenge with MEMS technology. By enabling full fabrication of CMOS-MEMS wafers at standard CMOS foundries and following the same back-end fabrication process used for CMOS wafers, our Nasiri-Fabrication platform has enabled a significant reduction in back-end costs.
Products
Our products include the industry’s only MotionProcessor units (MPUs), in addition to our inertial measurement units (IMUs) and MEMS gyroscopes. All of our core products are single-chip integrated solutions and are intended for use by electronics manufacturers in their devices to enable motion- based applications. We believe our products provide industry-leading performance at compelling price points with minimal footprint. We also provide customers with a proprietary MotionApps platform, which contains algorithms and APIs to enhance their time-to-market and facilitate integration of our products into their devices.
Our most advanced products include our MPUs and IMUs, which integrate multiple sensors with advanced mixed-signal circuitry. Our latest generation product, the nine-axis MPU-9150, combines our three-axis MEMS gyroscope, three-axis MEMS accelerometer, MotionFusion technology and MotionApps platform with a third-party three-axis e-compass. This provides all of the capabilities required for complete nine-axis motion interface on a single chip. In addition, we have recently introduced our new IDG-2020 and IXZ-2020 families of dual-axis gyroscopes with significantly reduced package sizes to address the need for optical image stabilization (OIS) technology in camera phones.
Our current high-volume products are three-axis MPUs and IMUs and six-axis MPUs. Our IMU-3000 products combine the three-axis MEMS gyroscope with mixed-signal circuitry and a secondary input port that interfaces with third-party digital accelerometers to deliver a complete six-axis MotionFusion output to the host processor. Our MPU-3000 goes beyond the IMU-3000’s capability by adding our MotionApps platform to deliver advanced motion interface functionality. Our MPU-6000 improves on our MPU-3000 by adding a three-axis digital accelerometer to deliver six-axis motion interface functionality without reliance on third-party MEMS products in the same 4x4mm form factor and pin compatible configuration as our other product lines.
Our gyroscopes are designed to measure rotational motion around one or more axes and provide the results through an analog or digital output. We have developed a series of the world’s first multi-axis gyroscopes that have achieved competitive cost targets per axis while meeting the package size and the appropriate level of rotational sensing accuracy to be suitable for a broad variety of consumer electronics.
11
Table of Contents
The table below sets out our key product lines, including available versions and new products available for sampling to selected customers, and descriptions of key performance parameters for each of our product families. Except as otherwise indicated, package sizes and operating voltage for our digital output product families (MPU, IMU and digital gyroscopes) are 4x4x0.9mm and 2.1V to 3.6V, respectively.
| Product Families | Product Families | Key Features | ||
| MPU (MotionProcessing Units) |
MPU-9150 |
¨ Nine-axis: three-axis digital gyroscope + three-axis digital accelerometer + three axis e-compass ¨ MotionFusion ¨ MotionApps | ||
| MPU-6000 | ¨ Six-axis: three-axis digital gyroscope + three-axis digital accelerometer ¨ MotionFusion ¨ MotionApps | |||
| MPU-3000 | ¨ Three-axis digital gyroscope ¨ MotionFusion ¨ MotionApps | |||
| IMU (Inertial Measurement Units) |
IMU-3000 | ¨ Three-axis digital gyroscope ¨ MotionFusion | ||
| Digital Gyroscopes |
ITG-3000 |
¨ Three-axis digital output | ||
| IDG-2020 and IXZ-2020 | ¨ Dual-axis digital output ¨ 3×3×0.90mm package size | |||
| IDG-2000 | ¨ Dual-axis digital output |
Markets and Customers
Our customers consist of the world’s largest consumer electronics makers, including Acer, Asus, HTC, LG Electronics, Nintendo, Motorola, Pantech, RIM, Samsung and ZTE. These customers are in multiple consumer market segments, including smartphones and tablets, console and portable video gaming devices, digital television and set-top box remote controls, remote controlled toys and other household consumer and industrial devices.
Historically we have relied on Nintendo for a significant portion of our net revenue. Nintendo accounted for approximately 31%, 73% and 85% of our net revenue for fiscal years 2012, 2011 and 2010, respectively, with the majority of those sales relating to the Wii platform. For fiscal year 2012, two other customers, HTC and Samsung, accounted for 15% and 12% of total net revenue respectively. The loss of any of these customers would have a material adverse effect on our business. No other customers accounted for more than 10% of total net revenue for fiscal years 2012, 2011 or 2010.
Seasonality of Business
Our business is subject to seasonality because of the nature of our target markets. At present, virtually all of our motion interface products are sold in the consumer electronics market. Sales of consumer electronics tend to be weighted towards holiday periods, and many consumer electronics manufacturers typically experience seasonality in sales of their products. Seasonality affects the timing and volume of orders for our products as our customers tend to increase production of their products that incorporate our solutions in the first three quarters of our fiscal year in order to build inventories for the holiday season. Sales of our products tend to correspondingly increase during these quarters and to significantly decrease in the fourth quarter of our fiscal year.
12
Table of Contents
Backlog
As of April 1, 2012, our backlog from customers was $17.1 million, compared to $30.1 million as of April 3, 2011. Due to varying customer order patterns, backlog may not be a reliable indicator of fiscal quarter or fiscal year sales.
Sales and Marketing
We sell our products through our direct worldwide sales organization and through our indirect channel of distributors to manufacturers of consumer electronics devices, original design manufacturers and contract manufacturers.
Our product marketing, business development and application solution engineering teams focus on leveraging our core MotionTracking devices across end markets and operate with a common mission to drive and promote motion interface applications and use cases. These teams are responsible for all new applications and market specific engagements, providing customized technical and application support, and identifying opportunities and strategic relationships. Furthermore, they work closely with ecosystem partners to further promote and enable the motion interface market. For example, these teams may engage with microcontroller suppliers, operating system platform vendors, application providers, independent software developers, and system solution platform vendors. Further, the technical marketing and application engineering teams actively engage with new customers during their design-in processes to educate them on the value proposition of our MotionTracking devices, identify how they could utilize our solutions in their products and provide them with the most suitable solutions, application programming interfaces (APIs) and potential reference designs. We believe these activities could result in continued adoption of our MotionTracking devices by new customers.
We work directly with large original equipment manufacturer (OEM) customers to assist them in developing solutions and applications that may lead to more demand for our products. Early adoptees in new market segments typically take 6 to 12 months to evaluate their need for motion interface before the start of any development activities, which typically take an additional 6 to 12 months. For customers that have already adopted motion interface, we typically undertake a shorter sales cycle. If successful, this process culminates in the use of our product in their system, which we refer to as a design win. Volume production can begin shortly after the design win. For our larger OEM customers, we believe that our direct customer engagement approach, ecosystem partnerships and adoption of our APIs into major software operating systems provides us with significant differentiation in the customer sales process by aligning us more closely with the changing needs of these OEM customers and their end markets. We actively utilize field application engineers as part of our sales process to better engage the customer with our products. To effectively service our other customers, we achieve greater reach and operating leverage by using manufacturers’ representatives and distributors.
Our direct customer engagement model extends to service and support. We work closely with our customers to ensure the successful installation and ongoing support of our products. We support our customers with a team of experienced account managers, sales professionals and field application engineers who provide business planning, and pre-sale and operational sales support.
Our external marketing strategy is focused on building our brand and driving customer demand for our MotionTracking devices. Our internal marketing organization is responsible for branding, collateral generation, channel marketing and sales support activities. We focus our resources on programs, tools and activities that can be leveraged by our global channel partners to extend our marketing reach, such as sales tools and collateral, product awards and technical certifications, training, regional seminars and conferences, webinars and various other demand-generation activities.
13
Table of Contents
Manufacturing
Our Nasiri-Fabrication platform combines MEMS with standard complementary metal oxide semiconductors (CMOS) at the wafer level, which has allowed us to pioneer the industry’s first high-volume, commercial MEMS fabless business model. This fabless approach allows us to focus our engineering and design resources on product development and design. In addition, as we do not own wafer fabrication facilities, we are able to reduce our fixed costs and capital expenditures. In contrast to many fabless MEMS companies, which utilize standard process technologies and design rules established by their MEMS foundry partners, we have developed our own proprietary Nasiri-Fabrication platform and collaborated with our foundry partners to install our fabrication technology on their equipment in their facilities solely for manufacturing our products. Through close collaboration with our CMOS-MEMS foundry partners, we are able to maintain control over the manufacturing process, which has historically resulted in favorable yields for our products.
The majority of our wafers are currently provided by Taiwan Semiconductor Manufacturing Corporation, Limited. Wafer foundries manufacture both the MEMS and CMOS wafer, perform the critical wafer level bonding step of Nasiri-Fabrication and deliver the final combined CMOS-MEMS wafer product to us. We have recently qualified GLOBALFOUNDRIES Inc. as a foundry partner and plan to have other CMOS-MEMS foundries qualified for our products in the future.
The completed bonded CMOS-MEMS wafers are shipped to our facility in Taiwan for proprietary wafer level testing. Our products are then assembled and packaged by independent subcontractors in Taiwan and Thailand. We currently outsource our packaging operations to Siliconware Precision Industries Co. Limited, HANA Microelectronics Group, and Lingsen Precision Industries, Limited. The assembled products are then forwarded for final calibration and outgoing functionality test to our wholly owned subsidiary in Hsinchu, Taiwan, prior to shipping to our customers or distributors.
Over the last three years, we have been able to increase our annual manufacturing capacity to over 300 million units in order to meet the volume demands of our customers, as well as potential additional demand. We continue to expand our CMOS-MEMS manufacturing capacity as well as our captive wafer sort, sensor test, and calibration testing facilities in Taiwan.
Research and Development
We have assembled an experienced team of engineers with core competencies in MEMS design and fabrication, CMOS mixed-signal design, and software development. Through our research and development efforts, we have developed a collection of intellectual property and know-how that we are able to leverage across our products and end markets. Our research and development efforts are generally targeted at five areas:
| • | In the area of the Nasiri-Fabrication platform, we intend to continue to invest in our process technology to further refine our technology platform with respect to overall form factor, product performance and process yield enhancement and to expand the platform to enable us to further develop our product offerings beyond what is currently achievable. |
| • | With our heritage in high-volume fabless MEMS manufacturing, we believe we are uniquely positioned to help enable a fabless MEMS ecosystem. We have recently developed an NF-Shuttle program that allows universities and industry peers to license and leverage our technology in the development of CMOS-MEMS based solutions. |
| • | In the area of MEMS development and design, we intend to expand our portfolio of products, exploring new ways of integrating various sensors in a monolithic motion processor that eliminates the need for discrete motion sensors. We are also investing in the development of systems expertise in new markets and applications that leverage our core capabilities. |
14
Table of Contents
| • | In the area of CMOS design and integration, our initiatives include developing analog and digital IC design capabilities and circuit development intellectual property to facilitate our MEMS development roadmap, improving our sensor performance, and adding new functions to our products. |
| • | In the area of software and algorithms, our initiatives include algorithm development for MotionFusion as well as the incorporation of additional functionality into our MotionApps platform. Advances in this area will help to enhance the detection and analysis of complex motion sensor data, as well as enable higher level functionality in the form of APIs and motion-based applications to allow our customers to quickly and efficiently leverage the capabilities of our MotionTracking devices. |
Through our research and development efforts, we intend to continually expand our portfolio of patents and to enhance our intellectual property position. As of April 1, 2012, we had 109 employees involved in research and development. Our engineering design teams are located in Sunnyvale, California. For fiscal years 2012 and 2011, we incurred $19.7 million, and $15.8 million, respectively, in research and development costs.
Intellectual Property Rights
We primarily rely on patent, trademark, copyright and trade secrets laws, confidentiality procedures, and contractual provisions to protect our technology. We focus our patent efforts in the United States, and, when justified by cost and strategic importance, we file corresponding foreign patent applications in strategic jurisdictions, such as Europe, the Republic of Korea, Taiwan, China and Japan. We have 23 issued U.S. patents and 3 issued foreign patents, which will expire between October 2023 and December 2032, and 41 patent applications pending for examination in the United States Patent and Trademark Office and 31 international patent applications pending for examination in Europe, the Republic of Korea, Taiwan, China and Japan which will expire between October 2024 and July 2032.
All of our foreign issued patents and patent applications are related to our U.S. issued patents and patent applications.
Our issued patents and certain of our pending patent applications relate to the Nasiri-Fabrication platform, which allows us to reduce back-end costs and form factor, to create hermetically sealed cavities for MEMS sensors and to improving performance, reliability and integration, and to our sensor design, which reduces sensitivity to interference from environmental sounds and vibrations, enabling higher performance and accuracy. In addition, we have other pending patent applications that relate to mixed-signal circuits and architectures, which have a wide variety of applications, and to algorithms, software and application development, which facilitate offloading motion interface computations from main application processors to our chips.
We intend to continue to file additional patent applications with respect to our technology. We do not know whether any of our pending patent applications will result in the issuance of patents or whether the examination process will require us to narrow our claims. Even if granted, there can be no assurance that these pending patent applications will provide us with protection. Our intellectual property strategy is to, where feasible, defend our IP across the various aspects of our solution. While we license IP and software libraries from third parties, none of these are fundamental to our MotionTracking devices and fabrication platforms.
Employees
As of April 1, 2012, our total headcount was 263, comprised of 109 employees in research and development, 63 employees in sales and marketing, 66 employees in manufacturing operations, and 25 employees in a general and administrative capacity. None of our employees are represented by a labor union with respect to his or her employment with us. We have not experienced any work stoppages, and we consider our relations with our employees to be good.
15
Table of Contents
Competition
We compete with companies that may have substantially greater financial and other resources with which to pursue engineering, manufacturing, marketing and distribution of their products. We currently and primarily compete with the following twelve companies: Analog Devices, Inc., Epson Toyocom Corporation, Kionix, Inc. (a wholly owned subsidiary of Rohm Co., Ltd.), MEMSIC, Inc., Murata Manufacturing Co., Ltd. (Murata), Panasonic Corporation, Robert Bosch GmbH, Sensor Dynamics, Inc. (recently acquired by Maxim Integrated Products, Inc.), Sony Corporation, STMicroelectronics N.V. (STMicro) and VTI Technologies, Inc. (recently acquired by Murata). Currently, we believe STMicro is our primary competitor in the consumer motion sensing market. Over time, we expect continued competition from motion sensor competitors as well as competition from new entrants into the motion interface market.
The principal methods of competition of motion interface technology includes the following:
| • | The design and volume production of new products that anticipate the motion interface and integration needs of customers’ next generation products and applications; |
| • | Scalable operations to meet customers’ volume and timing demands; |
| • | A declining manufacturing and operating cost structure; |
| • | Identification of new and emerging markets, applications and technologies and developing products for these markets; |
| • | Product pricing points, performance and cost effectiveness; |
| • | The recruitment and retention of key employees; |
| • | Intellectual property, including patents and trademarks; |
| • | High product quality, reliability and customer support; |
| • | Financial stability; |
| • | Manufacturing, distribution and marketing capability; |
| • | Brand recognition; |
| • | Size of customer base; and |
| • | Strength and length of key customer relationships. |
We believe we are competitive with respect to these factors, particularly because our products are typically smaller in size, are highly integrated, and achieve high performance specifications at lower price points than competitive products. However, most of our current competitors have longer operating histories, significantly greater resources, greater brand recognition and a larger base of customers than we do.
Legal Proceedings
From time to time we are involved in litigation that we believe is of the type common to companies engaged in our line of business, including intellectual property and employment issues. Regardless of the merit or resolution of any such litigation, complex intellectual property litigation is generally costly and can divert the efforts and attention of our management and technical personnel. Although occasional adverse decisions or settlements may occur, management believes that the final disposition of such matters will not have a material effect on our business, financial position, results of operations or cash flows.
On May 16, 2012, STMicroelectronics, Inc. (“STI”) filed a patent infringement complaint in the Northern District of California against us, alleging infringement of U.S. Patent Nos. 6,504,253; 6,846,690; 6,405,592;
16
Table of Contents
6,546,799; 6,928,872; 7,450,332; 7,409,291; 5,874,850; and 5,986,861 (collectively, the “Asserted Patents”). STI alleges that certain lnvenSense Micro-Electro-Mechanical Systems products and services, including but not limited to InvenSense's ITG-3200, MPU-6050, IDG-500, and IMU-3000 product lines, infringe one or more claims of the Asserted Patents. As this litigation has only recently been initiated, we believe it is not yet possible to assess the merits of the plaintiffs claim and or the amount of damages, if any, that could be awarded in the event of an unfavorable outcome. We intend to contest the case vigorously.
On July 20, 2010, plaintiff Wacoh Company filed a complaint in the District of Delaware against us and four other companies in the business of making gyroscopes for various applications, alleging infringement of U.S. Patent Nos. 6,282,956 and 6,865,943. The complaint sought unspecified monetary damages, costs, attorneys’ fees and other appropriate relief. In January 2012, we prevailed on a motion to sever the case against us from the cases against other companies and to transfer the case to the Northern District of California. We intend to continue to contest the case vigorously. Our management believes that this lawsuit has no merit and believes that the overall outcome of this complaint will not have a material effect on our business, financial position, results of operations, or cash flows.
Corporate and Available Information
The following filings are made available through our investor relations website after we file them with the SEC: Annual Reports on Form 10-K, Quarterly Reports on Form 10-Q, and our Proxy Statements for our annual meetings of stockholders. These filings are also available for download free of charge on our investor relations website. We also provide a link to the section of the SEC’s website at www.sec.gov that has all of our public filings, including Quarterly Reports on Form 10-Q, Current Reports on Form 8-K, all amendments to those reports, our Proxy Statements, and other ownership related filings. Further, a copy of this Annual Report on Form 10-K is located at the SEC’s Public Reference Room at 100 F Street, NE, Washington, D.C. 20549. Information on the operation of the Public Reference Room can be obtained by calling the SEC at 1-800-SEC-0330.
We webcast our earnings calls and certain events we participate in or host with members of the investment community on our investor relations website. Additionally, we provide notifications of news or announcements regarding our financial performance, including SEC filings, investor events, press and earnings releases, and blogs as part of our investor relations website. Investors and others can receive notifications of new information posted on our investor relations website in real time by signing up for email alerts and RSS feeds. Further corporate governance information, including governance guidelines, board committee charters, and code of conduct, is also available on our investor relations website under the heading “Corporate Governance.” The contents of our websites are not intended to be incorporated by reference into this Annual Report on Form 10-K or in any other report or document we file with the SEC, and any references to our websites are intended to be inactive textual references only.
Additional information required by this Item 1 are incorporated by reference in Item 6, “Selected Financial Data”, Item 7, “Management's Discussion and Analysis of Financial Condition and Results of Operations” and Item 8, “Financial Statements and Supplementary Data” of this Annual Report on Form 10-K.
17
Table of Contents
Our operations and financial results are subject to various risks and uncertainties, including those described below, which could adversely affect our business, financial condition, results of operations, cash flows, and the trading price of our common stock.
Risks Related to Our Business
We are dependent upon the continued market acceptance and adoption of motion interface and, in particular, the adoption of our MotionTracking devices in consumer electronics products.
Our products are currently used to provide motion sensing and processing functionality, primarily in consumer electronics products for video gaming and mobile and handheld devices, including smartphones and tablet devices. Motion sensing utilizes gyroscopes, accelerometers and other sensors (increasingly integrated together to reduce the number of discrete sensors) to measure the motion of the device when manipulated by the user, and enables applications such as re-orienting a screen on a smartphone from portrait mode to landscape mode and providing an interface for motion-based commands for video gaming. A motion interface platform, on the other hand, is a complete system-level solution that delivers improved functionality and performance because it integrates various motion sensors with digital control and processing, and provides high-level programming interfaces. Motion interface is a relatively new technology for many consumer electronics products that can be utilized in a number of applications, including motion-based video games or user interfaces for smartphones. We have developed a MotionProcessing platform that we consider to be proprietary.
Market adoption and acceptance of motion interface technology, including our MotionTracking devices, in consumer electronics products is dependent on a number of factors that are outside of our control. For example, device manufacturers must decide whether incorporating the improved functionality and performance that comes with motion interface will result in improved sales and market acceptance of their products. In addition, device manufacturers may not be able to integrate motion sensing or processing technologies into their products in a manner that they, or their customers, consider to deliver cost-effective, compelling functionality, and developers may not introduce applications that employ motion interface in a compelling way. In addition, there are a number of companies that claim intellectual property ownership over motion as a user interface, and these claims could discourage manufacturers from integrating motion interface technology into their products.
We are particularly dependent upon the continued adoption of MotionTracking devices, including our MotionTracking devices, in mobile handheld devices, including smartphones and tablet devices. While smartphone manufacturers have begun to incorporate advanced motion sensing functionality, including three-axis gyroscopes, into their devices, if applications that utilize this functionality are not developed or if consumers do not find the applications provided by motion interface technology compelling, mobile device manufacturers may curtail their adoption of this technology. Consequently, our net revenue may fall short of our expectations and operating results could be adversely affected. Any unanticipated delay in the launch or decline in the volume of our customers’ smartphone and tablet device platforms into which we have been designed may negatively impact our net revenue.
The adoption of MotionTracking devices, and, in particular, our MotionTracking devices, in mobile handheld devices and other consumer electronics products, is dependent to a substantial degree upon the development of software applications written by third-party developers that utilize motion interface technology to provide a compelling user experience and consumer demand for such applications. If consumers or device manufacturers do not find the enhanced performance of devices employing motion interface technology to be compelling or sufficient to justify the additional cost of including the technology in their products, our net revenue and operating results may be adversely affected.
18
Table of Contents
We face intense competition based on a number of factors, including price, and we expect competition to increase in the future, which could have an adverse effect on our net revenue, potential net revenue growth rate and market share.
The market for motion interface products is highly competitive, particularly in the market for consumer electronics, which is highly sensitive to price. In the market for consumer electronics, we compete to various degrees on the basis of our products’ size, price, integration, performance, product roadmap, and reliability. Competition may increase and intensify if more and larger semiconductor companies, or the internal resources of large, integrated original equipment manufacturers, or OEMs, enter our markets. Increased competition could result in price pressure, reduced profitability and loss of market share, any of which could materially and adversely affect our business, net revenue and operating results.
We face competition primarily from integrated semiconductor manufacturers, such as Analog Devices, Inc., Epson Toyocom Corporation, Kionix, Inc. (a wholly owned subsidiary of Rohm Co., Ltd.), MEMSIC, Inc., Murata Manufacturing Co., Ltd. (Murata), Panasonic Corporation, Robert Bosch GmbH, Sensor Dynamics, Inc. (recently acquired by Maxim Integrated Products, Inc.), Sony Corporation, STMicroelectronics N.V. and VTI Technologies, Inc. (recently acquired by Murata), from in-house development organizations within some of our potential customers and from smaller companies specializing in MEMS and motion-sensing products, including those that provide motion-sensing products offering less functionality at a lower cost, such as accelerometers. Our primary competitor in most of our target markets is STMicroelectronics. We also compete with large, sophisticated platform developers that may prefer to integrate less sophisticated motion sensors and to develop their own motion interface application interfaces for developers, marginalizing the total solution we offer. Additionally, competitors that have traditionally focused on industrial or automotive applications for MEMS motion sensors may pursue the consumer electronics market, thus intensifying competition for our products. We expect competition in the markets in which we participate to increase in the future as existing competitors improve or expand their product offerings.
Most of our current competitors have longer operating histories, significantly greater resources, greater brand recognition and a larger base of customers than we do. Some of our competitors also have in-house vertically integrated manufacturing capabilities. In addition, these competitors may have greater credibility with our existing or prospective customers and in some cases are already providing components for products to such existing and prospective customers that may in the future include MotionTracking devices. Moreover, many of our competitors have been doing business with our customers or potential customers for a long period of time and have established relationships that may provide them with information regarding future market trends and requirements that may not be available to us. Additionally, some of our larger competitors may be able to provide greater incentives to customers through rebates and similar programs. Finally, some of our competitors with multiple product lines may bundle their products to offer customers a broader product portfolio at a more competitive price point. These factors may make it difficult for us to gain or maintain market share.
The average selling prices of our products could decrease, which could have a material adverse effect on our net revenue and gross margins.
Our primary customers expect the average selling prices of our products to continue to decrease over time as a result of agreements we enter into with our customers from time to time, competitive pricing pressures, new product introductions by us or our competitors, product end-of-life programs and for other reasons. We have experienced and may continue to experience substantial period-to-period fluctuations in future operating results due to the erosion of the average selling prices of our products. If we are unable to offset any reductions in our average selling prices by implementing internal cost reduction programs, increasing our sales volumes or introducing new products with higher gross margins, our net revenue and gross margins will decline, which could have a material adverse effect on our results of operations.
19
Table of Contents
To date, a significant amount of our net revenue has been attributable to demand for our products in the video gaming market. This market may decline or remain flat. Even if the market grows, such growth may not benefit the video game consoles that incorporate our products. Any of these potential developments could have a material adverse effect on our business, net revenue and operating results.
We derive a significant amount of our net revenue from the video gaming market. Currently, there are three major providers of video gaming consoles, and our products have only been incorporated by one of these console providers. While the other two video gaming companies have introduced video gaming accessories or consoles that incorporate motion-based video gaming functionality, our MotionTracking devices have not been incorporated into these new products. Future generations of video gaming consoles and video gaming accessories may not adopt motion interface at all or, if they do, may use our competitors’ products, internally developed solutions or alternative technologies not based on MEMS sensors. If we are not successful in obtaining design wins in new generations of video gaming accessories or consoles, if video gaming consoles or accessories that incorporate our products are not successful, or if video games that utilize the functionality provided by our MotionProcessing products are not successful, our net revenue and operating results will decline. Further, while the overall video gaming market has performed well over the past several years, even if we achieve design wins, the video gaming market or the market for specific products incorporating our solutions may not continue to grow or may decline for a number of reasons outside of our control, including competition among video gaming companies, market saturation, the lack of compelling video game titles or the emergence of alternative forms of entertainment.
Additionally, the video gaming market is subject to volatility from changes in the macroeconomic environment as well as industry specific trends, such as trends resulting from announcements by one of the major video gaming companies or from the console cycle of video gaming consoles. Any decline or volatility in the overall video gaming industry could cause our net revenue and operating results to fall short of expectations or decline.
Revenue delays could result from shortages of key third party components to our customers and injunctions of our customer products from intellectual property claims by their competitors.
We are depend on our customers for our net revenue and our net revenues could be negatively impacted by shortages of key third party components to our customers and injunctions of our customer products from intellectual property claims by their competitors.
We currently depend on Nintendo for a material portion of our net revenue, and the loss of, or a substantial reduction in orders from, Nintendo would significantly reduce our net revenue and adversely impact our operating results.
Nintendo Co. Limited accounted for approximately 31% of our net revenue for fiscal year 2012. We expect that sales to Nintendo will continue to account for a substantial portion of our net revenue for the foreseeable future. The loss of, or a substantial reduction in orders from, Nintendo would have a significant negative impact on our business. While we work closely with Nintendo to develop forecasts for periods of up to one year, these forecasts are not legally binding and may be unreliable, and we do not typically obtain firm purchase orders or commitments from Nintendo that extend beyond a short period. Nintendo, like other customers, might increase, cancel, reduce or reschedule forecasts and orders with us on relatively short notice, which could expose us to the risks of insufficient capacity or excess inventory and could have a material adverse impact on our operating results.
To date, a substantial majority of the products we have sold to Nintendo have been incorporated into the Wii MotionPlus accessory, the Wii Remote Plus controller used with the Nintendo Wii video gaming console and the 3DS gaming console. Because a large portion of our net revenue is tied to Nintendo gaming products, we expect to remain dependent on the continued success of products and related video games utilizing motion interface for the foreseeable future.
20
Table of Contents
The Wii is in the fifth year of its console cycle, which refers to the life cycle of video game consoles, which we believe is typically about five years. Nintendo has announced its intention to introduce a successor to the Wii. If sales of the successor console are not as significant as sales of the Wii console and sales of the Wii console decline should Nintendo discontinue the Wii console, our sales based on Wii MotionPlus accessories and Wii Remote Plus controllers included with new console sales will also decline.
Nintendo may choose to develop a second source for motion interface components in order to reduce its exposure to the risks associated with a single source of supply. In addition, Nintendo may in the future choose to adopt a solution that is different from ours or use motion interface components or MotionTracking devices supplied by competitors or developed internally. Any of these developments would significantly harm our business.
If we fail to develop and introduce new or enhanced products on a timely basis, our ability to attract and retain customers could be impaired, and our competitive position could be harmed.
We operate in a dynamic environment characterized by rapidly changing technologies and industry standards, and rapid technological obsolescence. To compete successfully, we must design, develop, market and sell new or enhanced products that provide increasingly higher levels of performance, integration and reliability and meet the cost expectations of our customers. A key element of our product strategy is to integrate additional sensors and motion interface functionality into our products. For instance, we have expanded our product line from three-axis gyroscopes to a six-axis device that includes a three-axis gyroscope, three-axis accelerometer and motion interface functionality. In addition, our latest generation product, the nine-axis MPU-9150, combines our three-axis MEMS gyroscope, three-axis MEMS accelerometer, MotionFusion technology and MotionApps platform with a third-party three-axis e-compass. The introduction of new products by our competitors, the market acceptance of products based on new or alternative technologies, or the emergence of new industry standards could render our existing or future products obsolete.
If we fail to successfully manage the transition to products using our next generation six-and nine-axis MotionProcessors or more highly integrated products, we will lose net revenue and our operations could be materially and adversely affected.
The majority of our production volume today derives from our integrated three-axis product families. We have introduced, and intend to continue to introduce, more highly integrated products that include greater motion sensing functionality and further enhancements to on-board motion interface capabilities. We may not be successful in achieving market acceptance of our more highly integrated single-chip products on the financial or other terms that we expect to obtain, and existing or potential new customers may instead rely on multi-chip, discrete motion sensor solutions. This could result in the loss of net revenue and earnings and potential inventory write-downs or obsolescence.
If we fail to expand sales in our current markets, develop new customers and penetrate new markets, particularly the market for handheld devices, our net revenue and potential net revenue growth rate could be materially and adversely affected.
Other than applications in the video gaming market, where we have historically derived the significant majority of our net revenue, to date, our MotionTracking devices have been employed in a limited number of other applications, such as smartphones and tablet devices, digital still and video cameras, digital television and set-top box remote controls, 3D mice and remote-controlled toys. Our future net revenue growth, if any, will depend on our ability to expand sales in our current markets, develop new customers and penetrate new markets. We anticipate that there may be a significant near-term opportunity for our products in the market for smartphones and tablet devices, and in particular devices that are enabled by the Android operating system or devices with high resolution cameras where optical image stabilization (OIS) is important to producing quality images. If new markets do not develop as we currently anticipate, or if we are unable to penetrate new markets or
21
Table of Contents
the market for smartphones and tablet devices successfully, our net revenue and net revenue growth rate could be materially and adversely affected.
While the general market for handheld devices is very fragmented, a limited number of manufacturers command a relatively large share of the market for smartphones with enhanced functionality running the Android operating system, and it is this portion of the market that presents the most attractive opportunity for our MotionTracking devices. All of these potential customers are large, multinational companies with substantial negotiating power relative to us over price and terms of supply. Securing design wins with any of these companies or other smartphone manufacturers will require a substantial investment of our time and resources. Some of these companies produce products that already include motion sensors, and they may decide not to adopt our MotionTracking devices. Additionally, the smartphone market is subject to a unique set of industry dynamics, such as shorter design cycles and multiple devices and manufacturers. The smartphone market is highly competitive, and if we are unable to successfully navigate the unique dynamics of such market, if we are unable to adapt our products in response to any future changes in the requirements of the Android operating system, or if the products of manufacturers that choose to incorporate our solutions are not commercially successful, our net revenue may not grow and our operating results may be adversely affected.
In addition, we are targeting the market for digital television and set-top box remote controls that we believe will benefit from motion interface functionality for enhanced user interfaces. Currently, applications for motion interface in this market are limited due to the limited marginal adoption of next generation digital televisions and set-top boxes that utilize a motion-based interface. While we believe this market represents a large growth opportunity, it is still in the early stages of development. If this market fails to develop as we anticipate, or if we are unable to manage our business in a way that allows us to capture this growth opportunity, our net revenue and operating results may be adversely affected.
Even if we are successful in securing design wins with handheld device manufacturers, many of them produce a large number of products and models, and our products may be incorporated into only a few of them. If we fail to penetrate this market or other new markets upon which we target our resources, or we are successful in penetrating only relatively low volume product lines, our net revenue and potential net revenue growth rate will be adversely affected and our financial condition could suffer.
Our sales are subject to a competitive selection process conducted by our prospective customers that can be lengthy and require us to expend significant resources, even though we ultimately may not be selected.
The process of identifying potential new customers, developing their interest in our products, moving through their design cycle, obtaining a design win, obtaining purchase orders and entering into volume production is extremely time consuming. We compete during our customers’ product design and planning processes to achieve “design wins,” which refers to a customer’s decision to include one of our solutions in its products under development. These selection processes can be lengthy and can require us to invest significant time and effort. Our products may not be selected during a customer’s design process, and we may not generate net revenue despite incurring expenses and devoting significant resources to achieving a design win. Because the life cycles for our customers’ products can last several years and changing suppliers involves significant cost, time, effort and risk, our failure to be selected in a competitive design process can result in our foregoing net revenue from a given customer’s product line for the life of that product.
Although we have a number of customers that have purchased our products in production volumes, such customers are significantly smaller than our largest customer. Typically, many customers, including most of our current customers, initially include our products in only one or a few product lines. It generally takes time for sales volumes of a new product line to grow and for customers to incorporate one of our solutions into additional product lines, if any. Even after we achieve a design win, a customer may decide to cancel or change its product plans, may fail to commercialize its products, or those products may fail to achieve market acceptance, any of which could cause us to fail to generate sales from a particular design win and adversely affect our results of
22
Table of Contents
operations. Further, failure to achieve design wins could result in lost sales and hurt our prospects in future competitive selection processes because we may not be perceived as a preferred or competitive vendor.
We rely on a limited number of third parties to supply, manufacture and assemble our products, and the failure to manage our relationships with our third-party contractors could adversely affect our ability to produce, market and sell our products.
We do not have our own manufacturing facilities. We operate based on an outsourced manufacturing business model that utilizes third-party foundry and packaging capabilities. Relying on third-party manufacturing, assembly and packaging presents significant risks to us, including the following:
| • | reduced control over delivery schedules, yields and product reliability; |
| • | price increases; |
| • | the failure of a key supplier to perform its obligations to us for technical, market or other reasons; |
| • | challenges presented by introducing our fabrication processes to new suppliers or deploying them in new foundries; |
| • | difficulties in establishing additional manufacturing suppliers if we are presented with the need to transfer our manufacturing process technologies to them; |
| • | shortages of materials; |
| • | misappropriation of our intellectual property; and |
| • | limited warranties on wafers or products supplied to us. |
The performance of our third-party manufacturers is outside of our control. At present, we depend upon Taiwan Semiconductor Manufacturing Company (TSMC) to manufacture most of our products. Although we are not obligated to purchase a specific volume of products from, or to contract with, TSMC on an exclusive basis, we anticipate that we will be dependent on TSMC to supply a substantial portion of our products in our 2013 fiscal year. In the fourth quarter of fiscal year 2012 we announced qualification of a new high volume foundry. We expect that it would take approximately nine to 16 months to transition our manufacturing to new third-party manufacturers that have not already begun installing our manufacturing processes. Such a transition would likely require certain customers to qualify our new manufacturers. If one or more of our third-party contractors or other outsourcers fail to perform their obligations in a timely manner or at satisfactory quality levels, our ability to bring products to market, the reliability of our products and our reputation could suffer.
For example, in 2007, one of our former third-party manufacturers failed to supply us with the number of wafer components that it had accepted as a firm commitment order, which adversely impacted our ability to meet our commitments to ship products to our customers. In the future, if our third-party manufacturers fail to deliver quality products and components on time and at reasonable prices, we could have difficulties fulfilling our customer orders, our net revenue could decline and our business, financial condition and results of operations would be adversely affected. In addition, if our foundry partners materially increase their prices for the fabrication of our products, our business would be materially harmed.
Our third-party manufacturers may not allocate sufficient capacity for us to have our products produced and shipped to our customers on a timely basis, which may materially adversely affect our growth and our results of operations.
We rely on third-party foundries for our CMOS-MEMS wafer fabrication, assembly and packaging services. We make substantially all of our purchases through purchase orders based on our own rolling forecasts, and our third-party manufacturers are not required to supply us products beyond these forecasted quantities.
23
Table of Contents
Beyond minimal capacity guarantees, most of our third-party manufacturers do not have any obligations to provide us with additional capacity on a timely basis.
We generally place orders for products with some of our suppliers approximately three to four months prior to the anticipated delivery date, with order volumes based on our forecasts of demand from our customers. Accordingly, if we inaccurately forecast demand for our products, we may be unable to obtain adequate and cost-effective foundry or assembly capacity from our third-party manufacturers to meet our customers’ delivery requirements, or we may accumulate excess inventories. On occasion, we have been unable to adequately respond to unexpected increases in customer purchase orders and therefore were unable to benefit from this incremental demand. In addition, our third-party manufacturers may prioritize orders placed by other companies that order higher volumes of products, many of whom are larger and more established than us. In the event that manufacturing capacity is reduced or eliminated at one or more of our third-party manufacturers’ facilities, we could have difficulties fulfilling our customer orders, and our net revenue and results of operations could decline.
Failure to achieve expected manufacturing yields for our products could negatively impact our operating results.
Manufacturing yields for our products are a function of product design, which is developed largely by us, and process technology, some of which is proprietary to our foundries. Low yields may result from either product design or process technology failures. We do not know whether a yield problem exists until our products are manufactured based on our design. When a yield issue is identified, the product is analyzed and tested to determine the cause. As a result, yield deficiencies may not be identified until well into the production process. In the fourth quarter of fiscal year 2012 we announced qualification of a new foundry, and we may experience delays or product yield issues as this facility increases production volumes in the future. Resolution of yield problems requires cooperation among, and communication between, us and our foundries. Because of our potentially limited access to wafer foundry capacity, decreases in manufacturing yields could result in an increase in our costs, cause us to fail to meet product delivery commitments and force us to allocate our available product supply among end customers. Lower than expected yields could potentially harm our operating results, our customer relationships and our reputation.
Our failure to anticipate or timely develop new or enhanced products or technologies in response to technological change could result in decreased net revenue and our competitors achieving more design wins. In particular, we may experience difficulties with product design, manufacturing or marketing that could delay or prevent our development, introduction or marketing of new or enhanced products, including products with higher levels of sensor integration such as our nine-axis device, which has not yet commenced production in commercial quantities. If we fail to introduce new or enhanced products with potentially greater integration that meet the needs of our customers or penetrate new markets in a timely fashion, we will lose market share and our operating results will be adversely affected.
Our future success depends on the continuing efforts of our founder, President, Chief Executive Officer and Chairman, Steven Nasiri, and other key personnel, and on our ability to successfully attract, train and retain additional key personnel.
Our future success depends heavily upon the continuing services of the members of our senior management team and various engineering and other technical personnel. In particular, our founder, President, Chief Executive Officer and Chairman, Steven Nasiri, has been and remains central to the development and advancement of the Nasiri-Fabrication platform and the MEMS technology that is the foundation of our ability to design, develop and manufacture our MotionTracking devices, and to the management of our engineering, product development, manufacturing, operations and sales organizations. In addition, our engineers and other technical personnel are critical to our future technological and product innovations.
If one or more of our senior executives or other key personnel are unable or unwilling to continue in their present positions, we may not be able to replace them easily or at all, our business may be disrupted, and our
24
Table of Contents
financial condition and results of operations may be materially and adversely affected. In addition, if any member of our senior management team or any of our other key personnel joins a competitor or forms a competing company, we may experience material disruption of our operations and development plans and lose customers, distributors, know-how and key professionals and staff members, and we may incur increased operating expenses as the attention of other senior executives is diverted to recruit replacements for key personnel. Our industry is characterized by high demand and intense competition for talent, and the pool of qualified candidates is very limited. We cannot ensure that we will be able to retain existing, or attract and retain new, qualified personnel, including senior executives and skilled engineers, whom we will need to achieve our strategic objectives. In addition, our ability to train and integrate new employees into our operations may not meet the growing demands of our business. The loss of any of our key personnel or our inability to attract or retain qualified personnel, including engineers and others, could delay the development and introduction of, and would have an adverse effect on our ability to sell, our products, which could harm our overall business and growth prospects.
Our intellectual property is integral to our business. If we are unable to protect our intellectual property, our business could be adversely affected.
Our success depends in part upon our ability to protect our intellectual property. To accomplish this, we rely on a combination of intellectual property rights, including patents, copyrights, trademarks and trade secrets in the United States and in selected foreign countries where we believe filing for such protection is appropriate. Our ability to use and prevent others from using our Nasiri-Fabrication platform, which is the subject of several patents and patent applications, is crucial to our success. Effective patent, copyright, trademark and trade secret protection may be unavailable, limited or not applied for in some countries. Some of our products and technologies are not covered by any patent or patent application. We cannot guarantee that:
| • | any of our present or future patents or patent claims will not lapse or be invalidated, circumvented, challenged or abandoned; |
| • | our intellectual property rights will provide competitive advantages to us; |
| • | our ability to assert our intellectual property rights against potential competitors or to settle current or future disputes will not be limited by our agreements with third parties; |
| • | any of our pending or future patent applications will be issued or have the coverage originally sought; |
| • | our intellectual property rights will be enforced in jurisdictions where legal protection may be weak; |
| • | third parties will not infringe our key intellectual property, and specifically, the Nasiri-Fabrication platform; |
| • | any of the trademarks, copyrights, trade secrets or other intellectual property rights that we presently employ in our business will not lapse or be invalidated, circumvented, challenged or abandoned; or |
| • | we will not lose the ability to assert our intellectual property rights against others. |
In addition, our competitors or others may design around our protected patents or technologies. Effective intellectual property protection may be unavailable or more limited in one or more relevant jurisdictions relative to the protections available in the United States, or may not be applied for in one or more relevant jurisdictions. If we pursue litigation to assert our intellectual property rights, an adverse judicial decision in any of these legal actions could limit our ability to assert our intellectual property rights, limit the value of our technology or otherwise negatively impact our business, financial condition and results of operations.
Monitoring unauthorized use of our intellectual property is difficult and costly. Unauthorized use of our intellectual property may have occurred or may occur in the future. Although we have taken steps to try to minimize the risk of this occurring, any such failure to identify unauthorized use and otherwise adequately protect our intellectual property would adversely affect our business.
25
Table of Contents
Moreover, if we are required to commence litigation, whether as a plaintiff or defendant, not only would this be time-consuming, but we would also be forced to incur significant costs and divert our attention and efforts of our employees, which could, in turn, result in product development delays, lower net revenue and higher expenses and potentially invite counter claims and other legal challenges.
We also rely on customary contractual protections with our customers, suppliers, distributors, employees and consultants, and we implement security measures to protect our trade secrets. We cannot ensure that these contractual protections and security measures will not be breached, that we will have adequate remedies for any such breach or that our suppliers, employees or consultants will not assert rights to intellectual property arising out of such contracts.
We may face claims of intellectual property infringement, which could be time-consuming and costly to defend or settle and, if adversely adjudicated, could result in the loss of significant rights.
The semiconductor and MEMS industries are characterized by companies that hold large numbers of patents and other intellectual property rights and that vigorously pursue, protect and enforce intellectual property rights. One of our competitors has filed a lawsuit asserting that several of our products infringe its patents while a third party has asserted in litigation that our z-axis gyroscope infringes a patent held by it. Another competitor has made generalized assertions of potential infringement and requested that we meet with it to discuss the matter. In the future other third parties may assert against us and our customers and distributors their patent and other intellectual property rights to technologies that are important to our business.
Claims that our products, processes or technology infringe third-party intellectual property rights, regardless of their merit or resolution, could be costly to defend or settle and could divert the efforts and attention of our management and technical personnel. In addition, many of our customer and distributor agreements, including our agreement with our largest customer, require us to indemnify and defend our customers or distributors, as applicable, from third-party infringement claims and pay damages in the case of adverse rulings. Claims of this sort also could harm our relationships with our customers or distributors and might deter future customers from doing business with us. We do not know whether we will prevail in the current proceeding to which we are a party or in any future proceedings given the complex technical issues involved and the inherent uncertainties in intellectual property litigation. If any such proceedings result in an adverse outcome, we could be required to:
| • | cease the manufacture, use or sale of the infringing products, processes or technology; |
| • | pay substantial damages for infringement; |
| • | expend significant resources to develop non-infringing products, processes or technology; |
| • | license technology from the third party claiming infringement, which license may not be available on commercially reasonable terms, or at all; |
| • | cross-license our technology to a competitor to resolve an infringement claim, which could weaken our ability to compete with that competitor; or |
| • | pay substantial damages to our customers or end users to discontinue their use of or to replace infringing technology sold to them with non-infringing technology. |
Any of the foregoing results could have a material adverse effect on our business, financial condition and results of operations.
26
Table of Contents
Due to our limited operating history, we may have difficulty in accurately predicting our future net revenue and appropriately budgeting our expenses.
We began doing business in 2003 and did not begin to generate net revenue until the first quarter of fiscal year 2007. We generated approximately 73% and 31% of our net revenue for fiscal years 2011 and 2012, respectively, from a single customer. As a result, we have only a limited operating history from which to predict future net revenue from multiple customers. This limited operating experience, combined with the rapidly evolving nature of the markets in which we sell our products, substantial uncertainty concerning how these markets may develop and other factors beyond our control, reduces our ability to accurately forecast quarterly or annual net revenue. We are currently expanding our staffing, implementing new internal systems, and increasing our expense levels in anticipation of future growth. If our net revenue does not increase as we expect relative to the growth of our operating expenses, our operating margins could be negatively affected or we could incur significant losses.
We are subject to order and shipment uncertainties, and differences between our estimates of customer demand and actual results could negatively affect our inventory levels, sales and operating results.
Our net revenue is generated on the basis of purchase orders with our customers rather than long-term purchase commitments. In addition, our customers can cancel purchase orders or defer the shipments of our products under certain circumstances. For example, in September 2009, our major customer requested that we delay shipment of products that we had expected to ship pursuant to firm purchase orders to that customer during the third quarter of fiscal year 2010. Our products are manufactured by third-party manufacturers according to our estimates of customer demand, which requires us to make separate demand forecast assumptions for every customer, each of which may introduce significant variability into our aggregate estimates. We have limited visibility into future customer demand and the product mix that our customers will require, which could adversely affect our net revenue forecasts and operating margins. Moreover, because products with motion interface platforms have only recently been introduced into many of our target markets, many of our customers could have difficulty accurately forecasting demand for their products and the timing of their new product introductions, which ultimately affects their demand for our MotionTracking devices.
Historically, because of this limited visibility, at times our actual results have been different from our forecasts of customer demand. Some of these differences have been material, leading to net revenue and margin forecasts different from the results we were actually able to achieve. For example, our major customer reduced its orders for our products below levels we had anticipated during fiscal year 2011. These differences may occur in the future. Conversely, if we were to underestimate customer demand or if sufficient manufacturing capacity were unavailable, we could be unable to take advantage of net revenue opportunities, potentially lose market share and damage our customer relationships and market reputation. In addition, any significant future cancellations or deferrals of product orders could materially and adversely impact our profit margins, increase our inventory write-downs due to product obsolescence and restrict our ability to fund our operations.
We may not sustain our growth rate, and we may not be able to manage any future growth effectively.
We have experienced significant growth in a short period of time. Our net revenue increased from $29.0 million in fiscal year 2009 to $79.6 million, $96.5 million and $153.0 million in fiscal years 2010, 2011 and 2012, respectively. We may not achieve similar growth rates in future periods. Our operating results for any prior quarterly or annual period should not be relied on as an indication of our future operating performance. If we are unable to maintain adequate net revenue growth, our financial results could suffer and our stock price could decline.
To manage our growth successfully and handle the responsibilities of being a public company, we believe we must effectively, among other things:
| • | recruit, hire, train and manage additional qualified engineers for our research and development activities, especially in the positions of design engineering, product and test engineering and applications engineering, as well as adding additional sales personnel; |
27
Table of Contents
| • | implement improvements in our financial, administrative, and operational systems, procedures and controls necessary to support larger manufacturing and sales volumes, a greater number of customers and an increased range of products; and |
| • | enhance our information technology support for enterprise resource planning and design engineering by adapting and expanding our systems and tool capabilities, and properly training new hires as to their use. |
Changes to the leadership or other senior members of our finance organization could result in delays in making improvements to our financial and control systems. If we are unable to manage our growth effectively, we may not be able to take advantage of market opportunities or develop new products, and we may fail to satisfy customer requirements, maintain product quality, execute our business plan or respond to competitive pressures.
If we fail to maintain proper and effective internal controls, our ability to produce accurate financial statements could be impaired, which could adversely affect our operating results, our ability to operate our business and investors’ views of us.
Maintaining adequate internal financial and accounting controls and procedures to help ensure that we can produce accurate financial statements on a timely basis is a costly and time-consuming effort that needs to be re-evaluated frequently. We will be subject to the rules adopted by the Securities and Exchange Commission, or SEC, pursuant to Section 404 of the Sarbanes-Oxley Act, or Section 404, which requires us to include, beginning with our Annual Report on Form 10-K for our fiscal year ending March 31, 2013, our management’s report on and assessment of the effectiveness of our internal controls over financial reporting. In addition, beginning with our fiscal year ending March 31, 2013, our independent registered public accounting firm will be required to attest to and report on the effectiveness of our internal controls over financial reporting. Both we and our independent registered public accounting firm will be testing our internal controls in connection with the Section 404 requirements and could, as part of that documentation and testing, identify areas for further attention or improvement. In the past, we have experienced material weaknesses in our internal control over financial reporting. While we have remediated these material weaknesses, there are no assurances that similar or new material weaknesses will not occur.
Implementing any appropriate changes to our internal controls may require specific compliance training of our directors, officers and employees, entail substantial costs in order to modify our existing accounting systems, and take a significant period of time to complete. Such changes may not, however, be effective in maintaining the adequacy of our internal controls, and any failure to maintain that adequacy, or consequent inability to produce accurate Consolidated Financial Statements and related Notes on a timely basis, could increase our operating costs and could materially impair our ability to operate our business. In addition, investors’ perceptions that our internal controls are inadequate or that we are unable to produce accurate financial statements may adversely affect our stock price.
As part of our ongoing efforts to improve our financial accounting organization and processes, we have hired several senior accounting personnel in the United States. However, we have only recently hired additional senior personnel with SEC reporting experience. Accordingly, we may be unable to effectively manage our public company reporting obligations, which could adversely impact our business and results of operations.
Our primary customer, our sales and support facilities, our testing facilities and our third-party manufacturers are located in regions that are subject to natural disasters, as well as in some cases geopolitical risks and social upheaval.
Currently, our wafer sort, final test and shipping operations, as well as the facilities of our third-party wafer manufacturing and assembly suppliers, are located in Canada, Japan, Singapore, Taiwan and Thailand. Our
28
Table of Contents
largest customer is based in Japan. We have sales and support centers in China, Japan, the Republic of Korea, United Arab Emirates and Taiwan. In addition, our headquarters are located in Northern California. Thailand, Taiwan, the Republic of Korea and Japan are susceptible to earthquakes, tsunamis, typhoons, floods and other natural disasters, and have experienced severe earthquakes, typhoons and floods in recent years that caused significant property damage and loss of life. The Northern California area is also subject to significant risk of earthquakes.
In addition, facilities located in the Republic of Korea, Taiwan, Thailand and China are subject to risks associated with uncertain political, economic and other conditions in Asia, including the outbreak of contagious diseases, such as the H1N1 virus, natural disasters, such as severe flooding in Thailand during the 2011 monsoon season, and political turmoil in the region. In particular, the earthquake and tsunami in Japan has created uncertainties concerning whether overall consumer demand for products that incorporate our devices will be reduced. Although these risks have not materially adversely affected our business, financial condition or results of operations to date, there can be no assurance that such risks will not do so in the future. There also can be no assurance that another earthquake, tsunami or other natural disaster will not occur in the Pacific Rim region, where the risk of such an event is significant due to, among other things, the proximity of major earthquake fault lines in the area. Any such future event could include power outages, fires, flooding or other adverse conditions, as well as disruption or impairment of production capacity and the operations of our manufacturers and customers, which could have a material adverse effect on us. Any disruption resulting from these events could cause significant delays in shipments of our products until we are able to shift our manufacturing, assembly or testing from the affected facilities or contract to another location or third-party vendor. Under such circumstances, there can be no assurance that alternative capacity could be obtained on favorable terms, if at all. Any catastrophic loss to any of our facilities would likely disrupt our operations, delay production, shipments and net revenue and result in significant expenses to repair or replace the facility. In particular, any catastrophic loss at the Sunnyvale, California or Taiwan facilities would materially and adversely affect our business.
Our operating results are subject to substantial quarterly and annual fluctuations due to a number of factors that could adversely affect our business and our stock price.
Our net revenue and operating results have fluctuated in the past and are likely to fluctuate in the future. These fluctuations may occur on a quarterly and on an annual basis and are due to a number of factors, many of which are beyond our control. These factors include, among others:
| • | changes in end-user demand for the products manufactured and sold by our customers; |
| • | the receipt, reduction, cancellation or delay of significant orders by customers; |
| • | the gain or loss of significant customers; |
| • | market acceptance of our products and our customers’ products; |
| • | our ability to develop, introduce and market new products and technologies on a timely basis; |
| • | Delays in our customers’ ability to manufacture and ship products which incorporate our products caused by internal and external factors unrelated to our business and beyond our control; |
| • | new product announcements and introductions by us or our competitors; |
| • | incurrence of research and development and related new product expenditures; |
| • | seasonality or cyclical fluctuations in our markets; |
| • | fluctuations in manufacturing yields; |
| • | significant warranty claims, including those not covered by our suppliers; |
| • | write-downs of inventory for excess quantity and technological obsolescence; |
29
Table of Contents
| • | changes in our product mix or customer mix; |
| • | intellectual property disputes; |
| • | loss of key personnel or the shortage of available skilled workers; |
| • | the effects of competitive pricing pressures, including decreases in average selling prices of our products; and |
| • | in cases where our products are designed into a customers’ product along with components provided by third-party suppliers, disruptions in the supply chains of such third-party suppliers. |
The foregoing factors are difficult to forecast, and these, as well as other factors, could materially adversely affect our quarterly or annual operating results. In addition, a significant amount of our operating expenses are relatively fixed in nature due to our significant sales, research and development costs. Any failure to adjust spending quickly enough to compensate for a net revenue shortfall could magnify its adverse impact on our results of operations.
Our product development efforts are time-consuming and expensive and may not generate an acceptable return, if any.
Our product development efforts require us to incur substantial research and development expense. Our research and development expense was $15.8 million for fiscal year 2011 and $19.7 million for fiscal year 2012, and we anticipate that research and development expense will increase in the future. We may not be able to achieve an acceptable return, if any, on our research and development efforts.
The development of our products is highly complex. We occasionally have experienced delays in completing the development and introduction of new products and product enhancements, and we could experience delays in the future. Unanticipated problems in developing products could also divert substantial engineering resources, which may impair our ability to develop new products and enhancements and could substantially increase our costs. Furthermore, we may expend significant amounts on research and development programs that may not ultimately result in commercially successful products. As a result of these and other factors, we may be unable to develop and introduce new products successfully and in a cost-effective and timely manner, and any new products we develop and offer may never achieve market acceptance. Any failure to successfully develop future products would have a material adverse effect on our business, financial condition and results of operations.
The complexity of our products could result in unforeseen delays or expenses caused by defects or bugs, which could delay the introduction or acceptance of our new products, damage our reputation with current or prospective customers and adversely affect our operating costs.
Our highly complex motion sensing and processing products may contain defects and bugs when they are first introduced or as new versions are released. We have in the past experienced, and may in the future experience, defects and bugs. There may be additional defects and bugs contained in our products that, due to our limited operating history, may not have manifested. If any of our products contains defects or bugs, or has reliability, quality or other problems, we may not be able to successfully correct such problems. Consequently, our reputation may be damaged and customers may be reluctant to buy our products, which could materially and adversely affect our ability to retain existing customers and attract new customers. In addition, these defects or bugs could interrupt or delay sales to our customers. If any of these problems are not found until after we have commenced commercial production of a new product, we may be required to incur additional development costs and product recall, repair or replacement costs. These problems may also result in claims against us by our customers or others. As a result, our operating costs could be adversely affected.
30
Table of Contents
We are subject to warranty and product liability claims and product recalls that may require us to make significant expenditures to defend against these claims or pay damage awards.
From time to time, we may be subject to warranty or product liability claims that may require us to make significant expenditures to defend against these claims or pay damage awards. In the event of a warranty claim, we may also incur costs if we compensate the affected customer. For example, under the terms of our contracts with our larger customers, we are obligated to replace, repair or refund payment for defective products discovered by the customer generally for a period of up to three years after such products are delivered, and we remain responsible and liable for any latent defects caused by reasons attributable to us even after the contractual warranty period has elapsed. We maintain product liability insurance, but this insurance is limited in amount and subject to significant deductibles. There is no guarantee that our insurance will be available or adequate to protect against all such claims. We also may incur costs and expenses if defects in a device we supply make it necessary to recall a customer’s product. The process of identifying a recalled device in products that have been widely distributed may be lengthy and require significant resources, and we may incur significant replacement costs, contract damage claims from our customers and reputational harm. Costs or payments made in connection with warranty and product liability claims and product recalls could have a material adverse effect on our financial condition and results of operations.
Our business, financial condition and results of operations could be adversely affected by the political and economic conditions of the countries in which we conduct business and other factors related to our international operations.
Sales to end customers in Asia accounted for 92% of our net revenue in fiscal year 2012 and 98% of our net revenue for fiscal year 2011. In addition, approximately 40% of our employees are located in Asia, and substantially all of our products are manufactured, assembled or tested in Asia. Multiple factors relating to our international operations and to the particular countries in which we operate could have a material adverse effect on our business, financial condition and results of operations. These factors include:
| • | changes in political, regulatory, legal or economic conditions; |
| • | restrictive governmental actions, such as restrictions on the transfer or repatriation of funds and foreign investments and trade protection measures, including export duties, quotas, customs duties and tariffs; |
| • | disruptions of capital and trading markets; |
| • | changes in import or export licensing requirements; |
| • | transportation delays; |
| • | civil disturbances or political instability; |
| • | geopolitical turmoil, including terrorism, war or political or military coups; |
| • | public health emergencies; |
| • | currency fluctuations relating to our international operating activities; |
| • | differing employment practices and labor standards; |
| • | limitations on our ability under local laws to protect our intellectual property; |
| • | local business and cultural factors that differ from our customary standards and practices; |
| • | nationalization and expropriation; |
| • | changes in tax laws; and |
| • | difficulties in obtaining distribution and support services. |
31
Table of Contents
Substantially all of our products and our end customers’ products are manufactured in Taiwan and China. Any conflict or uncertainty in these countries, including due to public health or safety concerns, could have a material adverse effect on our business, financial condition and results of operations.
We are subject to the cyclical nature of the semiconductor and consumer electronics industries.
The semiconductor and consumer electronics industries are highly cyclical and are characterized by constant and rapid technological change, rapid product obsolescence and price erosion, evolving standards, short product life cycles and wide fluctuations in product supply and demand. These industries experienced a significant downturn as part of the broader global recession in 2008 and 2009. Industry downturns have been characterized by diminished product demand, production overcapacity, high inventory levels and accelerated erosion of average selling prices. The recent downturn and any future downturns could have a material adverse effect on our business and operating results. Furthermore, any upturn in the semiconductor or consumer electronics industries could result in increased competition for access to the third-party foundry and assembly capacity on which we are dependent to manufacture and assemble our products. None of our third-party foundry or assembly contractors has provided assurances that adequate capacity will be available to us in the future.
Our business is subject to seasonality, which causes our net revenue to fluctuate.
In addition to the general cyclicality of the semiconductor and consumer electronics industries, our business is subject to seasonality because of the nature of our target markets. At present, virtually all of our motion interface products are sold in the consumer electronics market. Sales of consumer electronics tend to be weighted towards holiday periods, and many consumer electronics manufacturers typically experience seasonality in sales of their products. Seasonality affects the timing and volume of orders for our products as our customers tend to increase production of their products that incorporate our solutions in the first three quarters of our fiscal year in order to build inventories for the holiday season. Sales of our products tend to correspondingly increase during these quarters and to significantly decrease in the fourth quarter of our fiscal year. For example, our net revenue was $41.2 million for the third quarter of fiscal year 2012 and declined to $33.1 million for the fourth quarter of fiscal year 2012. We expect this seasonality to continue in future periods and, as a result, our operating results are likely to vary significantly from quarter to quarter.
The enactment of legislation implementing changes in U.S. taxation of international business activities or the adoption of other tax reform policies could materially impact our financial position and results of operations.
Tax bills are introduced from time to time to reform U.S. taxation of international business activities. Depending on the final form of legislation enacted, if any, the consequences may be significant for us due to the large scale of our international business activities. If any of these proposals are enacted into legislation, they could have material adverse consequences on the amount of tax we pay and thereby on our financial position and results of operations.
If we do not achieve increased tax benefits as a result of our recently implemented corporate restructuring, our financial condition and operating results could be adversely affected.
We completed a restructuring of our corporate organization during fiscal year 2011 to more closely align our corporate structure with the international nature of our business activities. This corporate restructuring activity has allowed us to reduce our overall effective tax rate through changes in how we develop and use our intellectual property and the structure of our international procurement and sales operations, including by entering into transfer-pricing arrangements that establish transfer prices for our intercompany transactions. We anticipate achieving a reduction in our overall effective tax rate in future periods as well. There can be no assurance that the taxing authorities of the jurisdictions in which we operate or to which we are otherwise deemed to have sufficient tax nexus will not challenge the tax benefits that we expect to realize as a result of the restructuring. In addition, future changes to U.S. or non-U.S. tax laws, including proposed legislation to reform
32
Table of Contents
U.S. taxation of international business activities as described above, would negatively impact the anticipated tax benefits of the proposed restructuring. Any benefits to our tax rate will also depend on our ability to operate our business in a manner consistent with the restructuring of our corporate organization and applicable taxing provisions, including by eliminating the amount of cash distributed to us by our subsidiaries. If the intended tax treatment is not accepted by the applicable taxing authorities, changes in tax law negatively impact the proposed structure or we do not operate our business consistent with the restructuring and applicable tax provisions, we may fail to achieve the financial efficiencies that we anticipate as a result of the restructuring and our future operating results and financial condition may be negatively impacted.
We are exposed to fluctuations in currency exchange rates, which could negatively affect our financial condition and results of operations.
Our sales contracts are primarily denominated in U.S. dollars and therefore substantially all of our net revenue is not subject to foreign currency risk. However, the recent strengthening of the U.S. dollar has increased the real cost of our products to our customers outside of the United States, which could adversely affect our financial condition and results of operations. Some of our operating expenses are incurred outside the United States, are denominated in foreign currency and are subject to fluctuations due to changes in foreign currency exchange rates, particularly changes in the New Taiwan Dollar. We do not currently hedge currency exposures relating to operating expenses incurred outside of the United States, but we may do so in the future. If we do not hedge against these risks, or our attempts to hedge against these risks are not successful, our financial condition and results of operations could be adversely affected.
Our business is subject to various governmental regulations, and compliance with these regulations may cause us to incur significant expenses. If we fail to maintain compliance with applicable regulations, we may be forced to recall products and cease their manufacture and distribution, which could subject us to civil or criminal penalties.
The complex legal and regulatory environment exposes us to compliance and litigation costs and risks that could materially affect our operations and financial results. These laws and regulations may change, sometimes significantly, as a result of political or economic events. They include tax laws and regulations, import and export laws and regulations, government contracting laws and regulations, labor and employment laws and regulations, securities and exchange laws and regulations (and other laws applicable to publicly-traded companies such as the Foreign Corrupt Practices Act), and environmental laws and regulations. In addition, proposed laws and regulations in these and other areas, such as healthcare, could affect the cost of our business operations. Our international operations face political, legal, operational, exchange rate and other risks that we do not face in our domestic operations. We face the risk of discriminatory regulation, nationalization or expropriation of assets, changes in both domestic and foreign laws regarding trade and investment abroad, potential loss of proprietary information due to piracy, misappropriation or laws that may be less protective of our intellectual property rights. Violations of any of these laws and regulations could subject us to criminal or civil enforcement actions, any of which could have a material adverse effect on our business, financial condition or results of operations.
Potential future acquisitions may not generate the results expected and could be difficult to integrate, divert the attention of key personnel, disrupt our business, dilute stockholder value and impair our financial results.
As part of our business strategy, we may pursue acquisitions of companies, technologies and products that we believe could accelerate our ability to compete in our core markets or allow us to enter new markets. If we fail to manage the pursuit, consummation and integration of acquisitions effectively, our business could suffer. In addition, if we fail to properly evaluate acquisitions, we may not achieve the anticipated benefits of any such
33
Table of Contents
acquisitions, and we may incur costs in excess of what we anticipate. Acquisitions involve numerous risks, any of which could harm our business, including:
| • | difficulties in integrating the manufacturing, operations, technologies, products, existing contracts, accounting and personnel of the target company and realizing the anticipated synergies of the combined businesses; |
| • | difficulties in supporting and transitioning customers, if any, of the acquired company; |
| • | diversion of financial and management resources from existing operations; |
| • | the price we pay or other resources that we devote may exceed the value we actually realize, or the value we could have realized if we had allocated the purchase price or other resources to another opportunity or for our existing operations; |
| • | risks associated with entering new markets in which we have limited or no experience; |
| • | potential loss of key employees, customers and strategic alliances from either our current business or the acquired company's business; |
| • | assumption of unanticipated problems or latent liabilities, such as problems with the quality of the acquired company's products; |
| • | inability to generate sufficient revenue and profitability to offset acquisition costs; |
| • | equity-based acquisitions may have a dilutive effect on our stock; and |
| • | inability to successfully consummate transactions with identified acquisition candidates. |
There can be no assurance that any acquisition we might consummate will generate the results we anticipate. Acquisitions also frequently result in the recording of goodwill and other intangible assets that are subject to potential impairments in the future that could harm our financial results.
Risks Related to Ownership of Our Common Stock
The concentration of our capital stock ownership with our executive officers and directors, and their respective affiliates, will limit shareholder ability to influence corporate matters.
Based on share ownership as of April 1, 2012, our executive officers and directors and their affiliates beneficially own or control, directly or indirectly, an aggregate of 43,004,709 shares, or 51.6%, of our common stock (including 2,492,124 shares of common stock subject to outstanding options and warrants exercisable within 60 days of April 1, 2012). In particular, our President, Chief Executive Officer and Chairman, Mr. Nasiri, beneficially owns or controls, directly or indirectly, an aggregate of 9,788,094 shares, or 11.9%, of our outstanding common stock (including 1,654,856 shares of common stock subject to outstanding options and warrants exercisable within 60 days of April 1, 2012). Mr. Nasiri therefore has significant influence over our management and affairs and over all matters requiring stockholder approval, including any change-of-control transaction, such as a merger or other sale of our company or all or substantially all of our assets, for the foreseeable future. This concentrated control limits shareholder ability to influence some corporate matters and could result in some corporate actions that our other stockholders do not view as beneficial, such as failure to approve change of control transactions that could offer holders of our common stock a premium over the market value of our company. As a result, the market price of our common stock could be adversely affected.
Our stock price has been and will likely continue to be volatile, and shareholders may not be able to resell shares of our common stock at or above the price they originally paid.
The trading price of our common stock has been and will likely continue to be highly volatile and could be subject to wide fluctuations in price in response to various factors, some of which are beyond our control. Since shares of our common stock were sold in our initial public offering in November 2011 at a price of $7.50 per share, our stock price has ranged up to $22.35 through April 1, 2012. In addition to the factors discussed in
34
Table of Contents
this “Risk Factors” section and elsewhere in this Annual Report on Form 10-K, factors that may cause volatility in our share price include:
| • | our small public float relative to the total number of shares of common stock that are issued and outstanding; |
| • | sales of common stock by us or our stockholders; |
| • | share price and volume fluctuations attributable to inconsistent trading volume levels of our shares; |
| • | the expiration of the contractual lock-up and market stand-off agreements; |
| • | quarterly variations in our results of operations, those of our competitors or those of Nintendo, our largest customer; |
| • | announcements by us or our competitors of acquisitions, design wins, new solutions, significant contracts, commercial relationships or capital commitments; |
| • | general economic conditions and slow or negative growth of related markets; |
| • | our ability to develop and market new and enhanced solutions on a timely basis; |
| • | disruption to our operations; |
| • | the emergence of new sales channels in which we are unable to compete effectively; |
| • | any major change in our board of directors or management; |
| • | changes in financial estimates including our ability to meet our future net revenue and operating profit or loss projections; |
| • | changes in governmental regulations or in the status of our regulatory approvals; |
| • | commencement of, or our involvement in, litigation; and |
| • | changes in earnings estimates or recommendations by securities analysts. |
In addition, the stock market in general, and the market for semiconductor and other technology companies in particular, have from time to time experienced extreme price and volume fluctuations that have often been unrelated or disproportionate to the operating performance of those companies. These broad market and industry factors may seriously harm the market price of our common stock, regardless of our actual operating performance. These trading price fluctuations may also make it more difficult for us to use our common stock as a means to make acquisitions or to use equity-related compensation to attract and retain employees. In addition, in the past, following periods of volatility in the overall market and the market price of a company’s securities, securities class action litigation has often been instituted against these companies. This type of litigation, if instituted against us, could result in substantial costs and a diversion of our management’s attention and resources.
Substantial future sales of our common stock in the public market could cause our stock price to fall.
Sales of substantial amounts of our common stock in the public market, or the perception that such sales could occur, could adversely affect the market price of our common stock. As of June 5, 2012, we had approximately 81.4 million shares of common stock outstanding, of which approximately 11.8 million shares became eligible for sale in the public market after the expiration of lock-up agreements on May 21, 2012, and an additional 49.9 million shares became eligible for sale in the public market on June 4, 2012 after the expiration of additional lock-up agreements executed in connection with our public offering conducted in March 2012. Sale of these shares are subject in some cases to volume and manner of sale restriction of Rule 144 of the Securities Act. Sales of a substantial number of such shares after this expiration, or the perception that such sales may occur could cause our share price to fall. In addition, in November 2011, we filed a Form S-8 under the Securities Act to register 20,685,382 shares of our common stock for issuance under our equity incentive plans. These shares may be sold in the public market upon issuance and once vested.
35
Table of Contents
Because we have no plans to pay dividends on our common stock, investors must look solely to stock appreciation for a return on their investment in us.
We have never declared or paid any cash dividends on our capital stock, and we do not anticipate paying any cash dividends on our common stock in the foreseeable future. We currently intend to retain all future earnings to fund the development and growth of our business. Any payment of future dividends will be at the discretion of our board of directors and will depend on, among other things, our earnings, financial condition, capital requirements, level of indebtedness, statutory and contractual restrictions applying to the payment of dividends and other considerations that the board of directors deems relevant. Investors must rely on sales of their common stock after price appreciation, which may never occur, as the only way to realize a return on their investment. Investors seeking cash dividends should not purchase our common stock.
We will continue to incur increased costs as a result of being a public company.
As a newly public company, we continue to incur significant legal, accounting and other expenses that we did not incur as a private company, including costs related to compliance with SEC and the rules of the New York Stock Exchange, the Sarbanes-Oxley Act and other corporate governance requirements. We expect continued compliance with these requirements to increase our legal and financial costs and make some activities more time-consuming and costly. We also expect that these new rules and regulations may make it more difficult and expensive for us to obtain director and officer liability insurance, and we may be required to accept reduced policy limits and coverage or incur substantially higher costs to obtain the same or similar coverage. As a result, it may be more difficult for us to attract and retain qualified individuals to serve on our board of directors or as executive officers. We are currently evaluating and monitoring developments with respect to these rules, and we cannot predict or estimate the amount of additional costs we may incur or the timing of such costs.
Provisions in our charter documents and under Delaware law could discourage a takeover that stockholders may consider favorable.
Provisions in our certificate of incorporation and bylaws, as amended and restated, may have the effect of delaying or preventing a change of control or changes in our management. These provisions include the following:
| • | the right of our board of directors to elect directors to fill a vacancy created by the expansion of our board of directors or the resignation, death or removal of a director, which prevents stockholders from being able to fill vacancies on our board of directors; |
| • | the establishment of a classified board of directors requiring that only a subset of the members of our board of directors be elected at each annual meeting of stockholders; |
| • | the prohibition of cumulative voting in our election of directors, which would otherwise allow less than a majority of stockholders to elect director candidates; |
| • | the requirement that stockholders provide advance notice to nominate individuals for election to our board of directors or to propose matters that can be acted upon at a stockholders’ meeting. These provisions may discourage or deter a potential acquirer from conducting a solicitation of proxies to elect the acquirer’s own slate of directors or otherwise attempting to obtain control of our company; |
| • | the ability of our board of directors to issue, without stockholder approval, shares of undesignated preferred stock with terms set by the board of directors, which rights could be senior to those of our common stock. The ability to authorize undesignated preferred stock makes it possible for our board of directors to issue preferred stock with voting or other rights or preferences that could impede the success of any attempt to acquire us; |
| • | the required approval of the holders of at least two-thirds of the shares entitled to vote at an election of directors to repeal or adopt any provision of our certificate of incorporation regarding the election of directors; |
36
Table of Contents
| • | the required approval of the holders of at least 80% of such shares to amend or repeal the provisions of our bylaws regarding the election and classification of directors; and |
| • | the required approval of the holders of at least a majority of the shares entitled to vote at an election of directors to remove directors without cause. |
As a Delaware corporation, we are also subject to certain Delaware anti-takeover provisions. Under Delaware law, a corporation may not engage in a business combination with any holder of 15% or more of its capital stock unless the holder has held the stock for three years or, among other things, the board of directors has approved the transaction. Our board of directors could rely on Delaware law to prevent or delay an acquisition of us.
Item 1B. Unresolved Staff Comments.
None.
Our corporate headquarters are located at 1197 Borregas Avenue in Sunnyvale, California in a facility consisting of approximately 51,000 square feet of office space under a lease that expires in January 2013. This facility accommodates our product design, software engineering, sales, marketing, operations, finance, and administrative activities. We plan to extend the lease for this facility or relocate to an alternative facility. We also occupy space in Hsinchu, Taiwan, consisting of approximately 27,000 square feet under a lease that expires in December 2014, which serves as our wafer-sort and testing facility. We also lease sales and support offices in China, Japan, the Republic of Korea, and the United Arab Emirates. We currently do not own any real estate or facilities. We believe that our leased facilities are adequate to meet our current needs and expect to be able to lease additional or alternative facilities to meet our future needs.
Information with respect to this item may be found in “Legal Proceedings” in Item 1, “Business,” included in this Annual Report on Form 10-K, which information is incorporated herein by reference.
Item 4. Mine Safety Disclosures.
Not applicable.
37
Table of Contents
Item 5. Market for Registrant's Common Equity, Related Stockholder Matters and Issuer Purchases of Equity Securities.
Market Information
Our common stock has been listed on the New York Stock Exchange (“NYSE”) under the symbol “INVN” since November 16, 2011. Prior to that date, there was no public trading market for our common stock. The following table sets forth for the periods indicated the high and low sales prices per share of our common stock as reported on the NYSE:
| High | Low | |||||||
| Year Ending April 1, 2012: |
||||||||
| Third Quarter (from November 16, 2011) |
$ | 11.85 | $ | 8.25 | ||||
| Fourth Quarter |
$ | 22.35 | $ | 9.79 | ||||
As of April 1, 2012, we had approximately 153 holders of record of our common stock. The actual number of stockholders is greater than this number of record holders, and includes stockholders who are beneficial owners, but whose shares are held in street name by brokers and other nominees. This number of holders of record also does not include stockholders whose shares may be held in trust by other entities.
Dividend Policy
We have never declared or paid any cash dividends on our capital stock. We currently anticipate that we will retain all of our future earnings for use in the expansion and operation of our business and do not anticipate paying any cash dividends in the foreseeable future. Any future determination to declare cash dividends will be made at the discretion of our board of directors, subject to applicable law, and will depend on our financial condition, results of operations, capital requirements, general business conditions and other factors that our board of directors may deem relevant.
Equity Compensation Plan Information
For equity compensation plan information refer to Item 12 in Part III of this Annual Report on Form 10-K. Such information will be included in our Proxy Statement, which is incorporated herein by reference.
38
Table of Contents
Performance Graph
This performance graph shall not be deemed “soliciting material” or to be “filed” with the Securities and Exchange Commission for purposes of Section 18 of the Securities Exchange Act of 1934, as amended, or the Exchange Act, or otherwise subject to the liabilities under that Section, and shall not be deemed to be incorporated by reference into any filing of InvenSense Inc. under the Securities Act of 1933, as amended, or the Exchange Act.
The following graph shows a comparison from November 16, 2011 (the date our common stock commenced trading on the NYSE) through April 1, 2012 of the cumulative total return for our common stock, the S&P 500 Index and the NYSE Composite Index. Such returns are based on historical results and are not intended to suggest future performance. Data for the S&P 500 Index and the NYSE Composite Index assume reinvestment of dividends.
InvenSense Inc.
Total Return Performance
InvenSense Inc., S&P 500 Composite Index and the NYSE Composite Index
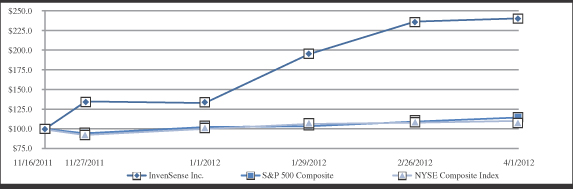
| Period Ending | ||||||||||||||||||||||||
| 11/16/2011 | 11/27/2011 | 1/1/2012 | 1/29/2012 | 2/26/2012 | 4/1/2012 | |||||||||||||||||||
| InvenSense Inc. |
100.0 | 135.0 | 133.0 | 194.0 | 237.0 | 241.0 | ||||||||||||||||||
| S&P 500 Composite Index |
100.0 | 94.0 | 102.0 | 106.0 | 110.0 | 114.0 | ||||||||||||||||||
| NYSE Composite Index |
100.0 | 93.0 | 101.0 | 107.0 | 110.0 | 111.0 | ||||||||||||||||||
Item 6. Selected Financial Data.
We have derived the selected consolidated statement of operations data for the fiscal years ended 2012, 2011 and 2010, respectively, and selected consolidated balance sheet data as of the April 1, 2012 and April 3, 2011, from our audited Consolidated Financial Statements and related Notes included elsewhere in this Annual Report on Form 10-K. We have derived the statement of operations data for the fiscal years prior to fiscal year 2010, and selected consolidated balance sheet data prior to April 3, 2011, from our audited Consolidated Financial Statements and related Notes not included in this Annual Report on Form 10-K. Our historical results are not necessarily indicative of the results that may be expected for any future period. The following selected financial data should be read in conjunction with “Management’s Discussion and Analysis of Financial Condition and Results of Operations” and our Consolidated Financial Statements and the related Notes included elsewhere in this Annual Report on Form 10-K.
39
Table of Contents
Consolidated Statement of Operations Data:
| Fiscal Years | ||||||||||||||||||||
| 2012 | 2011 | 2010 | 2009 | 2008 | ||||||||||||||||
| (in thousands, except per share data) | ||||||||||||||||||||
| Net revenue |
$ | 152,967 | $ | 96,547 | $ | 79,556 | $ | 29,025 | $ | 7,778 | ||||||||||
| Cost of revenue(1) |
67,571 | 43,647 | 36,073 | 15,548 | 6,867 | |||||||||||||||
|
|
|
|
|
|
|
|
|
|
|
|||||||||||
| Gross profit |
85,396 | 52,900 | 43,483 | 13,477 | 911 | |||||||||||||||
| Operating expenses: |
||||||||||||||||||||
| Research and development(1) |
19,672 | 15,826 | 13,085 | 8,545 | 4,732 | |||||||||||||||
| Selling, general and administrative(1) |
18,710 | 15,596 | 8,427 | 4,632 | 2,878 | |||||||||||||||
| Total operating expenses |
38,382 | 31,422 | 21,512 | 13,177 | 7,610 | |||||||||||||||
| (Loss) income from operations |
47,014 | 21,478 | 21,971 | 300 | (6,699 | ) | ||||||||||||||
| Other income (expense): |
||||||||||||||||||||
| Change in fair value of warrant liabilities(2) |
— | (4,025 | ) | (6,363 | ) | — | (101 | ) | ||||||||||||
| Other income (expense), net |
138 | 31 | (67 | ) | (66 | ) | (60 | ) | ||||||||||||
|
|
|
|
|
|
|
|
|
|
|
|||||||||||
| Other income (expense) - net |
138 | (3,994 | ) | (6,430 | ) | (66 | ) | (161 | ) | |||||||||||
| (Loss) income before income taxes |
47,152 | 17,484 | 15,541 | 234 | (6,860 | ) | ||||||||||||||
| Income tax provision |
10,205 | 8,137 | 399 | 38 | — | |||||||||||||||
|
|
|
|
|
|
|
|
|
|
|
|||||||||||
| Net (loss) income(3) |
36,947 | 9,347 | 15,142 | 196 | (6,860 | ) | ||||||||||||||
| Net income allocable to convertible preferred stockholders(3) |
20,618 | 7,716 | 12,150 | 196 | 18 | |||||||||||||||
|
|
|
|
|
|
|
|
|
|
|
|||||||||||
| Net (loss) income allocable to common stockholders(3) |
$ | 16,329 | $ | 1,631 | $ | 2,992 | $ | — | $ | (6,878 | ) | |||||||||
|
|
|
|
|
|
|
|
|
|
|
|||||||||||
| Net (loss) income per common share allocable to common stockholders: |
||||||||||||||||||||
| Basic |
$ | 0.39 | $ | 0.09 | $ | 0.18 | $ | — | $ | (0.56 | ) | |||||||||
|
|
|
|
|
|
|
|
|
|
|
|||||||||||
| Diluted |
$ | 0.37 | $ | 0.08 | $ | 0.17 | $ | — | $ | (0.56 | ) | |||||||||
|
|
|
|
|
|
|
|
|
|
|
|||||||||||
| Weighted average shares outstanding in computing net (loss) income per share allocable to common stockholders: |
||||||||||||||||||||
| Basic |
41,614 | 17,592 | 16,542 | 15,430 | 12,321 | |||||||||||||||
|
|
|
|
|
|
|
|
|
|
|
|||||||||||
| Diluted |
47,011 | 22,202 | 20,867 | 17,519 | 12,321 | |||||||||||||||
|
|
|
|
|
|
|
|
|
|
|
|||||||||||
| (1) | Includes stock-based compensation expense attributable to employees and non-employees as follows: |
| Fiscal Years | ||||||||||||||||||||
| 2012 | 2011 | 2010 | 2009 | 2008 | ||||||||||||||||
| (in thousands) | ||||||||||||||||||||
| Cost of revenue |
$ | 325 | $ | 261 | $ | 233 | $ | 68 | $ | 41 | ||||||||||
| Research and development |
1,474 | 946 | 536 | 184 | 125 | |||||||||||||||
| Selling, general and administrative |
1,889 | 983 | 537 | 258 | 89 | |||||||||||||||
|
|
|
|
|
|
|
|
|
|
|
|||||||||||
| Total stock-based compensation expense |
$ | 3,688 | $ | 2,190 | $ | 1,306 | $ | 510 | $ | 255 | ||||||||||
|
|
|
|
|
|
|
|
|
|
|
|||||||||||
| (2) | Refers to the change in fair value of our warrants as required by ASC 815-40-15. Please see Note 6 to our Consolidated Financial Statements for an additional explanation of the change in fair value of warrant liabilities. |
| (3) | Please see Note 1 to our Consolidated Financial Statements for an explanation of the method used to calculate net income allocable to convertible preferred stockholders and net (loss) income allocable to common stockholders, including the method to calculate the number of shares used in the computation of the per share amounts. |
Consolidated Balance Sheet Data:
| As of | ||||||||||||||||||||
| April 1, 2012 |
April 3, 2011 |
March 28, 2010 |
March 28, 2009 |
March 30, 2008 |
||||||||||||||||
| (in thousands) | ||||||||||||||||||||
| Cash and cash equivalents |
$ | 153,643 | $ | 28,795 | $ | 22,394 | $ | 19,946 | $ | 8,649 | ||||||||||
| Short-term investments |
4,129 | 9,280 | 12,875 | — | — | |||||||||||||||
| Long-term investments |
— | — | 2,008 | — | — | |||||||||||||||
| Working capital |
172,931 | 54,285 | 36,873 | 20,946 | 7,540 | |||||||||||||||
| Total assets |
193,318 | 70,746 | 54,450 | 34,545 | 12,874 | |||||||||||||||
| Preferred stock warrant liability |
— | — | 7,852 | — | — | |||||||||||||||
| Total debt, including current portion |
50 | 34 | 349 | 1,107 | 2,676 | |||||||||||||||
| Convertible preferred stock |
— | 50,241 | 38,364 | 39,192 | 28,370 | |||||||||||||||
| Common stock |
136,792 | 5,762 | 2,855 | 1,250 | 616 | |||||||||||||||
| Total stockholders’ equity |
176,877 | 59,141 | 35,000 | 19,751 | 8,099 | |||||||||||||||
40
Table of Contents
Item 7. Management's Discussion and Analysis of Financial Condition and Results of Operations.
The following discussion and analysis of our financial condition and results of operations should be read in conjunction with the Consolidated Financial Statements for the year ended April 1, 2012 and the Notes to those statements included elsewhere in this Annual Report on Form 10-K.
Business Overview
We are the pioneer and a global market leader in motion interface devices that detect and track an object’s motion in three-dimensional space. Our MotionTracking devices combine micro-electro-mechanical system, or MEMS, based motion sensors, such as accelerometers and gyroscopes, with mixed-signal integrated circuits (ICs) and proprietary algorithms and firmware that intelligently calibrate, process and synthesize sensor output for use by software applications via an application programming interface (API). Our MotionTracking devices are differentiated by small form factor, high level of integration, performance, reliability and cost effectiveness. While our solutions have broad applicability, we currently target consumer electronics applications such as smartphones and tablets, console and portable video gaming devices, digital still and video cameras, smart TVs (including digital set-top boxes, televisions and multi-media HDDs), 3D mice, navigation devices, toys, and health and fitness accessories. We utilize a fabless model, leveraging current CMOS and MEMS foundries and semiconductor packaging supply chains.
Our current strategy is to continue targeting the consumer electronics market with integrated MotionTracking devices that meet or exceed the performance and cost requirements of consumer electronics manufacturers, are easy to integrate and set industry performance benchmarks. Our ability to secure new customers depends on winning competitive processes, known as design wins. These selection processes are typically lengthy, and, as a result, our sales cycles will vary based on the market served, whether the design win is with an existing or a new customer and whether our product being designed into our customer’s device is a first generation or subsequent generation product. Because the sales cycle for our products is long, we can incur design and development support expenditures in circumstances where we do not ultimately recognize any net revenue. We do not receive long-term purchase commitments from any of our customers, all of whom purchase our products on a purchase order basis. While product life cycles in our target market vary by application, once one of our solutions is incorporated into a customer’s design, we believe that our solution is likely to remain a component of the customer’s product for its life cycle because of the time and expense associated with redesigning the product or substituting an alternative solution. The trend is also supported by the increased likelihood that once a customer introduces one of our products into one of their devices, we believe they are likely to introduce it into others. Additionally, once a customer introduces one of our lower functionality sensors into their platforms, we believe they are more likely to adopt our more advanced integrated MotionTracking devices.
The history of our product development and sales and marketing efforts is, on a calendar year basis, as follows:
| • | From our inception in 2003 through 2005, we were primarily engaged in the design and development of our analog gyroscopes. In this period, we also developed and refined our fabrication process, which we refer to as the Nasiri-Fabrication platform. |
| • | In 2006, we began volume shipments of our IDG family of integrated X-Y dual-axis analog gyroscopes for the compact digital camera market, the first commercially available sensors of that type. Subsequently, through 2008, we developed and shipped successive generations of these gyroscopes with enhanced performance and reduced die sizes. We began high-volume shipments of our IDG-600 to Nintendo beginning in May 2008. |
| • | In 2009, we began shipping enhanced and alternative versions of our single- and dual-axis analog gyroscopes as well as our ITG family of X-Y-Z three-axis digital output gyroscopes. We also significantly accelerated shipments of our products due to the broad market adoption of the Nintendo |
41
Table of Contents
| Wii MotionPlus accessory. In addition, we migrated our manufacturing processes to larger wafer sizes enabling significant cost efficiencies. |
| • | In 2010, we began volume shipments of our MPU-3000 family of motion processors with digital output, three-axis gyroscopes, and software development kits, designed to enable faster motion interface application development. In addition, we started shipping our ITG- and IMU-3000 family of products, which address a broader array of consumer applications than our analog products. We also started sampling our MPU-6000 family of integrated six-axis MotionProcessors that integrate a three-axis gyroscope and three-axis accelerometer on one chip with our MotionApps platform. |
| • | In 2011, we began high-volume shipments of our ITG/IMU/MPU-3000 family of motion processors for the portable gaming, smart TV, smartphone and tablet markets. In addition, we began volume shipments of our MPU-6000 family of six-axis motion processors for the smartphone and tablet markets. We also introduced our IDG-2020 and IXZ-2020 families of dual-axis gyroscopes, which address the need for optical image stabilization (OIS) technology in camera phones and which are available for sampling to selected customers. |
| • | In January 2012, we introduced our nine-axis MPU-9150 motion processor, which is available for sampling to selected customers and is targeted for the smartphone, tablet, gaming controller and wearable sensor markets. |
Our net revenue increased to $153.0 million in fiscal year 2012 from $96.5 million in fiscal year 2011 and $79.6 million in fiscal year 2010, respectively. At April 1, 2012, we had $157.8 million in cash, cash equivalents and short-term investments. We achieved positive operating cash flow of $44.4 million for fiscal year 2012 compared to $7.9 million for fiscal year 2011. We achieved net income of $36.9 million, $9.3 million, and $15.1 million in fiscal years 2012, 2011 and 2010, respectively.
At April 2012, five customers accounted for 18%, 17%, 13%, 12% and 10% of total accounts receivable. At April 3, 2011, three customers accounted for 43%, 16% and 16% of total accounts receivable. No other customers accounted for more than 10% of total accounts receivable at April 2012 or April 2011.
For fiscal year 2012 three customers accounted for 31%, 15% and 12% of total net revenue. For fiscal years 2011and 2010, one customer accounted for 73% and 85% of total net revenue, respectively. No other customers accounted for more than 10% of total net revenue for fiscal years 2012, 2011 or 2010.
Basis of Presentation
Net Revenue
We derive our net revenue from sales of our MotionTracking devices. We primarily sell our products through our worldwide sales organization directly to manufacturers of consumer electronics devices. To date, a significant majority of our net revenue has been derived from these direct sales, and we expect this trend to continue for the foreseeable future. We also sell our products through an indirect channel of distributors that fulfill orders for our products from manufacturers of consumer electronics devices, original design manufacturers and contract manufacturers.
We primarily sell our products directly to customers and distributors in Asia, which constituted 92% of our net revenue in fiscal year 2012 compared with 98% of our net revenue in fiscal year 2011 and 99% of our net revenue for the fiscal year 2010. For fiscal years 2012, 2011 and 2010, we derived $141.0 million, $95.7 million and $79.1 million of net revenue, respectively, from customers in foreign countries and we derived $12.0 million, $0.8 million and $0.5 million, respectively, of net revenue from customers in the United States. For additional information about net revenue by geographic region, refer to Note 1 to our Consolidated Financial Statements included in this Annual Report on Form 10-K.
42
Table of Contents
We believe that a substantial majority of our net revenue will continue to come from sales to customers located in Asia, where most of the manufacturers of consumer electronics devices that use and may in the future use our products are located. As a result of this regional customer concentration, we may be subject to economic and political events and other developments that impact our customers in Asia. For more information, see the section titled “Risk Factors—Our business, financial condition and results of operations could be adversely affected by the political and economic conditions of the countries in which we conduct business.”
Gross Profit
Gross profit is the difference between net revenue and the cost of revenue. Cost of revenue primarily consists of manufacturing, packaging, assembly and testing costs for our products, shipping costs, costs of personnel, including stock-based compensation, warranty costs and write-downs for excess and obsolete inventory.
We price our products based on market and competitive conditions and periodically reduce the price of our products as market and competitive conditions change. Typically we experience price decreases over the life cycle of our products, which may vary by market and customer. As a result, if we are not able to decrease the cost of our products in line with the price decreases of our products, we may experience a reduction in our gross profit and gross margin. Gross margin has been and will continue to be affected by a variety of factors, including:
| • | demand for our products and services; |
| • | product manufacturing yields; |
| • | write-downs of inventory for excess quantity and technological obsolescence; |
| • | product mix; |
| • | erosion of average selling prices, as required by agreements entered into with our customers and in anticipation of competitive pricing pressures, new product introductions by us and our competitors, product end of life programs, and for other reasons; |
| • | the proportion of our products that are sold through direct versus indirect channels; |
| • | our ability to attain volume manufacturing pricing from our foundry partners and suppliers; and |
| • | growth in our headcount and other related costs incurred in our organization. |
Research and Development
Research and development expense primarily consists of personnel related expenses (including stock based compensation), intellectual property license costs, reference design development costs, development testing and evaluation costs, depreciation expense and allocated occupancy costs. Research and development activities include the design of new products, refinement of existing products and processes and design of test methodologies, including hardware and software to ensure compliance with required specifications. All research and development costs are expensed as incurred. We expect our research and development expenses to increase on an absolute basis as we continue to expand our product offerings and enhance existing products.
Selling, General and Administrative
Selling, general and administrative expense primarily consists of personnel related expenses (including stock based compensation), sales commissions, field application engineering support, travel costs, professional and consulting fees, legal fees, depreciation expense and allocated occupancy costs. We expect selling, general and administrative expenses to increase on an absolute basis in the future as we expand our sales, marketing, finance and administrative personnel, and we incur additional expenses associated with operating as a public company.
43
Table of Contents
Change in Fair Value of Warrant Liabilities
Change in fair value of warrant liabilities includes the changes in the fair value of our warrants as required by ASC 815-40-15. See “Critical Accounting Policies and Estimates—Financial Instruments with Characteristics of Both Liabilities and Equity”.
Income Tax Provision
The provision for income taxes consists of our estimated Federal, State and foreign income taxes based on our pre-tax income. Our provision differs from the federal statutory rate primarily due to expenses that are not deductible for income taxes such as the changes in fair value of our warrant liability and certain stock-based compensation, research and development credits, state income taxes, foreign tax rate differentials, in fiscal year 2010, the reversal of our deferred income tax valuation allowance and an expected lower effective tax rate subsequent to the implementation of our international structure in fiscal year 2011.
Results of Operations
The following table sets forth certain consolidated statement of income data as a percentage of net revenue for the periods indicated.
| Fiscal Year | ||||||||||||
| 2012 | 2011 | 2010 | ||||||||||
| Net revenue |
100 | % | 100 | % | 100 | % | ||||||
| Cost of revenue |
44 | 45 | 45 | |||||||||
|
|
|
|
|
|
|
|||||||
| Gross profit |
56 | 55 | 55 | |||||||||
|
|
|
|
|
|
|
|||||||
| Operating expenses: |
||||||||||||
| Research and development |
13 | 16 | 16 | |||||||||
| Selling, general and administrative |
12 | 16 | 11 | |||||||||
|
|
|
|
|
|
|
|||||||
| Total operating expenses |
25 | 33 | 27 | |||||||||
|
|
|
|
|
|
|
|||||||
| Income from operations |
31 | 22 | 28 | |||||||||
| Change in fair value of warrant liabilities |
— | (4 | ) | (8 | ) | |||||||
| Other income (expense), net |
— | — | — | |||||||||
|
|
|
|
|
|
|
|||||||
| Income before income taxes |
31 | 18 | 20 | |||||||||
| Income tax provision |
7 | 8 | 1 | |||||||||
|
|
|
|
|
|
|
|||||||
| Net income |
24 | % | 10 | % | 19 | % | ||||||
|
|
|
|
|
|
|
|||||||
Comparison of Fiscal Years 2012, 2011 and 2010
| Fiscal Year | ||||||
| 2012 | 2011 | 2010 | ||||
| (in thousands) | ||||||
| Net revenue |
$ 152,967 | $ 96,547 | $ 79,556 | |||
Net revenue for fiscal year 2012 increased by $56.4 million, or 58%, year-over-year, primarily due to higher volume shipments to an expanded customer base, including manufacturers of smartphones, tablet devices and digital television and set-top box remote controls. Total unit shipments for fiscal year 2012 increased by 83% year-over-year. Our overall average unit selling price for fiscal year 2012 decreased by approximately 13% year-over-year as a result of the change in our product mix and declines in average selling prices associated with products primarily introduced in prior years. We expect that average selling prices associated with new 6-axis MotionTracking products will be higher than current prices on mature products.
Net revenue for fiscal year 2011 increased by $17.0 million, or 21%, year-over-year, primarily due to a change in our product mix as we began to ship higher volumes of our more advanced products. Total unit shipments increased by 34% year-over-year, while the overall average unit selling price of our products declined
44
Table of Contents
less than 10%. The percentage increase in revenues was primarily attributable to the expansion of our customer base to include manufacturers of smartphones, tablet devices and digital television and set-top box remote controls. Net revenue from our largest customer increased by 4% year-over-year, reflecting a change in the product mix sold to them in connection with their introduction of a new product.
Cost of Revenue and Gross Profit
| Fiscal Year | ||||||||||||
| 2012 | 2011 | 2010 | ||||||||||
| (in thousands) | ||||||||||||
| Cost of revenue |
$ | 67,571 | $ | 43,647 | $ | 36,073 | ||||||
| % of net revenue |
44 | % | 45 | % | 45 | % | ||||||
| Gross profit |
$ | 85,396 | $ | 52,900 | $ | 43,483 | ||||||
| % of net revenue |
56 | % | 55 | % | 55 | % | ||||||
Gross profit for the fiscal year 2012 increased by $32.5 million, or 61%, year-over-year, due to higher volume shipments of our products to an expanded customer base, including manufacturers of smartphones, tablet devices and digital television and set-top box remote controls, year-over-year improvements in our production yields and efficiency, and lower warranty costs in Fiscal year 2012. Gross profit as a percentage of sales, or gross margin, also increased due to improvements in our production yields and efficiency, partially offset by a write-down of inventory related to excess and obsolete material for fiscal year 2012 of $2.2 million. We expect gross margins to fluctuate in future periods due to changes in product mix, average unit selling prices, manufacturing costs and inventory write-downs.
Gross profit for fiscal year 2011 increased by $9.4 million, or 22%, year-over-year, due to the 34% increase in unit shipments of our products, primarily driven by increased sales to manufacturers of smartphones, tablet devices, and digital television and set-top box remote controls, continued improvements in our production yields and efficiency, and the release of our latest generation products.
Research and Development
| Fiscal Year | ||||||||||||
| 2012 | 2011 | 2010 | ||||||||||
| (in thousands) | ||||||||||||
| Research and development |
$ | 19,672 | $ | 15,826 | $ | 13,085 | ||||||
| % of net revenue |
13 | % | 16 | % | 16 | % | ||||||
Research and development expense for fiscal year 2012 increased by $3.8 million, or 24%, year-over-year. The increase was primarily attributable to increased personnel costs, mask and foundry expenses and outside service cost of $2.6 million, $0.9 million and $0.5 million respectively. Research and development headcount was 109 at the end of fiscal year 2012 and 83 at the end of fiscal year 2011.
Research and development expense for fiscal year 2011 increased by $2.7 million, or 21%, year-over-year. The increase was primarily attributable to the growth of our research and development organization to support expanding product development initiatives. Research and development headcount increased to 83 from 67 year-over-year, resulting in a year-over-year increase in personnel costs of $3.5 million. The majority of headcount growth in fiscal year 2010 occurred in the second half of that fiscal year, which resulted in a relatively higher expense in fiscal year 2011 because those new employees were employed for the entirety of fiscal year 2011. This increase in research and development expense was partially offset by lower costs related to engineering materials and outside services expenses.
45
Table of Contents
Selling, General and Administrative
| Fiscal Year | ||||||||||||
| 2012 | 2011 | 2010 | ||||||||||
| (in thousands) | ||||||||||||
| Selling, general and administrative |
$ | 18,710 | $ | 15,596 | $ | 8,427 | ||||||
| % of net revenue |
12 | % | 16 | % | 11 | % | ||||||
Selling, general and administrative expense for fiscal year 2012 increased by $3.1 million, or 20%, year-over-year. The increase was primarily attributable to increased personnel costs of $3.3 million and increased facilities and infrastructure cost of $0.5 million, partially offset by the write-off of deferred offering costs of $1.4 million in the third quarter of 2011. Selling, general and administrative headcount increased to 88 at the end of fiscal year 2012 from 71 year-over-year.
Selling, general and administrative expense for fiscal year 2011 increased $7.2 million, or 85%, year-over-year, primarily as a result of expenses associated with the need to support the increased demand for our products, including expansion of our global sales operations, and increased expenses related to establishing an organizational infrastructure to support a public reporting company. Selling, general and administrative headcount increased to 71 from 51 year-over-year, resulting in a year-over-year increase in personnel costs of $3.5 million. The majority of headcount growth in fiscal year 2010 occurred in the second half of that fiscal year, which resulted in a relatively higher expense in fiscal year 2011 because those new employees were employed for the entirety of fiscal year 2011. Additionally, in fiscal year 2011, we expensed $1.4 million in deferred offering costs.
Income From Operations
| Fiscal Year | ||||||||||||
| 2012 | 2011 | 2010 | ||||||||||
| (in thousands) | ||||||||||||
| Income from operations |
$ | 47,014 | $ | 21,478 | $ | 21,971 | ||||||
| % of net revenue |
31 | % | 22 | % | 28 | % | ||||||
Income from operations for fiscal year 2012 increased by $25.5 million, or 119%, year-over-year, primarily due to increased unit shipments, increased gross profit and lower operating expenses as a percentage of sales.
Income from operations for fiscal year 2011 decreased by $0.5 million, or 2%, year-over-year, primarily due to increased research and development expense due to increased headcount and increased selling, general and administrative expense associated with the need to support increased demand for our products as well as a write-off of $1.4 million of costs associated with our initial public offering.
Other Income (Expense), Net
| Fiscal Year | ||||||||||||||||
| 2012 | 2011 | 2010 | ||||||||||||||
| (in thousands) | ||||||||||||||||
| Change in fair value of warrant liabilities |
$ — | $ (4,025) | $ (6,363) | |||||||||||||
| Other income (expense), net |
138 | 31 | (67) | |||||||||||||
|
|
|
|
|
|
|
|||||||||||
| Other income (expense), net |
$ 138 | $ (3,994) | $ (6,430) | |||||||||||||
|
|
|
|
|
|
|
|||||||||||
| % of net revenue |
—% | 4% | 8% | |||||||||||||
Other income (expense), net decreased by $4.1 million, or 103%, for fiscal year 2012 compared to fiscal year 2011. The change in other income (expense) was primarily due to changes in fair value of warrant liabilities in fiscal year 2011. During fiscal year 2011, we recorded charges of $4.0 million resulting from the increase in fair value of warrants to purchase shares of our preferred stock, compared to $6.4 million recorded in fiscal year
46
Table of Contents
2010. Effective June 25, 2010, we amended our certificate of incorporation to remove certain provisions from our preferred stock that had resulted in our warrants being previously classified as liabilities. On that date, the fair value of the warrants, $11.9 million, was reclassified to stockholders’ equity. Accordingly, for periods after June 27, 2010, we were not required to reflect changes in fair value of warrant liabilities in our condensed consolidated statements of income.
Income Tax Provision
| Fiscal Year | ||||||||||||||||
| 2012 | 2011 | 2010 | ||||||||||||||
| (in thousands) | ||||||||||||||||
| Income tax provision |
$ | 10,205 | $ | 8,137 | $ | 399 | ||||||||||
| % of income before income taxes |
22 | % | 47 | % | 3 | % | ||||||||||
The increase in the provision for income taxes was primarily due to the increase in income before income taxes to $47.2 million for fiscal year 2012, compared to $17.5 million for fiscal year 2011, offset by a lower effective tax rate resulting from foreign rate differentials.
In fiscal year 2012, we recorded an income tax provision of $10.2 million, compared to an income tax provision of $8.1 million for fiscal year 2011. Our fiscal year 2012 effective tax rate differs from the U.S. statutory rate primarily due to profits earned in jurisdictions where the tax rate is lower than the U.S. tax rate and the benefit of the federal research and development income tax credit. The income tax provision was also unfavorably impacted by the effects of non-deductible stock-based compensation expense.
Our provision for income taxes was $8.1 million in fiscal year 2011, compared to $0.4 million in fiscal year 2010. The increase in the provision for income taxes in fiscal year 2011 was due primarily to a $7.2 million reduction of our tax valuation allowance in fiscal year 2010 to reflect the anticipated utilization of deferred tax assets and the increase in net income from the prior year.
At the end of fiscal year 2012, we had approximately $18.7 million of California state net operating loss carryforwards. The California state net operating loss carryforwards expire between 2017 and 2022. Additionally, at the end of fiscal year 2012, we had California state and foreign research tax credit carryforwards of approximately $1.7 million and $0.2 million, respectively. The California state credits are not subject to expiration under current California state tax law.
The provision for income tax differs from the amount computed by applying the federal statutory tax rate to income before income taxes as follows:
| Fiscal 2012 |
Fiscal 2011 |
Fiscal 2010 |
||||||||||||||
| Income tax provision at the federal statutory rate |
35.0 | % | 35.0 | % | 35.0 | % | ||||||||||
| State tax, net of federal benefit |
— | — | 1.9 | |||||||||||||
| Research and development credits |
(1.0 | ) | (2.0 | ) | (3.2 | ) | ||||||||||
| Foreign tax rate differential |
(14.7 | ) | (0.4 | ) | (1.5 | ) | ||||||||||
| Non deductible stock compensation |
2.3 | 3.7 | 2.8 | |||||||||||||
| Change in fair value of warrant liabilities |
— | 8.1 | 15.1 | |||||||||||||
| Change in valuation allowance |
— | 2.4 | (46.6 | ) | ||||||||||||
| Other |
— | (0.3 | ) | (0.9 | ) | |||||||||||
|
|
|
|
|
|
|
|||||||||||
| Effective tax rate |
21.6 | % | 46.5 | % | 2.6 | % | ||||||||||
|
|
|
|
|
|
|
|||||||||||
47
Table of Contents
Net Income
| Fiscal Year | ||||||||||||
| 2012 | 2011 | 2010 | ||||||||||
| (in thousands) | ||||||||||||
| Net income |
$ | 36,947 | $ | 9,347 | $ | 15,142 | ||||||
| % of net revenue |
24 | % | 10 | % | 19 | % | ||||||
Net income for fiscal year 2012 increased by $27.6 million, or 295%, year-over-year, primarily due to increased unit shipments, increased gross profit, the absence of charges related to warrants to purchase preferred stock and a decrease in the effective tax rate.
Net income for fiscal year 2011 decreased $5.8 million, or 38%, year-over-year, primarily due to increased headcount and increased selling, general and administrative expense associated with the need to support increased demand for our products and the write-off of $1.4 million of costs associated with our initial public offering.
Quarterly Results of Operations and Seasonality
Tables setting forth our unaudited consolidated statements of operations for each quarter of fiscal years 2012 and 2011 may be found in Note 8, Quarterly Financial Data (Unaudited), in our Notes to Consolidated Financial Statements included later in this Annual Report on Form 10-K, which information is incorporated herein by reference. The quarterly data have been prepared on the same basis as the audited Consolidated Financial Statements and related Notes included later in this Annual Report on Form 10-K and include all adjustments consisting only of normal recurring adjustments that we consider necessary for a fair presentation of the financial information set forth below.
Sales of video gaming consoles and portable video gaming devices tend to be weighted towards holiday periods. As a result, historically, our customers in this market tend to increase production of products incorporating our solutions in the first and second quarters of our fiscal year in order to build inventories. Sales of our products tend to correspondingly increase during these periods and to be lower in the third and fourth quarters of the fiscal year. We expect this seasonality to continue in future periods, although we expect the magnitude of this seasonality to decrease as we increase sales to manufacturers of smartphones and tablet devices. We believe the quarterly sales progression for smartphones and tablet devices is less subject to seasonality due to the fact that end customer demand is also driven by upgrade cycles that typically occur throughout the year. In addition, the impact of new product introductions and overall macroeconomic trends can mitigate the impact of seasonality. We have limited visibility into future customer demand and the product mix that our customers will require, which could adversely affect our net revenue forecasts and operating margins.
Our quarterly net revenue has increased and experienced less fluctuation during fiscal years 2012 and 2011 as compared to fiscal year 2010, most notably beginning in the third and fourth quarters of fiscal year 2011, primarily as a result of the timing of customer product introductions as well as new sales to manufacturers of smartphones and tablet devices.
We have experienced fluctuations in gross profit generally due to variability in our quarterly net revenue as well as manufacturing cost efficiencies. Our products are manufactured by third-party manufacturers according to our estimates of future customer demand, of which we have limited visibility. If we inaccurately forecast demand for our products, we may be unable to obtain adequate and cost-effective foundry or assembly capacity from our third-party manufacturers to meet our customers’ delivery requirements, or we may accumulate excess inventories, which could adversely impact our gross margins.
48
Table of Contents
Our operating expenses generally increased over the twelve quarters in fiscal years 2012, 2011 and 2010 in absolute dollars primarily as a result of our increase in headcount related to our investment in the development of new products and our corporate infrastructure to support higher levels of sales and to operate as a public company.
We base our planned operating expenses on our expectations of future net revenue. If net revenue for a particular quarter is lower than expected, we may be unable to proportionately reduce our operating expenses. As a result, we believe that period-to-period comparisons of our past operating results should not be relied upon as an indication of our future performance.
During fiscal years 2011 and 2010, we recorded charges of $4.0 million and $6.4 million, respectively, resulting from the increase in fair value of our warrant liabilities. The fair value of our warrant liabilities was adjusted each quarter based primarily on changes in the estimated fair value of our common stock. Effective June 25, 2010, we amended our certificate of incorporation to remove certain provisions from our preferred stock that had resulted in our warrants being previously classified as liabilities. On that date, the fair value of the warrants, $11.9 million, was reclassified to stockholders’ equity. Accordingly, for periods after June 27, 2010, we are not required to reflect changes in fair value of warrant liabilities in our consolidated statements of income.
Liquidity and Capital Resources
Since our inception, our operations have been financed primarily by net proceeds of $50.2 million from the issuance of shares of our preferred stock, net proceeds of $75.2 million from the issuance of shares in public offerings and $44.4 million and $7.9 million in cash generated from operations in fiscal years 2012 and 2011, respectively. As of April 1, 2012, we had $157.8 million of cash, cash equivalents and short-term investments. Although the majority of our sales in fiscal years 2012 and 2011 were generated from a limited number of customers, we increased the number of total customers and the volume of sales to those customers during fiscal years 2012 and 2011. We expect that trend to continue as the markets for our products develop.
We believe our current cash, along with net cash provided by operating activities, will be sufficient to satisfy our liquidity requirements for the next 12 months. We also believe our current cash, along with net cash provided by operating activities position us to pursue value-creating acquisitions if opportunities arise. Our liquidity may be negatively impacted as a result of a decline in sales of our products due to a decline in our end markets, decrease in sales of our customers’ products in the market, or adoption of competitors’ products. Additionally, $29.3 million of the $153.6 million of cash and cash equivalents were held by our foreign subsidiaries as of April 1, 2012. If these funds are needed for our operations in the United States, we would be required to accrue and pay U.S. taxes to repatriate these funds. However, our intent is to indefinitely reinvest these funds outside of the United States, and our current plans do not demonstrate a need to repatriate them to fund our U.S. operations.
Our primary uses of cash are to fund operating expenses, purchases of inventory and the acquisition of property and equipment. Cash used to fund operating expenses excludes the impact of non-cash items such as depreciation and stock-based compensation and is impacted by the timing of when we pay these expenses as reflected in the change in our outstanding accounts payable and accrued expenses.
Our primary sources of cash are cash receipts on accounts receivable from our shipment of products to customers and distributors. Aside from the growth in amounts billed to our customers, net cash collections of accounts receivable are impacted by the efficiency of our cash collections process, which can vary from period to period depending on the payment cycles of our major customers and distributors.
49
Table of Contents
Below is a summary of our cash flows (used in) provided by operating activities, investing activities and financing activities for the periods indicated:
| Fiscal Year | ||||||||||||
| 2012 | 2011 | 2010 | ||||||||||
| Net cash provided by operating activities |
$ | 44,420 | $ | 7,892 | $ | 20,178 | ||||||
| Net cash (used in) provided by investing activities |
2,839 | 3,497 | (17,256 | ) | ||||||||
| Net cash (used in) provided by financing activities |
77,589 | (4,988 | ) | (474 | ) | |||||||
|
|
|
|
|
|
|
|||||||
| Net increase in cash and cash equivalents |
$ | 124,848 | $ | 6,401 | $ | 2,448 | ||||||
|
|
|
|
|
|
|
|||||||
Net Cash Provided by Operating Activities
Net cash provided by operating activities in fiscal year 2012 of $44.4 million primarily reflected net income of $36.9 million, non-cash expenses of $4.8 million and a net decrease in operating assets and liabilities of $2.6 million consisting primarily of a decrease in inventory of $3.0 million, a increase in accrued liabilities of $5.6 million partially offset by an increase in accounts receivable of $2.2 million, an increase in prepaid and other current assets of $1.0 million, an increase in other assets of $1.4 million and an decrease in accounts payable of $1.2 million. The movements in working capital were primarily based on the changes in accounts receivables resulting from our increase in sales volume, a decrease in inventory due to our inventory reduction efforts and an increase in other accrued liabilities driven by an increase in headcount. Non-cash expenses of $4.8 million consisted primarily of depreciation and amortization of $2.0 million and stock-based compensation of $3.7 million.
Net cash provided by operating activities in fiscal year 2011 of $7.9 million primarily reflected net income of $9.3 million, non-cash expenses of $8.6 million and an increase in accounts payable and accrued liabilities of $3.4 million and $1.1 million, respectively, offset by an increase in accounts receivable and inventories of $4.6 million and $10.9 million, respectively. The movements in working capital were primarily based on the changes in accounts receivables, inventory and accounts payable resulting from our increase in sales volume and an increase in other accrued liabilities driven by an increase in headcount. The non-cash expenses of $8.6 million consisted primarily of depreciation and amortization of $1.8 million, stock-based compensation of $2.2 million and the revaluation of warrants of $4.0 million.
Net cash provided by operating activities in fiscal year 2010 of $20.2 million primarily reflected net income of $15.1 million, non-cash expenses of $7.6 million and a decline in inventories and an increase in accrued liabilities of $0.3 million and $2.3 million, respectively, offset by increases in accounts receivable and prepaid expenses and other current assets and decreases in accounts payable of $3.4 million, $1.5 million and $0.4 million, respectively. The movements in working capital were primarily based on the changes in accounts receivables resulting from our increase in sales volume, an increase in prepaid expenses and other current assets in response to higher amounts of vendor advances in fiscal year 2010 and an increase in other accrued liabilities driven by an increase in headcount, which triggered higher payroll related accruals. The non-cash expenses of $7.6 million primarily included $6.4 million resulting from the revaluation of warrants recorded as liabilities, depreciation and amortization of $1.8 million and stock-based compensation of $1.3 million, offset by deferred taxes of $1.8 million.
Net Cash (Used in) Provided by Investing Activities
Net cash provided by investing activities in fiscal year 2012 of $2.8 million primarily reflected the purchase of property and equipment of $2.5 million and includes the sale of available for sale investments of $15.2 million and the purchase of available for sale investments of $10.0 million.
Net cash provided by investing activities for fiscal year 2011 of $3.5 million included proceeds from the maturity of short-term investments of $15.7 million and proceeds from the maturity of restricted time deposits of $0.1 million, offset by purchases of property and equipment of $2.2 million to support growth in our operations and purchases of short-term investments of $10.1 million.
50
Table of Contents
Net cash used in investing activities for fiscal year 2010 of $17.3 million included purchases of property and equipment of $2.2 million to support growth in our operations, purchases of available for sale investments of $14.9 million and investments in restricted time deposits of $0.1 million.
Net Cash (Used in) Provided by Financing Activities
Net cash provided by financing activities in fiscal year 2012 of $77.6 million resulted primarily from proceeds from public offerings, net of underwriter commissions of $77.9 million.
Net cash used in financing activities in fiscal year 2011 of $5.0 million consisted primarily of $0.4 million for the repayment of equipment financing, $1.4 million in offering costs paid during the period and $4.0 million for the repayment of refundable customer advances, offset by proceeds of $0.7 million from the issuance of common stock upon the exercise of stock options.
Net cash used in financing activities in fiscal year 2010 of $0.5 million consisted primarily of $0.8 million for the repayment of equipment financing, offset by $0.3 million from the issuance of common stock upon the exercise of stock options.
Contractual Obligations
The following table summarizes our outstanding contractual obligations as of April 1, 2012:
| Payments Due by Period | ||||||||||||||||||||
| Total | Less Than 1 Year |
1-3 Years |
3-5 Years |
More Than 5 Years |
||||||||||||||||
| (in thousands) |
||||||||||||||||||||
| Operating lease obligations |
$ | 1,064 | $ | 671 | $ | 393 | $ | — | $ | — | ||||||||||
| Capital lease obligations |
50 | 28 | 22 | — | — | |||||||||||||||
| Purchase obligations |
26,698 | 26,698 | — | — | — | |||||||||||||||
|
|
|
|
|
|
|
|
|
|
|
|||||||||||
| Total contractual obligations |
$ | 27,812 | $ | 27,397 | $ | 415 | $ | — | $ | — | ||||||||||
|
|
|
|
|
|
|
|
|
|
|
|||||||||||
Operating leases consist of contractual obligations from agreements for non-cancelable office space. Capital lease obligations consist of leases used to finance the acquisition of equipment. Purchase obligations consist of the minimum purchase commitments made to contract manufacturers.
As of April 1, 2012, our unrecognized tax benefits were $ 3.2 million, which are netted against deferred tax assets. Due to the high degree of uncertainty regarding the settlement of these liabilities, we are unable to estimate the year in which the future cash flows may occur. As a result, these amounts are not included in the table above.
Warranties and Indemnification
In connection with the sale of products in the ordinary course of business, we often make representations affirming, among other things, that our products do not infringe on the intellectual property rights of others, and agree to indemnify customers against third-party claims for such infringement. Further, our bylaws require us to indemnify our officers and directors against any action that may arise out of their services in that capacity. We have not been subject to any material liabilities under such provisions and therefore believe that our exposure for these indemnification obligations is minimal. Accordingly, we have no liabilities recorded for these indemnity agreements as of April 1, 2012.
51
Table of Contents
Off-Balance Sheet Arrangements
As part of our ongoing business, we do not participate in transactions that generate relationships with unconsolidated entities of financial partnerships, such as entities often referred to as structured finance or special purpose entities, or SPEs, which would have been established for the purpose of facilitating off-balance sheet arrangements or other contractually narrow or limited purposes. As of April 1, 2012, we were not involved in any unconsolidated SPE transactions.
Recent Accounting Pronouncements
In May 2011, the Financial Accounting Standards Board (“FASB”) issued ASU No. 2011-04, “Amendments to Achieve Common Fair Value Measurements and Disclosure Requirements in U.S. GAAP and IFRSs.” ASU No. 2011-04 amended ASC 820, Fair Value Measurements and Disclosures, to converge the fair value measurement guidance in GAAP and International Financial Reporting Standards (IFRSs). Some of the amendments clarify the application of existing fair value measurement requirements, while other amendments change particular principles in ASC 820. In addition, ASU No. 2011-04 requires additional fair value disclosures. The amendments are to be applied prospectively and are effective for interim and annual periods beginning after December 15, 2011, which is our fourth quarter of fiscal year 2012. Other than requiring additional disclosures, the adoption of this new guidance did not have a material impact on our consolidated results of operations and financial position.
In June 2011, the FASB issued ASU No. 2011-05, “Presentation of Comprehensive Income”. ASU No. 2011-05 amended ASC 320, “Comprehensive Income, to converge the presentation of comprehensive income between U.S GAAP and IFRS.” ASU No. 2011-05 requires that all non-owner changes in stockholders’ equity be presented in either a single continuous statement of comprehensive income or in two separate but consecutive statements and requires reclassification adjustments for items that are reclassified from other comprehensive income to net income in the statement(s) where the components of net income and the components of other comprehensive income are presented. ASU No. 2011-05 eliminates the option to present the components of other comprehensive income as part of the statement in changes of stockholders equity. ASU 2011-05 is effective for fiscal years, and interim periods within those years, beginning after December 15, 2011, which will be our fiscal interim period ended July 1, 2012 of fiscal year ending March 31, 2013. The adoption of ASU No. 2011-05 will affect the presentation of comprehensive income but will not impact our financial condition or results of operations.
Critical Accounting Estimates
Our Consolidated Financial Statements and the related Notes included elsewhere in this Annual Report on Form 10-K are prepared in accordance with accounting principles generally accepted in the United States. The preparation of these Consolidated Financial Statements and the related Notes requires us to make estimates and assumptions that affect the reported amounts of assets, liabilities, net revenue, costs, and expenses, and any related disclosures. We base our estimates on historical experience and on various other assumptions that we believe to be reasonable under the circumstances. Changes in accounting estimates are reasonably likely to occur from period to period. Accordingly, actual results could differ significantly from the estimates made by our management. We evaluate our estimates and assumptions on an ongoing basis. To the extent that there are material differences between these estimates and our actual results, our future financial statement presentation, financial condition results of operations and cash flows will be affected.
Revenue Recognition
Revenue from the sale of our products is recognized when all of the following four criteria are met: (1) persuasive evidence of an arrangement exists, (2) the product has been delivered, (3) the price is fixed or determinable, and (4) collection is reasonably assured. Delivery takes place after the transfer of title which historically has occurred upon shipment of the product unless otherwise stated in the customer agreement.
52
Table of Contents
For direct customers (i.e., other than distributors), we recognize revenue when title to the product is transferred to the customer, which occurs upon shipment or delivery, depending upon the terms of the customer order. We enter into sales transactions with distributors that we have established as either stocking distributors or non-stocking distributors. Non-stocking distributor sales transactions are those in which the distributor purchases products for an identified end-customer. In sales transactions with our non-stocking distributors, we recognize net revenue upon either shipment or delivery to the non-stocking distributor, depending upon the terms of the order. Pursuant to terms and conditions contained in the agreement with these distributors, all sales to non-stocking distributors are non-refundable, and they do not have rights to return product purchases except under our standard warranty terms. In addition, we do not provide any price concessions or price protection on shipments previously made to our non-stocking distributors.
Stocking distributor sales transactions are those in which the distributor purchases products for resale to their customer. For stocking distributor sales transaction, we sell our products under distributor agreements that provide for return rights and price protection. When the stocking distributors hold inventory specifically for resale to their customers, our management has concluded it is unable to reasonably estimate sales returns or price protection adjustments under its distributor arrangements. Accordingly, net revenue and related cost of revenue on shipments to stocking distributors are deferred until the distributor reports that the product has been sold to an end customer (“sell through revenue accounting”). Under sell through revenue accounting, accounts receivable are recognized and inventory is relieved upon shipment to the distributor as title to the inventory is transferred upon shipment, at which point we have a legally enforceable right to collection under normal terms. The associated net revenue and cost of revenue are deferred by recording “deferred income” (gross profit margin on these sales) as included within “Accrued liabilities” and “Prepaid expenses and other current assets,” respectively, on the consolidated balance sheets. Gross profit margin on these sales at April 2012 and April 2011 were $235,000 and $64,000, respectively. When the related product is reported as having been sold by our distributors to their end customers (“sold through”), we recognize previously deferred income as net revenue and cost of revenue.
Income Taxes
We account for income taxes under the asset and liability approach. Under this approach, deferred tax assets and liabilities are recognized for the expected tax consequences of temporary differences between the tax basis of assets and liabilities and their reported amounts in the Consolidated Financial Statements and related Notes using enacted tax rates and laws that will be in effect when the difference is expected to reverse. Valuation allowances are provided against deferred tax assets that are not likely to be realized. In assessing the need for a valuation allowance, we consider positive and negative evidence such as historical levels of income or loss, projections of future income, expectations and risks associated with estimates of future taxable income and ongoing prudent and practical tax planning strategies. To the extent that we believe it is more likely than not that some portion of our deferred tax assets will not be realizable, we would increase the valuation allowance against the deferred tax assets. Realization of our deferred tax assets is dependent upon future federal, state and foreign taxable income. Our judgments regarding future profitability may change due to future market conditions, changes in U.S. or international tax laws and other factors. These changes, if any, may require possible material adjustments to these deferred tax assets, resulting in a reduction in net income or an increase in net loss in the period when such determinations are made.
We are subject to income taxes in the United States and foreign countries, and we expect to be subject to routine corporate income tax audits in many of these jurisdictions. We believe that our tax return positions are fully supported, but tax authorities are likely to challenge certain positions, which may not be fully sustained. Our income tax expense includes amounts intended to satisfy income tax assessments that result from these challenges. Determining the income tax expense for these potential assessments and recording the related assets and liabilities requires management judgment and estimates. We believe that our provision for uncertain tax positions, including related interest and penalties, is adequate based on information currently available to us. The amount ultimately paid upon resolution of audits could be materially different from the amounts previously included in income tax expense and therefore could have a material impact on our tax provision, net income and cash flows. Our overall provision requirement could change due to the issuance of new regulations or new case
53
Table of Contents
law, negotiations with tax authorities, resolution with respect to individual audit issues, or the entire audit, or the expiration of statutes of limitation.
We have expanded our international operations and staff, and will continue to do so in the future, to better support our expansion in international markets. This business expansion has included an international structure that, among other things, consists of research and development cost-sharing arrangements, certain licenses and other contractual arrangements between us and our wholly owned foreign subsidiaries. These arrangements may result in a lower percentage of our pre-tax income being subject to a relatively higher U.S. federal statutory tax rate. As a result, our effective tax rate is expected to be lower than the U.S. federal statutory rate in future fiscal years, as we completed the implementation of our international structure in fiscal year 2011. However, the realization of any expected tax benefits is contingent upon numerous factors, including the judgments of tax authorities in several jurisdictions, and thus cannot be assured.
Inventory Valuation
We value our inventory at the lower of standard cost (which approximates actual cost on a first-in, first-out basis) or its current estimated market value. Inventories include finished good parts that may be specialized in nature and subject to rapid obsolescence. We periodically review the quantities and carrying values of inventories to assess whether the inventories are recoverable. Write-down of inventory for excess quantity and technological obsolescence are charged to cost of revenues as incurred. Actual demand may materially differ from our projected demand, and this difference could have a material impact on our gross margin and inventory balances based on additional provisions for excess or obsolete inventory or a benefit from inventory previously written down. Write-down amounts charged (credited) to cost of revenues for fiscal years 2012, 2011 and 2010 were $2.2 million, $0.4 million and $(0.1) million, respectively. The increase in the amounts charged to cost of revenues for fiscal year 2012, compared to prior comparative periods, was primarily due to slow moving inventory.
Stock-Based Compensation
We measure the cost of employee services received in exchange for equity incentive awards, including stock options, based on the grant date fair value of the award. The fair value is estimated using the Black-Scholes option pricing model. The Black-Scholes model requires us to estimate certain key assumptions including future stock price volatility, expected term of the options, risk free rates, and dividend yields. We also estimate potential forfeiture of equity incentive awards granted and adjust compensation expense accordingly. The estimate of forfeitures is adjusted over the estimated term to the extent that the actual forfeiture rate or expected forfeiture rate is expected to differ from these estimates. The resulting cost is recognized over the period during which the employee is required to provide services in exchange for the award, which is usually the vesting period. We recognize compensation expense over the vesting period using the straight-line method and classify these amounts in the statements of income based on the department to which the related employee is assigned. For fiscal years 2012, 2011 and 2010, we recognized employee stock-based compensation of $3.7 million, $2.1 million and $1.2 million, respectively.
Stock options issued to non-employees are accounted for at their estimated fair value determined using the Black-Scholes option pricing model. The fair value of options granted to non-employees is re-measured as they vest, and the resulting change in value, if any, is recognized as expense during the period the related services are rendered. For fiscal years 2012, 2011 and 2010, we recognized non-employee stock-based compensation of $14,000, $128,000 and $33,000, respectively.
If any of the assumptions in the Black-Scholes option pricing model changes significantly, stock-based compensation for future awards may differ materially compared to awards granted previously.
54
Table of Contents
Prior to our initial public offering, our board of directors considered numerous objective and subjective factors to determine the fair market value of our common stock at each meeting at which stock options were granted and approved.
We estimated our expected volatility based on the volatilities of several unrelated public companies within the semiconductor industry since we have little information on the volatility of the price of our common stock due to no trading history prior to our initial public offering. In the determination of the companies to be used in the peer group, our board of directors considered the input of a third-party valuation. We estimated volatility for option grants by evaluating the average historical volatility of this peer group for the period immediately preceding the option grant for a term that is approximately equal to the expected term of the option.
We have elected to use the safe harbor method described in Staff Accounting Bulletin No. 110, Topic 14, to compute the expected term of options granted. This decision was based on the lack of relevant historical data due to our limited historical experience. We derived the risk-free interest rate assumption using the published interest rate for a U.S. Treasury zero-coupon issue having a maturity similar to the expected term of the options. We based the assumed dividend yield on the expectation that we will not pay cash dividends in the foreseeable future.
We estimated forfeitures at the time of grant and will revise, if necessary, in subsequent periods if actual forfeitures differ from those estimates. We utilized our historical forfeiture rates since inception to estimate our future forfeiture rate. We will continue to evaluate the appropriateness of estimating the forfeiture rate based on actual forfeiture experience, analysis of employee turnover behavior and other factors. Quarterly changes in the estimated forfeiture rate can have a significant effect on stock-based compensation expense as the cumulative effect of adjusting the rate for all stock compensation expense amortization is recognized in the period the forfeiture estimate is changed. If a revised forfeiture rate is higher than the previously estimated forfeiture rate, an adjustment is made that will result in a decrease to the stock-based compensation expense recognized in the consolidated financial statements. If a revised forfeiture rate is lower than the previously estimated forfeiture rate, an adjustment is made that will result in an increase to the stock-based compensation expense recognized in the consolidated financial statements.
Financial Instruments with Characteristics of Both Liabilities and Equity
On March 30, 2009, we estimated the fair value of the warrants using the Black-Scholes option pricing model. Similar to the “Critical Accounting Policies and Estimates—Stock-Based Compensation,” the Black-Scholes model requires a number of key assumptions which we estimated based on information available at the end of each fiscal year. Further, at the end of each fiscal period (both quarterly and annual), we measured the warrants using the Black-Scholes model with any changes in the computed fair value being included within our consolidated statements of income. During fiscal years 2011 and 2010, we recorded charges of $4.0 million and $6.4 million, respectively, in relation to the remeasurement of the warrant. These charges have been included as a component of “other expenses”.
Effective June 25, 2010, we amended our certificate of incorporation to remove certain anti-dilution adjustment provisions from our preferred stock. On that date, the fair value of the warrant liabilities, $11.9 million, was reclassified from liabilities into stockholders’ equity. Accordingly, for periods after June 27, 2010, we are not required to reflect changes in fair value of warrant liabilities in our consolidated statements of income.
55
Table of Contents
Item 7A. Quantitative and Qualitative Disclosures About Market Risk.
Interest Rate Risk
We had cash, cash equivalents and investments of $157.8 million at April 1, 2012, which was held for working capital purposes. We do not enter into investments for trading or speculative purposes. A 10% change in interest rates will not have a significant impact on our future interest income or investment fair value due to the short-term nature of our investments. As of April 1, 2012, our cash, cash equivalents and short-term investments were in money market funds and U.S. government securities.
Foreign Currency Risk
Our sales contracts are primarily denominated in U.S. dollars and therefore substantially all of our net revenue is not subject to foreign currency risk. However, a portion of our operating expenses are incurred outside the U.S., are denominated in foreign currencies and are subject to fluctuations due to changes in foreign currency exchange rates, particularly changes in the New Taiwan Dollar, Japanese Yen and Korean Won. Additionally, fluctuations in foreign currency exchange rates may cause us to recognize transaction gains and losses in our statement of income. We recognized no significant foreign currency transaction gains or losses for fiscal years 2012, 2011 and 2010 related to fluctuations in foreign currency exchange rates.
Item 8. Financial Statements and Supplementary Data.
Our Consolidated Financial Statements and related Notes and schedules are incorporated by reference from Part IV, Item 15, below.
Item 9. Changes in and Disagreements with Accountants on Accounting and Financial Disclosure.
None.
Item 9A. Controls and Procedures.
Evaluation of Disclosure Controls and Procedures
Our management, with the participation of our Chief Executive Officer and our Chief Financial Officer, evaluated the effectiveness of our disclosure controls and procedures as of April 1, 2012. The term “disclosure controls and procedures,” as defined in Rules 13a-15(e) and 15d-15(e) under the Securities Exchange Act of 1934, as amended (the “Exchange Act”), means controls and other procedures of a company that are designed to ensure that information required to be disclosed by a company in the reports that it files or submits under the Exchange Act is recorded, processed, summarized and reported, within the time periods specified in the SEC’s rules and forms. Disclosure controls and procedures include, without limitation, controls and procedures designed to ensure that information required to be disclosed by a company in the reports that it files or submits under the Exchange Act is accumulated and communicated to the company’s management, including its principal executive and principal financial officers, as appropriate to allow timely decisions regarding required disclosure. Management recognizes that any controls and procedures, no matter how well designed and operated, can provide only reasonable assurance of achieving their objectives and management necessarily applies its judgment in evaluating the cost-benefit relationship of possible controls and procedures. Based on the evaluation of our disclosure controls and procedures as of April 1, 2012 our Chief Executive Officer and Chief Financial Officer concluded that, as of such date, our disclosure controls and procedures were effective at the reasonable assurance level.
56
Table of Contents
Management’s Annual Report on Internal Control Over Financial Reporting
This Annual Report on Form 10-K does not include a report of management’s assessment regarding internal control over financial reporting or an attestation report of our registered public accounting firm due to a transition period established by the rules of the SEC for newly public companies.
Changes in Internal Control over Financial Reporting
There was no change in our internal control over financial reporting identified in connection with the evaluation required by Rule 13a-15(d) and 15d-15(d) of the Exchange Act that occurred during the three months ended April 1, 2012 that has materially affected, or is reasonably likely to materially affect, our internal control over financial reporting.
None.
We are incorporating by reference the information required by Part III of this Annual Report on Form 10-K from our proxy statement relating to our 2012 annual meeting of stockholders (the “Proxy Statement”), which will be filed with the SEC within 120 days after April 1, 2012.
Item 10. Directors, Executive Officers and Corporate Governance.
The information required by this item will be contained in our Proxy Statement and is incorporated herein by reference.
Item 11. Executive Compensation.
The information required by this item will be contained in our Proxy Statement and is incorporated herein by reference.
Item 12. Security Ownership of Certain Beneficial Owners and Management and Related Stockholder Matters.
The information required by this item will be contained in our Proxy Statement and is incorporated herein by reference.
Item 13. Certain Relationships and Related Transactions, and Director Independence.
The information required by this item will be contained in our Proxy Statement and is incorporated herein by reference.
Item 14. Principal Accounting Fees and Services.
The information required by this item will be contained in our Proxy Statement and is incorporated herein by reference.
57
Table of Contents
| ITEM | 15. Financial Statements and Exhibits. |
(a) The following documents are filed as part of this Form:
1. Financial Statements
| Page | ||||
| 59 | ||||
| 60 | ||||
| 61 | ||||
| Consolidated Statements of Stockholders’ Equity and Comprehensive Income |
62 | |||
| 63 | ||||
| 64 | ||||
All other schedules are omitted because they are not applicable or the required information is shown in the Consolidated Financial Statements or related Notes thereto.
3. Exhibits
See Index to Exhibits at the end of this Report, which is incorporated herein by reference. The Exhibits listed in the accompanying Index to Exhibits are filed as part of this report.
58
Table of Contents
REPORT OF INDEPENDENT REGISTERED PUBLIC ACCOUNTING FIRM
To the Board of Directors and Stockholders of
InvenSense, Inc.
Sunnyvale, California
We have audited the accompanying consolidated balance sheets of InvenSense, Inc. and subsidiaries (the “Company”) as of April 1, 2012, and April, 3 2011, and the related consolidated statements of income, stockholders’ equity and comprehensive income, and cash flows for each of the three years in the period ended April 1, 2012. These consolidated financial statements are the responsibility of the Company’s management. Our responsibility is to express an opinion on these consolidated financial statements based on our audits.
We conducted our audits in accordance with the standards of the Public Company Accounting Oversight Board (United States). Those standards require that we plan and perform the audit to obtain reasonable assurance about whether the consolidated financial statements are free of material misstatement. The Company is not required to have, nor were we engaged to perform, an audit of its internal control over financial reporting. Our audits included consideration of internal control over financial reporting as a basis for designing audit procedures that are appropriate in the circumstances, but not for the purpose of expressing an opinion on the effectiveness of the Company’s internal control over financial reporting. Accordingly, we express no such opinion. An audit also includes examining, on a test basis, evidence supporting the amounts and disclosures in the consolidated financial statements, assessing the accounting principles used and significant estimates made by management, and evaluating the overall financial statement presentation. We believe that our audits provide a reasonable basis for our opinion.
In our opinion, the consolidated financial statements present fairly, in all material respects, the consolidated financial position of the Company at April 1, 2012 and April 3, 2011 and the results of their operations and their cash flows for each of the three years in the period ended April 1, 2012, in conformity with accounting principles generally accepted in the United States of America.
/s/ DELOITTE & TOUCHE LLP
San Jose, California
June 15, 2012
59
Table of Contents
InvenSense, Inc.
(In thousands, except par value)
| April 1, 2012 |
April 3, 2011 |
|||||||
| Assets |
||||||||
| Current assets: |
||||||||
| Cash and cash equivalents |
$ | 153,643 | $ | 28,795 | ||||
| Short-term investments |
4,129 | 9,280 | ||||||
| Accounts receivable |
11,931 | 9,765 | ||||||
| Inventories |
12,240 | 15,208 | ||||||
| Prepaid expenses and other current assets |
4,188 | 2,249 | ||||||
|
|
|
|
|
|||||
| Total current assets |
186,131 | 65,297 | ||||||
| Property and equipment, net |
4,011 | 3,492 | ||||||
| Restricted time deposit |
192 | 194 | ||||||
| Other assets |
2,984 | 1,763 | ||||||
|
|
|
|
|
|||||
| Total assets |
$ | 193,318 | $ | 70,746 | ||||
|
|
|
|
|
|||||
| Liabilities and Stockholders’ Equity |
||||||||
| Current liabilities: |
||||||||
| Accounts payable |
$ | 5,446 | $ | 6,687 | ||||
| Accrued liabilities |
7,726 | 4,307 | ||||||
| Long-term debt — current portion |
28 | 18 | ||||||
|
|
|
|
|
|||||
| Total current liabilities |
13,200 | 11,012 | ||||||
| Long-term debt |
22 | 16 | ||||||
| Other long-term liabilities |
3,219 | 577 | ||||||
|
|
|
|
|
|||||
| Total liabilities |
16,441 | 11,605 | ||||||
| Commitments and contingencies (note 5) |
||||||||
| Stockholders’ equity: |
||||||||
| Preferred stock: |
||||||||
| Preferred stock, $0.001 par value — 20,000 shares authorized, no shares issued and outstanding at April 1, 2012; no shares authorized, issued and outstanding at April 3, 2011 |
— | — | ||||||
| Convertible preferred stock: |
||||||||
| Series A convertible preferred stock, $0.001 par value — no shares authorized, issued and outstanding at April 1, 2012; 8,060 shares authorized, 8,000 shares issued and outstanding (aggregate liquidation value of $8,000) at April 3, 2011 |
— | 9,019 | ||||||
| Series B convertible preferred stock, $0.001 par value — no shares authorized, issued and outstanding, at April 1, 2012; 6,566 shares authorized, 5,920 shares issued and outstanding (aggregate liquidation value of $11,000) at April 3, 2011 |
— | 22,341 | ||||||
| Series C convertible preferred stock, $0.001 par value — no shares authorized, issued and outstanding at April 1, 2012; 15,510 shares authorized, 15,510 shares issued and outstanding (aggregate liquidation value of $19,000) at April 3, 2011 |
— | 18,881 | ||||||
| Common stock: |
||||||||
| Common stock, $0.001 par value — 750,000 shares authorized, 80,890 shares issued and outstanding at April 1, 2012; 80,000 shares authorized, 18,005 shares issued and outstanding at April 3, 2011 |
136,792 | 5,762 | ||||||
| Accumulated other comprehensive income |
1 | 1 | ||||||
| Retained earnings |
40,084 | 3,137 | ||||||
|
|
|
|
|
|||||
| Total stockholders’ equity |
176,877 | 59,141 | ||||||
|
|
|
|
|
|||||
| Total liabilities and stockholders’ equity |
$ | 193,318 | $ | 70,746 | ||||
|
|
|
|
|
|||||
See accompanying notes to the consolidated financial statements.
60
Table of Contents
InvenSense, Inc.
Consolidated Statements of Income
(In thousands, except per share data)
| Year Ended | ||||||||||||
| April 1, 2012 |
April 3, 2011 |
March 28, 2010 |
||||||||||
| Net revenue |
$ | 152,967 | $ | 96,547 | $ | 79,556 | ||||||
| Cost of revenue |
67,571 | 43,647 | 36,073 | |||||||||
|
|
|
|
|
|
|
|||||||
| Gross profit |
85,396 | 52,900 | 43,483 | |||||||||
| Operating expenses: |
||||||||||||
| Research and development |
19,672 | 15,826 | 13,085 | |||||||||
| Selling, general and administrative |
18,710 | 15,596 | 8,427 | |||||||||
|
|
|
|
|
|
|
|||||||
| Total operating expenses |
38,382 | 31,422 | 21,512 | |||||||||
|
|
|
|
|
|
|
|||||||
| Income from operations |
47,014 | 21,478 | 21,971 | |||||||||
| Other income (expense): |
||||||||||||
| Change in fair value of warrant liabilities |
— | (4,025 | ) | (6,363 | ) | |||||||
| Other income (expense), net |
138 | 31 | (67 | ) | ||||||||
|
|
|
|
|
|
|
|||||||
| Other income (expense)— net |
138 | (3,994 | ) | (6,430 | ) | |||||||
|
|
|
|
|
|
|
|||||||
| Income before income taxes |
47,152 | 17,484 | 15,541 | |||||||||
| Income tax provision |
10,205 | 8,137 | 399 | |||||||||
|
|
|
|
|
|
|
|||||||
| Net income |
36,947 | 9,347 | 15,142 | |||||||||
| Net income allocable to convertible preferred stockholders |
20,618 | 7,716 | 12,150 | |||||||||
|
|
|
|
|
|
|
|||||||
| Net income allocable to common stockholders |
$ | 16,329 | $ | 1,631 | $ | 2,992 | ||||||
|
|
|
|
|
|
|
|||||||
| Basic |
$ | 0.39 | $ | 0.09 | $ | 0.18 | ||||||
|
|
|
|
|
|
|
|||||||
| Diluted |
$ | 0.37 | $ | 0.08 | $ | 0.17 | ||||||
|
|
|
|
|
|
|
|||||||
| Weighted average shares outstanding in computing net income per share allocable to common stockholders: |
||||||||||||
| Basic |
41,614 | 17,592 | 16,542 | |||||||||
|
|
|
|
|
|
|
|||||||
| Diluted |
47,011 | 22,202 | 20,867 | |||||||||
|
|
|
|
|
|
|
|||||||
See accompanying notes to the consolidated financial statements.
61
Table of Contents
InvenSense, Inc.
Consolidated Statements of Stockholders’ Equity and Comprehensive Income
(In thousands, except per share amounts)
| Preferred Stock | Convertible Preferred Stock |
Common Stock | Accumulated Other Comprehensive Income (Loss) |
Retained Earnings (Accumulated Deficit) |
Total | Comprehensive Income |
||||||||||||||||||||||||||||||||||
| Shares | Amount | Shares | Amount | Shares | Amount | |||||||||||||||||||||||||||||||||||
| Balance—March 29, 2009 |
— | $ | — | 29,431 | $ | 39,192 | 15,820 | $ | 1,250 | $ | — | $ | (20,691 | ) | $ | 19,751 | ||||||||||||||||||||||||
| Reclassification of warrants from equity to liability upon adoption of FASB ASC 815-40-15 (see Note 1) |
(828 | ) | (661 | ) | (1,489 | ) | ||||||||||||||||||||||||||||||||||
| Issuance of common stock from exercise of stock options |
1,210 | 299 | 299 | |||||||||||||||||||||||||||||||||||||
| Issuance of common stock for services |
26 | 78 | 78 | |||||||||||||||||||||||||||||||||||||
| Stock compensation relating to stock options issued to consultants |
33 | 33 | ||||||||||||||||||||||||||||||||||||||
| Stock compensation relating to stock options issued to employees |
1,195 | 1,195 | ||||||||||||||||||||||||||||||||||||||
| Unrealized loss on available for sale investments |
(9 | ) | (9 | ) | $ | (9 | ) | |||||||||||||||||||||||||||||||||
| Net income |
15,142 | 15,142 | 15,142 | |||||||||||||||||||||||||||||||||||||
|
|
|
|
|
|
|
|
|
|
|
|
|
|
|
|
|
|
|
|
|
|||||||||||||||||||||
| Comprehensive income for the fiscal year |
$ | 15,133 | ||||||||||||||||||||||||||||||||||||||
|
|
|
|||||||||||||||||||||||||||||||||||||||
| Balance—March 28, 2010 |
— | $ | — | 29,431 | $ | 38,364 | 17,056 | $ | 2,855 | $ | (9 | ) | $ | (6,210 | ) | $ | 35,000 | |||||||||||||||||||||||
|
|
|
|
|
|
|
|
|
|
|
|
|
|
|
|
|
|
|
|||||||||||||||||||||||
| Reclassification of warrants from liability to equity (see Note 1) |
11,877 | 11,877 | ||||||||||||||||||||||||||||||||||||||
| Issuance of common stock from exercise of stock options |
949 | 717 | 717 | |||||||||||||||||||||||||||||||||||||
| Stock compensation relating to stock options issued to consultants |
128 | 128 | ||||||||||||||||||||||||||||||||||||||
| Stock compensation relating to stock options issued to employees |
2,062 | 2,062 | ||||||||||||||||||||||||||||||||||||||
| Unrealized gain on available for sale investments |
10 | 10 | $ | 10 | ||||||||||||||||||||||||||||||||||||
| Net income |
9,347 | 9,347 | 9,347 | |||||||||||||||||||||||||||||||||||||
|
|
|
|
|
|
|
|
|
|
|
|
|
|
|
|
|
|
|
|
|
|||||||||||||||||||||
| Comprehensive income for the fiscal year |
$ | 9,357 | ||||||||||||||||||||||||||||||||||||||
|
|
|
|||||||||||||||||||||||||||||||||||||||
| Balance—April 3, 2011 |
— | $ | — | 29,431 | $ | 50,241 | 18,005 | $ | 5,762 | $ | 1 | $ | 3,137 | $ | 59,141 | |||||||||||||||||||||||||
|
|
|
|
|
|
|
|
|
|
|
|
|
|
|
|
|
|
|
|||||||||||||||||||||||
| Issuance of common stock upon initial public offering, net of offering costs and underwriter commission |
10,000 | 67,653 | 67,653 | |||||||||||||||||||||||||||||||||||||
| Issuance of common stock upon secondary offering, net of offering costs and underwriter commission |
575 | 7,593 | 7,593 | |||||||||||||||||||||||||||||||||||||
| Issuance of preferred stock from exercise of stock warrants |
276 | 499 | 499 | |||||||||||||||||||||||||||||||||||||
| Issuance of common stock from exercise of stock warrants |
646 | — | — | |||||||||||||||||||||||||||||||||||||
| Conversion of preferred stock to common stock upon initial public offering |
(29,707 | ) | (50,740 | ) | 50,999 | 50,740 | ||||||||||||||||||||||||||||||||||
| Issuance of common stock from exercise of stock options |
665 | 1,356 | 1,356 | |||||||||||||||||||||||||||||||||||||
| Stock compensation relating to stock options issued to consultants |
14 | 14 | ||||||||||||||||||||||||||||||||||||||
| Stock compensation relating to stock options issued to employees |
3,674 | 3,674 | ||||||||||||||||||||||||||||||||||||||
| Unrealized gain on available for sale Investments |
— | — | — | |||||||||||||||||||||||||||||||||||||
| Net income |
36,947 | 36,947 | 36,947 | |||||||||||||||||||||||||||||||||||||
|
|
|
|
|
|
|
|
|
|
|
|
|
|
|
|
|
|
|
|
|
|||||||||||||||||||||
| Comprehensive income for the fiscal year |
$ | 36,947 | ||||||||||||||||||||||||||||||||||||||
|
|
|
|||||||||||||||||||||||||||||||||||||||
| Balance—April 1, 2012 |
— | $ | — | — | $ | — | 80,890 | $ | 136,792 | $ | 1 | $ | 40,084 | $ | 176,877 | |||||||||||||||||||||||||
|
|
|
|
|
|
|
|
|
|
|
|
|
|
|
|
|
|
|
|||||||||||||||||||||||
See accompanying notes to the consolidated financial statements.
62
Table of Contents
InvenSense, Inc.
Consolidated Statements of Cash Flows
(In thousands)
| Year Ended | ||||||||||||
| April 1, 2012 |
April 3, 2011 |
March 28, 2010 |
||||||||||
| Cash flows from operating activities: |
||||||||||||
| Net income |
$ | 36,947 | $ | 9,347 | $ | 15,142 | ||||||
| Adjustments to reconcile net income to net cash provided by operating activities: |
||||||||||||
| Depreciation and amortization |
1,992 | 1,778 | 1,754 | |||||||||
| Loss (gain) on disposal of property and equipment |
(154 | ) | 91 | 1 | ||||||||
| Amortization of debt discount to interest expense |
— | — | 13 | |||||||||
| Stock-based compensation expense |
3,688 | 2,190 | 1,306 | |||||||||
| Change in fair value of warrant liability |
— | 4,025 | 6,363 | |||||||||
| Deferred income tax assets |
(699 | ) | 489 | (1,832 | ) | |||||||
| Write-off of deferred offering costs |
— | 1,388 | — | |||||||||
| Changes in operating assets and liabilities: |
||||||||||||
| Accounts receivable |
(2,222 | ) | (4,564 | ) | (3,430 | ) | ||||||
| Inventories |
2,968 | (10,896 | ) | 266 | ||||||||
| Prepaid expenses and other current assets |
(1,018 | ) | 390 | (1,526 | ) | |||||||
| Other assets |
(1,404 | ) | (805 | ) | 173 | |||||||
| Accounts payable |
(1,245 | ) | 3,351 | (370 | ) | |||||||
| Accrued liabilities |
5,567 | 1,124 | 2,318 | |||||||||
| Advances from customer |
— | (16 | ) | — | ||||||||
|
|
|
|
|
|
|
|||||||
| Net cash provided by operating activities |
44,420 | 7,892 | 20,178 | |||||||||
|
|
|
|
|
|
|
|||||||
| Cash flows from investing activities: |
||||||||||||
| Purchase of property and equipment |
(2,502 | ) | (2,176 | ) | (2,244 | ) | ||||||
| Proceeds from the sale of property and equipment |
188 | — | — | |||||||||
| Sale of available for sale investments |
15,176 | 15,675 | — | |||||||||
| Purchase of available for sale investments |
(10,025 | ) | (10,062 | ) | (14,898 | ) | ||||||
| Changes in restricted time deposits |
2 | 60 | (114 | ) | ||||||||
|
|
|
|
|
|
|
|||||||
| Net cash provided by (used in) investing activities |
2,839 | 3,497 | (17,256 | ) | ||||||||
|
|
|
|
|
|
|
|||||||
| Cash flows from financing activities: |
||||||||||||
| Proceeds from initial public offering and secondary offering, net of underwriter commissions |
77,904 | — | — | |||||||||
| Net proceeds from issuance of preferred stock |
499 | — | — | |||||||||
| Proceeds from issuance of common stock |
1,356 | 717 | 299 | |||||||||
| Offering costs |
(2,145 | ) | (1,388 | ) | — | |||||||
| Proceeds from long-term debt and capital lease obligations |
— | 43 | 5 | |||||||||
| Payments of long-term debt and capital lease obligations |
(25 | ) | (360 | ) | (778 | ) | ||||||
| Refund from refundable customer advances |
— | (4,000 | ) | — | ||||||||
|
|
|
|
|
|
|
|||||||
| Net cash provided by (used in) financing activities |
77,589 | (4,988 | ) | (474 | ) | |||||||
|
|
|
|
|
|
|
|||||||
| Net increase in cash and cash equivalents |
124,848 | 6,401 | 2,448 | |||||||||
| Cash and cash equivalents: |
||||||||||||
| Beginning of period |
$ | 28,795 | $ | 22,394 | $ | 19,946 | ||||||
|
|
|
|
|
|
|
|||||||
| End of period |
$ | 153,643 | $ | 28,795 | $ | 22,394 | ||||||
|
|
|
|
|
|
|
|||||||
| Supplemental disclosures of cash flow information: |
||||||||||||
| Cash paid for interest |
$ | 23 | $ | 16 | $ | 94 | ||||||
|
|
|
|
|
|
|
|||||||
| Cash paid for income taxes |
$ | 9,078 | $ | 7,735 | $ | 1,874 | ||||||
|
|
|
|
|
|
|
|||||||
| Noncash investing and financing activities: |
||||||||||||
| Unpaid accounts payable for property and equipment purchased |
$ | 274 | $ | 278 | $ | 144 | ||||||
|
|
|
|
|
|
|
|||||||
| Unrealized gain (loss) from available for sale investments |
$ | — | $ | 10 | $ | (9 | ) | |||||
|
|
|
|
|
|
|
|||||||
| Fixed assets acquired under capital leases |
$ | 40 | $ | 43 | $ | 5 | ||||||
|
|
|
|
|
|
|
|||||||
| Non-cash settlement of advances from customers |
$ | — | $ | — | $ | 4,393 | ||||||
|
|
|
|
|
|
|
|||||||
| Unpaid offering costs |
$ | 494 | $ | 23 | $ | — | ||||||
|
|
|
|
|
|
|
|||||||
| Reclassification of warrants from liabilities to equity |
$ | — | $ | 11,877 | $ | — | ||||||
|
|
|
|
|
|
|
|||||||
| Conversion of preferred stock to common stock upon initial public offering |
$ | 50,740 | $ | — | $ | — | ||||||
|
|
|
|
|
|
|
|||||||
See accompanying notes to the consolidated financial statements.
63
Table of Contents
InvenSense, Inc.
Notes to Consolidated Financial Statements
1. Organization and Summary of Significant Accounting Policies
Business
InvenSense, Inc. (“the Company”) was incorporated in California in June 2003 and reincorporated in Delaware in January 2004. The Company designs, develops, markets and sells MEMS gyroscopes for MotionTracking devices in consumer electronics and is dedicated to bringing the best-in-class size, performance and cost solutions to market. Targeting applications in video gaming devices, smartphones, tablet devices, digital still and video cameras, smart TVs, 3D mice, wearable health and fitness monitors, Optical Image Stabilization, and portable navigation devices, the Company delivers leading generation of motion interface solutions based on its advanced multi-axis gyroscope technology.
Certain Significant Business Risks and Uncertainties
The Company participates in the high-technology industry and believes that adverse changes in any of the following areas could have a material effect on the Company’s future financial position, results of operations, or cash flows: reliance on a limited number of primary customers to support the Company’s historical revenue generating activities; advances and trends in new technologies and industry standards; market acceptance of the Company’s products; development of sales channels; strategic relationships, including key component suppliers; litigation or claims against the Company based on intellectual property, patent, product, regulatory, or other factors; and the Company’s ability to attract and retain employees necessary to support its growth.
Basis of Consolidation
The Consolidated Financial Statements and related Notes include the accounts of InvenSense, Inc. (a Delaware corporation) and subsidiaries, InvenSense International, Inc. (Cayman Islands), InvenSense Taiwan Co., Ltd. (Taiwan), InvenSense Taiwan Sales Co., Ltd. (Taiwan), InvenSense G.K. (Japan), InvenSense Korea, Ltd. (Republic of Korea) InvenSense International FZE (United Arab Emirates), InvenSense China, Ltd. (China) and InvenSense Hong Kong Holding Limited (Hong Kong). InvenSense Taiwan Co., Ltd. personnel are primarily engaged in product testing, and the remaining foreign subsidiaries’ personnel primarily provide sales support to the Cayman Islands entity.
The Company incorporated “InvenSense International FZE” in Dubai under the laws of the United Arab Emirates on March 17, 2010, and $0.3 million of capital was invested on April 23, 2010. InvenSense International, Inc. was founded on May 26, 2010 under the laws of the Cayman Islands, and $2.5 million of capital was invested on August 11, 2010. Both companies are wholly owned subsidiaries of InvenSense, Inc. and have been established in connection with the expansion of the Company’s international operations.
All intercompany transactions and balances have been eliminated upon consolidation. The functional currency of each of the Company’s subsidiaries is the U.S. dollar. Foreign currency gains or losses are recorded as other expenses, net in the consolidated statements of income. During the fiscal year ended April 1, 2012 foreign currency losses were $43,000. During the fiscal year ended April 3, 2011, foreign currency gains were $24,000. During the fiscal year ended March 28, 2010 foreign currency losses were $8,000.
Fiscal Year
The Company’s fiscal year is a 52 or 53 week period ending on the Sunday closest to March 31. The Company’s three most recent fiscal years ended on April 1, 2012 (“Fiscal 2012” or “April 2012”), April 3, 2011 (“Fiscal 2011” or “April 2011”) and March 28, 2010 (“Fiscal 2010” or “March 2010”). Fiscal 2012 and Fiscal 2010 were comprised of 52 weeks and Fiscal 2011 was comprised of 53 weeks.
64
Table of Contents
InvenSense, Inc.
Notes to Consolidated Financial Statements—(Continued)
Use of Estimates
The preparation of the Company’s Consolidated Financial Statements and related Notes in conformity with accounting principles generally accepted in the United States of America (U.S. GAAP) requires management to make estimates and assumptions that affect the reported amounts of assets and liabilities and disclosure of contingent assets and liabilities at the date of the Consolidated Financial Statements and related Notes and the reported amounts of income and expenses during the reporting period. Significant estimates included in the Consolidated Financial Statements and related Notes include inventory valuation, preferred stock warrant valuation, warranty reserves, valuation allowance for deferred tax assets and valuation of common and preferred stock. These estimates are based upon information available as of the date of the consolidated financial statements, and actual results could differ from those estimates.
Cash Equivalents
The Company considers all highly liquid instruments acquired with an original maturity of three months or less when purchased to be cash equivalents. Cash and cash equivalents are stated at cost, which approximates their fair value.
Restricted Time Deposits
Restricted time deposits at both April 2012 and April 2011 include $0.2 million of restricted cash held in a certificate of deposit as security deposit for a facility lease, in addition to rental deposits held by the Company’s lessor at one of its international facilities.
Accounts Receivable
Trade accounts receivable are recorded at the invoiced amount, net of allowances for doubtful accounts and sales returns and allowances. The allowance for doubtful accounts is based on the Company’s assessment of the collectability of customer accounts. The Company periodically reviews the need for an allowance by considering factors such as historical experience, credit quality, the age of the accounts receivable balances and current economic conditions that may affect a customer’s ability to pay. As a result of the Company’s favorable collection experience and customer concentration, no allowance for doubtful accounts was necessary at April 2012 or April 2011. The reserve for sales returns and allowances is based on specific criteria including agreements to provide rebates and other factors known at the time, as well as estimates of the amount of goods shipped that will be returned. To determine the adequacy of the sales returns and allowances, the Company analyzes historical experience of actual returns as well as current product return information. During Fiscal 2012, Fiscal 2011, Fiscal 2010, the Company incurred charges (credits) related to its reserve for sales returns and allowances of $132,000, $428,000 and $193,000, respectively. At April 2012, April 2011 and March 2010, the balances for the reserve for sales returns and allowances were $nil, $85,000 and $193,000, respectively.
Segment Information
The Company operates in one operating segment by designing, developing, manufacturing and marketing linear and mixed-signal integrated circuits. The Chief Executive Officer has been identified as the Chief Operating Decision Maker as defined by Financial Accounting Standards Board’s Accounting Standards Codification (“ASC”) 280 “Segment Reporting”. Enterprise-wide information is provided in accordance with ASC 280. Geographical revenue information is based on customers’ ship-to location. Long-lived assets consist of property and equipment. Property and equipment information is based on the physical location of the assets at the end of each fiscal period.
65
Table of Contents
InvenSense, Inc.
Notes to Consolidated Financial Statements—(Continued)
Long-lived assets by country were as follows:
|
Country |
April 2012 | April 2011 | ||||||
| (in thousands) | ||||||||
| Taiwan |
$ | 2,930 | $ | 2,309 | ||||
| United States |
1,054 | 1,137 | ||||||
| Other |
27 | 46 | ||||||
|
|
|
|
|
|||||
| $ | 4,011 | $ | 3,492 | |||||
|
|
|
|
|
|||||
Net revenues from unaffiliated customers by country were as follows:
| Region |
Fiscal 2012 | Fiscal 2011 | Fiscal 2010 | |||||||||
| (in thousands) | ||||||||||||
| Japan |
$ | 54,754 | $ | 72,475 | $ | 70,958 | ||||||
| Korea |
39,827 | 3,536 | 467 | |||||||||
| Taiwan |
34,040 | 7,603 | 4,859 | |||||||||
| United States |
11,916 | 3,678 | 849 | |||||||||
| China |
11,855 | 6,929 | 2,160 | |||||||||
| Rest of World |
575 | 2,326 | 263 | |||||||||
|
|
|
|
|
|
|
|||||||
| $ | 152,967 | $ | 96,547 | $ | 79,556 | |||||||
|
|
|
|
|
|
|
|||||||
Available for Sale Investments
Available for sale investments consist of securities with original maturities between three and thirteen months. Investments which have maturities exceeding twelve months beyond the balance sheet date are classified as long-term investments in the Company’s consolidated balance sheets. The Company’s investments are classified as available for sale since the sale of these investments may be required prior to their stated maturity to implement management’s liquidity-related strategies. Available for sale securities are carried at fair value with temporary unrealized gains and losses, net of taxes, reported as a component of stockholders’ equity. During Fiscal 2012, Fiscal 2011 and Fiscal 2010, the Company recorded insignificant unrealized gains and losses, $10,000 unrealized gains and $9,000 unrealized losses, respectively, as a component of comprehensive income related to available for sale investments.
Available for sale investments are considered to be impaired when a decline in fair value is judged to be other than temporary. The Company considers available quantitative and qualitative evidence in evaluating potential impairment of its investments on a quarterly basis. If the cost of an investment exceeds its fair value, management evaluates, among other factors, general market conditions, the duration and extent to which the fair value is less than cost, and the Company’s intent and ability to hold the investment. Once a decline in fair value is determined to be other than temporary, an impairment charge is recorded and a new cost basis in the investment is established. During Fiscal 2012, Fiscal 2011 and Fiscal 2010, the Company did not incur any other than temporary impairments.
Impairment of Long Lived Assets
The Company regularly reviews the carrying amount of its long-lived assets, as well as the useful lives, to determine whether indicators of impairment may exist which warrant adjustments to carrying values or estimated useful lives. An impairment loss would be recognized when the sum of the expected future undiscounted net cash flows is less than the carrying amount of the asset. Should impairment exist, the impairment loss would be measured based on the excess of the carrying amount of the asset over the asset’s fair value. The Company has not recognized any impairment losses for Fiscal 2012, Fiscal 2011 or Fiscal 2010.
66
Table of Contents
InvenSense, Inc.
Notes to Consolidated Financial Statements—(Continued)
Concentration of Credit Risk
Financial instruments, which potentially subject the Company to concentrations of credit risk, consist primarily of cash, cash equivalents, investments, advances to vendors and accounts receivable. The Company limits exposure to credit loss by placing cash, cash equivalents and investments with major financial institutions within the United States that management assesses to be of high credit quality. The Company periodically reviews the credit worthiness of its customers and generally does not require collateral or other security to support accounts receivable. The Company has not experienced any losses on accounts receivables or on deposits of cash and cash equivalents.
At April 2012, five customers accounted for 18%, 17%, 13%, 12% and 10% of total accounts receivable. At April 2011, three customers accounted for 43%, 16% and 16% of total accounts receivable. No other customers accounts for more than 10% of total accounts receivable at April 2012 or April 2011.
For Fiscal 2012 three customers accounted for 31%, 15% and 12% of total net revenue. For Fiscal 2011 and Fiscal 2010, one customer accounted for 73% and 85% of total net revenue, respectively. No other customers accounted for more than 10% of total net revenue for Fiscal 2012, Fiscal 2011 or Fiscal 2010.
Research and Development
Research and development activities are expensed as incurred.
Comprehensive Income
ASC 220 “Comprehensive Income” establishes standards for the reporting and displaying of comprehensive income and its components. Comprehensive income includes certain changes in equity that are excluded from net income. Specifically, unrealized gains and losses are included in accumulated other comprehensive income. Comprehensive income has been reflected in the consolidated statements of stockholders’ equity and comprehensive income. During Fiscal 2012, Fiscal 2011 and Fiscal 2010, comprehensive income included a combination of the current period net income and unrealized gain (loss) on available for sale investments.
Inventories
Inventories are stated at the lower of cost or market on a first-in, first-out basis. Inventories include finished good parts that may be specialized in nature and subject to rapid obsolescence. The Company periodically reviews the quantities and carrying values of inventories to assess whether the inventories are recoverable. The costs associated with write-downs of inventory for excess quantity and technological obsolescence are charged to cost of revenue as incurred.
Property and Equipment, net
Property and equipment, net are stated at cost and are depreciated using the straight-line method over the estimated useful lives of the assets. The estimated useful lives are as follows: production and lab equipment—three to five years, computer equipment and software—three years, and leasehold improvements—over the shorter of the estimated useful life or the remaining lease term.
67
Table of Contents
InvenSense, Inc.
Notes to Consolidated Financial Statements—(Continued)
Warranty
The Company’s warranty agreements are contract and component specific and can range from ninety days to three years for selected components. The Company accrues for anticipated warranty costs upon shipment based on the number of shipped units, historical analysis of the volume of product returned under the warranty program and management’s judgment regarding anticipated rates of warranty claims and associated repair costs. The following table summarizes the activity related to the product warranty liability during Fiscal 2012, Fiscal 2011 and Fiscal 2010:
| Fiscal 2012 | Fiscal 2011 | Fiscal 2010 | ||||||||||
| (in thousands) | ||||||||||||
| Beginning balance |
$ | 697 | $ | 480 | $ | 174 | ||||||
| Provision for warranty |
(246 | ) | 769 | 429 | ||||||||
| Less: actual warranty costs |
(90 | ) | (552 | ) | (123 | ) | ||||||
|
|
|
|
|
|
|
|||||||
| Ending balance |
$ | 361 | $ | 697 | $ | 480 | ||||||
|
|
|
|
|
|
|
|||||||
Revenue Recognition
Revenue from the sale of the Company’s products is recognized when all of the following four criteria are met: (1) persuasive evidence of an arrangement exists; (2) the product has been delivered; (3) the price is fixed or determinable; and (4) collection is reasonably assured. Delivery takes place after the transfer of title which historically has occurred upon shipment of the product unless otherwise stated in the customer agreement.
For direct customers (i.e., other than distributors), the Company recognizes revenue when title to the product is transferred to the customer, which occurs upon shipment or delivery, depending upon the terms of the customer order.
The Company enters into sales transactions with distributors that it has established as either stocking distributors or non-stocking distributors. Non-stocking distributor sales transactions are those in which the distributor is purchasing product for an identified end-customer. In sales transactions with non-stocking distributors, the Company recognizes net revenue upon either shipment or delivery to the non-stocking distributor, depending upon the terms of the order. Pursuant to terms and conditions contained in the agreement with these distributors, all sales to non-stocking distributors are non-refundable and they do not have rights to return product purchases except under the Company’s standard warranty terms. In addition, the Company does not provide any price concessions or price protection on shipments made to non-stocking distributors.
Stocking distributor sales transactions are those in which the distributor is purchasing product for resale to their customer. For stocking distributor sales transactions, the Company sells its products under distributor agreements that provide for return rights and price protection. When the stocking distributors hold inventory prior to resale to their customers, the Company’s management has concluded it is unable to reasonably estimate sales returns or price protection adjustments under its distributor arrangements; accordingly, net revenue and related cost of revenue on shipments to distributors are deferred until the distributor reports that the product has been sold to an end customer (“sell through net revenue accounting”). Under sell through net revenue accounting, accounts receivable are recognized and inventory is relieved upon shipment to the distributor as title to the inventory is transferred upon shipment, at which point the Company has a legally enforceable right to collection under normal terms. The associated net revenue and cost of revenue are deferred by recording “deferred income” (gross profit margin on these sales) as included within “Accrued liabilities” and “Prepaid expenses and other current assets,” respectively, on the consolidated balance sheets. Gross profit margin on these sales at April 2012 and April 2011 were $235,000 and $64,000, respectively. When the related product is reported as having been
68
Table of Contents
InvenSense, Inc.
Notes to Consolidated Financial Statements—(Continued)
sold by the Company’s distributors to their end customers (“sold through”), the Company recognizes previously deferred income as net revenue and cost of revenue.
Income Taxes
The Company accounts for income taxes in accordance with ASC 740-10 “Income Taxes,” which requires the asset and liability approach and the recognition of taxes payable or refundable for the current year and deferred tax liabilities and assets for future tax consequences of events that have been recognized in the Company’s Consolidated Financial Statements and related Notes or tax returns. The measurement of current and deferred tax liabilities and assets are based on provisions of the enacted laws; the effects of future changes in tax laws or rates are not anticipated. Deferred tax assets are reduced, if necessary, by the amount of any tax benefits that, based on available evidence, are not expected to be realized. Valuation allowances are established when necessary to reduce deferred tax assets to the amount that is more likely than not to be realized.
ASC 740-10 also prescribes a recognition threshold and measurement attribute for the financial statement recognition and measurement of a tax position taken or expected to be taken in a tax return. ASC 740-10 also provides guidance on de-recognition, classification, interest and penalties, accounting in interim periods, disclosure and transition. The Company’s policy is to recognize interest and penalties related to unrecognized tax benefits in income tax provision. See Note 7 for additional information, including the effects of adoption on the Company’s consolidated financial position, results of operations and cash flows.
Stock-Based Compensation
The Company applies the provisions of ASC 718-10 “Compensation—Stock Compensation” using the modified prospective method. ASC 718-10 establishes accounting for stock-based awards based on the fair value of the award measured at grant date. Accordingly, stock-based compensation cost is recognized in the consolidated statements of income as a component of both cost of revenue and operating expenses over the requisite service period.
At April 2011, the Company had one stock option plan, the 2004 Equity Incentive Plan. In July 2011, the Company’s Board of Directors and its stockholders approved the establishment of the 2011 Stock Incentive Plan (see Note 6). The fair value of stock options granted or modified is recognized as compensation expense using the Black-Scholes option pricing model, single option approach. The Company determines the fair value of stock-based payment awards on the date of grant using complex and subjective variables, including expected term and stock price volatility over the expected term of the awards, and other less subjective variables such as risk-free interest rate and dividend rate (see Note 6).
Financial Instruments with Characteristics of Both Liabilities and Equity
The Company calculated the fair value of warrants by utilizing the Black-Scholes option pricing model. Prior to June 25, 2010, under both ASC 815-40 and ASC 480 “Distinguishing Liabilities from Equity,” the warrants were marked to market as of the end of each reporting period with changes in the fair value being recorded within the change in fair value of warrant liabilities line item in the Company’s consolidated statements of income.
Effective June 25, 2010, the Company amended its Second Amended and Restated Certificate of Incorporation (as amended, the “Certificate of Incorporation”) to remove the provisions that had previously resulted in the outstanding preferred stock warrants being classified as a long-term liability under
69
Table of Contents
InvenSense, Inc.
Notes to Consolidated Financial Statements—(Continued)
ASC 815-40-15. Under ASC 815-40-15, on the date of amendment, the warrants were considered to be indexed to the Company’s stock and accordingly the total warrants liability of $11.9 million was reclassified into stockholders’ equity.
Deferred Offering Costs
Costs directly associated with the Company’s initial public offering (“IPO”) were capitalized and are included in other assets on the Company’s consolidated balance sheets. The Company filed its initial registration statement with the SEC on June 28, 2010. Deferred offering costs of $1.4 million were expensed in Fiscal 2011 (included in selling, general and administrative expenses on the consolidated statements of income) after the IPO had been postponed for more than 90 days. Deferred offering costs relating to the registration statement were $23,000 at April 2011. Upon completion of the Company’s IPO in November 2011, deferred offering costs of $2.1 million were recorded as a reduction of the proceeds received in arriving at the amount recorded in stockholders’ equity. There were no deferred offering costs associated with the Company’s IPO capitalized and included in other assets at April 2012.
Upon completion of the Company’s offering in March 2012, offering costs of $0.6 million were recorded as a reduction of the proceeds received in arriving at the amount recorded in stockholders’ equity. There were insignificant deferred offering costs related to this offering at April 2012.
Net Income Per Share
Basic and diluted net income per common share are presented in conformity with the two-class method required for participating securities for the period prior to their conversion upon the IPO in November 2011, when all preferred shares were converted to common stock.
Prior to the IPO, holders of Series C convertible preferred stock (“Series C”) were entitled to receive noncumulative dividends at the annual rate of $0.09840 per share prior to the payment of dividends on any other shares of the Company’s stock. Once the payment of Series Chad been completed, holders of Series A convertible preferred stock (“Series A”) would have been entitled to receive noncumulative dividends at the annual rate of $0.08000 per share of Series A and Series B convertible preferred stock (“Series B”) would have been entitled to receive noncumulative dividends at the annual rate of $0.14864 per share, payable on a pari passu basis, prior and in preference to any dividends on any other shares of the Company’s common stock. In the event a dividend were paid on common stock, Series A, Series B and Series C stockholders would have been entitled to a proportionate share of any such dividend as if they were holders of common stock (on an as-if converted basis).
Under the two-class method, net income allocable to common stockholders is determined by allocating undistributed earnings, calculated as net income less current period non-cumulative dividends allocable to Series A, Series B and Series C stockholders, between common stock and Series A, Series B and Series C for the period prior to their conversion upon the Company’s initial public offering. In computing diluted net income attributed to common stockholders, undistributed earnings are reallocated to reflect the potential impact of dilutive securities. Basic net income per common share is computed by dividing the net income allocable to common stockholders by the weighted average number of common shares outstanding during the period, which excludes dilutive unvested restricted stock.
Diluted net income per share allocable to common stockholders is computed by dividing the net income allocable to common stockholders by the weighted average number of common shares outstanding, including
70
Table of Contents
InvenSense, Inc.
Notes to Consolidated Financial Statements—(Continued)
unvested restricted stock, certain preferred stock warrants, (which were converted into common stock warrants at the completion of the Company’s IPO), and potential dilutive common shares assuming the dilutive effect of outstanding stock options using the treasury stock method.
The following table presents the calculation of basic and diluted net income per share:
| Fiscal 2012 |
Fiscal 2011 |
Fiscal 2010 |
||||||||||
| (in thousands, except per share data) | ||||||||||||
| Net income allocable to common stockholders: |
||||||||||||
| Numerator: |
||||||||||||
| Basic: |
||||||||||||
| Net income |
$ | 36,947 | $ | 9,347 | $ | 15,142 | ||||||
| Non-cumulative dividends on convertible preferred stock |
(1,915 | ) | (3,046 | ) | (3,046 | ) | ||||||
| Undistributed earnings allocable to convertible preferred stockholders |
(18,703 | ) | (4,670 | ) | (9,104 | ) | ||||||
|
|
|
|
|
|
|
|||||||
| Net income allocable to common stockholders—basic |
$ | 16,329 | $ | 1,631 | $ | 2,992 | ||||||
|
|
|
|
|
|
|
|||||||
| Diluted: |
||||||||||||
| Net income |
$ | 36,947 | $ | 9,347 | $ | 15,142 | ||||||
| Non-cumulative dividends on convertible preferred stock |
(1,967 | ) | (3,147 | ) | (3,147 | ) | ||||||
| Undistributed earnings allocable to convertible preferred stockholders |
(17,600 | ) | (4,342 | ) | (8,542 | ) | ||||||
|
|
|
|
|
|
|
|||||||
| Net income allocable to common stockholders—diluted |
$ | 17,380 | $ | 1,858 | $ | 3,453 | ||||||
|
|
|
|
|
|
|
|||||||
| Denominator: |
||||||||||||
| Basic shares: |
||||||||||||
| Weighted average shares used in computing basic net income per common share |
41,614 | 17,592 | 16,542 | |||||||||
|
|
|
|
|
|
|
|||||||
| Diluted shares: |
||||||||||||
| Weighted average shares used in computing basic net income per common share |
41,614 | 17,592 | 16,542 | |||||||||
| Effect of potentially dilutive securities: |
||||||||||||
| Stock options and unvested restricted stock |
5,229 | 4,610 | 4,325 | |||||||||
| Common stock warrants |
168 | — | — | |||||||||
|
|
|
|
|
|
|
|||||||
| Weighted average shares used in computing diluted net income per common share |
47,011 | 22,202 | 20,867 | |||||||||
|
|
|
|
|
|
|
|||||||
| Net income per common share: |
||||||||||||
| Basic |
$ | 0.39 | $ | 0.09 | $ | 0.18 | ||||||
| Diluted |
$ | 0.37 | $ | 0.08 | $ | 0.17 | ||||||
The following summarizes the potentially dilutive securities outstanding at the end of each period that were excluded from the computation of diluted net income per common share for the periods presented as their effect would have been antidilutive:
| Fiscal 2012 |
Fiscal 2011 |
Fiscal 2010 |
||||||||||
| (in thousands) | ||||||||||||
| Employee stock options |
3,365 | 1,645 | 2,526 | |||||||||
| Unvested restricted stock units |
2 | — | — | |||||||||
|
|
|
|
|
|
|
|||||||
| Total antidilutive securities |
3,367 | 1,645 | 2,526 | |||||||||
|
|
|
|
|
|
|
|||||||
Recent Accounting Pronouncements
In May 2011, the FASB issued ASU No. 2011-04, “Amendments to Achieve Common Fair Value Measurements and Disclosure Requirements in U.S. GAAP and IFRSs.” ASU No. 2011-04 amended ASC 820, Fair Value Measurements and Disclosures, to converge the fair value measurement guidance in U.S. GAAP and International Financial Reporting Standards (IFRSs). Some of the amendments clarify the application of existing fair value measurement requirements, while other amendments change particular principles in ASC 820. In addition, ASU No. 2011-04 requires additional fair value disclosures. The amendments are to be applied prospectively and are effective for interim and annual periods beginning after December 15, 2011, which is the Company’s fourth quarter of Fiscal 2012. Other than requiring additional disclosures, the adoption of this new
71
Table of Contents
InvenSense, Inc.
Notes to Consolidated Financial Statements—(Continued)
guidance did not have a material impact on the Company’s consolidated results of operations and financial position.
In June 2011, the FASB issued ASU No. 2011-05, “Presentation of Comprehensive Income”. ASU No. 2011-05 amended ASC 320, “Comprehensive Income, to converge the presentation of comprehensive income between U.S GAAP and IFRS.” ASU No. 2011-05 requires that all non-owner changes in stockholders’ equity be presented in either a single continuous statement of comprehensive income or in two separate but consecutive statements and requires reclassification adjustments for items that are reclassified from other comprehensive income to net income in the statement(s) where the components of net income and the components of other comprehensive income are presented. ASU No. 2011-05 eliminates the option to present the components of other comprehensive income as part of the statement in changes of stockholders equity. ASU 2011-05 is effective for fiscal years, and interim periods within those years, beginning after December 15, 2011, which will be the Company’s fiscal interim period ended July 1, 2012 of fiscal year ending March 31, 2013. The adoption of ASU No. 2011-05 will affect the presentation of comprehensive income but will not impact the Company’s financial condition or results of operations.
2. Fair Value of Financial Instruments
The Company applies the provisions of ASC 820-10 for fair value measurements. Fair value is defined as the price that would be received to sell an asset or paid to transfer a liability (i.e., the “exit price”) in an orderly transaction between market participants at the measurement date. As such, fair value is a market-based measurement that should be determined based on assumptions that market participants would use in pricing an asset or liability. ASC 820-10 requires disclosure that establishes a framework for measuring fair value and expands disclosure about fair value measurements. The standard describes a fair value hierarchy based on three levels of inputs that may be used to measure fair value. The inputs for the first two levels are considered observable and the last is unobservable and include the following:
Level 1—Unadjusted quoted prices in active markets that are accessible at the measurement date for identical, unrestricted assets or liabilities;
Level 2—Quoted prices in markets that are not active, or inputs which are observable, either directly or indirectly, for substantially the full term of the asset or liability; or
Level 3—Unobservable inputs in which there is little or no market data, and as a result, prices or valuation techniques are employed that require inputs that are significant to the fair value measurement.
This hierarchy requires the Company to use observable market data, when available, and to minimize the use of unobservable inputs when determining fair value. On a recurring basis, the Company measures certain financial assets and liabilities at fair value. The Company chose not to elect the fair value option as prescribed by ASC 825-10-05 “Fair Value Option” for its financial assets and liabilities that had not been previously carried at fair value. Therefore, financial assets and liabilities not carried at fair value, such as accounts payable, are still reported at their carrying values.
Cash Equivalents and Available for Sale Investments
At April 1, 2012, of the $153.6 million of the Company’s cash and cash equivalents, $135.0 million was cash and $18.6 million was cash equivalents invested in money market funds. As of April 1, 2012, $29.3 million of the $153.6 million of cash and cash equivalents were held by our foreign subsidiaries. If these funds are needed for our operations in the United States, the Company would be required to accrue and pay U.S. taxes to repatriate these funds. However, the Company’s intent is to indefinitely reinvest these funds outside of the
72
Table of Contents
InvenSense, Inc.
Notes to Consolidated Financial Statements—(Continued)
United States, and the Company’s current plans do not demonstrate a need to repatriate them to fund U.S. operations. Additionally, the Company had available for sale investments totaling $4.1 million. As shown in the table below, the money market funds as well as the U.S Treasury investments held by the Company were classified as Level 1 assets. The U.S. Agency Securities investments were classified as Level 2 assets where the fair value was determined from non-binding market consensus prices that are corroborated by observable market data.
At April 3, 2011, of the $28.8 million of the Company’s cash and cash equivalents, $15.1 million was cash and $13.7 million was cash equivalents invested in money market funds. Additionally, the Company had available for sale investments totaling $9.3 million. As shown in the table below, the money market funds as well as the U.S. Treasury investments held by the Company were classified as Level 1 assets. The U.S. Agency Securities investments were classified as Level 2 assets where the fair value was determined from non-binding market consensus prices that are corroborated by observable market data.
Fair value measurements at each reporting date were as follows:
April 2012:
Assets measured at fair value on a recurring basis were presented in the Company’s consolidated balance sheet as of April 1, 2012.
| April 2012 Balance |
Quoted Prices in Active Markets for Identical Assets Level 1 |
Significant Other Observable Inputs Level 2 |
Significant Other Unobservable Inputs Level 3 |
|||||||||||||
| (in thousands) | ||||||||||||||||
| Money Market Funds |
$ | 17,712 | $ | 17,712 | $ | — | $ | — | ||||||||
| U.S. Treasury |
1,000 | 1,000 | — | — | ||||||||||||
| U.S. Agency Securities |
3,979 | — | 3,979 | — | ||||||||||||
|
|
|
|
|
|
|
|
|
|||||||||
| Total |
$ | 22,691 | $ | 18,712 | $ | 3,979 | $ | — | ||||||||
|
|
|
|
|
|
|
|
|
|||||||||
| Cash equivalents |
$ | 18,562 | $ | 17,712 | $ | 850 | $ | — | ||||||||
| Short-term investments |
4,129 | 1,000 | 3,129 | — | ||||||||||||
|
|
|
|
|
|
|
|
|
|||||||||
| Total |
$ | 22,691 | $ | 18,712 | $ | 3,979 | $ | — | ||||||||
|
|
|
|
|
|
|
|
|
|||||||||
| April 2012 Amortized Cost |
Unrealized Gain |
April 2012 Estimated FMV |
||||||||||||||
| (in thousands) | ||||||||||||||||
| U.S. Treasury |
$ | 1,000 | $ | — | $ | 1,000 | ||||||||||
| U.S. Agency Securities |
3,129 | — | 3,129 | |||||||||||||
|
|
|
|
|
|
|
|||||||||||
| Total Available for Sale Investments |
$ | 4,129 | $ | — | $ | 4,129 | ||||||||||
|
|
|
|
|
|
|
|||||||||||
| Cash |
135,081 | |||||||||||||||
| Cash equivalents |
18,562 | |||||||||||||||
|
|
|
|||||||||||||||
| Total Aggregate Fair Value |
$ | 157,772 | ||||||||||||||
|
|
|
|||||||||||||||
There were no transfers of assets measured at fair value between Level 1 and Level 2 during Fiscal 2012.
73
Table of Contents
InvenSense, Inc.
Notes to Consolidated Financial Statements—(Continued)
April 2011:
Assets measured at fair value on a recurring basis were presented in the Company’s consolidated balance sheet as of April 3, 2011.
| April 2011 Balance |
Quoted Prices in Active Markets for Identical Assets Level 1 |
Significant Other Observable Inputs Level 2 |
Significant Other Unobservable Inputs Level 3 |
|||||||||||||
| (in thousands) | ||||||||||||||||
| Money Market Funds |
$ | 11,670 | $ | 11,670 | $ | — | $ | — | ||||||||
| U.S. Treasury |
7,093 | 7,093 | — | — | ||||||||||||
| U.S. Agency Securities |
4,187 | — | 4,187 | — | ||||||||||||
|
|
|
|
|
|
|
|
|
|||||||||
| Total |
$ | 22,950 | $ | 18,763 | $ | 4,187 | $ | — | ||||||||
|
|
|
|
|
|
|
|
|
|||||||||
| Cash equivalents |
$ | 13,670 | $ | 11,670 | $ | 2,000 | $ | — | ||||||||
| Short-term investments |
9,280 | 7,093 | 2,187 | — | ||||||||||||
|
|
|
|
|
|
|
|
|
|||||||||
| Total |
$ | 22,950 | $ | 18,763 | $ | 4,187 | $ | — | ||||||||
|
|
|
|
|
|
|
|
|
|||||||||
| April 2011 Amortized Cost |
Unrealized Gain |
April 2011 Estimated FMV |
||||||||||||||
| (in thousands) | ||||||||||||||||
| U.S. Treasury |
$ | 7,093 | $ | — | $ | 7,093 | ||||||||||
| U.S. Agency Securities |
2,177 | 10 | 2,187 | |||||||||||||
|
|
|
|
|
|
|
|||||||||||
| Total Available for Sale Investments |
$ | 9,270 | $ | 10 | $ | 9,280 | ||||||||||
|
|
|
|
|
|
|
|||||||||||
| Cash |
15,125 | |||||||||||||||
| Cash equivalents |
13,670 | |||||||||||||||
|
|
|
|||||||||||||||
| Total Aggregate Fair Value |
$ | 38,075 | ||||||||||||||
|
|
|
|||||||||||||||
There were no transfers of assets measured at fair value between Level 1 and Level 2 during Fiscal 2011.
Preferred Stock Warrants—As explained in Note 6, as of the first day of Fiscal 2010, the Company adopted ASC 815-40-15. The Company calculated the fair value of the preferred stock warrants by utilizing the Black-Scholes option pricing model. The adoption of this authoritative guidance resulted in a reclassification of the estimated fair value of outstanding warrants from stockholders’ equity to a liability for Fiscal 2010. Additionally, the warrants were marked to market through June 25, 2010, with changes in the fair value being recorded within the change in fair value of warrants liability line item in the Company’s consolidated statements of income. The use of the Black-Scholes option pricing model is deemed a “Level 3” valuation method. On June 25, 2010, the Company amended its Certificate of Incorporation to remove the provisions that had previously resulted in the outstanding preferred stock warrants being classified as a long-term liability under ASC 815-40-15. (See Note 6.) Under ASC 815-40-15, on the date of amendment, the warrants were considered to be indexed to the Company’s stock, and accordingly, the total warrants liability of $11.9 million was reclassified and included in stockholders’ equity in Fiscal 2011.
The following table provides a roll-forward of the fair value of the preferred stock warrant liability categorized with Level 3 inputs:
| Quoted Prices in Active Markets for Identical Assets Level 1 |
Significant Other Observable Inputs Level 2 |
Significant Other Unobservable Inputs Level 3 |
||||||||||
| (in thousands) | ||||||||||||
| Preferred stock warrant liability, March 28, 2010 |
$ | — | $ | — | $ | 7,852 | ||||||
| Increase in fair value |
— | — | 4,025 | |||||||||
| Reclassified to preferred stockholders’ equity |
— | — | (11,877 | ) | ||||||||
|
|
|
|
|
|
|
|||||||
| Preferred stock warrant liability — April 3, 2011 and April 1, 2012 |
$ | — | $ | — | $ | — | ||||||
|
|
|
|
|
|
|
|||||||
74
Table of Contents
InvenSense, Inc.
Notes to Consolidated Financial Statements—(Continued)
3. Balance Sheet Details
Inventories
Inventories at April 2012 and April 2011 consist of the following:
| April 2012 | April 2011 | |||||||
| (in thousands) | ||||||||
| Work in progress |
$ | 9,021 | $ | 13,258 | ||||
| Finished goods |
3,219 | 1,950 | ||||||
|
|
|
|
|
|||||
| Total Inventory |
$ | 12,240 | $ | 15,208 | ||||
|
|
|
|
|
|||||
Prepaid Expenses and Other Current Assets
Prepaid expenses and other current assets at April 2012 and April 2011 consist of the following:
| April 2012 | April 2011 | |||||||
| (in thousands) | ||||||||
| Prepaid expenses |
$ | 1,040 | $ | 756 | ||||
| Advance to vendors |
548 | 455 | ||||||
| Tax receivable |
1,106 | 458 | ||||||
| Deferred tax assets |
1,418 | 553 | ||||||
| Other current assets |
76 | 27 | ||||||
|
|
|
|
|
|||||
| Total prepaid expenses and other current assets |
$ | 4,188 | $ | 2,249 | ||||
|
|
|
|
|
|||||
The Company has signed agreements with four major foundry vendors to facilitate and expand their capacity for the Company’s products. The Company paid $1.7 million, $0.5 million and $1.3 million, respectively, in advance payments to certain of these foundry vendors in Fiscal 2012, Fiscal 2011 and Fiscal 2010. These advances have been partially offset by the purchases from these vendors. The agreements allow the Company to offset these advances against wafer purchases from the foundries at various agreed upon rates. The Company believes that the advances to these vendors will be fully offset by future purchases from these vendors.
Property and Equipment
Property and equipment at April 2012 and April 2011 consist of the following:
| April 2012 | April 2011 | |||||||
| (in thousands) | ||||||||
| Production and lab equipment |
$ | 6,866 | $ | 5,573 | ||||
| Computer equipment and software |
861 | 605 | ||||||
| Equipment under construction |
435 | 305 | ||||||
| Leasehold improvements and furniture and fixtures |
819 | 692 | ||||||
|
|
|
|
|
|||||
| Subtotal |
$ | 8,981 | $ | 7,175 | ||||
| Accumulated depreciation and amortization |
(4,970 | ) | (3,683 | ) | ||||
|
|
|
|
|
|||||
| Property and equipment—net |
$ | 4,011 | $ | 3,492 | ||||
|
|
|
|
|
|||||
Depreciation and amortization expense for Fiscal 2012, Fiscal 2011 and Fiscal 2010 was $2.0 million, $1.8 million and $1.8 million, respectively. Equipment under construction consists primarily of production and lab equipment. Equipment under construction is not subject to depreciation until it is available for its intended use. Capitalized leases consist of office equipment. During Fiscal 2012, Fiscal 2011 and Fiscal 2010, new capitalized leases totaled $40,000, $43,000 and $5,000, respectively.
75
Table of Contents
InvenSense, Inc.
Notes to Consolidated Financial Statements—(Continued)
Accrued Liabilities
Accrued liabilities at April 2012 and April 2011 consist of the following:
| April 2012 | April 2011 | |||||||
| (in thousands) | ||||||||
| Engineering services |
$ | 104 | $ | 187 | ||||
| Payroll-related expenses |
2,274 | 1,390 | ||||||
| Bonus |
3,571 | 1,091 | ||||||
| Legal fees |
968 | 433 | ||||||
| Warranty reserves |
361 | 697 | ||||||
| Deferred revenue |
284 | 64 | ||||||
| Income tax payable |
27 | 144 | ||||||
| Other |
137 | 301 | ||||||
|
|
|
|
|
|||||
| Total accrued liabilities |
$ | 7,726 | $ | 4,307 | ||||
|
|
|
|
|
|||||
4. Long-Term Debt
At April 2012, long-term debt consisted of capitalized leases for office equipment payable through Fiscal 2015.
Long-term debt at April 2012 and April 2011 consists of the following:
| April 2012 | April 2011 | |||||||
| (in thousands) | ||||||||
| Capital lease obligations |
$ | 50 | $ | 34 | ||||
| Less: current portion |
28 | 18 | ||||||
|
|
|
|
|
|||||
| Total long-term debt |
$ | 22 | $ | 16 | ||||
|
|
|
|
|
|||||
Annual maturities of long-term debt at April 2012 are as follows:
| Fiscal Year Ending April | April 2012 | |||
| (in thousands) | ||||
| 2012 |
$ | — | ||
| 2013 |
28 | |||
| 2014 |
13 | |||
| 2015 |
9 | |||
|
|
|
|||
| $ | 50 | |||
|
|
|
|||
5. Commitments and Contingencies
Operating Lease Obligations
The Company has non-cancelable operating leases for its facilities through Fiscal year 2015.
Future minimum lease payments under operating leases as of April 1, 2012 are as follows:
| Fiscal Years Ending March or April |
Amount | |||
| (in thousands) | ||||
| 2013 |
$ | 671 | ||
| 2014 |
240 | |||
| 2015 |
153 | |||
|
|
|
|||
| Total |
$ | 1,064 | ||
|
|
|
|||
The Company’s lease agreements provide for rental payments which have certain lease incentives and graduated rental payments. As a result, the rent expense is recognized on a straight-line basis over the term of the
76
Table of Contents
InvenSense, Inc.
Notes to Consolidated Financial Statements—(Continued)
lease. The Company’s rental expense under operating leases was approximately $1.7 million, $0.9 million and $0.7 million for Fiscal 2012, Fiscal 2011 and Fiscal 2010, respectively.
Purchase Commitments
The Company has non-cancelable purchase commitments with its foundry vendors. Future minimum payments under the purchase commitments as of April 1, 2012 are as follows:
| Fiscal Years Ending March or April |
Amount | |||
| (in thousands) | ||||
| 2013 |
$ | 26,698 | ||
| Beyond 2013 |
— | |||
|
|
|
|||
| Total |
$ | 26,698 | ||
|
|
|
|||
401(k) Savings Plan
In November 2004, the Company established a defined contribution savings plan under Section 401(k) of the Internal Revenue Code. This plan covers substantially all employees who meet minimum age and service requirements and allows participants to defer a portion of their annual compensation on a pretax basis. The Company contributions to the plan may be made at the discretion of the Board of Directors. To date, no contributions have been made to the plan by the Company.
Legal Proceedings
The Company is subject to various legal proceedings and claims arising in the ordinary course of business. Although occasional adverse decisions or settlements may occur, management believes that the final disposition of such matters will not have a material effect on the Company’s business, financial position, results of operations or cash flows.
On May 16, 2012, STMicroelectronics, Inc. (“STI”) filed a patent infringement complaint in the Northern District of California against the Company, alleging infringement of U.S. Patent Nos. 6,504,253; 6,846,690; 6,405,592; 6,546,799; 6,928,872; 7,450,332; 7,409,291; 5,874,850; and 5,986,861 (collectively, the “Asserted Patents”). STI alleges that certain lnvenSense Micro-Electro-Mechanical Systems products and services, including but not limited to InvenSense's ITG-3200, MPU-6050, IDG-500, and IMU-3000 product lines, infringe one or more claims of the Asserted Patents. As this litigation has only recently been initiated, the Company believes it is not yet possible to assess the merits of the plaintiffs claim and or the amount of damages, if any, that could be awarded in the event of an unfavorable outcome. The Company intends to contest the case vigorously.
On July 20, 2010, plaintiff Wacoh Company filed a complaint in the District of Delaware against the Company and four other companies in the business of making gyroscopes for various applications, alleging infringement of U.S. Patent Nos. 6,282,956 and 6,865,943. The complaint sought unspecified monetary damages, costs, attorneys’ fees and other appropriate relief. In January 2012, the Company prevailed on a motion to sever the case against it from the cases against other companies and to transfer the case to the Northern District of California. The Company intends to continue to contest the case vigorously. The Company’s management believes that this lawsuit has no merit and believes that the overall outcome of this complaint will not have a material effect on the Company’s business, financial position, results of operations, or cash flows.
77
Table of Contents
InvenSense, Inc.
Notes to Consolidated Financial Statements—(Continued)
The Company indemnifies certain customers, distributors, suppliers and subcontractors for attorney fees and damages and costs awarded against such parties in certain circumstances in which the Company’s products are alleged to infringe third-party intellectual property rights, including patents, registered trademarks or copyrights. There were no indemnification costs in Fiscal 2012 or Fiscal 2011. Indemnification costs are charged to operations as incurred.
The Company’s Third Amended and Restated Bylaws require the Company to indemnify its directors and officers and employees to the fullest extent permitted by the Delaware General Corporation Law (DGCL). In addition, certain of the Company’s current directors, including the Company’s chief executive officer have entered into separate indemnification agreements with the Company. The Company’s Second Amended and Restated Certificate of Incorporation, as amended, limits the liability of directors to the Company or its stockholders to the fullest extent permitted by the DGCL. The obligation to indemnify generally means that the Company is required to pay or reimburse the individuals’ reasonable legal expenses and possibly damages and other liabilities incurred in connection with these matters.
6. Stockholders’ Equity
In connection with the completion of the IPO, all outstanding shares of convertible preferred stock were converted into the Company’s common stock. As a result, following the IPO, the Company has no outstanding shares of convertible preferred stock as of April 2012.
Preferred Stock Warrants
The Company adopted ASC 815-40-15 effective on March 30, 2009 (the first day of Fiscal 2010). Under the provisions of ASC 815, the Company records increases or decreases in fair value at each balance sheet date of the preferred stock warrant liability in the condensed consolidated statements of income.
During the first quarter of Fiscal 2011, the Company recorded an increase in the change in fair value of the warrants of $4,025,000. On June 25, 2010, the Company amended its Certificate of Incorporation to remove the provisions that had previously resulted in the outstanding preferred stock warrants being classified as a long-term liability under ASC 815-40-15. On the date of this amendment, the warrants were considered, under ASC 815-40-15, to be indexed to the Company’s stock and accordingly, the fair value of the warrant liability on the date of the amendment, $11,877,000, was reclassified into stockholders’ equity (as a component of the series of preferred stock into which the warrants were exercisable).
As of March 28, 2010 and June 25, 2010 (the date of amendment of the Certificate of Incorporation), the fair value of the above warrants using the Black-Scholes option pricing model and underlying assumptions was as follows:
| As of Year-End March 28, 2010 |
As of June 25, 2010 | |||||||
| Series A | Series B | Series A | Series B | |||||
| Warrant valuations (in thousands) |
$703 | $7,149 | $1,049 | $10,828 | ||||
| Risk-free interest rate |
1.7% | 1.7% - 2.6% | 1.1% | 1.1% - 1.9% | ||||
| Life (years) |
2.8 | 3.0 - 5.0 | 2.5 | 2.8 - 4.8 | ||||
| Volatility |
54.9% | 49.7% - 53.9% | 53.4% | 49.2% - 52.6% | ||||
| Expected dividends |
0% | 0% | 0% | 0% | ||||
| Fair value of preferred stock |
$12.67 | $12.67 | $18.45 | $18.45 | ||||
78
Table of Contents
InvenSense, Inc.
Notes to Consolidated Financial Statements—(Continued)
The Company determined that the use of a Black-Scholes option pricing model was appropriate in determining the fair value of the warrants in light of management’s determination, at each of the above dates, that the likelihood of raising equity at a price below the previous rounds of equity was remote in light of a number of factors including the Company’s historical operating income, which has provided cash flows from operating activities.
Upon completion of the IPO, the outstanding warrants to purchase convertible preferred stock were converted into warrants to purchase common stock.
Stock Plans
In July 2011, the Company’s Board of Directors and its stockholders approved the establishment of the 2011 Stock Incentive Plan (the “2011 Plan”). As of April 1, 2012, the Company has reserved for issuance under the 2011 Plan a total of 10.5 million shares, plus any additional shares that would otherwise return to the 2004 Plan after April 1, 2012 as a result of forfeiture, termination or expiration of awards previously granted under the 2004 Plan (“Plan Rollover”). In addition, the 2011 Plan provides for annual increases in the number of shares available for issuance there under on the first business day of each Fiscal year, beginning with the day after April 1, 2012, equal to four percent (4%) of the number of shares of the Company’s common stock outstanding as of such date.
Under the Company’s 2004 Stock Incentive Plan and 2011 Stock Incentive Plan (the “Plans”), the Board of Directors may grant either incentive stock options, nonqualified stock options, or stock awards to eligible persons, including employees, nonemployees, members of the Board of Directors, consultants and other independent advisors who provide services to the Company.
Incentive stock options may only be granted to employees and at an exercise price of no less than fair value on the date of grant. Nonqualified stock options may be granted at an exercise price of no less than 100% of fair value on the date of grant. For owners of more than 10% of the Company’s common stock, options may only be granted for an exercise price of not less than 110% of fair value, and these options generally expire 10 years from the date of grant. Stock options may be exercisable immediately but subject to repurchase. Stock options vest over the period determined by the Board of Directors, generally four years.
79
Table of Contents
InvenSense, Inc.
Notes to Consolidated Financial Statements—(Continued)
Stock option activities of the Company under the Plans are as follows (in thousands, except per share amounts):
| Options Available for Grant |
Options Issued and Outstanding |
Weighted- Average Exercise Price |
Weighted- Average Remaining Contractual Term (In Years) |
Aggregate Intrinsic Value |
||||||||||||||||
| Balance—March 29, 2009 |
1,796 | 7,044 | $ | 0.53 | ||||||||||||||||
| Increase to stock option pool |
3,000 | |||||||||||||||||||
| Options granted (weighted-average fair value of $1.41 per share) |
(3,197 | ) | 3,197 | 2.68 | ||||||||||||||||
| Options exercised |
— | (1,236 | ) | 0.30 | ||||||||||||||||
| Options canceled |
660 | (660 | ) | 0.89 | ||||||||||||||||
|
|
|
|
|
|||||||||||||||||
| Balance—March 28, 2010 |
2,259 | 8,345 | 1.36 | |||||||||||||||||
| Options granted (weighted-average fair value of $2.51 per share) |
(2,375 | ) | 2,375 | 5.37 | ||||||||||||||||
| Options exercised |
— | (949 | ) | 0.76 | ||||||||||||||||
| Options canceled |
1,573 | (1,573 | ) | 3.21 | ||||||||||||||||
|
|
|
|
|
|||||||||||||||||
| Balance—April 3, 2011 |
1,457 | 8,198 | 2.24 | |||||||||||||||||
| Increase to stock option pool |
11,835 | |||||||||||||||||||
| Options granted (weighted-average fair value of $3.72 per share) |
(4,172 | ) | 4,172 | 8.12 | ||||||||||||||||
| Options exercised |
— | (665 | ) | 2.04 | ||||||||||||||||
| Options canceled |
590 | (589 | ) | 4.95 | ||||||||||||||||
|
|
|
|
|
|||||||||||||||||
| Balance—April 1, 2012 |
9,710 | 11,116 | $ | 4.31 | 7.7 | $ | 153,401 | |||||||||||||
|
|
|
|
|
|
|
|
|
|
|
|||||||||||
| April 3, 2011 |
||||||||||||||||||||
| Vested and expected to vest |
6,869 | $ | 1.82 | 7.5 | $ | 29,209 | ||||||||||||||
|
|
|
|
|
|
|
|
|
|||||||||||||
| Exercisable—April 3, 2011 |
4,077 | $ | 1.13 | 6.9 | $ | 20,135 | ||||||||||||||
|
|
|
|
|
|
|
|
|
|||||||||||||
| April 1, 2012 |
||||||||||||||||||||
| Vested and expected to vest |
10,064 | $ | 4.02 | 7.6 | $ | 141,827 | ||||||||||||||
|
|
|
|
|
|
|
|
|
|||||||||||||
| Exercisable—April 1, 2012 |
5,202 | $ | 1.46 | 6.31 | $ | 86,557 | ||||||||||||||
|
|
|
|
|
|
|
|
|
|||||||||||||
Restricted stock unit activities of the Company under the Plans are as follows (in thousands, except per share amounts):
| Restricted stock unit activity |
Shares (in thousands) |
Weighted average grant date fair value |
||||||
| Nonvested at April 3, 2011 |
— | — | ||||||
| Granted |
118 | $ | 12.47 | |||||
| Vested |
— | — | ||||||
| Forfeited |
— | — | ||||||
|
|
|
|
|
|||||
| Total nonvested at April 1, 2012 |
118 | $ | 12.47 | |||||
|
|
|
|
|
|||||
At April 1, 2012, there was approximately $1.4 million of unrecognized compensation cost related to restricted stock units which the Company expects to recognize over a weighted-average period of 2.6 years.
80
Table of Contents
InvenSense, Inc.
Notes to Consolidated Financial Statements—(Continued)
Additional information regarding options outstanding as of April 2012 and April 2011 is as follows (in thousands except per share amounts):
| Options Outstanding April 2012 | ||||||||||||||||||||
| Exercise Price |
Number Outstanding |
Weighted- Average Remaining Contractual Life (In Years) |
Weighted- Average Exercise Price of Options Outstanding |
Number Exercisable |
Weighted- Average Exercise Price of Options Exercisable |
|||||||||||||||
| $0.04 - $0.08 |
68 | 3.63 | $ | 0.07 | 68 | $ | 0.07 | |||||||||||||
| $0.11 - $0.172 |
357 | 4.69 | 0.15 | 357 | 0.15 | |||||||||||||||
| $0.32 - $0.70 |
3,003 | 5.78 | 0.60 | 2,956 | 0.59 | |||||||||||||||
| $1.02 - $2.97 |
2,311 | 7.42 | 2.54 | 1,405 | 2.48 | |||||||||||||||
| $5.07 - $10.00 |
4,559 | 9.12 | 6.69 | 416 | 5.51 | |||||||||||||||
| $10.10 - $17.49 |
764 | 9.70 | 11.24 | — | — | |||||||||||||||
| $20.89 - $20.89 |
54 | 9.96 | 20.89 | — | — | |||||||||||||||
|
|
|
|
|
|
|
|
|
|
|
|||||||||||
| 11,116 | 7.73 | $ | 4.31 | 5,202 | $ | 1.46 | ||||||||||||||
|
|
|
|
|
|
|
|
|
|
|
|||||||||||
| Options Outstanding April 2011 | ||||||||||||||||||||
| Exercise Price |
Number Outstanding |
Weighted- Average Remaining Contractual Life (In Years) |
Weighted- Average Exercise Price of Options Outstanding |
Number Exercisable |
Weighted- Average Exercise Price of Options Exercisable |
|||||||||||||||
| $0.04 - $0.08 |
68 | 4.63 | $ | 0.07 | 68 | $ | 0.07 | |||||||||||||
| $0.11 - $0.172 |
376 | 5.69 | 0.16 | 376 | 0.16 | |||||||||||||||
| $0.32 - $0.70 |
3,130 | 6.75 | 0.60 | 2,358 | 0.58 | |||||||||||||||
| $1.02 - $2.97 |
2,974 | 7.66 | 2.49 | 1,215 | 2.36 | |||||||||||||||
| $5.07 - $6.11 |
1,650 | 8.14 | 5.45 | 60 | 5.08 | |||||||||||||||
|
|
|
|
|
|
|
|
|
|
|
|||||||||||
| 8,198 | 7.68 | $ | 2.24 | 4,077 | $ | 1.13 | ||||||||||||||
|
|
|
|
|
|
|
|
|
|
|
|||||||||||
During Fiscal 2012, the Board of Directors and the stockholders approved an additional 11,835,000 shares to be available for grant under the Plans. By April 2012, the Plans had accumulated 27,680,000 reserved shares (without giving effect to Plan Rollover), and 20,826,000 shares were available for future issuance. As of April 2011, the Plans had accumulated 15,845,000 shares, and 9,655,000 shares were reserved for future issuance.
| April 2012 Shares |
April 2011 Shares |
|||||||
| (in thousands) | ||||||||
| Shares issuable under plans: |
||||||||
| Options issued and outstanding |
11,116 | 8,198 | ||||||
| Restricted stock units granted |
118 | — | ||||||
| Shares remaining for issuance under plans |
9,592 | 1,457 | ||||||
|
|
|
|
|
|||||
| 20,826 | 9,655 | |||||||
|
|
|
|
|
|||||
| Reserved in Plans |
27,680 | 15,845 | ||||||
| Less: Options exercised |
(7,943 | ) | (7,279 | ) | ||||
| Less: Restricted stock units |
(26 | ) | (26 | ) | ||||
| Add: Repurchases of unvested shares |
1,115 | 1,115 | ||||||
|
|
|
|
|
|||||
| Shares available for future issuance |
20,826 | 9,655 | ||||||
|
|
|
|
|
|||||
81
Table of Contents
InvenSense, Inc.
Notes to Consolidated Financial Statements—(Continued)
Valuation of Stock-Based Awards
The Company applies the provisions of ASC 718-10 “Compensation—Stock Compensation” using the modified prospective method. ASC 718-10 establishes accounting for stock-based awards based on the fair value of the award measured at grant date. Accordingly, stock-based compensation cost is recognized in the consolidated statements of income as a component of both cost of revenues and operating expenses over the requisite service period. The fair value of stock options granted or modified after March 31, 2006, is recognized as compensation expense using the Black-Scholes option pricing model, single option approach. ASC 718-10 requires tax benefits in excess of compensation cost to be reported as a financing cash flow rather than as a reduction of taxes paid. The determination of the fair value of stock-based payment awards on the date of grant using the Black-Scholes option pricing model is affected by the volatilities of a peer group of companies based on industry, stage of life cycle, size and financial leverage, actual and projected employee stock option exercise behaviors, risk-free interest rate and expected dividends. Variables to be determined include expected volatility, estimated term and risk-free interest rate.
Expected Term
The Company has elected to use the simplified method described in Staff Accounting Bulletin No. 110, Topic 14, Share-Based Payment, to compute the expected term.
Expected Volatility
The Company estimates volatility for option grants by evaluating the average historical volatility of peer group companies for the period immediately preceding the option grant for a term that is approximately equal to the option’s expected term.
Risk-Free Interest Rate
The Company bases the risk-free interest rate that it uses in the Black-Scholes option pricing model on U.S. Treasury zero-coupon issues with remaining terms similar to the expected term on the options.
Expected Dividend
The Company does not anticipate paying any cash dividends in the foreseeable future and, therefore, uses an expected dividend yield of zero in the Black-Scholes option pricing model.
The aggregate intrinsic value of the stock options exercised during Fiscal 2012, Fiscal 2011 and Fiscal 2010 was $5.9 million, $4.6 million and $2.2 million, respectively. The aggregate intrinsic value was calculated as the difference between the exercise price of the stock options and the estimated fair market value of the underlying common stock at the date of exercise.
The number of options expected to vest takes into account an estimate of expected forfeitures. The remaining unamortized stock-based compensation expense, reduced for estimated forfeitures and related to non-vested options, was $13.9 million, $3.7 million and $2.6 million at April 2012, April 2011 and March 2010, respectively, and, for all periods will be amortized over a weighted-average remaining period of approximately three years. Total unrecognized expense will be adjusted for future changes in estimated forfeitures.
82
Table of Contents
InvenSense, Inc.
Notes to Consolidated Financial Statements—(Continued)
Weighted-Average Assumptions
The Company used the following weighted-average assumptions in determining stock-based compensation expense for Fiscal 2012, Fiscal 2011 and Fiscal 2010.
| Fiscal 2012 |
Fiscal 2011 |
Fiscal 2010 | ||||
| Expected Term |
5.8 years | 6.1 years | 5.6 years -7.3 years | |||
| Volatility |
48.2% - 49.51% | 42.5% -50.3% | 49.7% -61.6% | |||
| Risk-free interest rate |
0.7% - 2.4% | 1.5% -2.9% | 2.1% -3.2% | |||
| Dividend yield |
0% | 0% | 0% |
Restricted Stock Units (RSUs)
RSUs granted to employees are subject to the employee's continued service to the Company over that period. The fair value of RSUs is determined using the fair value of the Company's common stock on the date of the grant. Compensation expense is recognized on a straight-line basis over the requisite service period of each grant adjusted for estimated forfeitures.
Stock-Based Compensation Expense
Total employee stock-based compensation cost for the Company’s stock plans for Fiscal 2012, Fiscal 2011 and Fiscal 2010 are as follows:
| Fiscal 2012 | Fiscal 2011 | Fiscal 2010 | ||||||||||
| (in thousands) | ||||||||||||
| Cost of revenue |
$ | 325 | $ | 261 | $ | 155 | ||||||
| Research and development |
1,474 | 904 | 536 | |||||||||
| Selling, general and administrative |
1,875 | 897 | 504 | |||||||||
|
|
|
|
|
|
|
|||||||
| Total employee stock-based compensation expense |
$ | 3,674 | $ | 2,062 | $ | 1,195 | ||||||
|
|
|
|
|
|
|
|||||||
Nonemployee Stock-Based Compensation
The Company did not grant shares to non-employees during Fiscal 2012. During Fiscal 2011, the Company granted options to purchase 5,000 shares to a non-employee at an exercise price of $5.07 per share. During Fiscal 2010, the Company granted options to purchase 30,000 shares of common stock to a nonemployee at an exercise price of $2.97 per share.
Total stock-based compensation related to options granted to non-employees was $14,000, $128,000 and $33,000 in Fiscal 2012, Fiscal 2011 and Fiscal 2010, respectively. Compensation expense related to non-employee options was recorded in selling, general and administrative expense and research and development expense in Fiscal 2012 and Fiscal 2011 and was recorded in selling, general and administrative expense in Fiscal 2010 in the consolidated statements of income.
For Fiscal 2010 and Fiscal 2011, the fair value of the options granted to non-employees was estimated using the Black-Scholes option-pricing model with the following weighted-average assumptions: no dividend yield (for all periods), volatility of 61.6% for Fiscal 2010 and 50.3% for Fiscal 2011, risk-free interest rates of 3.3% to 3.7% for Fiscal 2010 and 3.1% to 3.4% for Fiscal 2011 and a contractual life of 10 years for Fiscal 2010 and 8.5 to 9.1 years for 2011.
83
Table of Contents
InvenSense, Inc.
Notes to Consolidated Financial Statements—(Continued)
Common Stock
As of April 2012 and April 2011, common stock reserved for future issuance was as follows (in thousands):
| Number of Shares | ||||||||
| Common stock reserved for issuance |
April 2012 | April 2011 | ||||||
| Stock Plans: |
||||||||
| Outstanding stock options |
11,116 | 8,198 | ||||||
| Outstanding restricted stock units |
118 | — | ||||||
| Reserved for future equity incentive grants |
9,592 | 1,457 | ||||||
|
|
|
|
|
|||||
| 20,826 | 9,655 | |||||||
|
|
|
|
|
|||||
| Convertible preferred stock (as converted): |
||||||||
| Series A |
— | 20,000 | ||||||
| Series B |
— | 14,801 | ||||||
| Series C |
— | 15,510 | ||||||
|
|
|
|
|
|||||
| — | 50,311 | |||||||
|
|
|
|
|
|||||
| Warrants to purchase convertible preferred stock (as converted): |
||||||||
| Series A |
— | 150 | ||||||
| Series B |
— | 1,614 | ||||||
|
|
|
|
|
|||||
| — | 1,764 | |||||||
| Warrants to purchase common stock |
405 | — | ||||||
|
|
|
|
|
|||||
| Total common stock reserved for future issuances |
21,231 | 61,730 | ||||||
|
|
|
|
|
|||||
7. Income Taxes
The components of income before taxes are as follows:
| Fiscal 2012 | Fiscal 2011 | Fiscal 2010 | ||||||||||
| (in thousands) | ||||||||||||
| United States |
$ | 19,179 | $ | 13,453 | $ | 15,449 | ||||||
| International |
27,973 | 4,031 | 92 | |||||||||
|
|
|
|
|
|
|
|||||||
| $ | 47,152 | $ | 17,484 | $ | 15,541 | |||||||
|
|
|
|
|
|
|
|||||||
Income tax expense was comprised of the following:
| Fiscal 2012 | Fiscal 2011 | Fiscal 2010 | ||||||||||
| (in thousands) | ||||||||||||
| Current: |
||||||||||||
| Federal |
$ | 10,856 | $ | 7,488 | $ | 1,828 | ||||||
| State |
1 | 5 | 365 | |||||||||
| International |
47 | 155 | 38 | |||||||||
|
|
|
|
|
|
|
|||||||
| $ | 10,904 | $ | 7,648 | $ | 2,231 | |||||||
|
|
|
|
|
|
|
|||||||
| Deferred: |
||||||||||||
| Federal |
$ | (777 | ) | $ | 245 | $ | (1,222 | ) | ||||
| State |
— | 611 | (610 | ) | ||||||||
| International |
78 | (367 | ) | — | ||||||||
|
|
|
|
|
|
|
|||||||
| (699 | ) | 489 | (1,832 | ) | ||||||||
|
|
|
|
|
|
|
|||||||
| Income tax provision |
$ | 10,205 | $ | 8,137 | $ | 399 | ||||||
|
|
|
|
|
|
|
|||||||
84
Table of Contents
InvenSense, Inc.
Notes to Consolidated Financial Statements—(Continued)
The provision for income taxes differs from the amount computed by applying the statutory rates as follows:
| Fiscal 2012 | Fiscal 2011 | Fiscal 2010 | ||||||||||
| Income tax provision at the federal statutory rate |
35.0 | % | 35.0 | % | 35.0 | % | ||||||
| State tax, net of federal benefit |
— | — | 1.9 | |||||||||
| Research and development credits |
(1.0 | ) | (2.0 | ) | (3.2 | ) | ||||||
| Foreign tax rate differential |
(14.7 | ) | (0.4 | ) | (1.5 | ) | ||||||
| Non deductible stock compensation |
2.3 | 3.7 | 2.8 | |||||||||
| Change in fair value of warrant liabilities |
— | 8.1 | 15.1 | |||||||||
| Change in valuation allowance |
— | 2.4 | (46.6 | ) | ||||||||
| Other |
— | (0.3 | ) | (0.9 | ) | |||||||
|
|
|
|
|
|
|
|||||||
| Effective tax rate |
21.6 | % | 46.5 | % | 2.6 | % | ||||||
|
|
|
|
|
|
|
|||||||
The components of the deferred tax asset are as follows:
| April 2012 | April 2011 | |||||||
| (in thousands) | ||||||||
| Deferred tax asset: |
||||||||
| Accrued expenses and reserves |
$ | 1,569 | $ | 711 | ||||
| Research and development credits |
873 | 438 | ||||||
| Net operating loss carryforwards |
1,084 | 1,123 | ||||||
| Fixed Assets |
290 | 394 | ||||||
| Other |
— | 9 | ||||||
| Valuation allowance |
(1,771 | ) | (1,332 | ) | ||||
|
|
|
|
|
|||||
| Deferred tax asset |
$ | 2,045 | $ | 1,343 | ||||
|
|
|
|
|
|||||
Deferred income taxes reflect the net tax effects of temporary differences between the carrying amount of assets and liabilities for financial reporting purposes and the amounts for income tax purposes. The Company has not provided for U.S. federal income and foreign withholding taxes on undistributed earnings from non-U.S. operations as of April 2012, as in general, it is the practice and intention of the Company to reinvest the earnings of its non-U.S. subsidiaries in those operations. The Company has not made a provision for U.S. or additional foreign withholding taxes on the excess of the amount for financial reporting over the tax basis of investments in foreign subsidiaries that are essentially permanent in duration of approximately $26.8 million and $2.1 million at April 2012 and April 2011, respectively. Generally, such amounts become subject to U.S. taxation upon the remittance of dividends and under certain other circumstances. It is not practicable to estimate the amount of deferred tax liability related to investments in these foreign subsidiaries.
At April 2012, the Company had approximately $18.7 million and $0.3 million of California state and foreign net operating loss carryforwards, respectively. The California net operating loss carryforwards expire between 2017 and 2022. At April 2012, the Company had approximately $1.7 million and $0.2 million California state and foreign, respectively, research tax credit carryforwards. The California credits are not subject to expiration under current California tax law.
The Company maintains a valuation allowance against our California deferred tax assets as of April 2012. The Company considers all available evidence, both positive and negative, in assessing the extent to which a valuation allowance should be applied against deferred tax assets. The Company’s valuation allowance increased $0.4 million as of April 2012 compared to April 2011, and decreased $0.2 million as of April 2011 compared to March 2010.
85
Table of Contents
InvenSense, Inc.
Notes to Consolidated Financial Statements—(Continued)
While management believes that the Company has adequately provided for all tax positions, amounts asserted by tax authorities could be greater or less than the recorded position. Accordingly, the Company’s provisions on federal, state and foreign tax-related matters to be recorded in the future may change as revised estimates are made or the underlying matters are settled or otherwise resolved.
A reconciliation of the change in unrecognized tax benefits is as follows:
| For the Period March 29, 2009 to April 1, 2012 |
||||
| (in thousands) | ||||
| Balance at March 29, 2009 |
$ | 332 | ||
| Increases in unrecognized tax benefits |
170 | |||
|
|
|
|||
| Balance at March 28, 2010 |
$ | 502 | ||
| Increases in unrecognized tax benefits |
554 | |||
|
|
|
|||
| Balance at April 3, 2011 |
$ | 1,056 | ||
| Increases in unrecognized tax benefits |
2,799 | |||
|
|
|
|||
| Balance at April 1, 2012 |
$ | 3,855 | ||
|
|
|
|||
Included in the gross unrecognized tax benefits balance of $3.9 million at April 1, 2012 are $3.2 million of tax positions which would affect income tax expense if recognized. As of April 1, 2012, approximately $0.7 million of unrecognized tax benefits would be offset by a change in valuation allowance. The Company recognizes interest and penalties related to unrecognized tax benefits within the income tax expense line in the accompanying Consolidated Statement of Operations. Accrued interest and penalties are included within the related tax liability line in the Consolidated Balance Sheet. As of April 2012, the Company had $26,000 accrued interest related to uncertain tax matters. The Company does not expect its unrecognized tax benefits at April 2012 will materially change within the next 12 months. The Company files income tax returns in the U.S. federal, California and various international jurisdictions. The 2003 through 2011 tax years are open and may be subject to potential examination in one or more jurisdictions.
86
Table of Contents
InvenSense, Inc.
Notes to Consolidated Financial Statements—(Continued)
8. Quarterly Financial Data (Unaudited)
| Fiscal Year 2012: | Three Months Ended | |||||||||||||||
| April 1, 2012 |
January 1, 2012 | Oct. 2, 2011 |
July 3, 2011 |
|||||||||||||
| (in thousands) | ||||||||||||||||
| Net revenue |
$ | 33,077 | $ | 41,229 | $ | 43,034 | $ | 35,627 | ||||||||
| Cost of revenue |
14,652 | 18,538 | 19,372 | 15,009 | ||||||||||||
|
|
|
|
|
|
|
|
|
|||||||||
| Gross profit |
18,425 | 22,691 | 23,662 | 20,618 | ||||||||||||
| Operating expenses: |
||||||||||||||||
| Research and development |
5,573 | 4,758 | 4,965 | 4,376 | ||||||||||||
| Selling, general and administrative |
5,874 | 4,427 | 3,898 | 4,511 | ||||||||||||
|
|
|
|
|
|
|
|
|
|||||||||
| Total operating expenses |
11,447 | 9,185 | 8,863 | 8,887 | ||||||||||||
|
|
|
|
|
|
|
|
|
|||||||||
| Income from operations |
6,978 | 13,506 | 14,799 | 11,731 | ||||||||||||
| Change in fair value of warrant liabilities |
— | — | — | — | ||||||||||||
| Other income (expense), net |
(28 | ) | (43 | ) | 28 | 181 | ||||||||||
|
|
|
|
|
|
|
|
|
|||||||||
| Other income (expense), net |
(28 | ) | (43 | ) | 28 | 181 | ||||||||||
|
|
|
|
|
|
|
|
|
|||||||||
| Income before income taxes |
6,950 | 13,463 | 14,827 | 11,912 | ||||||||||||
| Income tax provision |
1,058 | 2,887 | 3,372 | 2,888 | ||||||||||||
|
|
|
|
|
|
|
|
|
|||||||||
| Net income |
5,892 | 10,576 | 11,455 | 9,024 | ||||||||||||
| Net income allocable to convertible preferred stockholders |
— | 5,157 | 8,626 | 6,842 | ||||||||||||
|
|
|
|
|
|
|
|
|
|||||||||
| Net income allocable to common stockholders |
$ | 5,892 | $ | 5,419 | $ | 2,829 | $ | 2,182 | ||||||||
|
|
|
|
|
|
|
|
|
|||||||||
| Basic |
$ | 0.07 | $ | 0.11 | $ | 0.15 | $ | 0.12 | ||||||||
|
|
|
|
|
|
|
|
|
|||||||||
| Diluted |
$ | 0.07 | $ | 0.10 | $ | 0.14 | $ | 0.11 | ||||||||
|
|
|
|
|
|
|
|
|
|||||||||
| Weighted average shares outstanding in computing net income per share allocable to common stockholders: |
||||||||||||||||
| Basic |
80,163 | 49,890 | 18,296 | 18,124 | ||||||||||||
| Diluted |
87,510 | 55,294 | 22,865 | 22,547 | ||||||||||||
|
|
|
|
|
|
|
|
|
|||||||||
87
Table of Contents
InvenSense, Inc.
Notes to Consolidated Financial Statements—(Continued)
| Fiscal Year 2011: | Three Months Ended | |||||||||||||||
| April 3, 2011 |
Dec. 26, 2010 |
Sept. 26, 2010 |
June 27, 2010 |
|||||||||||||
| (in thousands) | ||||||||||||||||
| Net revenue |
$ | 23,852 | $ | 27,170 | $ | 23,524 | $ | 22,001 | ||||||||
| Cost of revenue |
10,633 | 11,827 | 11,317 | 9,870 | ||||||||||||
|
|
|
|
|
|
|
|
|
|||||||||
| Gross profit |
13,219 | 15,343 | 12,207 | 12,131 | ||||||||||||
| Operating expenses: |
||||||||||||||||
| Research and development |
4,446 | 3,792 | 3,309 | 4,279 | ||||||||||||
| Selling, general and administrative |
4,118 | 4,863 | 3,357 | 3,258 | ||||||||||||
|
|
|
|
|
|
|
|
|
|||||||||
| Total operating expenses |
8,564 | 8,655 | 6,666 | 7,537 | ||||||||||||
| Income from operations |
4,655 | 6,688 | 5,541 | 4,594 | ||||||||||||
| Change in fair value of warrant liabilities |
— | — | — | (4,025 | ) | |||||||||||
| Other income (expense), net |
32 | (16 | ) | 17 | (2 | ) | ||||||||||
|
|
|
|
|
|
|
|
|
|||||||||
| Other income (expense), net |
32 | (16 | ) | 17 | (4,027 | ) | ||||||||||
| Income before income taxes |
4,687 | 6,672 | 5,558 | 567 | ||||||||||||
| Income tax provision |
2,139 | 1,955 | 2,357 | 1,686 | ||||||||||||
|
|
|
|
|
|
|
|
|
|||||||||
| Net income (loss) |
$ | 2,548 | $ | 4,717 | $ | 3,201 | $ | (1,119) | ||||||||
| Net income allocable to convertible preferred stockholders |
2,079 | 3,684 | 2,569 | — | ||||||||||||
|
|
|
|
|
|
|
|
|
|||||||||
| Net income allocable to common stockholders |
$ | 469 | $ | 1,033 | $ | 632 | $ | (1,119 | ) | |||||||
|
|
|
|
|
|
|
|
|
|||||||||
| Basic |
$ | 0.03 | $ | 0.06 | $ | 0.04 | $ | (0.06 | ) | |||||||
|
|
|
|
|
|
|
|
|
|||||||||
| Diluted |
$ | 0.02 | $ | 0.05 | $ | 0.03 | $ | (0.06 | ) | |||||||
|
|
|
|
|
|
|
|
|
|||||||||
| Weighted average shares outstanding in computing net income per share allocable to common stockholders: |
||||||||||||||||
| Basic |
17,966 | 17,815 | 17,627 | 17,276 | ||||||||||||
|
|
|
|
|
|
|
|
|
|||||||||
| Diluted |
22,265 | 22,281 | 21,923 | 17,276 | ||||||||||||
|
|
|
|
|
|
|
|
|
|||||||||
88
Table of Contents
Pursuant to the requirements of Section 13 or 15(d) of the Securities Exchange Act of 1934, the registrant has duly caused this report to be signed on its behalf by the undersigned, thereunto duly authorized.
| InvenSense, Inc. | ||||||
| Dated: June 19, 2012 | By: | /s/ Alan Krock | ||||
| Alan Krock | ||||||
| Chief Financial Officer (Duly Authorized Officer and Principal Financial Officer and Chief Accounting Officer) | ||||||
POWER OF ATTORNEY
KNOW ALL PERSONS BY THESE PRESENTS, that each person whose signature appears below constitutes and appoints Steven Nasiri and Alan Krock his true and lawful attorney-in-fact and agent, with full power of substitution and, for him and in his name, place and stead, in any and all capacities to sign any and all amendments to this Annual Report on Form 10-K, and to file the same, with all exhibits thereto and other documents in connection therewith, with the Securities and Exchange Commission, granting unto said attorney-in-fact and agent full power and authority to do and perform each and every act and thing requisite and necessary to be done in connection therewith, as fully to all intents and purposes as he might or could do in person, hereby ratifying and confirming all that said attorney-in-fact and agent, or his substitute or substitutes, may lawfully do or cause to be done by virtue hereof.
Pursuant to the requirements of the Securities Act of 1934, as amended, this report has been signed by the following persons in the capacities and on the dates indicated.
| Dated: June 19, 2012 | By: | /s/ Steven Nasiri | ||
| Steven Nasiri | ||||
| Chief Executive Officer | ||||
| (Principal Executive Officer) | ||||
| Dated: June 19, 2012 | By: | /s/ Alan Krock | ||
| Alan Krock | ||||
| Chief Financial Officer | ||||
| (Principal Financial and Principal Accounting Officer | ||||
| Dated: June 19, 2012 | By: | /s/ Behrooz Abdi | ||
| Behrooz Abdi | ||||
| Director | ||||
| Dated: June 19, 2012 | By: | /s/ R. Douglas Norby | ||
| R. Douglas Norby | ||||
| Director | ||||
89
Table of Contents
| Dated: June 19, 2012 | By: | /s/ Jon Olson | ||
| Jon Olson | ||||
| Director | ||||
| Dated: June 19, 2012 | By: | /s/ Amit Shah | ||
| Amit Shah | ||||
| Director | ||||
| Dated: June 19, 2012 | By: | /s/ Tim Wilson | ||
| Tim Wilson | ||||
| Director | ||||
| Dated: June 19, 2012 | By: | /s/ Yunbei “Ben” Yu, Ph.D | ||
| Yunbei “Ben” Yu, Ph.D | ||||
| Director | ||||
90
Table of Contents
InvenSense, Inc.
INDEX TO EXHIBITS
TO
FORM 10-K ANNUAL REPORT
For the Year Ended
April 1, 2012
| Exhibit |
Exhibit Description |
Incorporated by Reference | ||||||||||||||||
| Form | File No. | Exhibit(s) | Filing Date | |||||||||||||||
| 3.1 |
Form of Third Amended and Restated Certificate of Incorporation of InvenSense, Inc. | S-1 | 333-167843 | 3.5 | August 25, 2011 | |||||||||||||
| 3.2 |
Form of Third Amended and Restated Bylaws of InvenSense, Inc. | S-1 | 333-167843 | 3.7 | August 25, 2011 | |||||||||||||
| 4.1 |
Form of InvenSense, Inc.’s Common Stock Certificate. | S-1 | 333-167843 | 4.1 | August 25, 2011 | |||||||||||||
| 4.2 |
Second Amended and Restated Investor Rights Agreement, dated March 28, 2008. | S-1 | 333-167843 | 4.2 | June 28, 2010 | |||||||||||||
| 4.3 |
Amendment to Second Amended and Restated Investor Rights Agreement, dated July 17, 2011. | S-1 | 333-167843 | 4.2.1 | August 25, 2011 | |||||||||||||
| 4.4 |
Waiver and Acknowledgement Under Second Amended and Restated Investor Rights Agreement, dated February 27, 2012. | S-1 | 333-179706 | 4.4 | February 27, 2012 | |||||||||||||
| 4.5 |
Form of Series B Preferred Stock Purchase Warrant issued on December 4, 2006 to investors in Series B financing. | S-1 | 333-167843 | 4.5 | June 28, 2010 | |||||||||||||
| 10.1† |
InvenSense, Inc. 2004 Stock Incentive Plan, as amended, and related documents. | S-1 | 333-167843 | 10.1 | June 28, 2010 | |||||||||||||
| 10.2† |
InvenSense, Inc. 2011 Stock Incentive Plan and related documents. | S-1 | 333-167843 | 10.2 | August 25, 2011 | |||||||||||||
| 10.3† |
Form of Indemnification Agreement made by and between the Company and each of (i) Amit Shah, Artiman Ventures, L.P., Artiman Ventures Side Fund, L.P. and Artiman Ventures Side Fund II, L.P., (ii) Tim Wilson, Partech U.S. Partners IV, LLC, 45th Parallel, LLC and Multinvest, LLC, and (iii) Steven Nasiri. | S-1 | 333-167843 | 10.3 | June 28, 2010 | |||||||||||||
| 10.4† |
Indemnification Agreement made by the Company for the benefit of Sierra Ventures IX, L.P., and its affiliates, dated March 28, 2008. | S-1 | 333-167843 | 10.4 | June 28, 2010 | |||||||||||||
| 10.5† |
Form of Indemnification Agreement by and between the Company and each of its directors. | S-1 | 333-167843 | 10.16 | August 25, 2011 | |||||||||||||
| 10.6† |
Executive Employment Agreement between the Company and Steven Nasiri, dated April 14, 2004. | S-1 | 333-167843 | 10.5 | June 28, 2010 | |||||||||||||
| 10.7† |
Separation Agreement and General Release, between the Company and Mahesh Karanth, dated June 3, 2010. | S-1 | 333-167843 | 10.6 | June 28, 2010 | |||||||||||||
| 10.8† |
General Release, between the Company and Mark Voll, dated January 31, 2011. | S-1 | 333-167843 | 10.7 | May 24, 2011 | |||||||||||||
| 10.9† |
Offer Letter, between the Company and Stephen Lloyd, dated November 13, 2008. | S-1 | 333-167843 | 10.8 | June 28, 2010 | |||||||||||||
| 10.10† |
Offer Letter, between the Company and Daniel Goehl, dated October 28, 2004. | S-1 | 333-167843 | 10.9 | June 28, 2010 | |||||||||||||
| 10.11† |
Offer Letter, between the Company and Ram Krishnan, dated April 5, 2007. | S-1 | 333-167843 | 10.10 | June 28, 2010 | |||||||||||||
| 10.12† |
Offer Letter, between the Company and Joseph Jiang, dated June 9, 2007. | S-1 | 333-167843 | 10.11 | June 28, 2010 | |||||||||||||
91
Table of Contents
| Exhibit |
Exhibit Description |
Incorporated by Reference | ||||||||||||||||
| Form | File No. | Exhibit(s) | Filing Date | |||||||||||||||
| 10.13† |
Compensation Agreement, between the Company and Jim Callas, dated January 18, 2011. | S-1 | 333-167843 | 10.12 | May 24, 2011 | |||||||||||||
| 10.14† |
Offer Letter, between the Company and Jim Callas, dated August 20, 2010. | S-1 | 333-167843 | 10.12.1 | May 24, 2011 | |||||||||||||
| 10.15† |
Employment Agreement, between the Company and Alan Krock, dated as of May 31, 2011. | S-1 | 333-167843 | 10.13 | August 25, 2011 | |||||||||||||
| 10.16 |
Industrial Lease between the Company and AMB Property, L.P., dated June 13, 2007. | S-1 | 333-167843 | 10.13 | June 28, 2010 | |||||||||||||
| 10.17 |
First Amendment to Lease Agreement between the Company and AMB Property, L.P., dated June 26, 2009. | S-1 | 333-167843 | 10.14 | June 28, 2010 | |||||||||||||
| 10.18 |
Second Amendment to Lease Agreement between the Company and Prologis L.P., dated February 17, 2012. | 8-K | 001-35269 | 10.1 | February 24, 2012 | |||||||||||||
| 21.1 |
Subsidiary List. | S-1 | 333-179706 | 21.1 | February 27, 2012 | |||||||||||||
| 23.1 |
Consent of Deloitte & Touche LLP. | |||||||||||||||||
| 24.1 |
Power of Attorney (included on signature page). | |||||||||||||||||
| 31.1 |
Certification of the Principal Executive Officer Pursuant to Section 302 of the Sarbanes-Oxley Act | |||||||||||||||||
| 31.2 |
Certification of the Principal Financial Officer Pursuant to Section 302 of the Sarbanes-Oxley Act | |||||||||||||||||
| 32.1 |
Certification of the Principal Executive Officer and Principal Financial Officer Pursuant to Section 906 of the Sarbanes-Oxley Act | |||||||||||||||||
| 101.INS†† |
XBRL Instance Document | |||||||||||||||||
| 101.SCH†† |
XBRL Taxonomy Extension Schema | |||||||||||||||||
| 101.CAL†† |
XBRL Taxonomy Extension Calculation Linkbase | |||||||||||||||||
| 101.DEF†† |
XBRL Taxonomy Extension Definition Linkbase | |||||||||||||||||
| 101.LAB†† |
XBRL Taxonomy Extension Label Linkbase | |||||||||||||||||
| 101.PRE†† |
XBRL Taxonomy Extension Presentation Linkbase | |||||||||||||||||
| † | Indicates a management contract or compensatory plan or arrangement. |
| †† | XBRL (Extensible Business Reporting Language) information is furnished and not filed or a part of a registration statement or prospectus for purposes of Sections 11 or 12 of the Securities Act of 1933, as amended, is deemed not filed for purposes of Section 18 of the Securities Exchange Act of 1934, as amended, and is not otherwise subject to liability under these Sections. |
92