Attached files
| file | filename |
|---|---|
| 8-K - 8-K - BOULDER BRANDS, INC. | v316226_8k.htm |
Investor Presentation June 2012 Steve Hughes Chairman & CEO
Forward Looking Statements This presentation may contain forward - looking statements within the meaning of the safe harbor provisions of the Securities Litigation Reform Act of 1995. Terms such as “expect,” “believe, ”continue,” “going forward,” and “grow,” as well as similar comments, are forward - looking in nature. Actual results may differ from these forward - looking statements and the company can give no assurances that such expectations can be attained. Factors that could cause actual results to differ materially from the Company’s expectation include: general business and economic conditions, competitive factors, raw materials purchasing, and fluctuations in demand. Please refer to the Company’s Securities and Exchange Commission filings for further information. 2
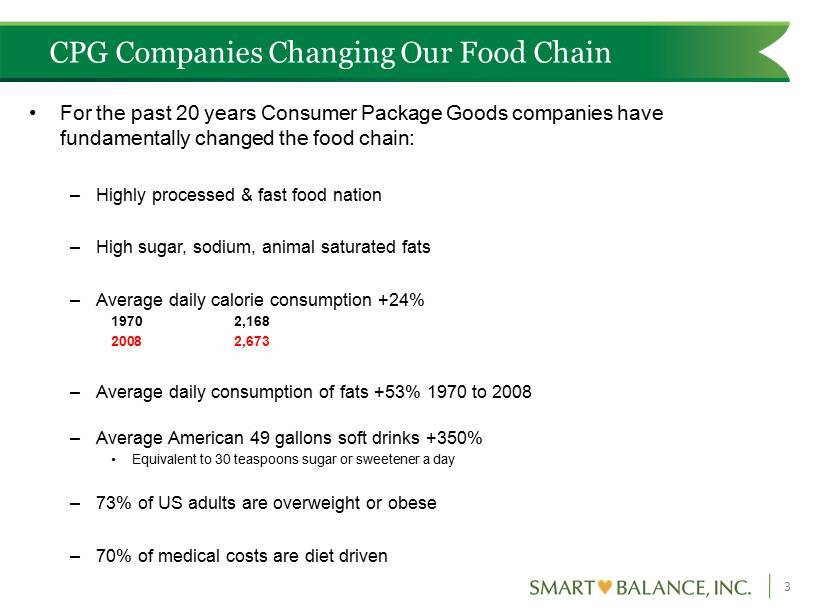
CPG Companies Changing Our Food Chain • For the past 20 years Consumer Package Goods companies have fundamentally changed the food chain: – Highly processed & fast food nation – High sugar, sodium, animal saturated fats – Average daily calorie consumption +24% 1970 2,168 2008 2,673 – Average daily consumption of fats +53% 1970 to 2008 – Average American 49 gallons soft drinks +350% • Equivalent to 30 teaspoons sugar or sweetener a day – 73% of US adults are overweight or obese – 70% of medical costs are diet driven 3
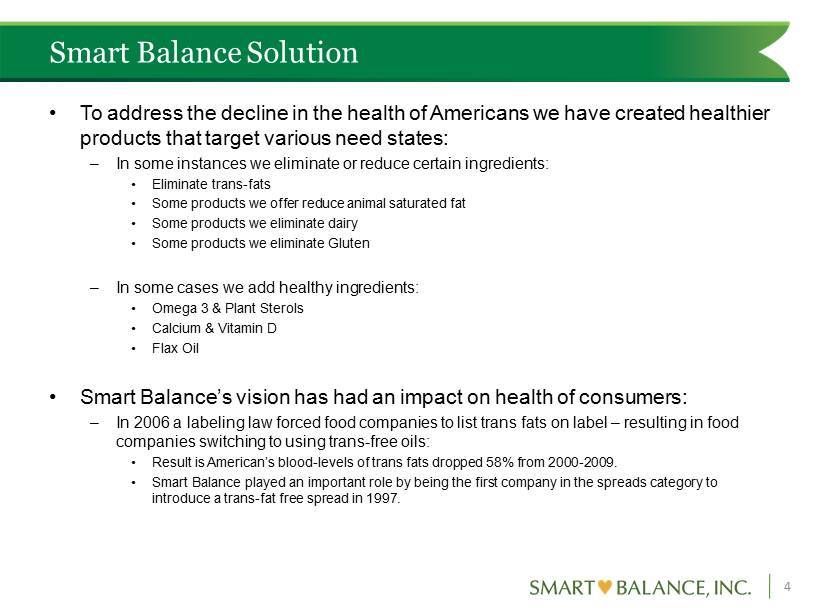
Smart Balance Solution • To address the decline in the health of Americans we have created healthier products that target various need states: – In some instances we eliminate or reduce certain ingredients: • Eliminate trans - fats • Some products we offer reduce animal saturated fat • Some products we eliminate dairy • Some products we eliminate Gluten – In some cases we add healthy ingredients: • Omega 3 & Plant Sterols • Calcium & Vitamin D • Flax Oil • Smart Balance’s vision has had an impact on health of consumers: – In 2006 a labeling law forced food companies to list trans fats on label – resulting in food companies switching to using trans - free oils: • Result is American’s blood - levels of trans fats dropped 58% from 2000 - 2009. • Smart Balance played an important role by being the first company in the spreads category to introduce a trans - fat free spread in 1997. 4
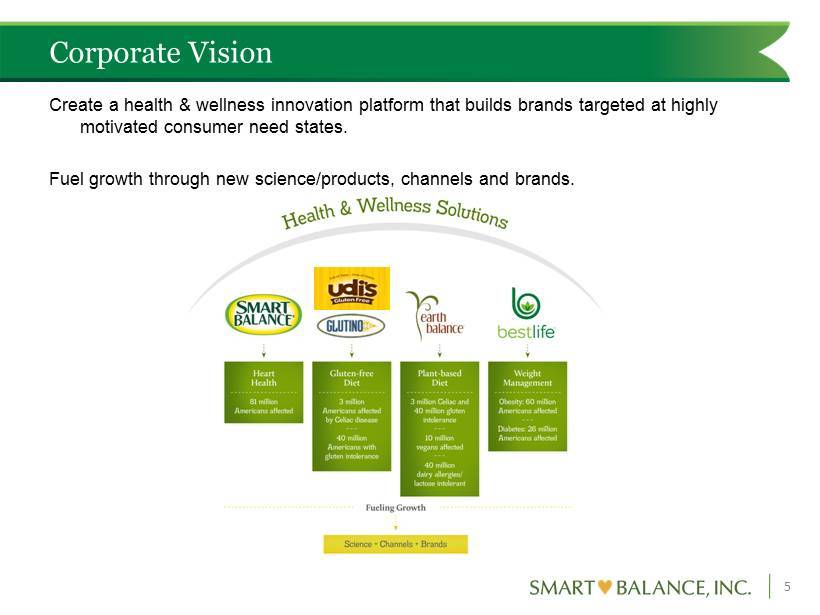
Corporate Vision Create a health & wellness innovation platform that builds brands targeted at highly motivated consumer need states. Fuel growth through new science/products, channels and brands. 5

Investment Highlights 6 ▪ Health & wellness innovation platform that provides superior - tasting, solution - driven products in every category it enters. ▪ Grown into the #3 player in the spreads category. ▪ Leveraging the core spreads and grocery margin/profit structure to focus on “premium” and deliver three growth platforms: ▪ Smart Balance Enhanced Milk, Earth Balance and Glutino ▪ A fourth platform with the acquisition of Udi’s, expected to close early - July ▪ Business model that generates significant free cash flow. ▪ Quality and experienced management team with brand building expertise.
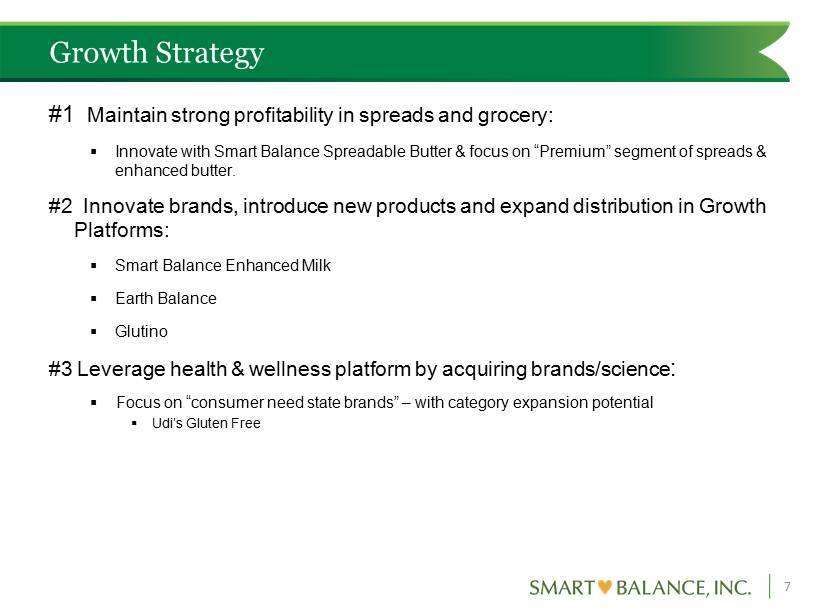
Growth Strategy #1 Maintain strong profitability in spreads and grocery: ▪ Innovate with Smart Balance Spreadable Butter & focus on “Premium” segment of spreads & enhanced butter. #2 Innovate brands, introduce new products and expand distribution in Growth Platforms: ▪ Smart Balance Enhanced Milk ▪ Earth Balance ▪ Glutino #3 Leverage health & wellness platform by acquiring brands/science : ▪ Focus on “consumer need state brands” – with category expansion potential ▪ Udi’s Gluten Free 7
Growth Strategy #1: MAINTAIN STRONG PROFITABILITY IN SPREADS AND GROCERY 8
Hold Profits Steady in Tough Category • In a difficult category, goal is to hold profits steady for core SB Spreads and Grocery & to invest in growth platforms: – Smart Balance Enhanced Milk – Earth Balance – Glutino – Udi’s • Package refresh in core SB Spreads and Grocery – Repositioning and reemphasis of brand benefits • Innovation with Better Butter – Smart Balance Spreadable Butter 9
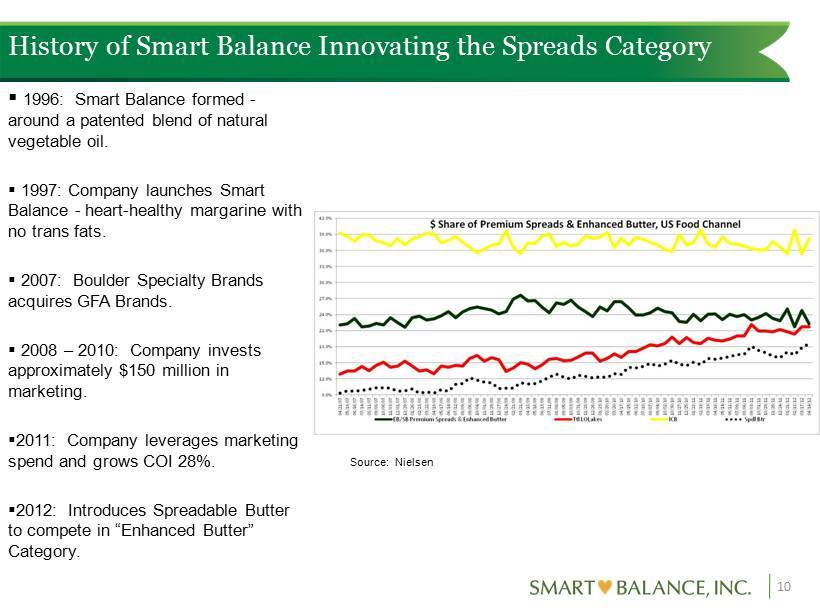
▪ 1996: Smart Balance formed - around a patented blend of natural vegetable oil. ▪ 1997: Company launches Smart Balance - heart - healthy margarine with no trans fats. ▪ 2007: Boulder Specialty Brands acquires GFA Brands. ▪ 2008 – 2010: Company invests approximately $150 million in marketing. ▪ 2011: Company leverages marketing spend and grows COI 28%. ▪ 2012: Introduces Spreadable Butter to compete in “Enhanced Butter” Category. 10 History of Smart Balance Innovating the Spreads Category Source: Nielsen
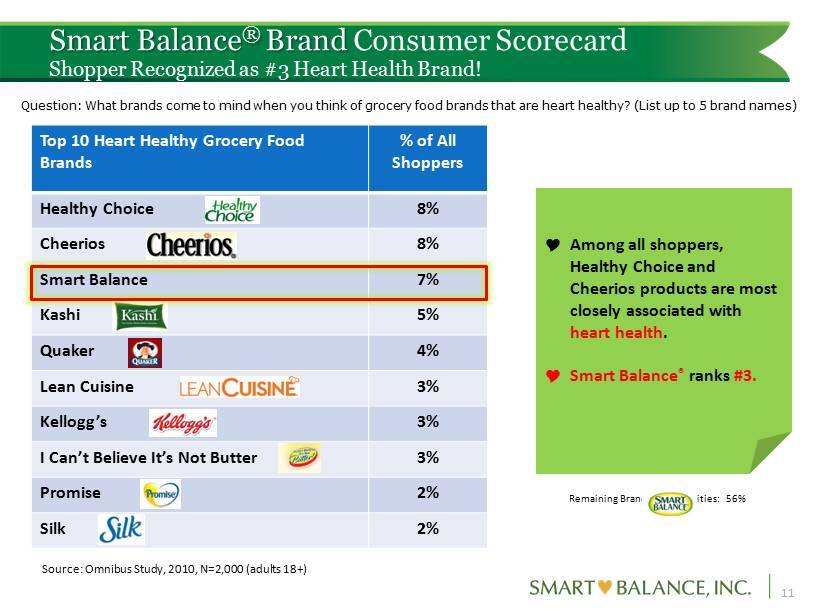
Smart Balance ® Brand Consumer Scorecard Shopper Recognized as #3 Heart Health Brand! Top 10 Heart Healthy Grocery Food Brands % of All Shoppers Healthy Choice 8% Cheerios 8% Smart Balance 7% Kashi 5% Quaker 4% Lean Cuisine 3% Kellogg’s 3% I Can’t Believe It’s Not Butter 3% Promise 2% Silk 2% Question: What brands come to mind when you think of grocery food brands that are heart healthy? (List up to 5 brand names) Among all shoppers, Healthy Choice and Cheerios products are most closely associated with heart health . Smart Balance ® ranks #3. Remaining Brands/Commodities: 56% Source: Omnibus Study, 2010, N=2,000 (adults 18+) 11
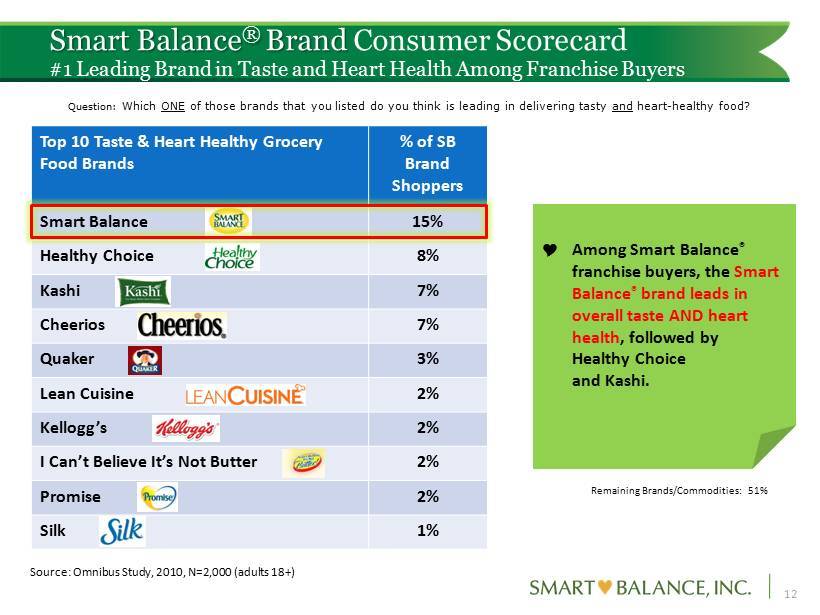
Smart Balance ® Brand Consumer Scorecard #1 Leading Brand in Taste and Heart Health Among Franchise Buyers Top 10 Taste & Heart Healthy Grocery Food Brands % of SB Brand Shoppers Smart Balance 15% Healthy Choice 8% Kashi 7% Cheerios 7% Quaker 3% Lean Cuisine 2% Kellogg’s 2% I Can’t Believe It’s Not Butter 2% Promise 2% Silk 1% Remaining Brands/Commodities: 51% Question: Which ONE of those brands that you listed do you think is leading in delivering tasty and heart - healthy food? Among Smart Balance ® franchise buyers, the Smart Balance ® brand leads in overall taste AND heart health , followed by Healthy Choice and Kashi. Source: Omnibus Study, 2010, N=2,000 (adults 18+) 12
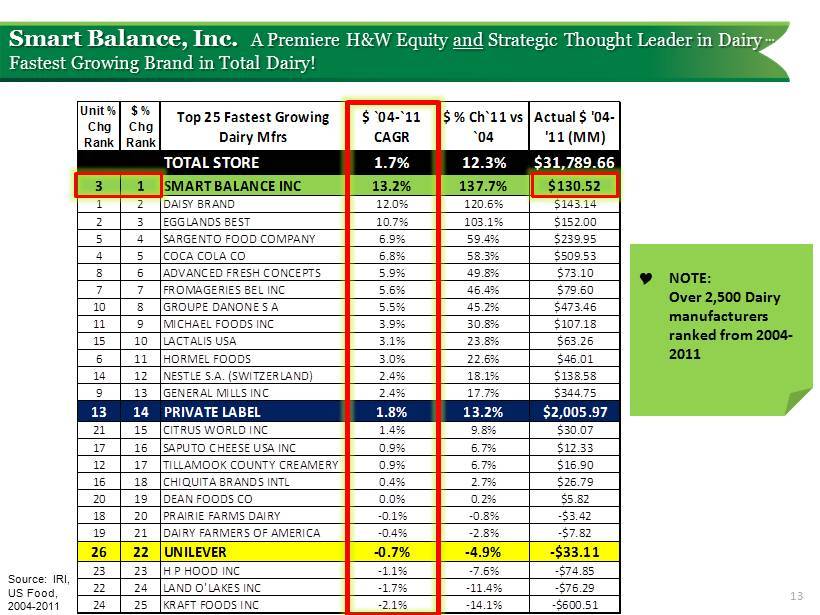
Unit % Chg Rank $ % Chg Rank Top 25 Fastest Growing Dairy Mfrs $ `04-`11 CAGR $ % Ch`11 vs `04 Actual $ '04- '11 (MM) TOTAL STORE 1.7% 12.3% $31,789.66 3 1 SMART BALANCE INC 13.2% 137.7% $130.52 1 2 DAISY BRAND 12.0% 120.6% $143.14 2 3 EGGLANDS BEST 10.7% 103.1% $152.00 5 4 SARGENTO FOOD COMPANY 6.9% 59.4% $239.95 4 5 COCA COLA CO 6.8% 58.3% $509.53 8 6 ADVANCED FRESH CONCEPTS 5.9% 49.8% $73.10 7 7 FROMAGERIES BEL INC 5.6% 46.4% $79.60 10 8 GROUPE DANONE S A 5.5% 45.2% $473.46 11 9 MICHAEL FOODS INC 3.9% 30.8% $107.18 15 10 LACTALIS USA 3.1% 23.8% $63.26 6 11 HORMEL FOODS 3.0% 22.6% $46.01 14 12 NESTLE S.A. (SWITZERLAND) 2.4% 18.1% $138.58 9 13 GENERAL MILLS INC 2.4% 17.7% $344.75 13 14 PRIVATE LABEL 1.8% 13.2% $2,005.97 21 15 CITRUS WORLD INC 1.4% 9.8% $30.07 17 16 SAPUTO CHEESE USA INC 0.9% 6.7% $12.33 12 17 TILLAMOOK COUNTY CREAMERY 0.9% 6.7% $16.90 16 18 CHIQUITA BRANDS INTL 0.4% 2.7% $26.79 20 19 DEAN FOODS CO 0.0% 0.2% $5.82 18 20 PRAIRIE FARMS DAIRY -0.1% -0.8% -$3.42 19 21 DAIRY FARMERS OF AMERICA -0.4% -2.8% -$7.82 26 22 UNILEVER -0.7% -4.9% -$33.11 23 23 H P HOOD INC -1.1% -7.6% -$74.85 22 24 LAND O'LAKES INC -1.7% -11.4% -$76.29 24 25 KRAFT FOODS INC -2.1% -14.1% -$600.51 Smart Balance, Inc. A Premiere H&W Equity and Strategic Thought Leader in Dairy … Fastest Growing Brand in Total Dairy! Source: IRI, US Food, 2004 - 2011 13 NOTE: Over 2,500 Dairy manufacturers ranked from 2004 - 2011
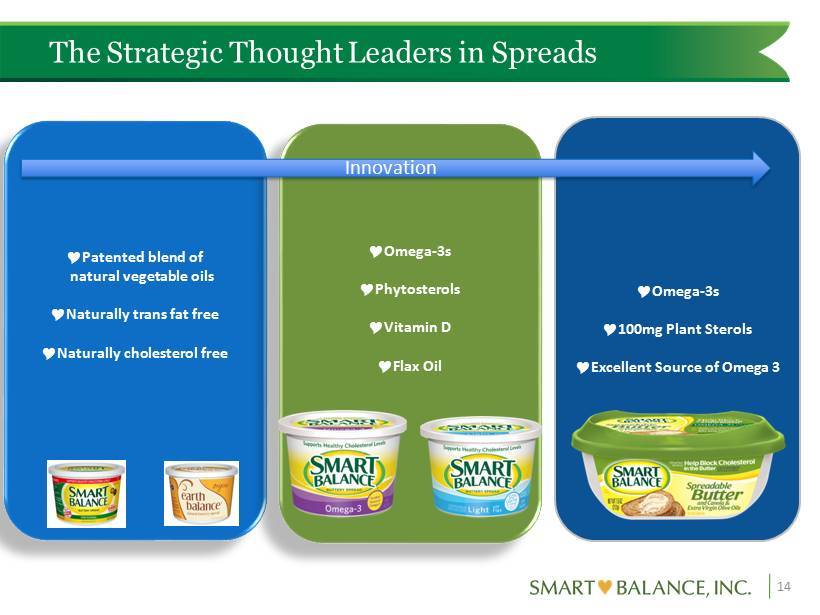
The Strategic Thought Leaders in Spreads 14 Patented blend of natural vegetable oils Naturally trans fat free Naturally cholesterol free The Strategic Thought Leaders in Spreads 14 Patented blend of natural vegetable oils Naturally trans fat free Naturally cholesterol free Omega - 3s Phytosterols Vitamin D Flax Oil Omega - 3s 100mg Plant Sterols Excellent Source of Omega 3 Innovation
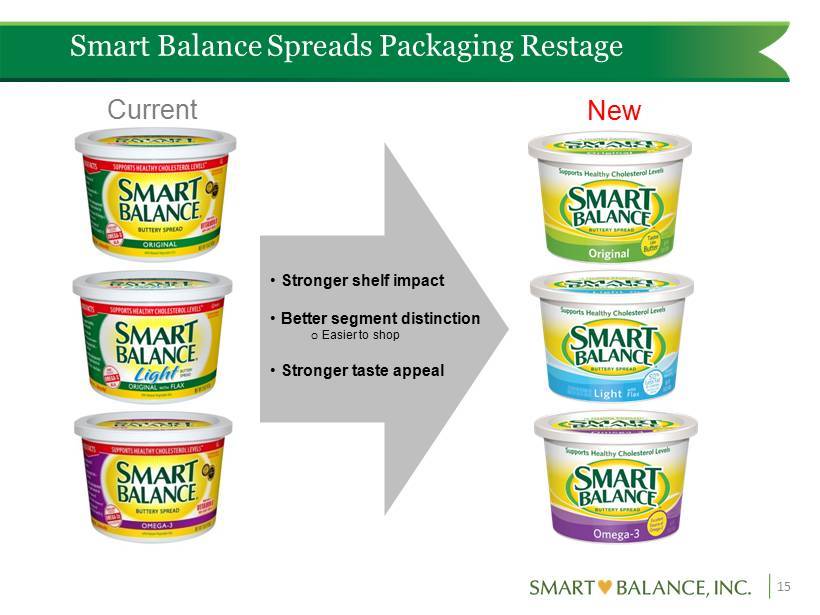
15 Smart Balance Spreads Packaging Restage Current New • Stronger shelf impact • Better segment distinction o Easier to shop • Stronger taste appeal
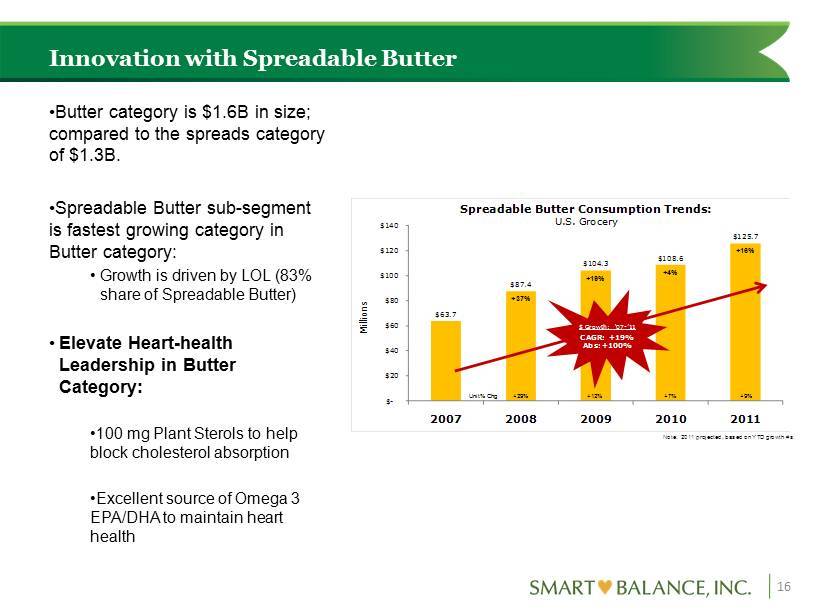
Innovation with Spreadable Butter • Butter category is $1.6B in size; compared to the spreads category of $1.3B. • Spreadable Butter sub - segment is fastest growing category in Butter category: • Growth is driven by LOL (83% share of Spreadable Butter) • Elevate Heart - health Leadership in Butter Category: • 100 mg Plant Sterols to help block cholesterol absorption • Excellent source of Omega 3 EPA/DHA to maintain heart health 16 $63.7 $87.4 $104.3 $108.6 $125.7 $ - $20 $40 $60 $80 $100 $120 $140 2007 2008 2009 2010 2011 Millions Spreadable Butter Consumption Trends: U.S. Grocery +37% +19% +4% +16% Note: 2011 projected, based on YTD growth #s $ Growth: ‘07 - ’11 CAGR: +19% Abs: +100% Unit % Chg +29% +12% +7% +9%
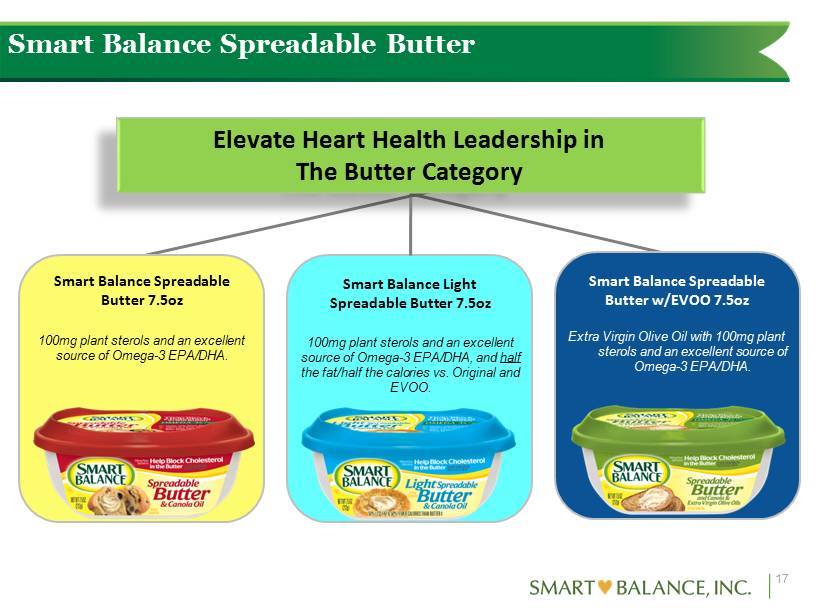
Smart Balance Spreadable Butter Elevate Heart Health Leadership in The Butter Category Smart Balance Spreadable Butter 7.5oz Smart Balance Light Spreadable Butter 7.5oz Smart Balance Spreadable Butter w/EVOO 7.5oz 100mg plant sterols and an excellent source of Omega - 3 EPA/DHA. 100mg plant sterols and an excellent source of Omega - 3 EPA/DHA, and half the fat/half the calories vs. Original and EVOO. Extra Virgin Olive Oil with 100mg plant sterols and an excellent source of Omega - 3 EPA/DHA. 17
GROWTH STRATEGY #2: GROW BRANDS, PRODUCTS & DISTRIBUTION IN THREE PLATFORMS: SMART BALANCE ENHANCED MILK – EARTH BALANCE – GLUTINO 18
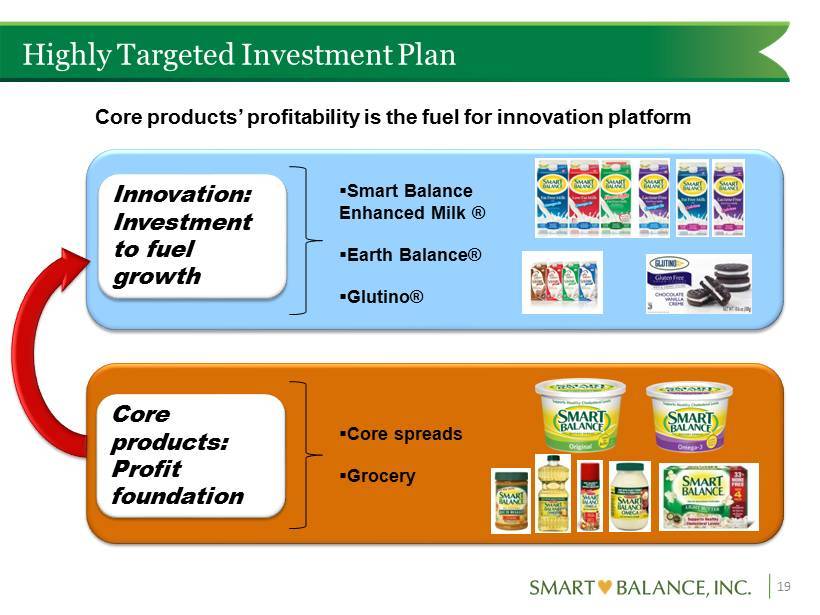
Highly Targeted Investment Plan 19 Source: The Nielsen Company Innovation: Investment to fuel growth Core products’ profitability is the fuel for innovation platform ▪ Smart Balance Enhanced Milk ® ▪ Earth Balance® ▪ Glutino ® ▪ Core spreads ▪ Grocery Core products: Profit foundation
SMART BALANCE ENHANCED MILK 20
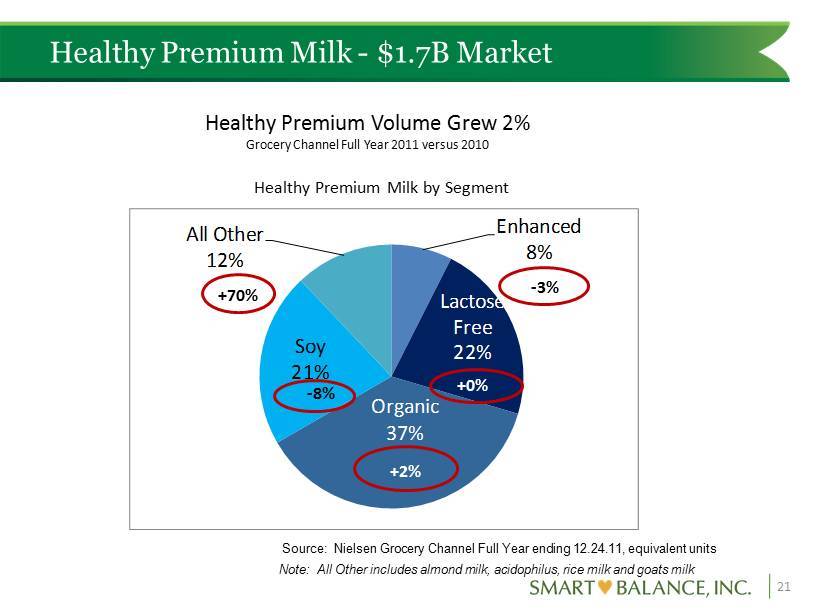
Enhanced 8% Lactose Free 22% Organic 37% Soy 21% All Other 12% Healthy Premium Milk - $1.7B Market 21 Healthy Premium Milk by Segment +0% +2% - 8% - 3% +70% Healthy Premium Volume Grew 2 % Grocery Channel Full Year 2011 versus 2010 Source: Nielsen Grocery Channel Full Year ending 12.24.11, equivalent units Note: All Other includes almond milk, acidophilus, rice milk and goats milk
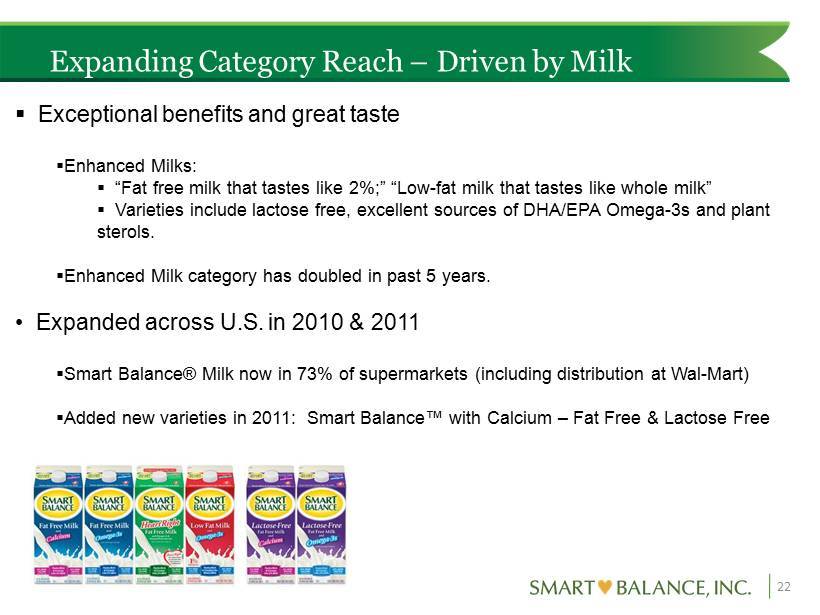
Expanding Category Reach – Driven by Milk 22 ▪ Exceptional benefits and great taste ▪ Enhanced Milks: ▪ “Fat free milk that tastes like 2%;” “Low - fat milk that tastes like whole milk” ▪ Varieties include lactose free, excellent sources of DHA/EPA Omega - 3s and plant sterols. ▪ Enhanced Milk category has doubled in past 5 years. • Expanded across U.S. in 2010 & 2011 ▪ Smart Balance® Milk now in 73% of supermarkets (including distribution at Wal - Mart) ▪ Added new varieties in 2011: Smart Balance™ with Calcium – Fat Free & Lactose Free
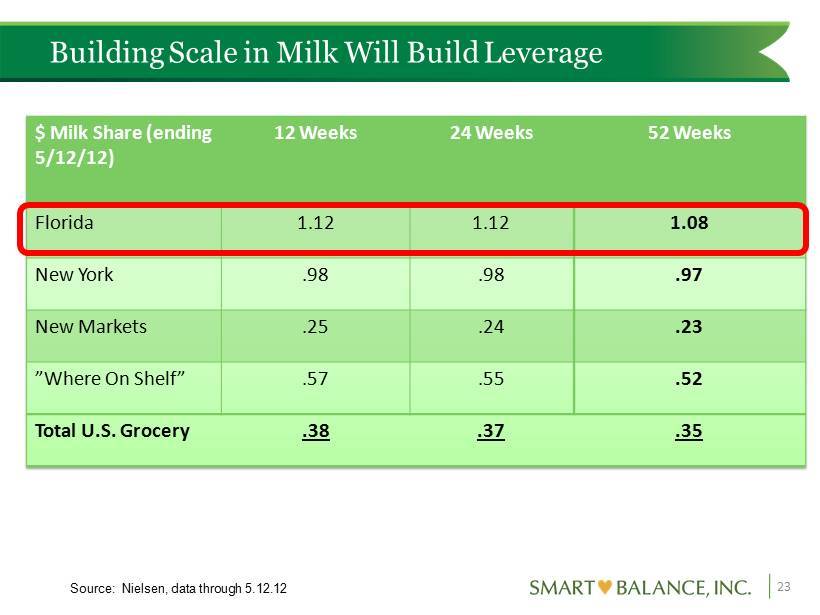
$ Milk Share (ending 5/12/12) 12 Weeks 24 Weeks 52 Weeks Florida 1.12 1.12 1.08 New York .98 .98 .97 New Markets .25 .24 .23 ”Where On Shelf” .57 .55 .52 Total U.S. Grocery .38 .37 .35 Building Scale in Milk Will Build Leverage 23 Source: Nielsen, data through 5.12.12
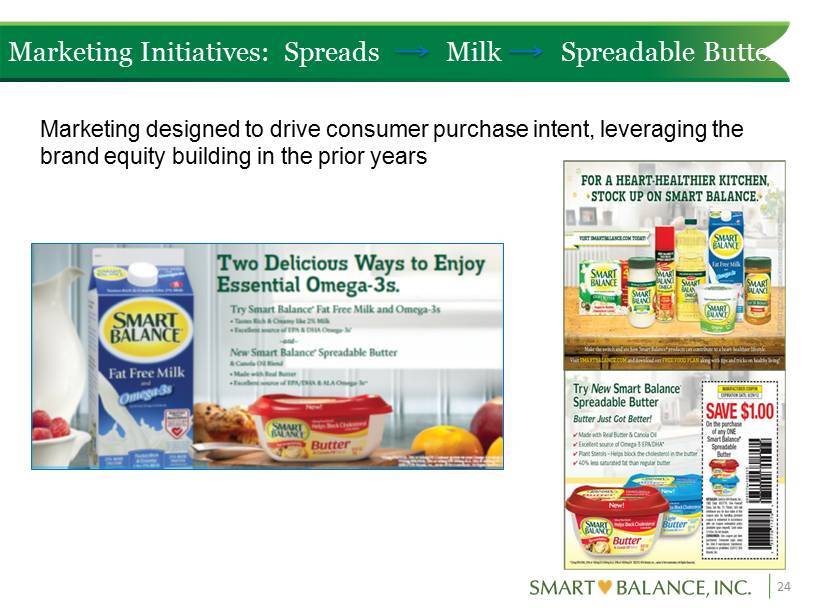
Marketing Initiatives: Spreads Milk Spreadable Butter 24 Marketing designed to drive consumer purchase intent, leveraging the brand equity building in the prior years

EARTH BALANCE 25
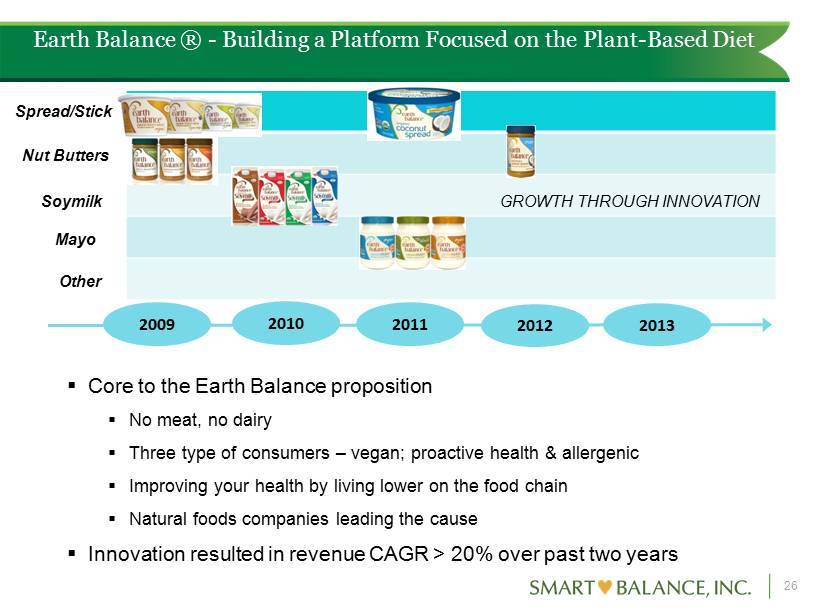
Building a Promising Platform Focused on the Plant Based Diet ▪ Core to the Earth Balance proposition ▪ No meat, no dairy ▪ Three type of consumers – vegan; proactive health & allergenic ▪ Improving your health by living lower on the food chain ▪ Natural foods companies leading the cause ▪ Innovation resulted in revenue CAGR > 20% over past two years Soymilk Nut Butters Spread/Stick 2009 Mayo Other 2010 2011 2012 2013 Earth Balance ® - Building a Platform Focused on the Plant - Based Diet GROWTH THROUGH INNOVATION 26

GLUTINO 27
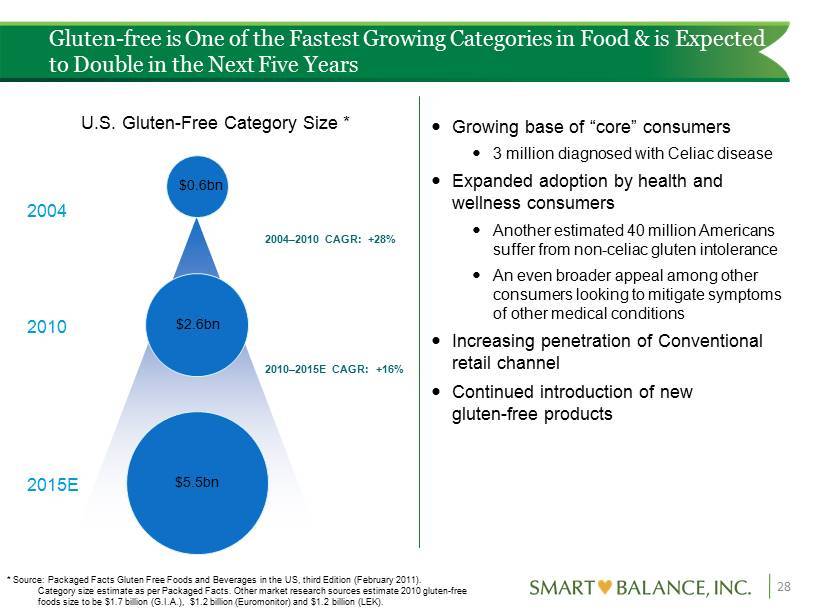
Gluten - free is One of the Fastest Growing Categories in Food & is Expected to Double in the Next Five Years U.S. Gluten - Free Category Size * $0.6bn $ 2.6bn $5.5bn 2004 2010 2015E 2004 – 2010 CAGR: +28% 2010 – 2015E CAGR: +16% Growing base of “core” consumers 3 million diagnosed with Celiac disease Expanded adoption by health and wellness consumers Another estimated 40 million Americans suffer from non - celiac gluten intolerance An even broader appeal among other consumers looking to mitigate symptoms of other medical conditions Increasing penetration of Conventional retail channel Continued introduction of new gluten - free products * Source : Packaged Facts Gluten Free Foods and Beverages in the US, third Edition (February 2011). Category size estimate as per Packaged Facts. Other market research sources estimate 2010 gluten - free foods size to be $1.7 billion (G.I.A.), $1.2 billion (Euromonitor) and $1.2 billion (LEK). 28
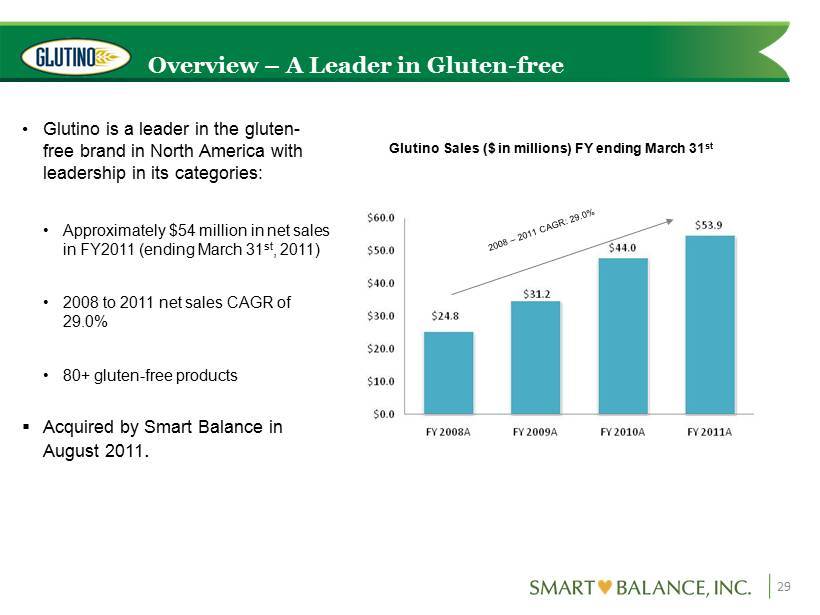
Overview – A Leader in Gluten - free • Glutino is a leader in the gluten - free brand in North America with leadership in its categories: • Approximately $54 million in net sales in FY2011 (ending March 31 st , 2011) • 2008 to 2011 net sales CAGR of 29.0% • 80+ gluten - free products ▪ Acquired by Smart Balance in August 2011 . 29 Glutino Sales ($ in millions) FY ending March 31 st
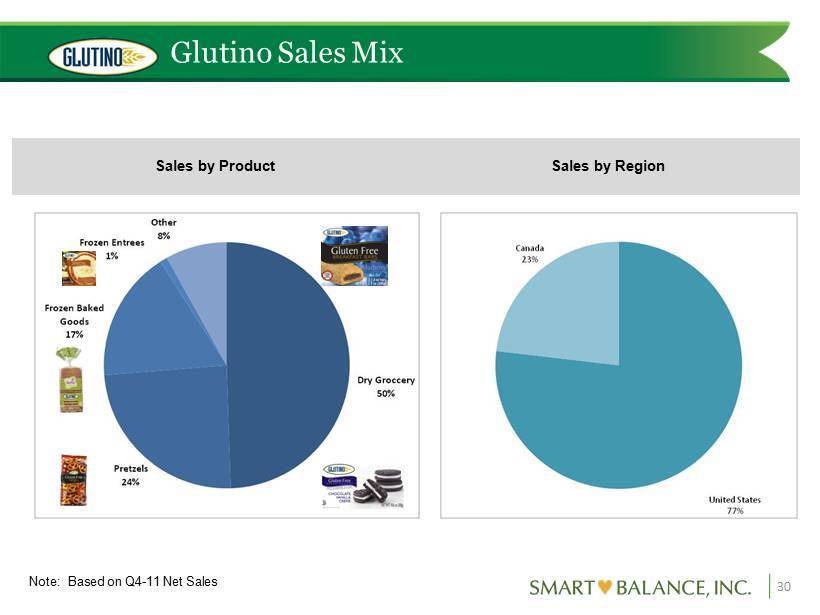
Glutino Sales Mix 30 Note: Based on Q4 - 11 Net Sales Sales by Product Sales by Region
Growth Outlook - “The 3 P’s” • Product: – New package design in Q3 – Product innovation: • Snacks • Bread • Pizza • Pasta • Placement: – Focus on innovation with natural food channel • “Greenhouse for new products” – Increase # of items/SKUs sold at conventional supermarkets • With ultimate goal of gluten - free set • Profit: – Improve margin through supply chain efficiencies 31
#3 LEVERAGE HEALTH & WELLNESS PLATFORM BY ACQUIRING BRANDS/SCIENCE: 32
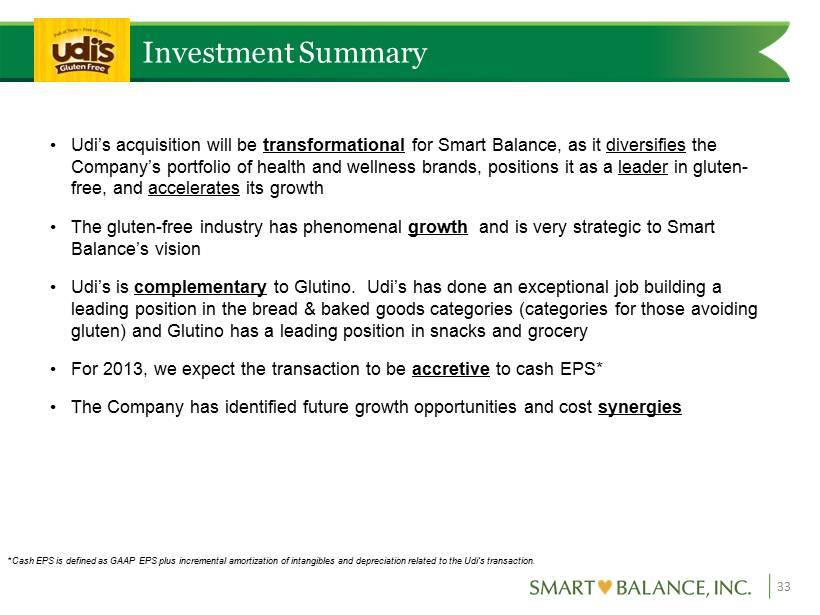
Investment Summary • Udi’s acquisition will be transformational for Smart Balance, as it diversifies the Company’s portfolio of health and wellness brands, positions it as a leader in gluten - free , and accelerates its growth • The gluten - free industry has phenomenal growth and is very strategic to Smart Balance’s vision • Udi’s is complementary to Glutino. Udi’s has done an exceptional job building a leading position in the bread & baked goods categories (categories for those avoiding gluten) and Glutino has a leading position in snacks and grocery • For 2013, we expect the transaction to be accretive to cash EPS* • The Company has identified future growth opportunities and cost synergies 33 * Cash EPS is defined as GAAP EPS plus incremental amortization of intangibles and depreciation related to the Udi’s transactio n.
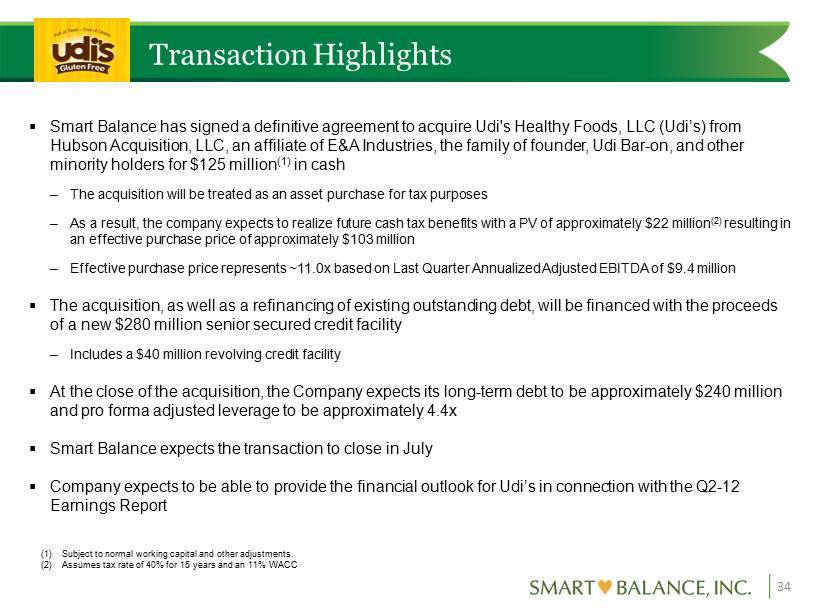
Transaction Highlights 34 ▪ Smart Balance has signed a definitive agreement to acquire Udi's Healthy Foods, LLC (Udi’s) from Hubson Acquisition, LLC, an affiliate of E&A Industries, the family of founder, Udi Bar - on, and other minority holders for $125 million (1) in cash – The acquisition will be treated as an asset purchase for tax purposes – As a result, the company expects to realize future cash tax benefits with a PV of approximately $22 million (2) resulting in an effective purchase price of approximately $103 million – Effective purchase price represents ~11.0x based on Last Quarter Annualized Adjusted EBITDA of $9.4 million ▪ The acquisition, as well as a refinancing of existing outstanding debt, will be financed with the proceeds of a new $280 million senior secured credit facility – Includes a $40 million revolving credit facility ▪ At the close of the acquisition, the Company expects its long - term debt to be approximately $240 million and pro forma adjusted leverage to be approximately 4.4x ▪ Smart Balance expects the transaction to close in July ▪ Company expects to be able to provide the financial outlook for Udi’s in connection with the Q2 - 12 Earnings Report (1) Subject to normal working capital and other adjustments. (2) Assumes tax rate of 40% for 15 years and an 11% WACC
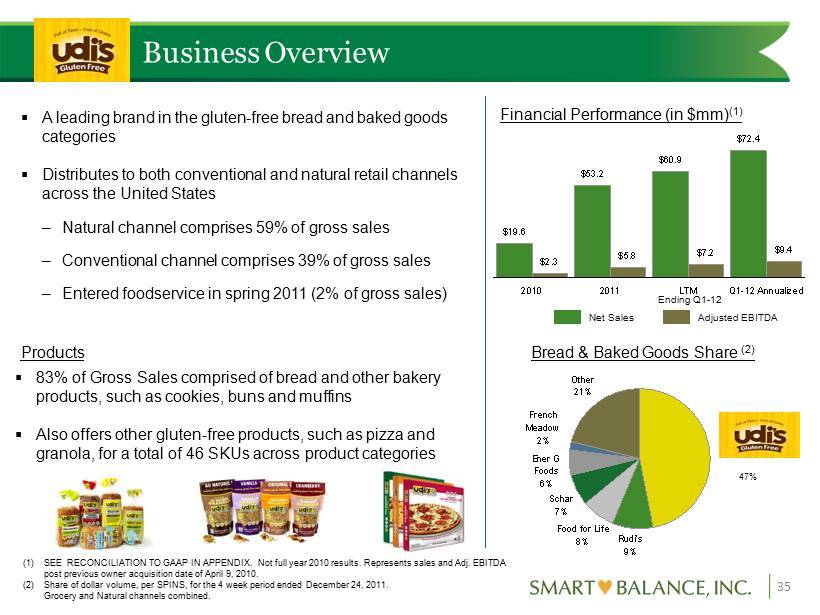
$19.6 $53.2 $60.9 $72.4 $2.3 $5.8 $7.2 $9.4 2010 2011 LTM Q1-12 Annualized Rudi's 9% Other 21% Ener G Foods 6% Schar 7% Food for Life 8% French Meadow 2% Business Overview 35 ▪ A leading brand in the gluten - free bread and baked goods categories ▪ Distributes to both conventional and natural retail channels across the United States – Natural channel comprises 59% of gross sales – Conventional channel comprises 39% of gross sales – Entered foodservice in spring 2011 (2% of gross sales ) Financial Performance (in $mm) (1) Bread & Baked Goods Share (2) ▪ 83% of Gross Sales comprised of bread and other bakery products, such as cookies, buns and muffins ▪ Also offers other gluten - free products, such as pizza and granola, for a total of 46 SKUs across product categories Products (1) SEE RECONCILIATION TO GAAP IN APPENDIX. Not full year 2010 results. Represents sales and Adj . EBITDA post previous owner acquisition date of April 9, 2010. (2) Share of dollar volume, per SPINS, for the 4 week period ended December 24, 2011. Grocery and Natural channels combined. Adjusted EBITDA Net Sales 47% Ending Q1 - 12
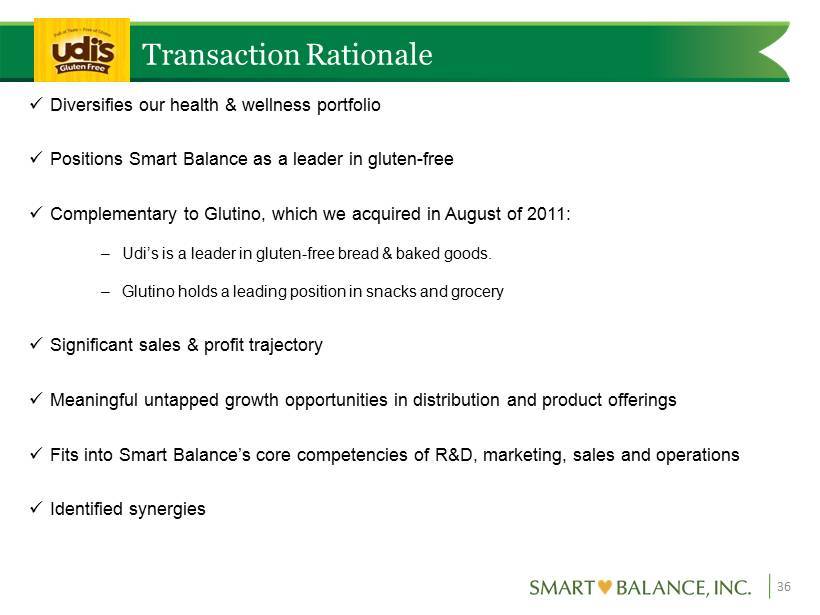
Transaction Rationale 36 x Diversifies our health & wellness portfolio x Positions Smart Balance as a leader in gluten - free x Complementary to Glutino, which we acquired in August of 2011: – Udi’s is a leader in gluten - free bread & baked goods. – Glutino holds a leading position in snacks and grocery x Significant sales & profit trajectory x Meaningful untapped growth opportunities in distribution and product offerings x Fits into Smart Balance’s core competencies of R&D, marketing, sales and operations x Identified synergies
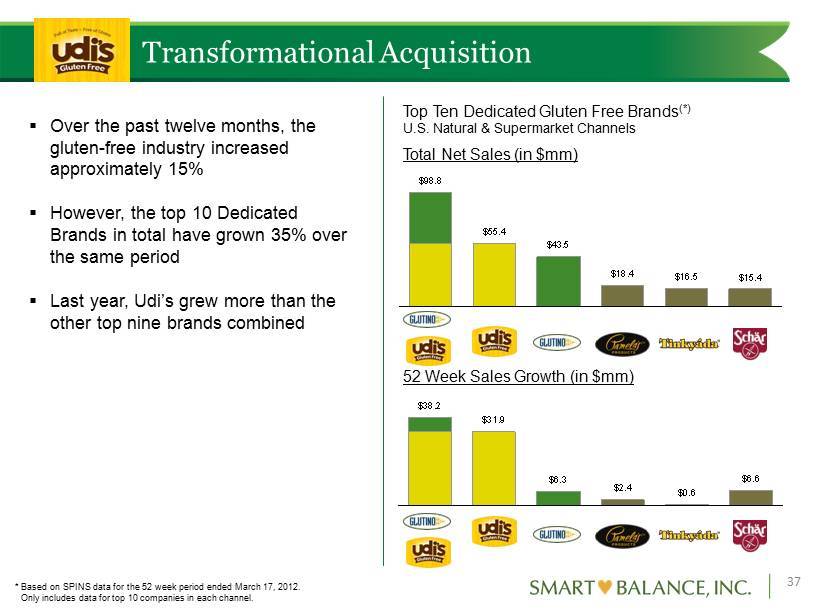
$38.2 $31.9 $6.3 $2.4 $0.6 $6.6 PF SMBL Udi's Glutino Pamelas Tinkyada Schar $98.8 $55.4 $43.5 $18.4 $16.5 $15.4 PF SMBL Udi's Glutino Pamelas Tinkyada Schar Transformational Acquisition 37 * Based on SPINS data for the 52 week period ended March 17, 2012. Only includes data for top 10 companies in each channel. Top Ten Dedicated Gluten Free Brands (*) U.S. Natural & Supermarket Channels ▪ Over the past twelve months, the gluten - free industry increased approximately 15 % ▪ However, the top 10 Dedicated Brands in total have grown 35% over the same period ▪ Last year, Udi’s grew more than the other top nine brands combined Total Net Sales (in $mm) 52 Week Sales Growth (in $mm)
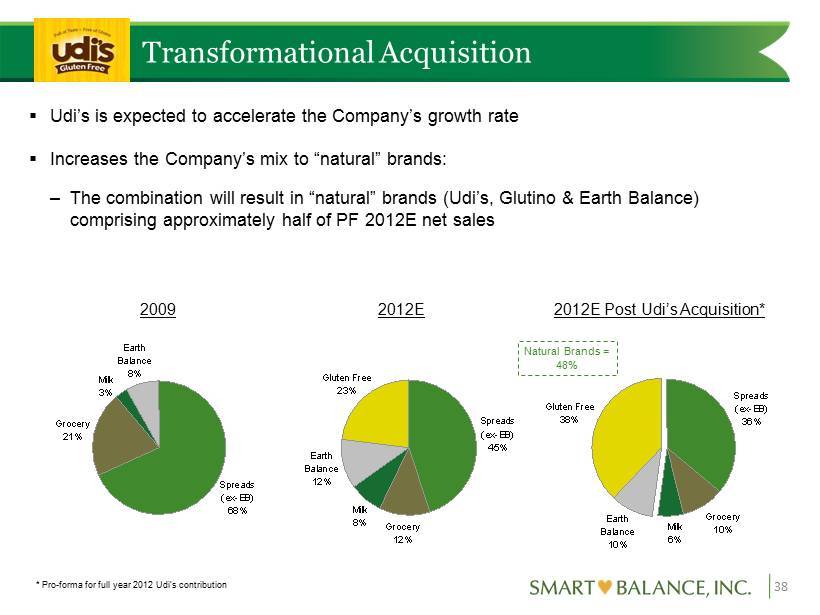
Transformational Acquisition 38 * Pro - forma for full year 2012 Udi’s contribution ▪ Udi’s is expected to accelerate the Company’s growth rate ▪ Increases the Company’s mix to “natural ” brands: – The combination will result in “natural” brands (Udi’s, Glutino & Earth Balance) comprising approximately half of PF 2012E net sales 2009 2012E 2012E Post Udi’s Acquisition* Grocery 21% Spreads (ex-EB) 68% Milk 3% Earth Balance 8% Grocery 12% Gluten Free 23% Earth Balance 12% Milk 8% Spreads (ex-EB) 45% Grocery 10% Milk 6% Spreads (ex-EB) 36% Gluten Free 38% Earth Balance 10% Natural Brands = 48%
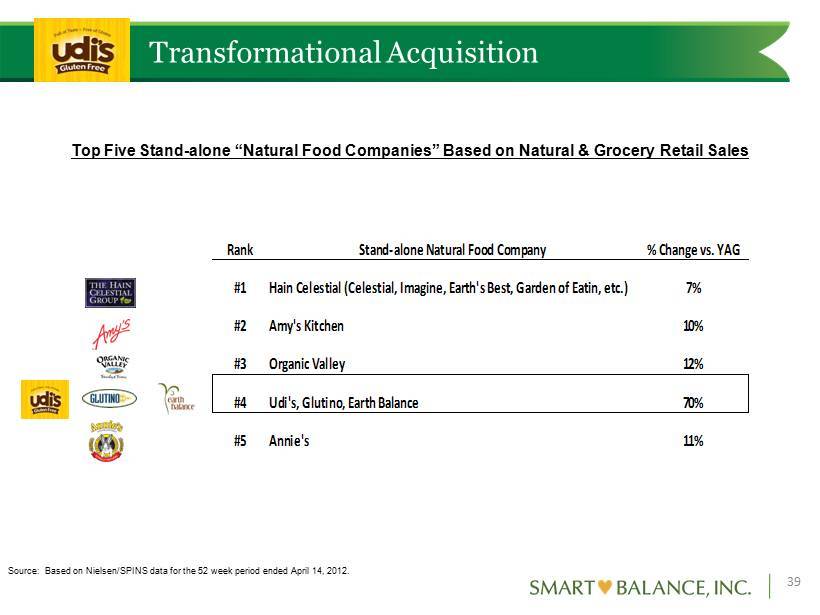
Transformational Acquisition 39 Source: Based on Nielsen/SPINS data for the 52 week period ended April 14, 2012. Top Five Stand - alone “Natural Food Companies ” Based on Natural & Grocery Retail Sales Rank Stand-alone Natural Food Company % Change vs. YAG #1 Hain Celestial (Celestial, Imagine, Earth's Best, Garden of Eatin, etc.) 7% #2 Amy's Kitchen 10% #3 Organic Valley 12% #4 Udi's, Glutino, Earth Balance 70% #5 Annie's 11%
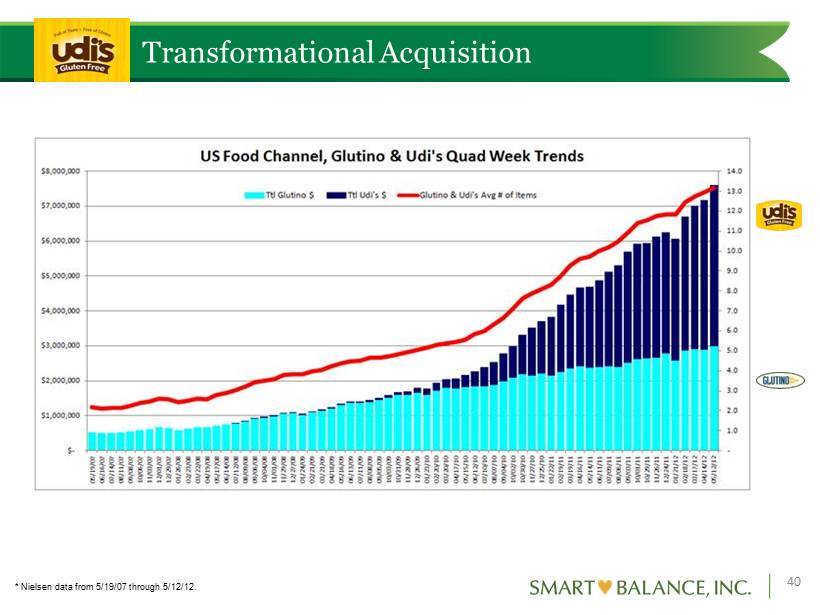
Transformational Acquisition 40 * Nielsen data from 5/19/07 through 5/12/12.
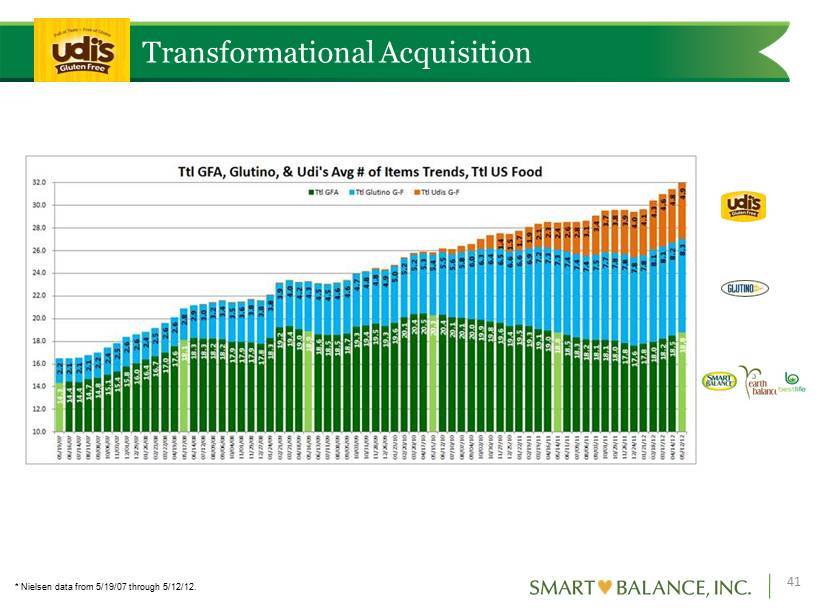
Transformational Acquisition 41 * Nielsen data from 5/19/07 through 5/12/12.
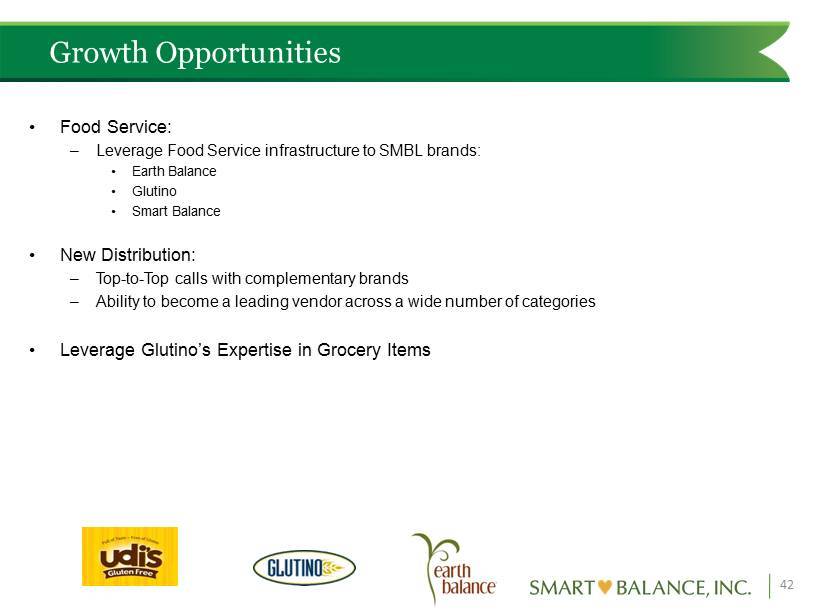
Growth Opportunities • Food Service: – Leverage Food Service infrastructure to SMBL brands: • Earth Balance • Glutino • Smart Balance • New Distribution: – Top - to - Top calls with complementary brands – Ability to become a leading vendor across a wide number of categories • Leverage Glutino’s Expertise in Grocery Items 42
FINANCIAL PERFORMANCE 43
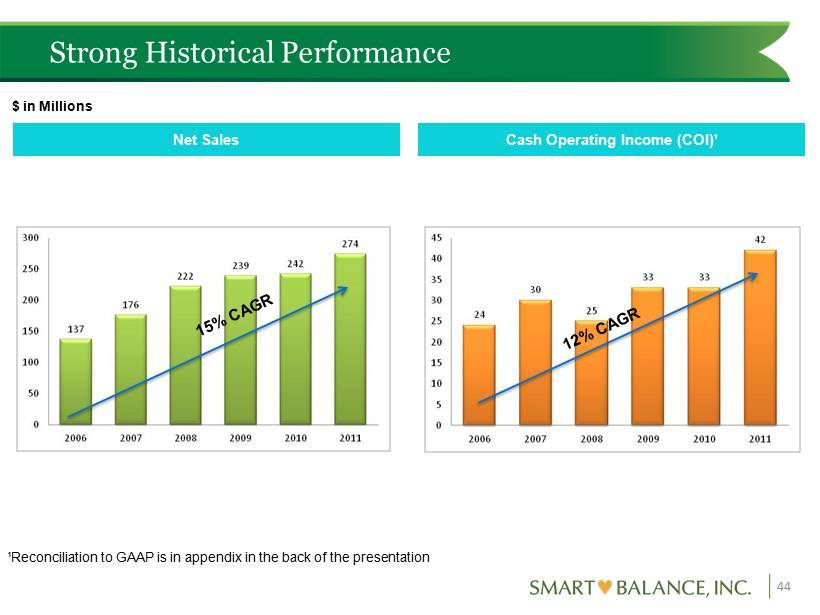
Strong Historical Performance 44 Net Sales $ in Millions Cash Operating Income (COI) ¹ ¹ Reconciliation to GAAP is in appendix in the back of the presentation
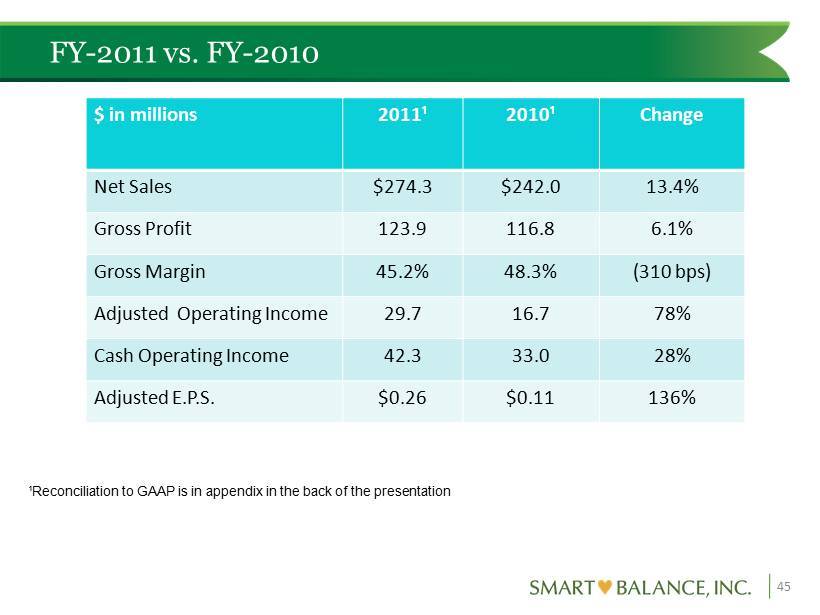
FY - 2011 vs. FY - 2010 45 $ in millions 2011¹ 2010¹ Change Net Sales $274.3 $242.0 13.4% Gross Profit 123.9 116.8 6.1% Gross Margin 45.2% 48.3% (310 bps) Adjusted Operating Income 29.7 16.7 78% Cash Operating Income 42.3 33.0 28% Adjusted E.P.S. $0.26 $0.11 136% ¹ Reconciliation to GAAP is in appendix in the back of the presentation
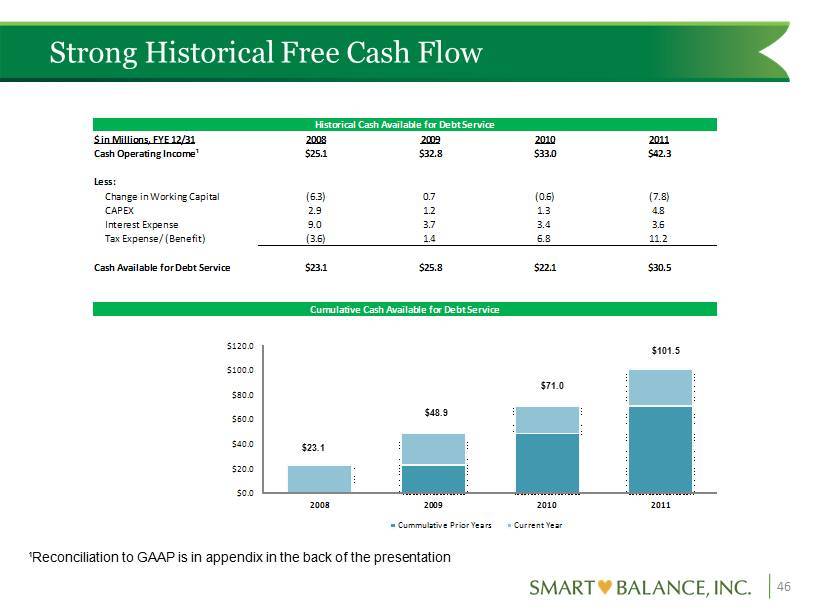
Strong Historical Free Cash Flow 46 ¹ Reconciliation to GAAP is in appendix in the back of the presentation $ in Millions, FYE 12/31 2008 2009 2010 2011 Cash Operating Income¹ $25.1 $32.8 $33.0 $42.3 Less: Change in Working Capital (6.3) 0.7 (0.6) (7.8) CAPEX 2.9 1.2 1.3 4.8 Interest Expense 9.0 3.7 3.4 3.6 Tax Expense/ (Benefit) (3.6) 1.4 6.8 11.2 Cash Available for Debt Service $23.1 $25.8 $22.1 $30.5 2008 2009 2010 2011 Cummulative Prior Years $23.1 $48.9 $71.0 Current Year $23.1 $25.8 $22.1 $30.5 $48.9 $71.0 $101.5 Historical Cash Available for Debt Service Cumulative Cash Available for Debt Service $0.0 $20.0 $40.0 $60.0 $80.0 $100.0 $120.0 2008 2009 2010 2011 Cummulative Prior Years Current Year $101.5 $71.0 $23.1 $48.9
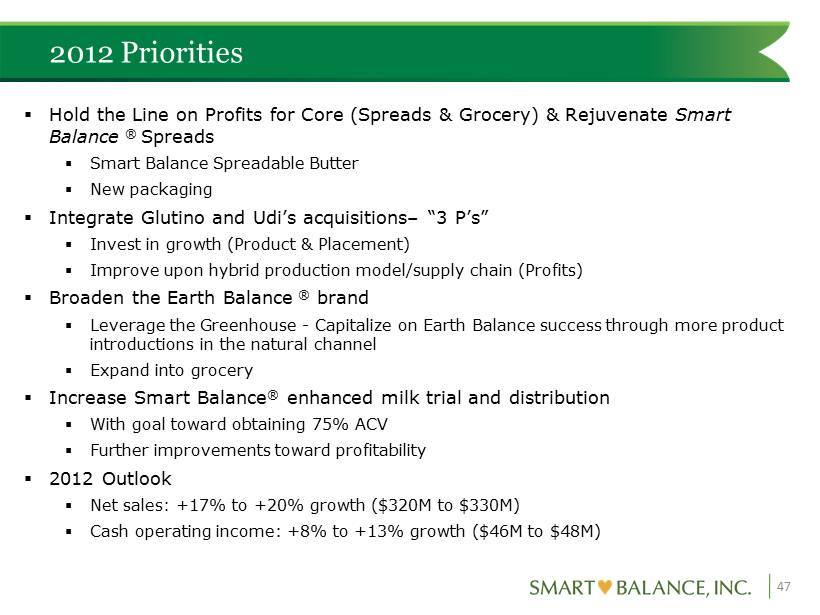
2012 Priorities 47 ▪ Hold the Line on Profits for Core (Spreads & Grocery) & Rejuvenate Smart Balance ® Spreads ▪ Smart Balance Spreadable Butter ▪ New packaging ▪ Integrate Glutino and Udi’s acquisitions – “3 P’s” ▪ Invest in growth (Product & Placement) ▪ Improve upon hybrid production model/supply chain (Profits) ▪ Broaden the Earth Balance ® brand ▪ Leverage the Greenhouse - Capitalize on Earth Balance success through more product introductions in the natural channel ▪ Expand into grocery ▪ Increase Smart Balance ® enhanced milk trial and distribution ▪ With goal toward obtaining 75% ACV ▪ Further improvements toward profitability ▪ 2012 Outlook ▪ Net sales: +17% to +20% growth ($320M to $330M) ▪ Cash operating income: +8% to +13% growth ($46M to $48M)
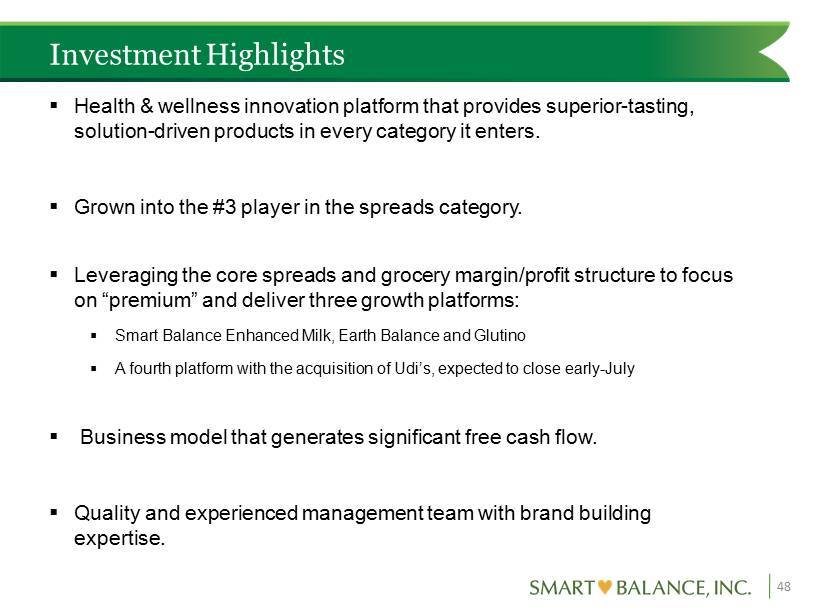
Investment Highlights 48 ▪ Health & wellness innovation platform that provides superior - tasting, solution - driven products in every category it enters. ▪ Grown into the #3 player in the spreads category. ▪ Leveraging the core spreads and grocery margin/profit structure to focus on “premium” and deliver three growth platforms: ▪ Smart Balance Enhanced Milk, Earth Balance and Glutino ▪ A fourth platform with the acquisition of Udi’s, expected to close early - July ▪ Business model that generates significant free cash flow. ▪ Quality and experienced management team with brand building expertise.
APPENDIX 49
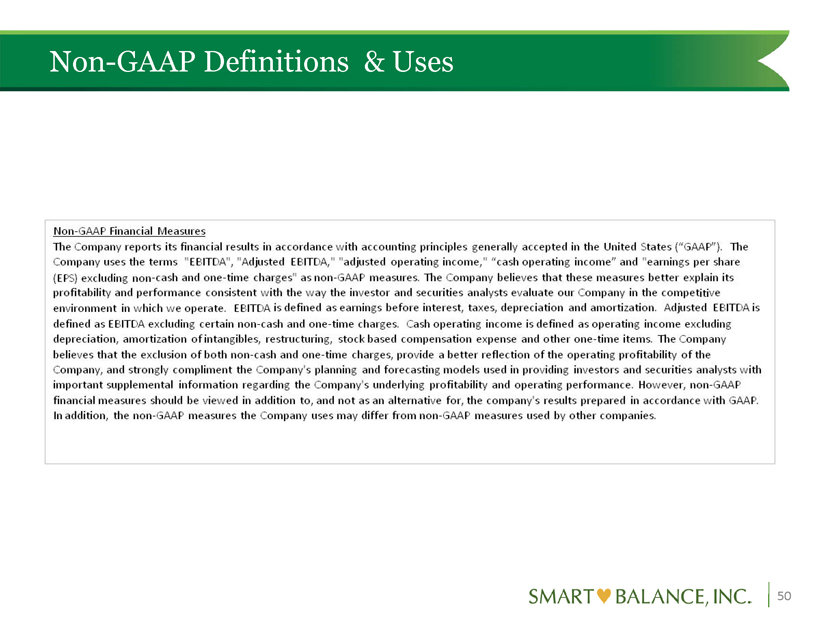
Non - GAAP Definitions & Uses 50
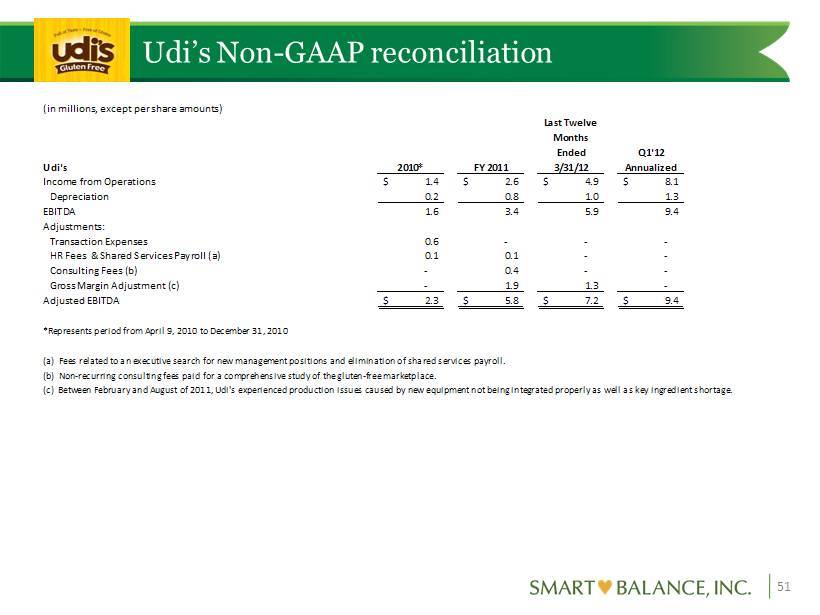
Udi’s Non - GAAP reconciliation 51 (in millions, except per share amounts) Udi's 2010* FY 2011 Last Twelve Months Ended 3/31/12 Q1'12 Annualized Income from Operations 1.4$ 2.6$ 4.9$ 8.1$ Depreciation 0.2 0.8 1.0 1.3 EBITDA 1.6 3.4 5.9 9.4 Adjustments: Transaction Expenses 0.6 - - - HR Fees & Shared Services Payroll (a) 0.1 0.1 - - Consulting Fees (b) - 0.4 - - Gross Margin Adjustment (c) - 1.9 1.3 - Adjusted EBITDA 2.3$ 5.8$ 7.2$ 9.4$ *Represents period from April 9, 2010 to December 31, 2010 (a) Fees related to an executive search for new management positions and elimination of shared services payroll. (b) Non-recurring consulting fees paid for a comprehensive study of the gluten-free marketplace. (c) Between February and August of 2011, Udi's experienced production issues caused by new equipment not being integrated properly as well as key ingredient shortage.
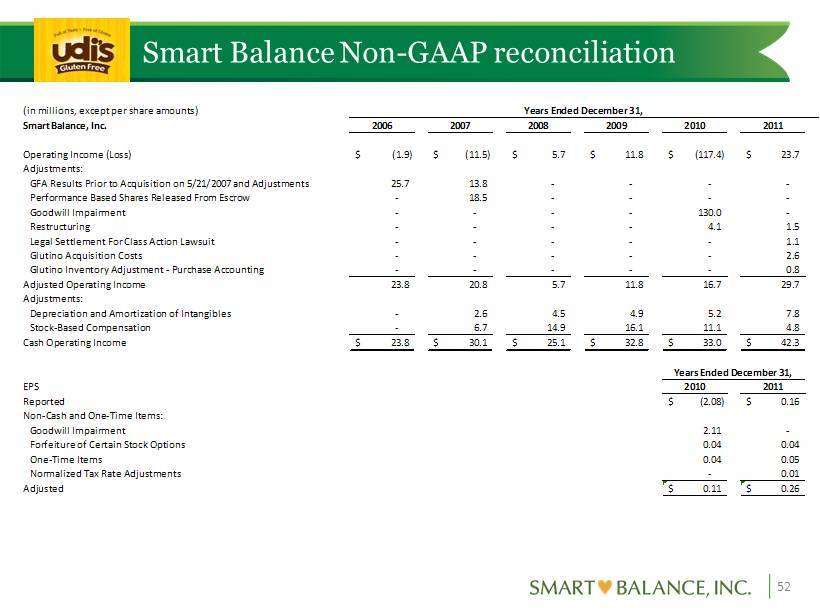
Smart Balance Non - GAAP reconciliation 52 (in millions, except per share amounts) Smart Balance, Inc. 2006 2007 2008 2009 2010 2011 Operating Income (Loss) (1.9)$ (11.5)$ 5.7$ 11.8$ (117.4)$ 23.7$ Adjustments: GFA Results Prior to Acquisition on 5/21/2007 and Adjustments 25.7 13.8 - - - - Performance Based Shares Released From Escrow - 18.5 - - - - Goodwill Impairment - - - - 130.0 - Restructuring - - - - 4.1 1.5 Legal Settlement For Class Action Lawsuit - - - - - 1.1 Glutino Acquisition Costs - - - - - 2.6 Glutino Inventory Adjustment - Purchase Accounting - - - - - 0.8 Adjusted Operating Income 23.8 20.8 5.7 11.8 16.7 29.7 Adjustments: Depreciation and Amortization of Intangibles - 2.6 4.5 4.9 5.2 7.8 Stock-Based Compensation - 6.7 14.9 16.1 11.1 4.8 Cash Operating Income 23.8$ 30.1$ 25.1$ 32.8$ 33.0$ 42.3$ EPS 2010 2011 Reported (2.08)$ 0.16$ Non-Cash and One-Time Items: Goodwill Impairment 2.11 - Forfeiture of Certain Stock Options 0.04 0.04 One-Time Items 0.04 0.05 Normalized Tax Rate Adjustments - 0.01 Adjusted 0.11$ 0.26$ Years Ended December 31, Years Ended December 31,