Attached files
| file | filename |
|---|---|
| EX-31.2 - EXHIBIT 31.2 - RED METAL RESOURCES, LTD. | ex31-2.htm |
| EX-31.1 - EXHIBIT 31.1 - RED METAL RESOURCES, LTD. | ex31-1.htm |
| EXCEL - IDEA: XBRL DOCUMENT - RED METAL RESOURCES, LTD. | Financial_Report.xls |
| EX-32 - EXHIBIT 32 - RED METAL RESOURCES, LTD. | ex32.htm |
UNITED STATES
SECURITIES AND EXCHANGE COMMISSION
Washington, D.C. 20549
FORM 10-Q
|
[ X ]
|
QUARTERLY REPORT UNDER SECTION 13 0R 15(d) OF THE SECURITIES EXCHANGE ACT OF 1934
|
For the quarterly period ended: April 30, 2012
|
[ ]
|
TRANSITION REPORT UNDER SECTION 13 0R 15(d) OF THE SECURITIES EXCHANGE ACT OF 1934
|
For the transition period from_______to_______
Commission file number 000-52055
|
RED METAL RESOURCES LTD.
|
|
(Exact name of small business issuer as specified in its charter)
|
|
Nevada
(State or other jurisdiction
of incorporation or organization)
|
20-2138504
(I.R.S. Employer
Identification No.)
|
|
195 Park Avenue, Thunder Bay Ontario, Canada P7B 1B9
|
|
|
(Address of principal executive offices) (Zip Code)
(807) 345-7384
|
|
(Issuer’s telephone number)
Indicate by check mark whether the registrant (1) has filed all reports required to be filed by Section 13 or 15(d) of the Exchange Act during the past 12 months (or for such shorter period that the registrant was required to file such reports), and (2) has been subject to such filing requirements for the past 90 days. [ X ] Yes [ ] No
Indicate by check mark whether the registrant has submitted electronically and posted on its corporate Web site, if any, every Interactive Data File required to be submitted and posted pursuant to Rule 405 of Regulation S-T (§232.405 of this chapter) during the preceding 12 months (or for such shorter period that the registrant was required to submit and post such files).
[ X ] Yes [ ] No
Indicate by check mark whether the registrant is a large accelerated filer, an accelerated filer, a non-accelerated filer, or a smaller reporting company. See the definitions of “large accelerated filed,” “accelerated filer” and “smaller reporting company” in Rule 12b-2 of the Exchange Act.
|
Large accelerated filer
|
o
|
Accelerated filer
|
o
|
|
|
Non-accelerated filer
|
o
|
(Do not check if a smaller reporting company)
|
Smaller reporting company
|
x
|
Indicate by check mark whether the registrant is a shell company (as defined in Rule 12b-2 of the Act). [ ] Yes [ X ] No
Indicate the number of shares outstanding of each of the issuer’s classes of common stock, as of the latest practicable date. As of June 14, 2012 the number of shares of the registrant’s common stock outstanding was 17,956,969.
TABLE OF CONTENTS
| PART I—FINANCIAL INFORMATION |
|
|||
| Item 1. |
Financial Statements.
|
|
||
| CONSOLIDATED BALANCE SHEETS |
1
|
|||
| CONSOLIDATED STATEMENTS OF OPERATIONS |
2
|
|||
| CONSOLIDATED STATEMENT OF STOCKHOLDERS' EQUITY (DEFICIT) |
3
|
|||
| CONSOLIDATED STATEMENTS OF CASH FLOWS |
4
|
|||
| NOTES TO FINANCIAL STATEMENTS | 5 | |||
| Item 2. |
Management’s Discussion and Analysis of Financial Condition and Results of Operations.
|
8
|
||
| Item 3. |
Quantitative and Qualitative Disclosures about Market Risk.
|
24
|
||
| Item 4. |
Controls and Procedures.
|
24
|
||
| PART II—OTHER INFORMATION |
|
|||
| Item 1. |
Legal Proceedings.
|
24
|
||
| Item 1A. |
Risk Factors.
|
24
|
||
| Item 2. |
Unregistered Sales of Equity Securities and Use of Proceeds.
|
24
|
||
| Item 3. |
Defaults upon Senior Securities.
|
25
|
||
| Item 4. |
Mine Safety Disclosures
|
25
|
||
| Item 5. |
Other Information.
|
25
|
||
| Item 6. |
Exhibits.
|
25
|
||
PART I—FINANCIAL INFORMATION
Item 1. Financial Statements.
RED METAL RESOURCES, LTD.
(AN EXPLORATION STAGE COMPANY)
CONSOLIDATED BALANCE SHEETS
|
April 30, 2012
|
January 31, 2012
|
|||||||
|
(UNAUDITED)
|
||||||||
|
ASSETS
|
||||||||
|
Current assets
|
||||||||
|
Cash
|
$ | 127,087 | $ | 24,467 | ||||
|
Prepaids and other receivables
|
36,255 | 45,156 | ||||||
|
Total current assets
|
163,342 | 69,623 | ||||||
|
Equipment
|
15,477 | 16,713 | ||||||
|
Unproved mineral properties
|
858,319 | 796,828 | ||||||
|
Total assets
|
$ | 1,037,138 | $ | 883,164 | ||||
|
LIABILITIES AND STOCKHOLDERS' DEFICIT
|
||||||||
|
Current liabilities
|
||||||||
|
Accounts payable
|
$ | 293,841 | $ | 206,675 | ||||
|
Accrued liabilities
|
136,796 | 121,701 | ||||||
|
Due to related parties
|
1,098,280 | 905,562 | ||||||
|
Notes payable to related party
|
243,983 | 236,820 | ||||||
|
Total liabilities
|
1,772,900 | 1,470,758 | ||||||
|
Stockholders' deficit
|
||||||||
|
Common stock, $0.001 par value, authorized 500,000,000, 17,956,969 and 17,189,634 issued and outstanding at April 30, 2012 and January 31, 2012
|
17,957 | 17,190 | ||||||
|
Additional paid in capital
|
5,736,278 | 5,466,744 | ||||||
|
Deficit accumulated during the exploration stage
|
(6,382,670 | ) | (5,985,007 | ) | ||||
|
Accumulated other comprehensive loss
|
(107,327 | ) | (86,521 | ) | ||||
|
Total stockholders' deficit
|
(735,762 | ) | (587,594 | ) | ||||
|
Total liabilities and stockholders' deficit
|
$ | 1,037,138 | $ | 883,164 | ||||
The accompanying notes are an integral part of these interim consolidated financial statements
1
RED METAL RESOURCES LTD.
(AN EXPLORATION STAGE COMPANY)
CONSOLIDATED STATEMENTS OF OPERATIONS
(UNAUDITED)
|
Three months ended
|
From January 10,
|
|||||||||||
|
April 30,
|
2005 (Inception)
|
|||||||||||
|
2012
|
2011
|
to April 30, 2012
|
||||||||||
|
Revenue
|
||||||||||||
|
Royalties
|
$ | - | $ | - | $ | 15,658 | ||||||
|
Geological services
|
7,804 | - | 7,804 | |||||||||
|
Total revenue
|
7,804 | - | 23,462 | |||||||||
|
Operating expenses
|
||||||||||||
|
Administration
|
10,115 | 20,686 | 329,311 | |||||||||
|
Advertising and promotion
|
22,974 | 40,527 | 550,209 | |||||||||
|
Amortization
|
1,236 | - | 4,343 | |||||||||
|
Automobile
|
4,244 | 5,975 | 97,625 | |||||||||
|
Bank charges
|
1,368 | 2,636 | 24,354 | |||||||||
|
Consulting fees
|
80,712 | 66,220 | 865,974 | |||||||||
|
Interest on current debt
|
15,032 | 18,606 | 228,140 | |||||||||
|
IVA expense
|
2,353 | - | 36,133 | |||||||||
|
Mineral exploration costs
|
130,820 | 35,230 | 2,036,074 | |||||||||
|
Office
|
8,965 | 3,337 | 61,902 | |||||||||
|
Professional development
|
- | - | 5,116 | |||||||||
|
Professional fees
|
58,015 | 47,905 | 752,152 | |||||||||
|
Rent
|
3,408 | 3,456 | 58,679 | |||||||||
|
Regulatory
|
20,632 | 7,998 | 97,711 | |||||||||
|
Travel and entertainment
|
21,654 | 13,932 | 314,334 | |||||||||
|
Salaries, wages and benefits
|
23,595 | 5,020 | 160,306 | |||||||||
|
Stock based compensation
|
- | - | 527,318 | |||||||||
|
Foreign exchange loss
|
344 | 10,839 | 15,296 | |||||||||
|
Write-down of unproved mineral properties
|
- | 2,909 | 241,155 | |||||||||
|
Total operating expenses
|
405,467 | 285,276 | 6,406,132 | |||||||||
|
Net loss
|
$ | (397,663 | ) | $ | (285,276 | ) | $ | (6,382,670 | ) | |||
|
Net loss per share - basic and diluted
|
$ | (0.02 | ) | $ | (0.02 | ) | ||||||
|
Weighted average number of shares outstanding - basic and diluted
|
17,584,212 | 12,029,335 | ||||||||||
The accompanying notes are an integral part of these interim consolidated financial statements
2
RED METAL RESOURCES LTD.
(AN EXPLORATION STAGE COMPANY)
CONSOLIDATED STATEMENT OF STOCKHOLDERS' EQUITY (DEFICIT)
(UNAUDITED)
| Common Stock Issued | Accumulated | |||||||||||||||||||||||
|
|
Number of
Shares |
Amount
|
Additional
Paid-in |
Accumulated
Deficit |
Other
Comprehensive |
Total
|
||||||||||||||||||
|
Balance at January 10, 2005 (Inception)
|
- | $ | - | $ | - | $ | - | $ | - | $ | - | |||||||||||||
|
|
||||||||||||||||||||||||
|
Net loss
|
- | - | - | (825 | ) | - | (825 | ) | ||||||||||||||||
|
|
||||||||||||||||||||||||
|
Balance at January 31, 2005
|
- | - | - | (825 | ) | - | (825 | ) | ||||||||||||||||
|
|
||||||||||||||||||||||||
|
Common stock issued for cash
|
5,525,000 | 5,525 | 53,725 | - | - | 59,250 | ||||||||||||||||||
|
Common stock adjustment
|
45 | - | - | - | - | - | ||||||||||||||||||
|
Donated services
|
- | - | 3,000 | - | - | 3,000 | ||||||||||||||||||
|
Net loss
|
- | - | - | (12,363 | ) | - | (12,363 | ) | ||||||||||||||||
|
|
||||||||||||||||||||||||
|
Balance at January 31, 2006
|
5,525,045 | 5,525 | 56,725 | (13,188 | ) | - | 49,062 | |||||||||||||||||
|
|
||||||||||||||||||||||||
|
Donated services
|
- | - | 9,000 | - | - | 9,000 | ||||||||||||||||||
|
Net loss
|
- | - | - | (43,885 | ) | - | (43,885 | ) | ||||||||||||||||
|
|
||||||||||||||||||||||||
|
Balance at January 31, 2007
|
5,525,045 | 5,525 | 65,725 | (57,073 | ) | - | 14,177 | |||||||||||||||||
|
|
||||||||||||||||||||||||
|
Donated services
|
- | - | 2,250 | - | - | 2,250 | ||||||||||||||||||
|
Return of common stock to treasury
|
(1,750,000 | ) | (1,750 | ) | 1,749 | - | - | (1 | ) | |||||||||||||||
|
Common stock issued for cash
|
23,810 | 24 | 99,976 | - | - | 100,000 | ||||||||||||||||||
|
Net loss
|
- | - | - | (232,499 | ) | - | (232,499 | ) | ||||||||||||||||
|
|
||||||||||||||||||||||||
|
Balance at January 31, 2008
|
3,798,855 | 3,799 | 169,700 | (289,572 | ) | - | (116,073 | ) | ||||||||||||||||
|
|
||||||||||||||||||||||||
|
Common stock issued for cash
|
357,147 | 357 | 1,299,643 | - | - | 1,300,000 | ||||||||||||||||||
|
Net loss
|
- | - | - | (1,383,884 | ) | - | (1,383,884 | ) | ||||||||||||||||
|
Foreign currency exchange loss
|
- | - | - | - | (21,594 | ) | (21,594 | ) | ||||||||||||||||
|
Balance at January 31, 2009
|
4,156,002 | 4,156 | 1,469,343 | (1,673,456 | ) | (21,594 | ) | (221,551 | ) | |||||||||||||||
|
Common stock issued for cash
|
1,678,572 | 1,678 | 160,822 | - | - | 162,500 | ||||||||||||||||||
|
Common stock issued for debt
|
3,841,727 | 3,843 | 1,148,675 | - | - | 1,152,518 | ||||||||||||||||||
|
Net loss
|
- | - | - | (710,745 | ) | - | (710,745 | ) | ||||||||||||||||
|
Foreign currency exchange loss
|
- | - | - | - | (35,816 | ) | (35,816 | ) | ||||||||||||||||
|
|
||||||||||||||||||||||||
|
Balance at January 31, 2010
|
9,676,301 | 9,677 | 2,778,840 | (2,384,201 | ) | (57,410 | ) | 346,906 | ||||||||||||||||
|
Common stock issued for cash
|
540,000 | 540 | 134,460 | - | - | 135,000 | ||||||||||||||||||
|
Net loss for the year ended January 31, 2011
|
- | - | - | (672,618 | ) | - | (672,618 | ) | ||||||||||||||||
|
Foreign currency exchange loss
|
- | - | - | - | (13,438 | ) | (13,438 | ) | ||||||||||||||||
|
Balance at January 31, 2011
|
10,216,301 | 10,217 | 2,913,300 | (3,056,819 | ) | (70,848 | ) | (204,150 | ) | |||||||||||||||
|
Common stock issued for cash
|
6,290,000 | 6,290 | 1,821,810 | - | - | 1,828,100 | ||||||||||||||||||
|
Common stock issued for debt
|
433,333 | 433 | 129,567 | - | - | 130,000 | ||||||||||||||||||
|
Net loss for the three months ended April 30, 2011
|
- | - | - | (285,276 | ) | - | (285,276 | ) | ||||||||||||||||
|
Foreign currency exchange loss
|
- | - | - | - | (11,778 | ) | (11,778 | ) | ||||||||||||||||
|
Balance at April 30, 2011
|
16,939,634 | 16,940 | 4,864,677 | (3,342,095 | ) | (82,626 | ) | 1,456,896 | ||||||||||||||||
|
Warrants exercised for cash
|
83,333 | 83 | 24,916 | - | - | 24,999 | ||||||||||||||||||
|
Warrants exercised for debt
|
166,667 | 167 | 49,833 | - | - | 50,000 | ||||||||||||||||||
|
Stock options
|
- | - | 527,318 | - | - | 527,318 | ||||||||||||||||||
|
Net loss for the nine months ended January 31, 2012
|
- | - | - | (2,642,912 | ) | - | (2,642,912 | ) | ||||||||||||||||
|
Foreign currency exchange loss
|
- | - | - | - | (3,895 | ) | (3,895 | ) | ||||||||||||||||
|
Balance at January 31, 2012
|
17,189,634 | 17,190 | 5,466,744 | (5,985,007 | ) | (86,521 | ) | (587,594 | ) | |||||||||||||||
|
Warrants exercised for cash
|
500,000 | 500 | 149,500 | - | - | 150,000 | ||||||||||||||||||
|
Common stock issued for cash
|
267,335 | 267 | 120,034 | - | - | 120,301 | ||||||||||||||||||
|
Net loss for the three months ended April 30, 2012
|
- | - | - | (397,663 | ) | - | (397,663 | ) | ||||||||||||||||
|
Foreign currency exchange loss
|
- | - | - | - | (20,806 | ) | (20,806 | ) | ||||||||||||||||
|
Balance at April 30, 2012
|
17,956,969 | $ | 17,957 | $ | 5,736,278 | $ | (6,382,670 | ) | $ | (107,327 | ) | $ | (735,762 | ) | ||||||||||
The accompanying notes are an integral part of these interim consolidated financial statements
3
RED METAL RESOURCES LTD.
(AN EXPLORATION STAGE COMPANY)
CONSOLIDATED STATEMENTS OF CASH FLOWS
(UNAUDITED)
|
For the three months
|
From January 10,
|
|||||||||||
|
Ended April 30,
|
2005 (Inception)
|
|||||||||||
|
2012
|
2011
|
to April 30, 2012
|
||||||||||
|
Cash flows used in operating activities:
|
||||||||||||
|
Net loss
|
$ | (397,663 | ) | $ | (285,276 | ) | $ | (6,382,670 | ) | |||
|
Adjustments to reconcile net loss to net cash used in operating activities:
|
||||||||||||
|
Donated services and rent
|
- | - | 14,250 | |||||||||
|
Write-down of unproved mineral properties
|
- | 2,909 | 241,156 | |||||||||
|
Amortization
|
1,236 | - | 4,343 | |||||||||
|
Stock based compensation
|
- | - | 527,318 | |||||||||
|
Changes in operating assets and liabilities:
|
||||||||||||
|
Prepaids and other receivables
|
8,901 | (65,582 | ) | (36,255 | ) | |||||||
|
Accounts payable
|
87,166 | (75,588 | ) | 293,842 | ||||||||
|
Accrued liabilities
|
15,095 | 19,993 | 277,520 | |||||||||
|
Due to related parties
|
192,718 | (139,125 | ) | 1,436,303 | ||||||||
|
Accrued interest on notes payable to related party
|
4,731 | 2,275 | 87,477 | |||||||||
|
Net cash used in operating activities
|
(87,816 | ) | (540,394 | ) | (3,536,716 | ) | ||||||
|
Cash flows used in investing activities:
|
||||||||||||
|
Purchase of fixed assets
|
- | - | (19,820 | ) | ||||||||
|
Acquisition of unproved mineral properties
|
(61,491 | ) | (52,839 | ) | (1,238,529 | ) | ||||||
|
Net cash used in investing activities
|
(61,491 | ) | (52,839 | ) | (1,258,349 | ) | ||||||
|
Cash flows provided by financing activities:
|
||||||||||||
|
Cash received on issuance of notes payable to related party
|
57,000 | 93,283 | 1,218,279 | |||||||||
|
Repayment of related party notes, including accrued interest
|
(56,553 | ) | (14,382 | ) | (70,935 | ) | ||||||
|
Proceeds from issuance of common stock
|
270,301 | 1,828,099 | 3,880,150 | |||||||||
|
Net cash provided by financing activities
|
270,748 | 1,907,000 | 5,027,494 | |||||||||
|
Effects of foreign currency exchange
|
(18,821 | ) | (11,778 | ) | (105,342 | ) | ||||||
|
Increase in cash
|
102,620 | 1,301,989 | 127,087 | |||||||||
|
Cash, beginning
|
24,467 | 8,655 | - | |||||||||
|
Cash, ending
|
$ | 127,087 | $ | 1,310,644 | $ | 127,087 | ||||||
|
Supplemental disclosures:
|
||||||||||||
|
Cash paid for:
|
||||||||||||
|
Income tax
|
$ | - | $ | - | $ | - | ||||||
|
Interest
|
$ | (6,553 | ) | $ | (1,778 | ) | $ | (7,883 | ) | |||
The accompanying notes are an integral part of these interim consolidated financial statements
4
RED METAL RESOURCES LTD.
(AN EXPLORATION STAGE COMPANY)
NOTES TO THE CONSOLIDATED FINANCIAL STATEMENTS
APRIL 30, 2012
NOTE 1 – ORGANIZATION AND BASIS OF PRESENTATION
Nature of Operations
Red Metal Resources Ltd. (the “Company”) was incorporated on January 10, 2005, under the laws of the State of Nevada. On August 21, 2007, the Company acquired a 99% interest in Minera Polymet Limitada (“Polymet”), a limited liability company formed on August 21, 2007, under the laws of the Republic of Chile. The Company is involved in acquiring and exploring mineral properties in Chile. The Company has not determined whether its properties contain mineral reserves that are economically recoverable.
Unaudited Interim Consolidated Financial Statements
The unaudited interim financial statements of the Company have been prepared in accordance with United States generally accepted accounting principles (“GAAP”) for interim financial information and the rules and regulations of the Securities and Exchange Commission (“SEC”). They do not include all information and footnotes required by GAAP for complete financial statements. Except as disclosed herein, there have been no material changes in the information disclosed in the notes to the financial statements for the year ended January 31, 2012, included in the Company’s Annual Report on Form 10-K, filed with the SEC. The interim unaudited financial statements should be read in conjunction with those financial statements included in Form 10-K. In the opinion of management, all adjustments considered necessary for fair presentation, consisting solely of normal recurring adjustments, have been made. Operating results for the three month period ended April 30, 2012, are not necessarily indicative of the results that may be expected for the year ending January 31, 2013.
Recent Accounting Pronouncements
The Company has reviewed recently issued accounting pronouncements and plans to adopt those that are applicable to it. It does not expect the adoption of these pronouncements to have a material impact on its financial position, results of operations or cash flows.
NOTE 2 – RELATED-PARTY TRANSACTIONS
The following amounts were due to related parties as at:
|
April 30, 2012
|
January 31, 2012
|
|||||||
|
Due to a company owned by an officer
|
$ | 225,178 | $ | 190,608 | ||||
|
Due to a company controlled by directors
|
811,793 | 658,950 | ||||||
|
Due to a company controlled by a major shareholder
|
55,143 | 51,957 | ||||||
|
Due to an officer of Chilean subsidiary
|
6,166 | 4,047 | ||||||
|
Total due to related parties (a)
|
$ | 1,098,280 | $ | 905,562 | ||||
|
Note payable to a related party (b)
|
$ | - | $ | 56,164 | ||||
|
Note payable to a director (c)
|
57,179 | 55,129 | ||||||
|
Note payable to a chief financial officer (c)
|
8,671 | 8,502 | ||||||
|
Note payable to a major shareholder (c)
|
111,846 | 53,115 | ||||||
|
Note payable to a company controlled by directors (c)
|
66,287 | 63,910 | ||||||
|
Total notes payable to related parties
|
$ | 243,983 | $ | 236,820 | ||||
(a) Amounts due to related parties are unsecured, are due on demand and bear no interest.
(b) The note payable was due on demand, unsecured and bore interest at 6% per annum. The principle of $50,000 and accumulated interest of $6,553 were paid in full on March 13, 2012.
(c) The notes payable to related parties are due on demand, unsecured and bear interest at 8% per annum.
5
Transactions with Related Parties
The Company incurred the following expenses with related parties during the three months ending:
|
April 30, 2012
|
April 30, 2011
|
|||||||
|
Consulting fees and other business expenses paid to a company controlled by the Chief Financial Officer
|
$ | 78,127 | $ | 66,492 | ||||
|
Advertising and promotion, mineral exploration and other business expenses paid to a company controlled by two directors
|
$ | 117,532 | $ | 79,208 | ||||
|
Administration, automobile, rental, and other business expenses paid to a company controlled by a major shareholder
|
$ | 7,371 | $ | 16,525 | ||||
|
Administration expenses paid to an officer of the Company’s Chilean subsidiary
|
$ | 13,141 | $ | 7,018 | ||||
NOTE 3 – UNPROVED MINERAL PROPERTIES
The Company has four unproved mineral properties which it is currently exploring and evaluating: the Farellon, Perth, Mateo, and Veta Negra. These properties consist of both mining and exploration claims.
As of April 30, 2012, the Company had spent the total of $858,319 on acquiring and maintaining unproved mineral properties:
| Mineral Claims |
Balance,
January 31, 2012
|
Additions
|
Property Taxes Paid / Accrued
|
Balance,
April 30, 2012
|
||||||||||||
| Farellon Project | ||||||||||||||||
|
Farellon Alto 1-8(1)
|
$ | 552,975 | $ | - | $ | 3,226 | $ | 556,201 | ||||||||
|
Cecil
|
41,746 | - | 5,847 | 47,593 | ||||||||||||
| 594,721 | - | 9,073 | 603,794 | |||||||||||||
|
Perth Project
|
||||||||||||||||
|
Perth
|
19,371 | 15,367 | 16,994 | 51,732 | ||||||||||||
|
Mateo Project
|
||||||||||||||||
|
Margarita
|
18,195 | - | 452 | 18,647 | ||||||||||||
|
Che (2)
|
23,895 | - | 572 | 24,467 | ||||||||||||
|
Irene
|
47,174 | - | 484 | 47,658 | ||||||||||||
|
Mateo
|
33,065 | 15,502 | 968 | 49,535 | ||||||||||||
| 122,329 | 15,502 | 2,476 | 140,307 | |||||||||||||
|
Veta Negra Project
|
||||||||||||||||
|
Veta Negra (3)
|
18,480 | - | 374 | 18,937 | ||||||||||||
|
Pibe(4)
|
40,000 | - | 1,705 | 41,622 | ||||||||||||
| 58,480 | - | 2,079 | 60,559 | |||||||||||||
|
Generative Claims
|
||||||||||||||||
| 1,927 | - | - | 1,927 | |||||||||||||
|
Total Costs
|
$ | 796,828 | $ | 30,869 | $ | 30,622 | $ | 858,319 | ||||||||
(1) The claim is subject to a 1.5% royalty on the net sales of minerals extracted from the property to a total of $600,000. The royalty payments are due monthly once exploitation begins, and are subject to minimum payments of $1,000 per month.
(2) The claims are subject to a 1% royalty on the net sales of minerals extracted from the property to a total of $100,000. The royalty payments are due monthly once exploitation begins.
(3) The option to purchase contract has a term of 31 months with semi-annual payments totaling $107,500. The claims are subject to a 1.5% royalty on the net sales of minerals extracted to a total of $500,000. The royalty payments are due monthly once exploitation begins.
(4) The option to purchase contract has a term of 36 months with semi-annual payments totaling $500,000. The claims are subject to a 1.5% royalty on the sales of minerals extracted to a total of $1,000,000 with no monthly minimum. The payments are due once exploitation begins.
6
NOTE 4 – COMMON STOCK
On April 12, 2012, the Company engaged in a private offering of units pursuant to which it issued 267,335 units at a price of $0.45 per unit for cash of $120,301. Each unit consists of one common share and one share purchase warrant. Each share purchase warrant is exercisable at $0.65 for two years.
On March 5, 2012, warrants to purchase 400,000 shares of common stock were exercised at $0.30 per share. The Company received $120,000 for this exercise.
On February 7, 2012, warrants to purchase 100,000 shares of common stock were exercised at $0.30 per share. The Company received $30,000 for this exercise.
Warrants
|
Balance, January 31, 2012
|
7,459,666 | |||
|
Granted
|
267,335 | |||
|
Exercised
|
(500,000 | ) | ||
|
Expired
|
(40,000 | ) | ||
|
Balance, April 30, 2012
|
7,187,001 |
The weighted average life and weighted average exercise price of the warrants as at April 30, 2012 is 0.98 years and $0.51, respectively.
Options
The weighted average life and weighted average exercise price of the 1,040,000 options outstanding at April 30, 2012 is 1.34 years and $0.50, respectively
NOTE 5 – CONTINGENCY
During the three months ended April 30, 2012, the Company received a penalty notice from the US Internal Revenue Service (“IRS”) for failure to file a certain tax form within prescribed deadline. The Company believes that it filed the questioned form on time and submitted supporting documentation to the IRS appeal department; therefore, the Company has not accrued for the penalty which was assessed for $10,000 plus accrued interest of $146.
NOTE 6 – SUBSEQUENT EVENT
On May 15, 2012, the Company decided not to pursue the option to purchase the Exon claim and furnished the owner of the claim with the cancellation notice. The claim was a part of the Veta Negra option to purchase contract (Note 3); it was a subject to semi-annual option payments totaling $45,000.
7
Item 2. Management’s Discussion and Analysis of Financial Condition and Results of Operations.
Forward-Looking Statements
This quarterly report on form 10-Q filed by Red Metal Resources Ltd. contains forward-looking statements. These are statements regarding financial and operating performance and results and other statements that are not historical facts. The words “expect,” “project,” “estimate,” “believe,” “anticipate,” “intend,” “plan,” “forecast,” and similar expressions are intended to identify forward-looking statements. Certain important risks could cause results to differ materially from those anticipated by some of the forward-looking statements. Some, but not all, of these risks include, among other things:
|
|
•
|
general economic conditions, because they may affect our ability to raise money
|
|
|
•
|
our ability to raise enough money to continue our operations
|
|
|
•
|
changes in regulatory requirements that adversely affect our business
|
|
|
•
|
changes in the prices for minerals that adversely affect our business
|
|
|
•
|
political changes in Chile, which could affect our interests there
|
|
|
•
|
other uncertainties, all of which are difficult to predict and many of which are beyond our control
|
We caution you not to place undue reliance on these forward-looking statements, which reflect our management’s view only as of the date of this report. We are not obligated to update these statements or publicly release the results of any revisions to them to reflect events or circumstances after the date of this report or to reflect the occurrence of unanticipated events. You should refer to, and carefully review, the information in future documents we file with the Securities and Exchange Commission.
General
You should read this discussion and analysis in conjunction with our interim unaudited consolidated financial statements and related notes included in this Form 10-Q and the audited consolidated financial statements and related notes included in our annual report on Form 10-K for the fiscal year ended January 31, 2012. The inclusion of supplementary analytical and related information may require us to make estimates and assumptions to enable us to fairly present, in all material respects, our analysis of trends and expectations with respect to our results of operations and financial position taken as a whole. Actual results may vary from the estimates and assumptions we make.
Overview
Red Metal is a mineral exploration company engaged in locating, and eventually developing, mineral resources in Chile. Our business strategy is to identify, acquire and explore prospective mineral claims with a view to either developing them ourselves or, more likely, finding a joint venture partner with the mining experience and financial means to undertake the development. All of our claims are in the Candelaria IOCG belt in the Chilean Coastal Cordillera.
Since the revenue we have received from our operations is very minimal, we are dependent upon the equity markets for our working capital. Despite the current market volatility, prices of copper and gold overall are moving in a positive direction and we are optimistic that we can raise equity capital under these market conditions. We completed an offering of 6,723,333 units on April 7, 2011, at $0.30 per unit. Each unit consisted of one share of our common stock and one warrant for the purchase of one share of common stock exercisable at $0.50 per share for two years. We realized net cash proceeds of $1,862,462 from this offering and the payment of $130,000 in debt. We used the cash proceeds to finance our exploration programs on the Farellon and Mateo properties.
On May 18, 2012, we held our annual meeting of stockholders. At the meeting our stockholders approved the Amended and Restated Red Metal Resources Ltd. 2011 Equity Incentive Plan (the “Amended Plan”). Upon receipt of stockholder approval, the Amended Plan became effective. Under the terms of the Amended Plan, the aggregate number of the Company’s shares which may be awarded to eligible persons, including officers, directors and consultants, may not exceed 10% of the aggregate number of shares issued and outstanding from time to time and the total number of shares which may be reserved for issuance to any one individual under the Amended Plan may not exceed 5% of the outstanding shares in any 12 month period. The exercise price for the shares underlying each option shall be determined by the board of directors (or a committee, if one is appointed) on the basis of the market price, as defined in the Amended Plan.
8
The original Red Metal Resources Ltd. 2011 Equity Incentive Plan was adopted by the board of directors on September 2, 2011. Under this plan we issued options to purchase 1,040,000 shares of our common stock to directors, officers, employees and consultants who provide services to Red Metal. The options have an exercise price of $0.50 per share and a term of 2 years.
The Company is continuing its exploration activities, as more fully described below in the section titled, “Unproved Mineral Properties”.
Consistent with our historical practices, we continue to monitor our costs in Chile by reviewing our mineral claims to determine whether they possess the geological indicators to economically justify the capital to maintain or explore them. Currently, we have three employees in Chile and engage part time assistants during our exploration programs. Most of our support — such as, vehicles, office and equipment — is supplied under short-term contracts. The only long-term commitments that we have are for royalty payments on four of our mineral claims – Farellon, Che, Veta Negra and Pibe. These royalties are payable once exploitation begins. Two of the above claims – Veta Negra and Pibe – have option payments payable during the next three years under the option to purchase contracts.
The cost and timing of all planned exploration programs are subject to the availability of qualified mining personnel, such as consulting geologists and geo-technicians, and drillers and drilling equipment. Although Chile has a well-trained and qualified mining workforce from which to draw and few early-stage companies such as Red Metal are competing for the available resources, if we are unable to find the personnel and equipment that we need when we need them and at the prices that we have estimated today, we might have to revise or postpone our plans.
Results of operations
summary of financial condition
Table 1 summarizes and compares our financial condition at the three months ended April 30, 2012, to the year-ended January 31, 2012.
Table 1: Comparison of financial condition
|
April 30, 2012
|
January 31, 2012
|
|||||||
|
Working capital deficit
|
$ | (1,609,558 | ) | $ | (1,401,135 | ) | ||
|
Current assets
|
$ | 163,342 | $ | 69,623 | ||||
|
Unproved mineral properties
|
$ | 858,319 | $ | 796,828 | ||||
|
Total liabilities
|
$ | 1,772,900 | $ | 1,470,758 | ||||
|
Common stock and additional paid in capital
|
$ | 5,754,235 | $ | 5,483,934 | ||||
|
Deficit
|
$ | (6,382,670 | ) | $ | (5,985,007 | ) | ||
comparison of prior quarterly results
Table 2 and Table 3 present selected financial information for each of the past eight quarters.
Table 2: Summary of quarterly results (2012)
|
July 31,
2011
|
October 31,
2011
|
January 31,
2012
|
April 30,
2012
|
|||||||||||||
|
Revenue
|
– | – | – | $ | 7,804 | |||||||||||
|
Net loss
|
$ | (782,841 | ) | $ | (1,285,535 | ) | $ | (574,536 | ) | $ | (397,663 | ) | ||||
|
Basic and diluted loss per share
|
$ | (0.05 | ) | $ | (0.08 | ) | $ | (0.03 | ) | $ | (0.02 | ) | ||||
9
Table 3: Summary of quarterly results (2011)
|
July 31,
2010
|
October 31,
2010
|
January 31,
2011
|
April 30,
2011
|
|||||||||||||
|
Revenue
|
– | – | – | – | ||||||||||||
|
Net loss
|
$ | (118,279 | ) | $ | (154,436 | ) | $ | (203,052 | ) | $ | (285,276 | ) | ||||
|
Basic and diluted loss per share
|
$ | (0.01 | ) | $ | (0.02 | ) | $ | (0.02 | ) | $ | (0.02 | ) | ||||
During the quarters ended July 31, 2011, October 31, 2011, and January 31, 2012, we experienced substantially higher operating expenses mainly due to the drilling program on the Farellon property and exploration campaigns on other properties, including associated travel and geological consulting expenses, which we incurred between May and September 2011, and subsequent data analysis. During the quarter ended October 31, 2011, we granted 1,040,000 stock options to certain directors, employees, and consultants that resulted in a non-cash expense of $527,318, increasing our net loss. During the quarter ended January 31, 2012, we began the due diligence review to potentially list our shares on the TSX Venture Exchange that resulted in higher legal costs. During the quarter ended April 30, 2012, we prepared an updated NI 43-101 report on our Farellon property, which resulted in increased exploration expenses, and we continued with the due diligence review relating to listing our common stock on the TSX Venture Exchange, which resulted in increased professional and regulatory fees.
Selected Financial Results
three months ended April 30, 2012 and April 30, 2011
Our operating results for the three months ended April 30, 2012 and 2011, and the changes in the operating results between those periods are summarized in Table 4.
Table 4: Changes in operating results
|
Three months
ended April 30,
|
Changes between the periods ended | |||||||||||
|
2012
|
2011
|
April 30, 2012 and 2011
|
||||||||||
|
Revenue
|
||||||||||||
|
Geological services
|
$ | 7,804 | $ | - | $ | 7,804 | ||||||
|
Operating Expenses
|
||||||||||||
|
Administration
|
10,115 | 20,686 | (10,571 | ) | ||||||||
|
Advertising and promotion
|
22,974 | 40,527 | (17,553 | ) | ||||||||
|
Amortization
|
1,236 | - | 1,236 | |||||||||
|
Automobile
|
4,244 | 5,975 | (1,731 | ) | ||||||||
|
Bank charges
|
1,368 | 2,636 | (1,268 | ) | ||||||||
|
Consulting fees
|
80,712 | 66,220 | 14,492 | |||||||||
|
Interest on current debt
|
15,032 | 18,606 | (3,574 | ) | ||||||||
|
IVA expense
|
2,353 | - | 2,353 | |||||||||
|
Mineral exploration costs
|
130,820 | 35,230 | 95,590 | |||||||||
|
Office
|
8,965 | 3,337 | 5,628 | |||||||||
|
Professional fees
|
58,015 | 47,905 | 10,110 | |||||||||
|
Rent
|
3,408 | 3,456 | (48 | ) | ||||||||
|
Regulatory
|
20,632 | 7,998 | 12,634 | |||||||||
|
Travel and entertainment
|
21,654 | 13,932 | 7,722 | |||||||||
|
Salaries and wages
|
23,595 | 5,020 | 18,575 | |||||||||
|
Foreign exchange loss
|
344 | 10,839 | (10,495 | ) | ||||||||
|
Write-down of unproved mineral properties
|
- | 2,909 | (2,909 | ) | ||||||||
|
Total operating expenses
|
405,467 | 285,276 | 120,191 | |||||||||
|
Net loss
|
$ | 397,663 | $ | 285,276 | $ | 112,387 | ||||||
Revenue. Our revenue for the three months ended April 30, 2012, was $7,804; this revenue was generated from geological services that we provided to an unaffiliated company. We did not generate any revenue during the three months ended April 30, 2011. Due to the exploration rather than production nature of our business, we do not expect to have significant operating revenue within the next year.
10
Operating expenses. Our operating expenses increased by $120,191 or 42%, from $285,276 for the three months ended April 30, 2011, to $405,467 for the three months ended April 30, 2012.
The following are our most significant changes for the three months ended April 30, 2012:
|
|
•
|
During the three months ended April 30, 2012, we commissioned Micon International Limited to prepare an updated NI 43-101 report on our Farellon property; we also continued working on detailed mapping of the Farellon as well as the Mateo properties which resulted in mineral exploration expenditures of $130,820 as opposed to $35,230 during the same period of 2011.
|
|
|
•
|
Our salary and wage expense increased by $18,575, from $5,020 incurred during the three months ended April 30, 2011, to $23,595 incurred during the three months ended April 30, 2012. This increase was associated with extra staff we hired to keep up with the increased workload related to the exploration activities on our mineral properties.
|
|
|
•
|
Our travel and entertainment expenses increased from $13,932 to $21,654, or 55%, for the three month period ended April 30, 2012. This increase was mainly associated with our exploration activities and the preparation of the NI 43-101 report.
|
|
|
•
|
Due to higher accounting and financial advisory requirements we incurred $80,712 in consulting fees during the three months ended April 30, 2012, an increase of $14,492 compared to the three months ended April 30, 2011.
|
|
|
•
|
During the three months ended April 30, 2012, we continued with our due diligence review for the purpose of listing our common stock on the TSX Venture Exchange which resulted in an increase in our professional fees of $10,110 for the period, and an increase in regulatory fees of $12,634.
|
|
|
•
|
We restructured our administrative operations, which resulted in savings of $10,571 for the three month period ended April 30, 2012, compared to the period ended April 30, 2011.
|
|
|
•
|
Our advertising and promotion expense decreased from $40,527 to $22,974, or 43% due to decreased investor relations activities during the three months ended April 30, 2012, compared to the three months ended April 30, 2011.
|
Net loss. We had a net loss of $397,663 for the three months ended April 30, 2012, compared to a net loss of $285,276 for the three months ended April 30, 2011. The $112,387 increase in net loss during the period was due to the costs associated with the detailed mapping programs on our Mateo and Farellon properties as well as the preparation of an updated NI 43-101 report, which resulted in increased exploration and salary and wage expenses. These increases were offset by the revenue from geological services and a decrease in advertising and promotion activities as well as administrative fees.
Liquidity
GOING CONCERN
The consolidated financial statements included in this report have been prepared on a going concern basis, which implies that we will continue to realize our assets and discharge our liabilities in the normal course of business. We have not generated any significant revenues from mineral sales since inception, have never paid any dividends and are unlikely to pay dividends or generate significant earnings in the immediate or foreseeable future. Our continuation as a going concern depends upon the continued financial support of our shareholders, our ability to obtain necessary debt or equity financing to continue operations, and the attainment of profitable operations. Our ability to achieve and maintain profitability and positive cash flow depends upon our ability to locate profitable mineral claims, generate revenue from mineral production and control our production costs. Based upon our current plans, we expect to incur operating losses in future periods, which we plan to mitigate by controlling our operating costs and sharing mineral exploration expenses through joint venture agreements. At April 30, 2012, we had a working capital deficit of $1,609,558 and accumulated losses of $6,382,670 since inception. These factors raise substantial doubt about our ability to continue as a going concern. We cannot assure you that we will be able to generate significant revenues in the future. Our consolidated financial statements do not give effect to any adjustments that would be necessary should we be unable to continue as a going concern and therefore be required to realize our assets and discharge our liabilities in other than the normal course of business and at amounts different from those reflected in our financial statements.
11
internal and external sources of liquidity
To date we have funded our operations by selling our securities and borrowing funds, and, to a minor extent, from mining royalties and geological services.
Sources and uses of cash
Three months ended April 30, 2012 and 2011
Table 5 summarizes our sources and uses of cash for the quarters ended April 30, 2012 and 2011.
Table 5: Summary of sources and uses of cash
|
April 30,
|
||||||||
|
2012
|
2012
|
|||||||
|
Net cash provided by financing activities
|
$ | 270,748 | $ | 1,907,000 | ||||
|
Net cash used in operating activities
|
(87,816 | ) | (540,394 | ) | ||||
|
Net cash used in investing activities
|
(61,491 | ) | (52,839 | ) | ||||
|
Effect of foreign currency exchange
|
(18,821 | ) | (11,778 | ) | ||||
|
Net increase in cash
|
$ | 102,620 | $ | 1,301,989 | ||||
Net cash provided by financing activities. During the three months ended April 30, 2012, we received $150,000 on exercise of warrants for 500,000 shares at $0.30 per share. During the same period we issued 267,335 shares at $0.45 for cash proceeds of $120,301.
We borrowed $57,000 from a shareholder, and repaid $56,553 loan including accrued interest to a company owned by a significant shareholder.
During the three months ended April 30, 2011, as part of the private offering completed on April 7, 2011, we issued 6,290,000 units at $0.30 per unit, for cash proceeds of $1,828,099, net of $58,900 in commissions paid to agents, and 433,333 units at $0.30 per unit in payment of $130,000 in debt. Each unit consists of one share of our common stock and a two-year warrant exercisable for one share of our common stock at $0.50 per share.
We borrowed $11,000 from a shareholder, $70,000 US and $10,000 Cdn (approximately $10,454 US) from our CFO and recognized foreign exchange adjustment of $1,829 on $50,000 Cdn that we borrowed during the year ended January 31, 2011, from our CEO. We also repaid $14,382 in loans including accrued interest. See Non-cash financing transactions below.
Non-cash financing transactions. During the three months ended April 30, 2011, as part of the private offering completed on April 7, 2011, the Company’s CEO converted loans in the amount of $50,000 into 166,666 units and the Company’s CFO converted loans in the amount of $80,000 into 266,667 units.
We did not have any non-cash financing transactions during the three months ended April 30, 2012.
Net cash used in operating activities. During the three months ended April 30, 2012, we used net cash of $87,816 in operating activities. We used $397,663 to cover operating costs. This use of cash was offset by increases in our accounts payable and accrued liabilities of $87,166 and $15,095, respectively. This increase was associated mainly with our exploration activities and preparation of the updated NI 43-101 report. We also increased accounts payable to related parties by $192,718 and recorded $4,731 in accrued interest on notes payable to related parties. Our prepaids and other receivables decreased by $8,901 which also contributed to a decrease in cash used in operations.
During the three months ended April 30, 2011, we used net cash of $540,394 in operating activities. We used $285,276 to cover operating costs and increased prepaids and other receivables by $65,582 for professional fees associated with the preparation and filing of a form S-1 registration statement. We decreased accounts payable by $75,588, and accounts payable to related parties by $139,125. These uses of cash were offset by a net increase in our accrued liabilities of $19,993, mainly associated with Chilean mineral property taxes and accrued interest on our notes payable to related parties of $2,275.
12
Net cash used in investing activities. During the three months ended April 30, 2012, we spent $61,491 acquiring mineral claims and paying property taxes associated with our mineral claims.
During the three months ended April 30, 2011, we spent $52,839 acquiring mineral claims and paying property taxes associated with our mineral claims.
Since inception through April 30, 2012, we have invested $1,238,529 in acquiring our mineral claims and $19,820 for acquisition of other capital assets.
Unproved mineral properties
We have four active properties which we have assembled since the beginning of 2007— the Farellon, Perth, Mateo, and Veta Negra. These properties consist of both mining and exploration claims and are grouped into two district areas – Carrizal Alto area properties and Vallenar area properties.
Active properties
|
Table 6: Active properties
|
|||||||||
|
Property
|
Percentage, type of claim
|
Hectares
|
|||||||
|
Gross area
|
Net areaa
|
||||||||
|
Carrizal Alto area
|
|||||||||
|
Farellon
|
|||||||||
|
Farellon 1 – 8 claim
|
100%, mensura
|
66 | |||||||
|
Farellon 3 claim
|
100%, pedimento
|
300 | |||||||
|
Cecil 1 – 49 claim
|
100%, mensura
|
230 | |||||||
|
Cecil 1 – 40 and Burghley 1 – 60 claims
|
100%, mensura in process
|
500 | |||||||
| 1,096 | 1,096 | ||||||||
|
Perth
|
|||||||||
|
Perth 1 al 36 claim
|
100%, mensura
|
109 | |||||||
|
Lancelot I 1 al 30 claim
|
100%, mensura in process
|
300 | |||||||
|
Lancelot II 1 al 20 claim
|
100%, mensura in process
|
200 | |||||||
|
Rey Arturo 1 al 30 claim
|
100%, mensura in process
|
300 | |||||||
|
Merlin I 1 al 10 claim
|
100%, mensura in process
|
60 | |||||||
|
Merlin I 1 al 24 claim
|
100%, mensura in process
|
240 | |||||||
|
Galahad I 1 al 10 claim
|
100%, mensura in process
|
50 | |||||||
|
Galahad IA 1 al 46 claim
|
100%, mensura in process
|
230 | |||||||
|
Percival III 1 al 30 claim
|
100%, mensura in process
|
300 | |||||||
|
Tristan II 1 al 30 claim
|
100%, mensura in process
|
300 | |||||||
|
Tristan IIA 1 al 5 claim
|
100%, mensura in process
|
15 | |||||||
|
Camelot claim
|
100%, manifestacion
|
300 | |||||||
| 2,404 | |||||||||
|
Overlapped claims
|
(121) | 2,283 | |||||||
|
Vallenar area
|
|||||||||
|
Mateo
|
|||||||||
|
Margarita claim
|
100%, mensura
|
56 | |||||||
|
Che 1 & 2 claims
|
100%, mensura
|
76 | |||||||
|
Irene & Irene II claims
|
100% ,mensura
|
60 | |||||||
|
Mateo 1, 2, 3, 9,10,12, 13, 14 claims
|
100%, mensura in process
|
2,100 | |||||||
|
Mateo 4 and 5 claims
|
100%, pedimento
|
600 | |||||||
| 2,892 | |||||||||
|
Overlapped claims
|
(469) | 2,423 | |||||||
|
Veta Negra
|
|||||||||
|
Veta Negra 1 al 7 claim
|
Option to purchase, mensura in process
|
28 | |||||||
|
Trixy (16 claims)
|
100%, mensura in process
|
1,508 | |||||||
|
Pibe
|
Option to purchase, mensura in process
|
200 | |||||||
| 1,736 | |||||||||
|
Overlapped claims
|
(222) | 1,514 | |||||||
| 7,316 | |||||||||
|
a Some pedimentos and manifestacions overlap other claims. The net area is the total of the hectares we have in each property (i.e. net of our overlapped claims).
|
|||||||||
13
Our active properties as of the date of this filing are set out in Table 6. These properties are accessible by road from Vallenar as illustrated in Figure 1.
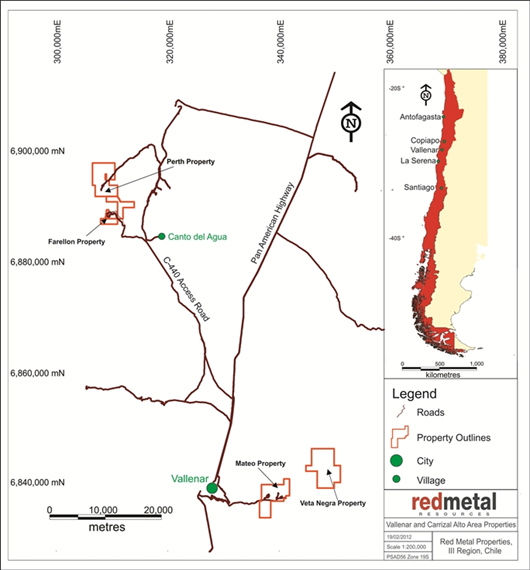
Figure 1: Location and access to active properties.
14
Farellon Property
Drilling. During June through September 2011 we conducted a combined RC/diamond drill program on the Farellon property. The program was designed to continue to expand on the results of the 2009 drill program, as well as to continue confirming historical results along the strike. During this program we completed 11 drillholes for a total of 2,233m. Significant results of assays are presented in the
Table 7 below.
Table 7: Farellon drilling results (2011)
|
Drill Hole ID
|
Assay interval (m)
|
Assay grade
|
|||
|
From
|
To
|
Length
|
Copper %
|
Gold g/t
|
|
|
FAR-11-001
|
36
|
49
|
13
|
2.51
|
0.35
|
|
FAR-11-001
|
78
|
85
|
7
|
0.43
|
0.04
|
|
FAR-11-002
|
No Significant Intersections . Zone faulted off
|
||||
|
FAR-11-003
|
150
|
155
|
5
|
0.40
|
0.28
|
|
FAR-11-003
|
177
|
182
|
5
|
0.44
|
0.15
|
|
FAR-11-004
|
141
|
145
|
4
|
0.73
|
0.01
|
|
FAR-11-005
|
124
|
133
|
9
|
0.84
|
0.26
|
|
FAR-11-006
|
80
|
112
|
32
|
1.35
|
0.99
|
|
FAR-11-007
|
56
|
74
|
18
|
0.50
|
0.40
|
|
FAR-11-008
|
98
|
102
|
4
|
0.85
|
0.26
|
|
FAR-11-009
|
202
|
211.55
|
9.55
|
0.95
|
0.42
|
|
FAR-11-010
|
179.13
|
183
|
3.87
|
0.50
|
0.39
|
|
FAR-11-011
|
54
|
56
|
2
|
0.97
|
0.48
|
Figure 2 below illustrates the Farellon geology and the 2006, 2009 and 2011 drillhole collar locations as well as surface traces of mineralized vein systems:
15
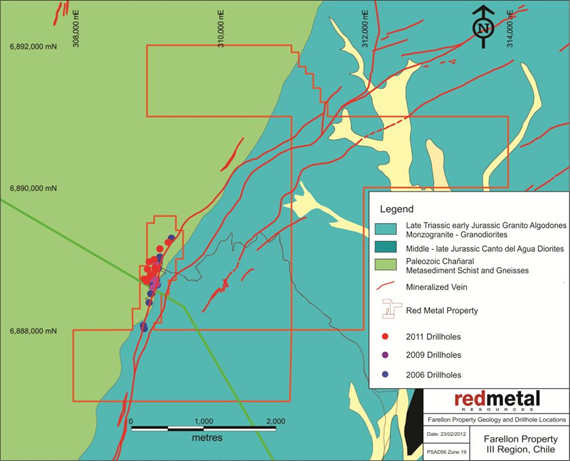
Figure 2: Farellon property geology
QA/QC, sampling procedures and analytical methods. Samples were taken at intervals between 0.5 and 2 metres. Sampling started at the collar of the hole and proceeded to the toe or bottom of the drill hole. Samples were taken at two metre intervals outside the previously identified main zone of interest. Through the main zone of interest samples were taken at one metre intervals. Generally, the sample recovery was good to excellent for the 2011 drilling program.
Table 7 above summarizes significant assay results. They are reported as drill lengths as we have not established the width of the mineralized zone.
Our quality assurance, quality control (QA/QC) protocol consists of the addition of standards, blanks and laboratory duplicates to the sample stream. We inserted these into the sample series using the same number sequence as the samples themselves. One of the QA/QC check samples is inserted every 25 samples and it alternates between standards, blanks and laboratory duplicates.
We commissioned Micon International Limited to prepare an updated technical report that complies with Canadian National Instrument 43-101 summarizing the information obtained from the above drilling program. Micon concluded that our drilling program was successful in confirming and extending the mineralization both in the down dip direction and along strike.
Samples reviewed by Micon proved to be representative of the results encountered in the drilling program; our sampling procedures undertaken at the Farellon Property conformed to CIM Exploration Best Practices Guidelines to minimize any sampling bias.
Micon has reviewed the two-phased exploration program that we have proposed. The first phase of this program would consist of a 5,000m primarily infill drilling to flesh out the structural issues that have been noted in the previous two campaigns, as well as to test the primary mineralization at depth. We have estimated the budget for the first phase of the program to be approximately $922,000.
16
If the first phase continues to return positive results, a second phase consisting of a 15,000m drilling program would be conducted in order to test the extent of the mineralization down to a 400m depth and estimate an initial mineral resource. The budget for the second phase of the program is approximately $5.2 million.
Micon recommended that Red Metal conduct the exploration program as proposed, subject to funding and any other matters which may cause the proposed exploration program to be altered in the normal course of its business activities, or as a result of exploration activities themselves, and made the following additional recommendations:
|
|
·
|
To add a screened metallic assay protocol to our current QA/QC procedures as a secondary check if any high grade assays of gold and copper are encountered during future exploration programs or if there is a significant difference between the primary and secondary assays for both field duplicate and check samples.
|
|
|
·
|
Designate a secondary assay laboratory to re-assay a portion of between 5% and 10% of the samples assayed by our current laboratory. This additional assaying procedure would act as a check on the results produced by the current laboratory.
|
|
|
·
|
Survey the old surface workings and, where safe to do so, the underground workings. Additionally, sample these workings where it is deemed safe. This will add a further dimension to the database and will be very useful if a resource estimate is conducted on the Farellón Project.
|
|
|
·
|
Build a covered facility in which to store its samples in Vallenar in order to preserve them from the effects of weather.
|
2012 mapping program: In April of 2012 we started a detailed mapping, prospecting and rock sampling program over the Farellon Property. This program is designed to extend the known mineralized zone to the north and the south and to identify where the best potential is to expand on the known mineralized zone.
Perth Property
Termination of Perth property joint venture earn-in agreement
On March 14, 2011, we entered into an agreement on the Perth property with Revonergy Inc. Revonergy Inc. paid $35,000 on signing the agreement, which allowed Revonergy to earn a 35% interest in the Perth property if it spent a minimum of $1,450,000 on a three phase exploration program, as follows:
|
|
·
|
Successful completion of a Phase I exploration program costing at least $115,000 one year from signing
|
|
|
·
|
Successful completion of a Phase II exploration program costing at least $300,000 two years from signing
|
|
|
·
|
Successful completion of a Phase III exploration program costing at least $1,000,000 and that can justify completing a preliminary feasibility study three years from signing
|
Revonergy failed to complete Phase I of the exploration program within the term specified, therefore the agreement has terminated.
Mateo Property
During August through October 2011 we carried out an in-depth geological mapping and sampling program on the Mateo property. The Mateo property has very diverse mineralization styles through the property which includes mantos, veins, breccias and porphyries with significant gold and copper. A total of 138 reconnaissance samples were collected over the property. The highest assay values returned from reconnaissance samples were 21g/t Au and 10.3% Cu but more common values were between 1-3g/t Au and 1-3% Cu. Table 8 summarizes the significant assay results.
17
Table 8: significant intersections
|
Sample
|
Cu%
|
Au g/t
|
|
201272
|
7.37
|
1.12
|
|
202871
|
2.63
|
1.14
|
|
202852
|
7.11
|
1.18
|
|
202849
|
10.3
|
1.73
|
|
201220
|
4.29
|
2.07
|
|
201277
|
9.39
|
2.42
|
|
202850
|
2.58
|
2.46
|
|
202810
|
2.44
|
2.49
|
|
202882
|
2.57
|
3.08
|
|
202812
|
0.50
|
3.10
|
|
202815
|
0.62
|
3.57
|
|
202880
|
1.46
|
5.70
|
|
202826
|
5.30
|
6.85
|
|
201217
|
3.46
|
10.11
|
|
202813
|
0.69
|
21.72
|
The detailed mapping identified nine significant mineralized zones where further work is recommended.
Figure 3 below illustrates the local Mateo geology including a thematic map of 2011 reconnaissance sample locations and corresponding percent copper assay ranges.
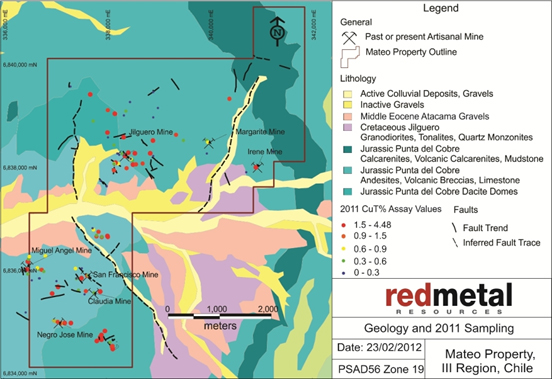
Figure 3: Mateo property geology
2011 Ground Magnetic Survey
During September 2011 we engaged Quantec International Project Services Ltd. to complete a ground magnetic survey on the Mateo Property. The ground magnetic survey consisted of 70 survey lines with an E-W orientation, and two control lines with a N-S orientation. The survey lines were separated by 100m, and data was collected at 10m intervals on all lines. A total of 218.49km of magnetic data was collected. The survey outlined areas of high and low magnetic response. Areas of high magnetic response indicated the presence of elevated levels of magnetic minerals such as magnetite, pyrotite and hematite whereas areas of low magnetic response may be caused by alteration processes such as magnetite destruction or may simply indicate rock types that never had magnetic minerals.
18
This ground magnetic survey demarcated the northern and western extent with a large, high magnetic anomaly with a southwest to northeast orientation. This magnetic high may correlate with the Jilguero Intermediate Intrusive formation which is only partially exposed on the property and underlies the Jurassic Punta Del Cobre volcanics and mixed sedimentary sequence.
Two possible correlations with geology are drawn when looking at the magnetic geophysical response. Firstly, all artisanal mines, reconnaissance samples and documented surface mineralization are exposed on the Western edge of the magnetic high in an area where magnetic high-low gradients are greatest transitioning from high to low. Secondly, magnetic highs appear to persist away from the main magnetic high body in a NW direction. Although these persisting magnetic highs are only small stringers in appearance they possibly correlate to dominant NW trending faults on the property that are often mineralized. Visual correlations between magnetic high/low contrasts and geology seem strong enough to suggest further exploration including sampling and drilling along the steepest gradient of magnetic high/low dropoff.
Veta Negra Property
During June and July 2011 we carried out a preliminary exploration program on the Veta Negra property. As a result of the program we discovered a defined and continuous copper mineralized manto continuing on from the main manto previously known to exist. At the conclusion of this program three mantos were traced on surface, one manto, the East Manto, was traced for 1.9km on surface before becoming buried by surface rock, a second manto, the West Manto, was traced for a one kilometer strike length and a third manto, the Far West Manto, was traced for a 500 metre strike length.
After reviewing the exploration results and considering the acquisition costs as well as future geological potential, we decided to terminate our option to purchase the Exon claim, drop three Trixy claims, as well as decrease the size of some of the remaining Trixy claims when advancing them to mining (mensura) stage. We believe that this enables us to maintain the geological potential of the Veta Negra project and at the same time control the associated costs.
Capital resources
Our ability to acquire and explore our Chilean claims is subject to our ability to obtain the necessary funding. We expect to raise funds through loans from private or affiliated persons and sales of our debt or equity securities. We have no committed sources of capital. If we are unable to raise funds as and when we need them, we may be required to curtail, or even to cease, our operations.
Contingencies and commitments
During the three months ended April 30, 2012, the Company received a penalty notice from the IRS for failure to file certain tax form within prescribed deadline. The Company believes that it filed the questioned form on time and submitted supporting documentation to the IRS appeal department. The penalty was assessed for $10,000 plus accrued interest of $146.
Contractual Obligations and Commitments
Our commitments under the Farellon, Che, Veta Negra and Pibe contracts are the only contractual obligations that we have. Table 9 summarizes, as of April 30, 2012, contractual obligations and commitments for the next five fiscal years.
Table 9: Contractual Obligations
|
Payments due by period
|
||||||||||||||||||||
|
Less than 1 year
|
1 – 3 years
|
3 – 5 years
|
More than 5 years *
|
Total
|
||||||||||||||||
|
Option payments
|
$ | 167,500 | $ | 350,000 | $ | - | $ | - | $ | 517,500 | ||||||||||
|
Royalty payments
|
- | 1,950,000 | 1,950,000 | |||||||||||||||||
|
Total
|
$ | 167,500 | $ | 350,000 | $ | - | $ | 1,950,000 | $ | 2,467,500 | ||||||||||
*The royalty payments are due once exploitation begins. As of the date of this report we have not commenced exploitation of any of our claims.
19
|
|
•
|
Farellon royalty. We are committed to paying the vendor a royalty equal to 1.5% on the net sales of minerals extracted from the Farellon claims up to a total of $600,000. The royalty payments are due monthly once exploitation begins and are subject to minimum payments of $1,000 per month. We have no obligation to pay the royalty if we do not commence exploitation.
|
|
|
•
|
Che royalty. We are committed to paying a royalty equal to 1% of the net sales of minerals extracted from the claims to a maximum of $100,000 to the former owner. The royalty payments are due monthly once exploitation begins, and are not subject to minimum payments.
|
|
|
•
|
Veta Negra option. On June 30, 2011, Minera Farellon agreed to sell us its option to purchase the Veta Negra and Exon claims for a total cash payment of $107,500 ($17,500 payable to Minera Farellon to exercise the option, and $90,000 payable to the vendors). On May 15, 2012, we decided to drop the option to purchase the Exon claim and furnished the owner of the claim with the cancellation notice. As of the date of this report, we must pay $57,500 payable in two installments over eight months to exercise the Veta Negra option. If we complete acquisition of the property we are committed to paying the vendor a royalty equal to 1.5% of the net sales of minerals extracted from the claim to a total maximum of $250,000. The royalty can also be bought for $250,000 at any time. The royalty payments are due monthly once exploitation begins, and are not subject to minimum payments.
|
|
|
•
|
Pibe option. On November 25, 2011, we entered into an option agreement to purchase the Pibe 1 - 20 mining claims for the total cash payment of $500,000. Under the option agreement we paid $40,000 on December 12, 2011, and must pay $460,000 in six installments over 36 months to exercise the option. If we complete acquisition of the property we are committed to paying the vendor a royalty equal to 1.5% of the net sales of minerals extracted from the claims to a total maximum of $1,000,000. The payments are due once exploitation begins.
|
Equity financing
To generate working capital, between January 31, 2010 and June 14, 2012, we issued 8,280,668 shares of our common stock and warrants for the purchase of 7,727,001 shares to raise $2,438,401 under Regulations S and D promulgated under the Securities Act of 1933.
Based on our operating plan, we anticipate incurring operating losses in the foreseeable future and will require additional equity capital to support our operations and develop our business plan. If we succeed in completing future equity financing, the issuance of additional shares will result in dilution to our existing shareholders.
Debt financing
On February 22, 2010, we borrowed US $50,000 and issued a demand promissory note payable to the lender for the principal sum together with interest at 6% per annum. On March 13, 2012, we repaid this note payable along with the interest accrued on it. See Related-party transactions below.
On March 2, 2011, we borrowed US $11,000 and issued a demand promissory note payable to the lender for the principal sum together with interest at 8% per annum. See Related-party transactions below.
On August 25, 2011, we borrowed US $30,000 and issued a demand promissory note payable to the lender for the principal sum together with interest at 8% per annum. See Related-party transactions below.
20
On September 19, 2011, we borrowed Cdn $62,389 (equivalent to US $63,121) and issued a demand promissory note payable to the lender for the principal sum together with interest at 8% per annum. See Related-party transactions below.
On October 25, 2011, we borrowed US $10,000 and issued a demand promissory note payable to the lender for the principal sum together with interest at 8% per annum. See Related-party transactions below.
On December 9, 2011, we borrowed Cdn $25,000 (equivalent to US $25,293) and issued a demand promissory note payable to the lender for the principal sum together with interest at 8% per annum. See Related-party transactions below.
On January 12, 2012, we borrowed Cdn $30,000 (equivalent to US $30,352) and issued a demand promissory note payable to the lender for the principal sum together with interest at 8% per annum. See Related-party transactions below.
On January 30, 2012, we borrowed US $8,500 and issued a demand promissory note payable to the lender for the principal sum together with interest at 8% per annum. See Related-party transactions below.
On March 7, 2012, we borrowed US $57,000 and issued a demand promissory note payable to the lender for the principal sum together with interest at 8% per annum. See Related-party transactions below.
Challenges and risks
We do not anticipate generating any revenue over the next twelve months. We plan to fund our operations through any combination of equity or debt financing from the sale of our securities, private loans, joint ventures or through the sale of part interest in our mineral properties. Although we have succeeded in raising funds as we have needed them, we cannot assure you that this will continue in the future. Many things, such as the continued general downturn, worldwide, of the economy or a significant decrease in the price of minerals, could affect the willingness of potential investors to invest in risky ventures such as ours. We may consider entering into a joint venture partnership with a more senior resource company to complete a mineral exploration program on other properties in Chile. If we enter into a joint venture arrangement, we would likely have to assign a percentage of our interest in our mineral claims to our joint venture partner in exchange for the funding.
Investments in and expenditures on mineral interests
Realization of our investments in mineral properties depends upon our maintaining legal ownership, producing from the properties or gainfully disposing of them.
Title to mineral claims involves risks inherent in the difficulties of determining the validity of claims as well as the potential for problems arising from the ambiguous conveyancing history characteristic of many mineral claims. Our contracts and deeds have been notarized, recorded in the registry of mines and published in the mining bulletin. We review the mining bulletin regularly to discover whether other parties have staked claims over our ground. We have discovered no such claims. To the best of our knowledge, we have taken the steps necessary to ensure that we have good title to our mineral claims.
Foreign exchange
We are subject to foreign exchange risk for transactions denominated in foreign currencies. Foreign currency risk arises from the fluctuation of foreign exchange rates and the degree of volatility of these rates relative to the United States dollar. We do not believe that we have any material risk due to foreign currency exchange.
Trends, events or uncertainties that may impact results of operations or liquidity
The economic crisis in the United States and the resulting economic uncertainty and market instability may make it harder for us to raise capital as and when we need it and have made it difficult for us to assess the impact of the crisis on our operations or liquidity and to determine if the prices we will receive on the sale of minerals will exceed the cost of mineral exploitation. If we are unable to raise cash, we may be required to cease our operations. Other than as discussed in this report, we know of no other trends, events or uncertainties that have or are reasonably likely to have a material impact on our short-term or long-term liquidity.
21
Off-balance sheet arrangements
We have no off-balance sheet arrangements and no non-consolidated, special-purpose entities.
Related-party transactions
Table 10 describes the amounts due to related parties that were incurred during the fiscal year ended January 31, 2012, and the period ended April 30, 2012.
|
Table 10: Due to related parties
|
||||||||
|
April 30, 2012
|
January 31, 2012
|
|||||||
|
Due to Da Costa Management Corp.
|
$ | 225,178 | $ | 190,608 | ||||
|
Due to Fladgate Exploration Consulting Corporation
|
811,793 | 658,950 | ||||||
|
Due to Minera Farellon Limitada
|
55,143 | 51,957 | ||||||
|
Due to Kevin Mitchell
|
6,166 | 4,047 | ||||||
|
Total due to related parties
|
$ | 1,098,280 | $ | 905,562 | ||||
During the three months ended April 30, 2012 and 2011, we incurred the following expenses with related parties:
|
|
•
|
$78,127 and $66,492, respectively, in consulting and other business expenses for services provided by Da Costa Management Corp., a company owned by our CFO and treasurer
|
|
|
•
|
$117,532 and $79,208, respectively, in administration, advertising and promotion, mineral exploration, travel and other business expenses for services provided by or paid on our behalf by Fladgate Exploration Consulting Corporation, a company controlled by our directors
|
|
|
•
|
$7,371 and $16,525, respectively, in administration, automobile, rental, and other business expenses for services provided by Minera Farellon Limitada, a company owned by Richard Jeffs, the father of our president
|
|
|
•
|
$13,141 and $7,018, respectively, in administration expenses, salary and other reimbursable expenses with Kevin Mitchell, an officer of our Chilean subsidiary
|
Notes payable to related parties
Table 11 describes the promissory notes payable to related parties including accrued interest as at April 30, 2012, and January 31, 2012.
Table 11: Notes payable to related parties
|
April 30,
2012
|
January 31,
2012
|
|||||||
|
Note payable to the company owned by Richard Jeffs a
|
$ | – | $ | 56,164 | ||||
|
Notes payable to Richard Jeffs b
|
111,846 | 53,115 | ||||||
|
Notes payable to Caitlin Jeffs c
|
57,179 | 55,129 | ||||||
|
Notes payable to Fladgate Exploration Consulting Corporation c
|
66,287 | 63,910 | ||||||
|
Notes payable to John da Costa d
|
8,671 | 8,502 | ||||||
|
Total notes payable to related parties
|
$ | 243,983 | $ | 236,820 | ||||
|
a The principle amount of the note payable was $50,000. It was payable on demand, unsecured and bore interest at 6% per annum compounded monthly. Interest of $6,553 had accrued as at March 13, 2012, when it was repaid in full.
b The principle amount of the notes payable is $108,000. They are payable on demand, unsecured and bear interest at 8% per annum compounded monthly. Interest of $3,846 had accrued as at April 30, 2012.
cThe principle amounts of the notes payable to Caitlin Jeffs are $55,000 Cdn, they are payable on demand, unsecured and bear interest at 8% per annum compounded monthly. Interest of $1,534 had accrued as at April 30, 2012. The principle amount of the note payable to Fladgate Exploration Consulting Corporation is $62,389 Cdn; it is payable on demand, unsecured and bears interest at 8% per annum compounded monthly. Interest of $3,166 Cdn had accrued as at April 30, 2012.
d The principle amount of the note payable to John da Costa is $8,500 US, it is payable on demand, unsecured and bears interest at 8% per annum compounded monthly. Interest of $171 had accrued as at April 30, 2012.
|
||||||||
22
Critical Accounting Estimates
The preparation of financial statements in conformity with U.S. Generally Accepted Accounting Principles requires management to make estimates and assumptions that affect certain of the reported amounts of assets and liabilities, disclosure of contingent assets and liabilities at the date of the financial statements and the reported amounts of revenues and expenses during the year. The Company regularly evaluates estimates and assumptions. The Company bases its estimates and assumptions on current facts, historical experience and various other factors it believes to be reasonable under the circumstances, the results of which form the basis for making judgments about the carrying values of assets and liabilities and the accrual of costs and expenses that are not readily apparent from other sources. The actual results experienced by the Company may differ materially and adversely from the Company’s estimates. To the extent there are material differences between the estimates and the actual results, future results of operations will be affected. The most significant estimates with regard to these financial statements relate to carrying values of unproven mineral properties, determination of fair values of stock-based transactions, and deferred income tax rates.
Reclassifications
Certain prior-period amounts in the accompanying consolidated financial statements have been reclassified to conform to the current period’s presentation. These reclassifications had no effect on the consolidated results of operations or financial position for any period presented.
Financial instruments
Our financial instruments include cash, accounts receivable, accounts payable, accrued liabilities, accrued professional fees and accrued mineral property costs. The fair value of these financial instruments approximates their carrying values due to their short maturities.
Recently Adopted Accounting Guidance
The Company has reviewed recently issued accounting pronouncements and plans to adopt those that are applicable to it. We do not expect the adoption of these pronouncements to have a material impact on our financial position, results of operations or cash flows.
23
As a smaller reporting company, we are not required to provide this disclosure.
Item 4. Controls and Procedures.
(a) Disclosure Controls and Procedures
Caitlin Jeffs, our chief executive officer and president, and John da Costa, our chief financial officer, have evaluated the effectiveness of our disclosure controls and procedures (as the term is defined in Rules 13a-15 and 15d-15 under the Securities Exchange Act of 1934) as of the end of the period covered by this report (the “evaluation date”). Based on their evaluation, they have concluded that, as of the evaluation date, our disclosure controls and procedures are effective to ensure that information required to be disclosed by us in the reports that we file or submit under the Exchange Act is recorded, processed, summarized and reported within the time periods specified in the Securities and Exchange Commission’s rules and forms.
(b) Changes in internal control over financial reporting
During the period covered by this report, there were no changes to our internal control over financial reporting that have materially affected, or are reasonably likely to materially affect, our internal control over financial reporting.
PART II—OTHER INFORMATION
Item 1. Legal Proceedings.
We are not a party to any pending legal proceedings and, to the best of our knowledge, none of our properties or assets is the subject of any pending legal proceedings.
Item 1A. Risk Factors.
As a smaller reporting company we are not required to provide this information.
Item 2. Unregistered Sales of Equity Securities and Use of Proceeds.
On February 7, 2012, Allen Wilson exercised a warrant to purchase 200,000 shares of common stock. The exercise price was $0.30 per share. We issued the certificate for the shares on February 17, 2012. We relied on Section 4(2) of the Securities Act of 1933 to issue the common stock inasmuch as there was no form of general solicitation or general advertising in the offer and sale of the securities and the purchaser is an accredited investor.
On March 5, 2012, T.A.B. Mills exercised a warrant to purchase 400,000 shares of common stock. The exercise price was $0.30 per share. We issued the certificate for the shares on March 14, 2012. We relied on Section 4(2) of the Securities Act of 1933 to issue the common stock inasmuch as there was no form of general solicitation or general advertising in the offer and sale of the securities and the purchaser is an accredited investor.
On April 12, 2012, we entered into Securities Purchase Agreements with Amir Vahabzadeh and Jonathan Davidson to complete a private offering of units. The price per unit was $0.45 and we sold a total of 267,335 units, raising a total of $120,301. The units consist of common stock and a warrant for the purchase of an equal number of shares of common stock. The term of the warrants is two years and the exercise price is $0.65 per share. We relied on Regulation S in issuing the securities.
24
Item 3. Defaults upon Senior Securities.
None.
Item 4. Mine Safety Disclosures
Not applicable.
Item 5. Other Information.
None
Item 6. Exhibits.
The following table sets out the exhibits either filed herewith or incorporated by reference.
|
Exhibit
|
Description
|
|
3.1.1
|
Articles of Incorporation1
|
|
3.1.2
|
Certificate of Amendment to Articles of Incorporation2
|
|
3.2
|
By-laws1
|
|
Form of Securities Purchase Agreement dated April 12, 20123
|
|
|
Form of Common Stock Purchase Warrant dated April 12, 20123
|
|
|
31.1
|
Certification pursuant to Rule 13a-14(a) and 15d-14(a)4
|
|
31.2
|
Certification pursuant to Rule 13a-14(a) and 15d-14(a)4
|
|
32
|
Certification pursuant to Section 1350 of Title 18 of the United States Code4
|
|
101
|
The following financial statements from the registrant’s Quarterly Report on Form 10-Q for the fiscal quarter ended April 30, 2012, formatted in XBRL: (i) Consolidated Balance Sheets; (ii) Consolidated Statements of Operations; (iii) Consolidated Statement of Stockholders’ Equity (iv) Consolidated Statements of Cash Flows; (v) Notes to the Consolidated Financial Statements.
|
|
1 Incorporated by reference from the registrant’s registration statement on Form SB-2 filed with the Securities and Exchange Commission on May 22, 2006 as file number 333-134-363.
2Incorporated by reference from the registrant’s Quarterly report on Form 10-Q for the period ended October 31, 2010 and filed with the Securities and Exchange Commission on December 13, 2010.
3Incorporated by reference from the registrant's Current Report on Form 8-K filed with the Securities and Exchange Commission on April 17, 2012.
4Filed herewith
|
|
25
SIGNATURES
Pursuant to the requirements of the Securities Exchange Act of 1934, the registrant has duly caused this report to be signed on its behalf by the undersigned thereunto duly authorized.
June 14, 2012
|
RED METAL RESOURCES LTD.
|
||||
|
By:
|
/s/Caitlin Jeffs
|
|||
|
Caitlin Jeffs, Chief Executive Officer and President
|
||||
| By: | /s/ John da Costa | |||
| John da Costa, Chief Financial Officer | ||||
26