Attached files
| file | filename |
|---|---|
| EX-14 - CODE OF ETHICS FOR CHIEF EXECUTIVE OFFICER AND SENIOR FINANCIAL OFFICERS - NICHOLAS FINANCIAL INC | d364801dex14.htm |
| EX-32.2 - SECTION 906 CFO CERTIFICATION - NICHOLAS FINANCIAL INC | d364801dex322.htm |
| EX-31.1 - SECTION 302 CEO CERTIFICATION - NICHOLAS FINANCIAL INC | d364801dex311.htm |
| EX-32.1 - SECTION 906 CEO CERTIFICATION - NICHOLAS FINANCIAL INC | d364801dex321.htm |
| EX-31.2 - SECTION 302 CFO CERTIFICATION - NICHOLAS FINANCIAL INC | d364801dex312.htm |
| EX-10.7 - INCENTIVE BONUS PLAN SUMMARY - NICHOLAS FINANCIAL INC | d364801dex107.htm |
| EX-10.8 - DEALER RETAIL AGREEMENT - NICHOLAS FINANCIAL INC | d364801dex108.htm |
| EX-10.2 - AMENDMENT TO LOAN AGREEMENT - NICHOLAS FINANCIAL INC | d364801dex102.htm |
| EXCEL - IDEA: XBRL DOCUMENT - NICHOLAS FINANCIAL INC | Financial_Report.xls |
| EX-23 - CONSENT OF DIXON HUGHES GOODMAN LLP - NICHOLAS FINANCIAL INC | d364801dex23.htm |
Table of Contents
UNITED STATES
SECURITIES AND EXCHANGE COMMISSION
Washington, DC 20549
FORM 10-K
| x | ANNUAL REPORT PURSUANT TO SECTION 13 OR 15(d) OF THE SECURITIES ACT OF 1934 |
For the fiscal year ended March 31, 2012
| ¨ | TRANSITION REPORT PURSUANT TO SECTION 13 OR 15(d) OF THE SECURITIES EXCHANGE ACT OF 1934 |
For the transition period from to .
Commission file number: 0-26680
NICHOLAS FINANCIAL, INC.
(Exact Name of Registrant as Specified in its Charter)
| British Columbia, Canada | 8736-3354 | |
| (State or Other Jurisdiction of Incorporation or Organization) |
(I.R.S. Employer Identification No.) |
2454 McMullen Booth Road, Building C
Clearwater, Florida 33759
(Address of Principal Executive Offices, Including Zip Code)
(727) 726-0763
(Registrant’s Telephone Number, Including Area Code)
Securities registered under Section 12(b) of the Exchange Act: Common Stock, no par value
Securities registered under Section 12(g) of the Exchange Act: None
Indicate by check mark if the Registrant is a well-known seasoned issuer, as defined in Rule 405 of the Securities Act. Yes ¨ No x
Indicate by check mark if the Registrant is not required to file reports pursuant to Section 13 or Section 15(d) of the Exchange Act. ¨
Indicate by check mark whether the Registrant (1) has filed all reports required to be filed by Section 13 or 15(d) of the Exchange Act during the preceding 12 months (or for such shorter period that the registrant was required to file such reports), and (2) has been subject to such filing requirements for the past 90 days. Yes x No ¨
Indicate by check mark whether the Registrant has submitted electronically and posted on its corporate Web site, if any, every Interactive Data File required to be submitted and posted pursuant to Rule 405 of Regulation S-T during the preceding 12 months (or for such shorter period that the Registrant was required to submit and post such files). Yes x No ¨
Indicate by check mark if disclosure of delinquent filers pursuant to Item 405 of Regulation S-K is not contained herein, and will not be contained, to the best of the Registrant’s knowledge, in definitive proxy or information statements incorporated by reference in Part III of this Form 10-K or any amendment to this Form 10-K. x
Indicate by check mark whether the Registrant is a large accelerated filer, an accelerated filer, a non-accelerated filer, or a smaller reporting company. See the definitions of “large accelerated filer”, “accelerated filer” and “smaller reporting company” in Rule 12b-2 of the Exchange Act.
| Large accelerated filer | ¨ | Accelerated filer | x | |||
| Non-accelerated filer | ¨ | Smaller reporting company | ¨ | |||
Indicate by check mark whether the Registrant is a shell company (as defined in Rule 12b-2 of the Exchange Act). Yes ¨ No x
As of June 1, 2012, 12,005,280 shares of the Registrant’s Common Stock, no par value, were outstanding.
At September 30, 2011, the aggregate market value of the Registrant’s Common Stock held by non-affiliates of the Registrant was approximately $86,094,000.
DOCUMENTS INCORPORATED BY REFERENCE:
Portions of the Registrant’s definitive Proxy Statement and Information Circular for the 2012 Annual General Meeting of Shareholders currently scheduled to be held on August 7, 2012, expected to be filed with the Commission pursuant to Regulation 14A on or about July 6, 2012, are incorporated by reference in Part III, Items 10 through 14, of this Annual Report on Form 10-K.
Table of Contents
FORM 10-K ANNUAL REPORT
TABLE OF CONTENTS
| Page No. | ||||
| Item 1. |
2 | |||
| Item 1A. |
9 | |||
| Item 1B. |
14 | |||
| Item 2. |
14 | |||
| Item 3. |
15 | |||
| Item 4. |
15 | |||
| Item 5. |
16 | |||
| Item 6. |
18 | |||
| Item 7. |
Management’s Discussion and Analysis of Financial Condition and Results of Operations |
20 | ||
| Item 7A. |
28 | |||
| Item 8. |
28 | |||
| Item 9. |
Changes In and Disagreements With Accountants on Accounting and Financial Disclosure |
48 | ||
| Item 9A. |
48 | |||
| Item 9B. |
50 | |||
| Item 10. |
50 | |||
| Item 11. |
50 | |||
| Item 12. |
Security Ownership of Certain Beneficial Owners and Management and Related Stockholder Matters |
50 | ||
| Item 13. |
Certain Relationships and Related Transactions, and Director Independence |
50 | ||
| Item 14. |
50 | |||
| Item 15. |
51 | |||
Forward-Looking Information
This Annual Report on Form 10-K (“Report”) contains various forward-looking statements within the meaning of Section 27A of the Securities Act of 1933 and Section 21E of the Securities Exchange Act of 1934. Such statements are based on management’s beliefs and assumptions, as well as information currently available to management. When used in this document, the words “anticipate,” “estimate,” “expect,” and similar expressions are intended to identify forward-looking statements. Although Nicholas Financial, Inc., including its subsidiaries (collectively the “Company”), believes that the expectations reflected in such forward-looking statements are reasonable, it can give no assurance that such expectations will prove to be correct. Such statements are subject to certain risks, uncertainties and assumptions, including but not limited to the risk factors discussed herein under “Item 1A – Risk Factors.” Should one or more of these risks or uncertainties materialize, or should underlying assumptions prove incorrect, actual results may vary materially from those anticipated, estimated or expected. Among the key factors that may cause actual results to differ materially from those projected in forward-looking statements include fluctuations in the economy, the degree and nature of competition, fluctuations in interest rates, the availability of capital at acceptable rates and terms, demand for consumer financing in the markets served by the Company, the Company’s products and services, increases in the default rates experienced on retail installment sales contracts (“Contracts”), regulatory changes in the Company’s existing and future markets, and the Company’s ability to expand its business, including its ability to identify and complete acquisitions and integrate the operations of acquired businesses, to recruit and retain qualified employees, to expand into new markets and to maintain profit margins in the face of increased pricing competition. All forward-looking statements included in this Report are based on information available to the Company as of the date of filing of this Report, and the Company assumes no obligation to update any such forward-looking statement. Prospective investors should also consult the risk factors described from time to time in the Company’s filings made with the US Securities and Exchange Commission (“SEC”), including its reports on Forms 10-Q, 8-K and 10-K and annual reports to shareholders.
1
Table of Contents
General
Nicholas Financial, Inc. (“Nicholas Financial-Canada”) is a Canadian holding company incorporated under the laws of British Columbia in 1986. The business activities of Nicholas Financial-Canada are conducted through its two wholly-owned subsidiaries formed pursuant to the laws of the State of Florida, Nicholas Financial, Inc. (“Nicholas Financial”) and Nicholas Data Services, Inc. (“NDS”). Nicholas Financial is a specialized consumer finance company engaged primarily in acquiring and servicing Contracts for purchases of new and used automobiles and light trucks. To a lesser extent, Nicholas Financial also makes direct loans and sells consumer-finance related products. NDS is engaged in supporting and updating industry-specific computer application software for small businesses located primarily in the Southeast United States. Nicholas Financial’s financing activities accounted for more than 99% of the Company’s consolidated revenues for each of the fiscal years ended March 31, 2012, 2011 and 2010. NDS’s activities accounted for less than 1% of consolidated revenues during the same periods.
Nicholas Financial-Canada, Nicholas Financial and NDS are hereafter collectively referred to as the “Company”. All financial information herein is designated in United States dollars.
The Company’s principal executive offices are located at 2454 McMullen Booth Road, Building C, Clearwater, Florida 33759, and its telephone number is (727) 726-0763.
Available Information
The Company’s filings with the SEC, including annual reports on Form 10-K, quarterly reports on Form 10-Q, definitive proxy statements on Schedule 14A, current reports on Form 8-K, and any amendments to those reports filed pursuant to Section 13 or 15(d) of the Securities Exchange Act of 1934, are made available free of charge through the Investor Relations section of the Company’s Internet website at http://www.nicholasfinancial.com as soon as reasonably practicable after the Company electronically files such material with, or furnishes it to, the SEC. Copies of any materials the Company files with the SEC can also be obtained free of charge through the SEC’s website at http://www.sec.gov, at the SEC’s Public Reference Room at 100 F Street, N.E., Washington, D.C. 20549, or by calling the SEC’s Office of Investor Education and Assistance at 1-800-732-0330.
Growth Strategy
The Company’s principal goals are to increase its profitability and its long-term shareholder value through greater penetration in its current markets and controlled geographic expansion into new markets. The Company seeks to expand its automobile financing program in fifteen states — Alabama, Florida, Georgia, Illinois, Indiana, Kentucky, Maryland, Michigan, Missouri, North Carolina, Ohio, South Carolina, Tennessee, Virginia, Kansas — in which it currently operates by increasing the business generated at its existing branch locations and by targeting certain geographic locations within these states where it believes there is a sufficient market for its automobile financing program. The Company’s strategy is to monitor these markets and ultimately decide if and where it will open additional branch locations. During fiscal 2012, the Company opened four new branches. Within the first quarter of fiscal 2013, the Company will be opening three additional branches. The Company did not close any branches during the same period. The Company will continue to evaluate any branch locations that do not meet its minimum profitability targets and may elect to close one or more of these branches in the future. As of the date of this Report, the Company has no plans to close any branches within the fiscal year ending March 31, 2013, although no assurances can be given that it will not do so. The Company also continues to analyze other markets in states in which it does not currently operate for expansion opportunities. Although the Company has not made any bulk purchases of Contracts in well over a decade, if the opportunity arises, the Company may consider possible acquisitions of portfolios of seasoned Contracts from dealers in bulk transactions as a means of further penetrating its existing markets or expanding its presence in targeted geographic locations. The Company cannot provide any assurances, however, that it will be able to further expand in either its current markets or any targeted new markets.
The Company is currently licensed to provide direct consumer loans in Florida and North Carolina. In addition, the Company is currently analyzing the direct loan market in Ohio for possible future expansion into such market. The Company does not have any current plans to expand its strategy of soliciting current customers and expects total direct loans to remain approximately 2% of its total portfolio.
2
Table of Contents
Automobile Finance Business – Contracts
The Company is engaged in the business of providing financing programs, primarily on behalf of purchasers of new and used cars and light trucks who meet the Company’s credit standards, but who do not meet the credit standards of traditional lenders, such as banks and credit unions, because of the age of the vehicle being financed or the customer’s job instability or credit history. Unlike traditional lenders, which look primarily to the credit history of the borrower in making lending decisions and typically finance new automobiles, the Company is willing to purchase Contracts for purchases made by borrowers who do not have a good credit history and for older model and high mileage automobiles. In making decisions regarding the purchase of a particular Contract the Company considers the following factors related to the borrower: place and length of residence; current and prior job status; history in making installment payments for automobiles; current income; and credit history. In addition, the Company examines its prior experience with Contracts purchased from the dealer from which the Company is purchasing the Contract, and the value of the automobile in relation to the purchase price and the term of the Contract.
The Company’s automobile finance programs are currently conducted in fourteen states through a total of 60 branch offices, consisting of nineteen in Florida, eight in Ohio, six in each of North Carolina and Georgia, three in each of Alabama, Kentucky and Indiana, two in each of Tennessee, Michigan, Missouri, South Carolina and Virginia and one in each of Maryland, and Illinois. The Company is developing markets in Kansas and plans to open its first branch location there in the first quarter of fiscal year ending March 31, 2013. As of March 31, 2012 the Company had non-exclusive agreements with approximately 4,000 dealers, of which approximately 1,700 are active, for the purchase of individual Contracts that meet the Company’s financing criteria. The Company considers a dealer agreement to be active if the Company has purchased a Contract thereunder in the last six months. Each dealer agreement requires the dealer to originate Contracts in accordance with the Company’s guidelines. Once a Contract is purchased by the Company the dealer is no longer involved in the relationship between the Company and the borrower, other than through the existence of limited representations and warranties of the dealer in favor of the Company.
A customer under a Contract typically makes a down payment, in the form of cash or trade-in, ranging from 5% to 35% of the sale price of the vehicle financed. The balance of the purchase price of the vehicle plus taxes, title fees and, if applicable, premiums for extended service Contracts, accident and health insurance and/or credit life insurance, are generally financed over a period of 12 to 72 months. Accident and health insurance coverage enables the customer to make required payments under the Contract in the event the borrower becomes unable to work because of illness or accident and credit life insurance pays the borrower’s obligations under the Contract upon his or her death.
The Company purchases a Contract from an automobile dealer at a negotiated price that is less than the original principal amount being financed (the discount) by the purchaser of the automobile. The amount of the discount depends upon factors such as the age and value of the automobile and the creditworthiness of the customer. The Company will pay more (i.e., purchase the Contract at a smaller discount from the original principal amount) for Contracts as the credit risk of the customer improves. In certain markets, competition more significantly impacts the discount that the Company can charge. To date, the Contracts purchased by the Company have been purchased at discounts that range from 1% to 15% of the original principal amount of each Contract. In addition to the discount, the Company charges the dealer a processing fee of $75 per Contract purchased. As of March 31, 2012, the Company’s loan portfolio consisted exclusively of Contracts purchased without recourse to the dealer. Although all of the Contracts in the Company’s loan portfolio were acquired without recourse, each dealer remains potentially liable to the Company for breaches of certain representations and warranties made by the dealer with respect to compliance with applicable federal and state laws and valid title to the vehicle.
The Company’s policy is to only purchase a Contract after the dealer has provided the Company with the requisite proof that the Company has a first priority lien on the financed vehicle (or the Company has, in fact, perfected such first priority lien), that the customer has obtained the required collision insurance naming the Company as loss payee and that the Contract has been fully and accurately completed and validly executed. Once the Company has received and approved all required documents, it pays the dealer for the Contract and commences servicing the Contract.
The Company requires the owner of the vehicle to obtain and maintain collision insurance, naming the Company as the loss payee, with a deductible of not more than $500. Both the Company and the dealers offer purchasers of vehicles certain other “add-on products.” These products are offered by the dealer on behalf of the Company or on behalf of the dealership at the time of sale. They consist of a roadside assistance plan, extended warranty protection, gap insurance, credit life insurance, credit accident and health insurance. If the purchaser so desires, the cost of these products may be included in the amount financed under the Contract.
3
Table of Contents
Contract Procurement
The Company currently purchases Contracts in the states listed in the table below. The Contracts purchased by the Company are predominately for used vehicles; for the periods shown below, less than 1% were for new vehicles. The average model year collateralizing the portfolio as of March 31, 2012 was a 2005 vehicle. The dollar amounts shown in the table below represent the Company’s finance receivables, net of unearned interest on Contracts purchased:
| Maximum allowable |
Fiscal year ended March 31, | |||||||||||||||
| State |
interest rate (1) | 2012 | 2011 | 2010 | ||||||||||||
| Alabama |
(2) | $ | 6,783,484 | $ | 5,492,379 | $ | 4,094,540 | |||||||||
| Florida |
18-30 | % (3) | 43,651,078 | 48,498,785 | 46,471,616 | |||||||||||
| Georgia |
18-30 | % (3) | 16,614,136 | 16,122,285 | 13,439,117 | |||||||||||
| Illinois |
(2) | 3,397,116 | 901,154 | — | ||||||||||||
| Indiana |
21 | % | 9,476,794 | 9,402,834 | 6,731,647 | |||||||||||
| Kansas |
(2) | 524,647 | — | — | ||||||||||||
| Kentucky |
18-25 | % (3) | 8,548,743 | 9,817,729 | 8,238,952 | |||||||||||
| Maryland |
24 | % | 1,636,236 | 1,750,863 | 943,390 | |||||||||||
| Michigan |
25 | % | 5,842,652 | 5,775,566 | 3,796,999 | |||||||||||
| Missouri |
(2) | 5,053,896 | 1,052,326 | — | ||||||||||||
| North Carolina |
18-29 | % (3) | 13,558,091 | 14,621,001 | 11,779,435 | |||||||||||
| Ohio |
25 | % | 19,707,139 | 20,626,860 | 18,176,574 | |||||||||||
| South Carolina |
(2) | 2,981,626 | 3,052,435 | 2,064,958 | ||||||||||||
| Tennessee |
(2) | 4,712,364 | 5,621,920 | 2,410,273 | ||||||||||||
| Virginia |
(2) | 3,833,685 | 4,414,838 | 3,459,237 | ||||||||||||
|
|
|
|
|
|
|
|||||||||||
| Total |
$ | 146,321,687 | $ | 147,150,975 | $ | 121,606,738 | ||||||||||
|
|
|
|
|
|
|
|||||||||||
| (1) | The maximum allowable interest rates by state are subject to change and are governed by the individual states the Company conducts business in. |
| (2) | None of these states currently imposes a maximum allowable interest rate with respect to the types and sizes of Contracts the Company purchases. The maximum rate which the Company will typically charge any customer in each of these states is 30% per annum. |
| (3) | The maximum allowable interest rate in each of these states varies depending upon the model year of the vehicle being financed. In addition, Georgia does not currently impose a maximum allowable interest rate with respect to Contracts over $5,000. |
The following table presents selected information on Contracts purchased by the Company, net of unearned interest:
| Fiscal year ended March 31, | ||||||||||||
| Contracts |
2012 | 2011 | 2010 | |||||||||
| Purchases |
$ | 146,321,687 | $ | 147,150,975 | $ | 121,606,738 | ||||||
| Weighted APR |
23.82 | % | 23.57 | % | 23.55 | % | ||||||
| Average discount |
8.47 | % | 8.78 | % | 9.11 | % | ||||||
| Weighted average term (months) |
49 | 49 | 48 | |||||||||
| Average loan |
$ | 9,873 | $ | 9,804 | $ | 9,422 | ||||||
| Number of contracts |
14,820 | 15,009 | 12,907 | |||||||||
4
Table of Contents
Direct Loans
The Company currently originates direct loans in Florida and North Carolina. Direct loans are loans originated directly between the Company and the consumer. These loans are typically for amounts ranging from $1,000 to $9,000 and are generally secured by a lien on an automobile, watercraft or other permissible tangible personal property. The average loan made to date by the Company had an initial principal balance of approximately $3,000. The Company does not expect the average loan size to increase significantly within the foreseeable future. The majority of direct loans are originated with current or former customers under the Company’s automobile financing program. The typical direct loan represents a significantly better credit risk than our typical Contract due to the customer’s historical payment history with the Company. The Company does not have a direct loan license in Alabama, Illinois, Indiana, Kentucky, Maryland, Michigan, Missouri, Ohio, South Carolina, Tennessee, Kansas, or Virginia, and none is presently required in Georgia (as long as the direct loan is greater than $3,000). The Company is currently not pursuing direct loans in Georgia. Typically, the Company allows for a seasoning process to occur in a new market prior to determining whether to pursue a direct loan license there. The Company is currently analyzing the direct loan market in Ohio and may pursue a direct loan license there. The Company does not expect to pursue a direct loan license in any other state during the fiscal year ending March 31, 2013. The size of the loan and maximum interest rate that can be charged vary from state to state. In deciding whether or not to make a loan, the Company considers the individual’s credit history, job stability, income and impressions created during a personal interview with a Company loan officer. Additionally, because most of the direct consumer loans made by the Company to date have been made to borrowers under Contracts previously purchased by the Company, the payment history of the borrower under the Contract is a significant factor in making the loan decision. The Company’s direct loan program was implemented in April 1995 and currently accounts for approximately 2% of annual consolidated revenues for the Company. As of March 31, 2012, loans made by the Company pursuant to its direct loan program constituted approximately 2% of the aggregate principal amount of the Company’s loan portfolio.
In connection with its direct loan program, the Company also offers health and accident insurance coverage and credit life insurance to customers. Customers in approximately 75% of the 2,121 direct loan transactions outstanding as of March 31, 2012 had elected to purchase insurance coverage offered by the Company. The cost of this insurance is included in the amount financed by the customer.
The following table presents selected information on direct loans originated by the Company, net of unearned interest:
| Fiscal year ended March 31, | ||||||||||||
| Direct loan originations |
2012 | 2011 | 2010 | |||||||||
| Originations |
$ | 5,993,992 | $ | 4,723,871 | $ | 3,708,998 | ||||||
| Weighted APR |
26.63 | % | 26.52 | % | 25.93 | % | ||||||
| Weighted average term (months) |
25 | 24 | 26 | |||||||||
| Average loan |
$ | 2,961 | $ | 2,856 | $ | 2,705 | ||||||
| Number of contracts |
2,024 | 1,654 | 1,371 | |||||||||
Underwriting Guidelines
The Company’s typical customer has a credit history that fails to meet the lending standards of most banks and credit unions. Among the credit problems experienced by the Company’s customers that resulted in a poor credit history are: unpaid revolving credit card obligations; unpaid medical bills; unpaid student loans; prior bankruptcy; and evictions for nonpayment of rent. The Company believes that its customer profile is similar to that of its direct competitors.
Prior to its approval of the purchase of a Contract, the Company is provided with a standardized credit application completed by the consumer which contains information relating to the consumer’s background, employment, and credit history. The Company also obtains credit reports from Equifax, Experian and/or TransUnion, which are independent credit reporting services. The Company verifies the consumer’s employment history, income and residence. In most cases, consumers are interviewed by telephone by a Company application processor. The Company also considers the customer’s prior payment history with the Company, if any, as well as the collateral value of the vehicle being financed.
The Company has established internal buying guidelines to be used by its Branch Managers and internal underwriters when purchasing Contracts. Any Contract that does not meet these guidelines must be approved by the senior management of the Company. The Company currently has District Managers charged with managing the specific branches in a defined geographic area. In addition to a variety of administrative duties, the District Managers are responsible for monitoring their assigned branches’ compliance with the Company’s underwriting standards.
The Company uses essentially the same criteria in analyzing a direct loan as it does in analyzing the purchase of a Contract. Lending decisions regarding direct loans are made based upon a review of the customer’s loan application, credit history, job stability, income, in-person interviews with a Company loan officer and the value of the collateral offered by the borrower to secure the loan. To date, since the majority of the Company’s direct loans have been made to individuals whose automobiles have been financed by the Company, the customer’s payment history under his or her existing or past Contract is a significant factor in the lending decision.
5
Table of Contents
After reviewing the information included in the Contract or direct loan application and taking the other factors into account, a Company employee categorizes the customer using internally developed credit classifications of “1,” indicating higher creditworthiness, through “6,” indicating lower creditworthiness. Contracts are financed for individuals who fall within all six acceptable rating categories utilized, “1” through “6”. Usually a customer who falls within the two highest categories (i.e., “1” or “2”) is purchasing a two to four-year old, low mileage used automobile from the inventory of a new car or franchise dealer, while a customer in any of the three lowest categories (i.e., “4”, “5”, or “6”) is purchasing an older, high mileage automobile from an independent used automobile dealer.
The Company utilizes its Loss Prevention and Recovery Department (the “LPR”) to perform on-site audits of branch compliance with Company underwriting guidelines. LPR audits Company branches on a schedule that is variable depending on the size of the branch, length of time a branch has been open, current tenure of the Branch Manager, previous branch audit score and current and historical branch profitability. LPR reports directly to the Accounting and Administrative Management of the Company. The Company believes that an independent review and audit of its branches that is not tied to the sales function of the Company is imperative in order to assure the information obtained is impartial.
Monitoring and Enforcement of Contracts
The Company requires each customer under a Contract to obtain and maintain collision insurance covering damage to the vehicle. Failure to maintain such insurance constitutes a default under the Contract, and the Company may, at its discretion, repossess the vehicle. To reduce potential loss due to insurance lapse, the Company has the contractual right to force place its own collateral protection insurance policy, which covers loss due to physical damage to a vehicle not covered by any insurance policy of the customer.
The Company’s Management Information Services personnel maintain a number of reports to monitor compliance by customers with their obligations under Contracts and direct loans made by the Company. These reports may be accessed on a real-time basis throughout the Company by management personnel, including Branch Managers and staff, at computer terminals located in the main office and each branch office. These reports include delinquency aging reports, customer promises reports, vehicle information reports, purchase reports, dealer analysis reports, static pool reports, and repossession reports.
A delinquency report is an aging report that provides basic information regarding each account and indicates accounts that are past due. The report includes information such as the account number, address of the customer, home and work phone numbers of the customer, original term of the Contract, number of remaining payments, outstanding balance, due dates, date of last payment, number of days past due, scheduled payment amount, amount of last payment, total past due, and special payment arrangements or agreements.
Any account that is less than 120 days old is included on the delinquency report on the first day that the Contract is contractually past due. Once an account becomes 30 days past due, repossession proceedings are implemented unless the customer provides the Company with an acceptable explanation for the delinquency and displays a willingness and the ability to make the payment, and commits to a plan to return the account to current status. When an account is 60 days past due, the Company ceases recognition of income on the Contract and repossession proceedings are initiated. At 120 days delinquent, if the vehicle has not yet been repossessed, the account is written off. Once a vehicle has been repossessed, the related loan balance no longer appears on the delinquency report. Instead, the vehicle appears on the Company’s repossession report and is sold, either at auction or to an automobile dealer.
When an account becomes delinquent, the Company immediately contacts the customer to determine the reason for the delinquency and to determine if appropriate arrangements for payment can be made. If payment arrangements acceptable to the Company can be made, the information is entered in its database and is used to generate a “Promises Report,” which is utilized by the Company’s collection staff for account follow up.
The Company prepares a repossession report that provides information regarding repossessed vehicles and aids the Company in disposing of repossessed vehicles. In addition to information regarding the customer, this report provides information regarding the date of repossession, date the vehicle was sold, number of days it was held in inventory prior to sale, year, make and model of the vehicle, mileage, payoff amount on the Contract, NADA book value, Black Book value, suggested sale price, location of the vehicle, original dealer and condition of the vehicle, as well as notes other information that may be helpful to the Company.
The Company also prepares a dealer analysis report that provides information regarding each dealer from which it purchases Contracts. This report allows the Company to analyze the volume of business done with each dealer and the terms on which it has purchased Contracts from such dealer.
6
Table of Contents
The Company’s policy is to aggressively pursue legal remedies to collect deficiencies from customers. Oral requests for payment are made beginning when an account becomes 11 days delinquent. When an account becomes 30 days delinquent and the customer has not made payment arrangements acceptable to the Company or has failed to respond to the requests for payment, a repossession request form is prepared by the responsible branch office employee for approval by the Branch Manager for the vicinity in which the borrower lives. Once the repossession request has been approved, first by the Branch Manager and second by the applicable District Manager, it must then be approved by the Director of Loss Recovery. The repossessor delivers the vehicle to a secure location specified by the Company. The Company maintains relationships with several licensed repossession firms that repossess vehicles for fees that range from $250 to $500 for each vehicle repossessed. As required by Alabama, Florida, Georgia, Illinois, Indiana, Kentucky, Maryland, Michigan, Missouri, North Carolina, Ohio, South Carolina, Tennessee, Kansas and Virginia law, the customer is notified by certified letter that the vehicle has been repossessed and what the customer needs to do in order to regain their vehicle.
The minimum requirement for return of the vehicle is payment of all past due amounts under the Contract and all expenses associated with the repossession incurred by the Company. If satisfactory arrangements for return of the vehicle are not made within the statutory period, the Company then sends title to the vehicle to the applicable state title transfer department, which then registers the vehicle in the name of the Company. The Company then either sells the vehicle to a dealer or has it transported to an automobile auction for sale. On average, approximately 30 days lapse between the time the Company takes possession of a vehicle and the time it is sold to a dealer or at auction. When the Company determines that there is a reasonable likelihood of recovering part or all of any deficiency against the customer under the Contract, it pursues legal remedies available to it, including lawsuits, judgment liens and wage garnishments. Historically, the Company has recovered approximately 10-17% of deficiencies from such customers. Proceeds from the disposition of the vehicles are not included in calculating the foregoing percentage range.
Marketing and Advertising
The Company’s Contract marketing efforts currently are directed exclusively toward automobile dealers. The Company attempts to meet dealers’ needs by offering highly-responsive, cost-competitive and service-oriented financing programs. The Company relies on its District and Branch Managers to solicit agreements for the purchase of Contracts with automobile dealers located within a 25-mile radius of each branch office. The Branch Manager provides dealers with information regarding the Company and the general terms upon which the Company is willing to purchase Contracts. The Company presently has no plans to implement any other forms of advertising, such as radio or newspaper advertisements, for the purchase of Contracts
The Company solicits customers under its direct loan program primarily through direct mailings, followed by telephone calls, to individuals who have a good credit history with the Company in connection with Contracts purchased by the Company.
Computerized Information System
The Company utilizes integrated computer systems developed by NDS to assist in responding to customer inquiries and to monitor the performance of its Contract and direct loan portfolio and the performance of individual customers under Contracts. All Company personnel are provided with real-time access to information from a single shared database. The Company has created specialized programs to automate the tracking of Contracts and direct loans from inception. The Company’s computer network encompasses both its corporate headquarters and its branch office locations. See “Monitoring and Enforcement of Contracts” above for a summary of the different reports prepared by the Company.
Competition
The consumer finance industry is highly fragmented and highly competitive. There are numerous financial service companies that provide consumer credit in the markets served by the Company, including banks, other consumer finance companies, and captive finance companies owned by automobile manufacturers and retailers. Many of these companies have significantly greater resources than the Company. The Company does not believe that increased competition for the purchase of Contracts will cause a material reduction in the interest rate payable by an individual purchaser of an automobile for the foreseeable future. However, increased competition for the purchase of Contracts will enable automobile dealers to shop for the best price, thereby giving rise to an erosion in the discount from the initial principal amounts at which the Company would be willing to purchase Contracts.
The Company’s target market consists of persons who are generally unable to obtain traditional used car financing because of their credit history or the vehicle’s mileage or age. The Company has been able to expand its automobile finance business in the non-prime credit market by offering to purchase Contracts on terms that are competitive with those of other companies which purchase automobile receivables in that market segment. Because of the daily contact that many of its employees have with automobile dealers located throughout the market areas served by it, the Company is generally aware of the terms upon which its competitors are offering to purchase Contracts. The Company’s policy is to modify its terms, if necessary, to remain competitive. However, the Company will not sacrifice credit quality, its purchasing criteria or prudent business practices in order to meet the competition.
7
Table of Contents
The Company’s ability to compete effectively with other companies, offering similar financing arrangements, depends upon maintaining close business relationships with dealers of new and used vehicles. No single dealer out of the approximately 1,700 dealers that the Company currently has active Contractual relationships with accounted for over 1% of its business volume for any of the fiscal years ended March 31, 2012, 2011 or 2010.
Regulation
The Company’s financing operations are subject to regulation, supervision and licensing under various federal, state and local statutes and ordinances. Additionally, the procedures that the Company must follow in connection with the repossession of vehicles securing Contracts are regulated by each of the states in which the Company does business. To date, the Company’s operations have been conducted exclusively in the states of Alabama, Florida, Georgia, Illinois, Indiana, Kansas, Kentucky, Maryland, Michigan, Missouri, North Carolina, Ohio, South Carolina, Tennessee and Virginia. Accordingly, the laws of such states, as well as applicable federal law, govern the Company’s operations. Compliance with existing laws and regulations has not had a material adverse effect on the Company’s operations to date. The Company’s management believes that the Company maintains all requisite licenses and permits and is in material compliance with all applicable local, state and federal laws and regulations. The Company periodically reviews its branch office practices in an effort to ensure such compliance. The following constitute certain of the existing federal, state and local statutes and ordinances with which the Company must comply:
| • | State consumer regulatory agency requirements. Pursuant to state regulations, on-site audits are conducted of each of the Company’s branches located within Florida, Alabama, Illinois, Indiana, Michigan and Missouri to monitor compliance with applicable regulations. These regulations include, but are not limited to: licensure requirements, requirements for maintenance of proper records, payment of required fees, maximum interest rates that may be charged on loans to finance used vehicles and proper disclosure to customers regarding financing terms. Pursuant to North Carolina law, the Company’s direct loan activities in that state are subject to similar periodic on-site audits by the North Carolina Office of the Commissioner of Banks. |
| • | State licensing requirements. The Company maintains a Sales Finance Company License with the Florida Department of Banking and Finance, as well as consumer loan licenses in Florida and North Carolina. In addition, each of the dealers that the Company does business with is required to maintain a Retail Installment Seller’s License with each state in which it operates. |
| • | Fair Debt Collection Practices Act. The Fair Debt Collection Practices Act (“FDCPA”) and applicable state law counterparts prohibit the Company from contacting customers during certain times and at certain places, from using certain threatening practices and from making false implications when attempting to collect a debt. |
| • | Truth in Lending Act. The Truth in Lending Act (“TILA”) requires the Company and the dealers it does business with to make certain disclosures to customers, including the terms of repayment, the total finance charge and the annual percentage rate charged on each Contract or direct loan. |
| • | Equal Credit Opportunity Act. The Equal Credit Opportunity Act (“ECOA”) prohibits creditors from discriminating against loan applicants on the basis of race, color, sex, age or marital status. Pursuant to Regulation B promulgated under the ECOA, creditors are required to make certain disclosures regarding consumer rights and advise consumers whose credit applications are not approved of the reasons for the rejection. |
| • | Fair Credit Reporting Act. The Fair Credit Reporting Act (“FCRA”) requires the Company to provide certain information to consumers whose credit applications are not approved on the basis of a report obtained from a consumer-reporting agency. |
| • | Gramm-Leach-Bliley Act. The Gramm-Leach-Bliley Act (“GLBA”) requires the Company to maintain privacy with respect to certain consumer data in its possession and to periodically communicate with consumers on privacy matters. |
| • | Soldiers’ and Sailors’ Civil Relief Act. The Soldiers’ and Sailors’ Civil Relief Act requires the Company to reduce the interest rate charged on each loan to customers who have subsequently joined, enlisted, been inducted or called to active military duty. |
| • | Electronic Funds Transfer Act. The Electronic Funds Transfer Act (“EFTA”) prohibits the Company from requiring its customers to repay a loan or other credit by electronic funds transfer (“EFT”), except in limited situations which do not apply to the Company. The Company is also required to provide certain documentation to its customers when an EFT is initiated and to provide certain notifications to its customers with regard to preauthorized payments. |
8
Table of Contents
| • | Telephone Consumer Protection Act. The Telephone Consumer Protection Act prohibits telephone solicitation calls to a customer’s home before 8 a.m. or after 9 p.m. In addition, if the Company makes a telephone solicitation call to a customer’s home, the representative making the call must provide his or her name, the Company’s name, and a telephone number or address at which the Company’s representative may be contacted. The Telephone Consumer Protection Act also requires that the Company maintain a record of any requests by customers not to receive future telephone solicitations, which must be maintained for five years. |
| • | Bankruptcy. Federal bankruptcy and related state laws may interfere with or affect the Company’s ability to recover collateral or enforce a deficiency judgment. |
| • | Dodd-Frank Wall Street Reform and Consumer Protection Act 0f 2010 (“Dodd-Frank Act”). Title X of the Dodd-Frank Act created the Consumer Financial Protection Bureau (“CFPB”), which, effective as of July 21, 2011, has the authority to issue and enforce regulations under the federal “enumerated consumer laws,” including (subject to certain statutory limitations) FDCPA, TILA, ECOA, FCRA, GLBA and EFTA. |
Employees
The Company’s management and various support functions are centralized at the Company’s Corporate Headquarters in Clearwater, Florida. As of March 31, 2012 the Company employed a total of 297 persons, 3 of whom work for NDS and 294 of whom work for Nicholas Financial. None of the Company’s employees are subject to a collective bargaining agreement, and the Company considers its relations with its employees generally to be good.
The following factors, as well as other factors not set forth below, may adversely affect the business, operations, financial condition or results of operations of the Company (sometimes referred to in this section as “we” “us” or “our”).
We operate in a competitive market.
The non-prime consumer-finance industry is highly competitive. There are numerous financial service companies that provide consumer credit in the markets served by us, including banks, credit unions, other consumer finance companies and captive finance companies owned by automobile manufacturers and retailers. Many of these competitors have substantially greater financial resources than us. In addition, our competitors often provide financing on terms more favorable to automobile purchasers or dealers than we offer. Many of these competitors also have long-standing relationships with automobile dealerships and may offer dealerships or their customers other forms of financing, including dealer floor-plan financing and leasing, which are not provided by us. Providers of non-prime consumer financing have traditionally competed primarily on the basis of:
| • | interest rates charged; |
| • | the quality of credit accepted; |
| • | the flexibility of loan terms offered; and |
| • | the quality of service provided. |
Our ability to compete effectively with other companies offering similar financing arrangements depends on maintaining close relationships with dealers of new and used vehicles. We may not be able to compete successfully in this market or against these competitors.
We have focused on a segment of the market composed of consumers who typically do not meet the more stringent credit requirements of traditional consumer financing sources and whose needs, as a result, have not been addressed consistently by such financing sources. When new and/or existing providers of consumer financing undertake significantly greater efforts to penetrate our targeted market segment, we may have to reduce our interest rates and fees in order to maintain our market share. Any reduction in our interest rates or fees could have a material adverse impact on our profitability or financial condition.
Our profitability and future growth depend on our continued access to bank financing.
The profitability and growth of our business currently depend on our ability to access bank debt at competitive rates. We currently depend on a $150.0 million line of credit facility with a financial institution to finance our purchases of Contracts and fund our direct loans. This line of credit currently has a maturity date of November 30, 2013 and is secured by substantially all our assets. At March 31, 2012, we had approximately $112.0 million outstanding under the line of credit and approximately $38.0 million available for additional borrowing.
The availability of our credit facility depends, in part, on factors outside of our control, including regulatory capital treatment for unfunded bank lines of credit and the availability of bank loans in general. Therefore, we cannot guarantee that this credit facility will continue to be available beyond the current maturity date on reasonable terms or at all. If we are unable to renew or replace our credit facility or find alternative financing at reasonable rates, we may be forced to liquidate. We will continue to depend on the availability of our line of credit, together with cash from operations, to finance our future operations.
9
Table of Contents
The terms of our indebtedness impose significant restrictions on us.
Our existing outstanding indebtedness restricts our ability to, among other things:
| • | sell or transfer assets; |
| • | incur additional debt; |
| • | repay other debt; |
| • | make certain investments or acquisitions; |
| • | repurchase or redeem capital stock; |
| • | engage in mergers or consolidations; and |
| • | engage in certain transactions with subsidiaries and affiliates. |
In addition, our line of credit facility requires us to comply with certain financial ratios and covenants and to satisfy specified financial tests, including maintenance of asset quality and portfolio performance tests. The need to comply with such covenants and other provisions could impact our ability to pay dividends to our shareholders. Moreover, our ability to continue to meet those financial ratios and tests could be affected by events beyond our control. Failure to meet any of these covenants, financial ratios or financial tests could result in an event of default under our line of credit facility. If an event of default occurs under this credit facility, our lenders may take one or more of the following actions:
| • | increase our borrowing costs; |
| • | restrict our ability to obtain additional borrowings under the facility; |
| • | accelerate all amounts outstanding under the facility; or |
| • | enforce their interest against collateral pledged under the facility. |
If our lender accelerates our debt payments, our assets may not be sufficient to fully repay the debt.
We will require a significant amount of cash to service our indebtedness and meet our other liquidity needs.
Our ability to make payments on or to refinance our indebtedness and to fund our operations and planned capital expenditures depends on our future operating performance. Our primary cash requirements include the funding of:
| • | Contract purchases and direct loans; |
| • | interest payments under our line of credit facility and other indebtedness; |
| • | capital expenditures for technology and facilities; |
| • | ongoing operating expenses; |
| • | planned expansions by opening additional branch offices; and |
| • | any required income tax payments. |
In addition, because we expect to continue to require substantial amounts of cash for the foreseeable future, we may seek additional debt or equity financing. The type, timing and terms of the financing we select will be dependent upon our cash needs, the availability of other financing sources and the prevailing conditions in the financial markets. There is no assurance that any of these sources will be available to us at any given time or that the terms on which these sources may be available will be favorable. Our inability to obtain such additional financing on reasonable terms could adversely impact our ability to grow.
Our high level of indebtedness could have important consequences for our business. For example,
| • | we may be unable to satisfy our obligations under our outstanding indebtedness; |
| • | we may find it more difficult to fund future working capital, capital expenditures, acquisitions, and general corporate needs; |
| • | we may have to dedicate a substantial portion of our cash resources to the payments on our outstanding indebtedness, thereby reducing the funds available for operations and future business opportunities; and |
| • | we may be more vulnerable to adverse general economic and industry conditions. |
10
Table of Contents
Our ability to make payments on, or to refinance, our indebtedness will depend on our future operating performance, including our ability to access additional debt and equity financing, which, to a certain extent, is subject to economic, financial, competitive and other factors beyond our control. If new debt is added to our current levels, the risks described above could intensify.
We may experience high delinquency rates in our loan portfolios, which could reduce our profitability.
Our profitability depends, to a material extent, on the performance of Contracts that we purchase. Historically, we have experienced higher delinquency rates than traditional financial institutions because a large portion of our loans are to non-prime borrowers, who are unable to obtain financing from traditional sources due to their credit history. Although we attempt to mitigate these high credit risks with our underwriting standards and collection procedures, these standards and procedures may not offer adequate protection against the risk of default, especially in periods of economic uncertainty and high unemployment such as have existed over much of the past several years. In the event of a default, the collateral value of the financed vehicle usually does not cover the outstanding loan balance and costs of recovery. Higher than anticipated delinquencies and defaults on our Contracts would reduce our profitability.
In addition, in the event we were to make any bulk purchases of seasoned Contracts, we may experience higher than normal delinquency rates with respect to these loan portfolios due to our inability to apply our underwriting standards to each loan comprising the acquired portfolios. We would similarly attempt to mitigate the high credit risks associated with these loans, although no assurances can be given that we would be able to do so.
We depend upon our relationships with our dealers.
Our business depends in large part upon our ability to establish and maintain relationships with reputable dealers who originate the Contracts we purchase. Although we believe we have been successful in developing and maintaining such relationships, such relationships are not exclusive, and many of them are not longstanding. There can be no assurances that we will be successful in maintaining such relationships or increasing the number of dealers with whom we do business, especially in light of higher than normal dealership closures as a result of the recent economic downturn, or that our existing dealer base will continue to generate a volume of Contracts comparable to the volume of such Contracts historically generated by such dealers.
Our success depends upon our ability to implement our business strategy.
Our financial position depends on management’s ability to execute our business strategy. Key factors involved in the execution of our business strategy include achievement of the desired Contract purchase volume, the use of effective risk management techniques and collection methods, continued investment in technology to support operating efficiency, and continued access to significant funding and liquidity sources. Our failure or inability to execute any element of our business strategy could materially adversely affect our business and financial condition.
Our business is highly dependent upon general economic conditions.
We are subject to changes in general economic conditions that are beyond our control. During periods of economic slowdown or high unemployment, such as has existed for much of the past several years, delinquencies, defaults, repossessions and losses generally increase, absent offsetting factors, such as decreased competition. These periods also may be accompanied by decreased consumer demand for automobiles and declining values of automobiles securing outstanding loans, which weakens collateral coverage on our loans and increases the amount of a loss we would experience in the event of default. Because we focus on non-prime borrowers, the actual rates of delinquencies, defaults, repossessions and losses on these loans are higher than those experienced in the general automobile finance industry and could be more dramatically affected by a general economic downturn. In addition, during an economic slowdown or recession, our servicing costs may increase without a corresponding increase in our servicing income. While we seek to manage the higher risk inherent in loans made to non-prime borrowers through our underwriting criteria and collection methods, no assurances can be given that these criteria or methods will afford adequate protection against these risks. Any sustained period of increased delinquencies, defaults, repossessions or losses or increased servicing costs could adversely affect our business and financial condition.
Recent economic developments may adversely affect our business and financial condition.
Over the past several years, the United States has experienced a period of economic uncertainty and high unemployment that may adversely affect our business and financial condition. High unemployment and a continued lack of available credit could result in higher delinquencies and losses than we would otherwise experience.
Additionally, fluctuating gasoline prices, unstable real estate values, resets of adjustable rate mortgages and other factors have adversely impacted consumer confidence and disposable income. These conditions have increased loss frequency, decreased consumer demand for automobiles and could possibly weaken collateral values on certain types of vehicles. Because we focus predominately on sub-prime borrowers, the actual rates of delinquencies, defaults, repossessions and losses on Contracts are higher than those experienced in the general automobile finance industry and have been materially affected by the recent economic downturn. If economic and credit conditions do not continue to improve, our business and financial condition could be adversely affected.
11
Table of Contents
The auction proceeds we receive from the sale of repossessed vehicles and other recoveries are subject to fluctuation due to economic and other factors beyond our control.
If we repossess a vehicle securing a Contract, we typically have it transported to an automobile auction for sale. Auction proceeds from the sale of repossessed vehicles and other recoveries are usually not sufficient to cover the outstanding balance of the Contract, and the resulting deficiency is charged off. In addition, there is, on average, approximately a 30-day lapse between the time we repossess a vehicle and the time it is sold by a dealer or at auction. The proceeds we receive from such sales depend upon various factors, including the supply of, and demand for, used vehicles at the time of sale. Such supply and demand are dependent on many factors. For example, the Consumer Assistance to Recycle and Save Act of 2009, which provided incentives to replace older vehicles with new, fuel-efficient vehicles in the second half of 2009, resulted in a temporary reduction in the supply of used vehicles, thus temporarily bolstering used automobile prices. At the same time, during periods of economic slowdown or recession, the demand for used cars may soften, resulting in decreased auction proceeds to us from the sale of repossessed automobiles. Furthermore, depressed wholesale prices for used automobiles may result from significant liquidations of rental or fleet inventories, and from increased volume of trade-ins due to promotional financing programs offered by new vehicle manufacturers. Decreased auction proceeds to us resulting from sales of used automobiles at depressed prices will result in losses and, in turn, reduced profitability.
An increase in market interest rates may reduce our profitability.
Our long-term profitability may be directly affected by the level of and fluctuations in interest rates. Sustained, significant increases in interest rates may adversely affect our liquidity and profitability by reducing the interest rate spread between the rate of interest we receive on our Contracts and interest rates that we pay under our outstanding line of credit facility. As interest rates increase, our gross interest rate spread on new originations will generally decline since the rates charged on the Contracts originated or purchased from dealers generally are limited by statutory maximums, restricting our opportunity to pass on increased interest costs. We monitor the interest rate environment and previously had interest rate swap agreements relating to a portion of our outstanding debt. Each of these agreements effectively converted a portion of our floating-rate debt to a fixed-rate, thus reducing the impact of interest rate changes on our interest expense. During the fiscal year ending March 31, 2012, we had no interest rate swap agreements in place. On June 4, 2012, the Company entered into an interest rate swap transaction to convert a portion of the floating rate debt to a fixed rate, more closely matching the interest rate characteristics of finance receivables. The transaction sets forth the terms of a five-year interest rate swap in which the Company would pay a fixed rate of 1% and receives payments from the counterparty on the 1-month LIBOR rate. The swap has an effective date of June 13, 2012 and a notional amount of $25 million. The changes in the fair value of the interest rate swap (unrealized gains and losses) will be recorded in earnings. We will continue evaluating interest rate swap pricing and we may or may not enter into additional interest rate swap agreements in the future.
Our growth depends upon our ability to retain and attract a sufficient number of qualified employees.
To a large extent, our growth strategy depends on the opening of new offices that focus primarily on purchasing Contracts and making direct loans in markets we have not previously served. Future expansion of our office network depends, in part, upon our ability to attract and retain qualified and experienced office managers and the ability of such managers to develop relationships with dealers that serve those markets. We generally do not open a new office until we have located and hired a qualified and experienced individual to manage the office. Typically, this individual will be familiar with local market conditions and have existing relationships with dealers in the area to be served. Although we believe that we can attract and retain qualified and experienced personnel as we proceed with planned expansion into new markets, no assurance can be given that we will be successful in doing so. Competition to hire personnel possessing the skills and experience required by us could contribute to an increase in our employee turnover rate. High turnover or an inability to attract and retain qualified personnel could have an adverse effect on our origination, delinquency, default and net loss rates and, ultimately, our business and financial condition.
The loss of one of our key executives could have a material adverse effect on our business.
Our growth and development to date have been largely dependent upon the services of Peter L. Vosotas, our Chairman of the Board, President and Chief Executive Officer, Ralph T. Finkenbrink, our Chief Financial Officer and Senior Vice President-Finance, and Kevin Bates, our Vice President-Marketing. We do not maintain key-man life insurance policies on these executives. Although we believe that we have sufficient additional experienced management personnel to accommodate the loss of any key executive, the loss of services of one or more of these executives could have a material adverse effect on our business and financial condition.
We are subject to risks associated with litigation.
As a consumer finance company, we are subject to various consumer claims and litigation seeking damages and statutory penalties, based upon, among other things:
| • | usury laws; |
| • | disclosure inaccuracies; |
12
Table of Contents
| • | wrongful repossession; |
| • | violations of bankruptcy stay provisions; |
| • | certificate of title disputes; |
| • | fraud; |
| • | breach of contract; and |
| • | discriminatory treatment of credit applicants. |
Some litigation against us could take the form of class action complaints by consumers. As the assignee of Contracts originated by dealers, we may also be named as a co-defendant in lawsuits filed by consumers principally against dealers. The damages and penalties claimed by consumers in these types of actions can be substantial. The relief requested by the plaintiffs varies but may include requests for compensatory, statutory and punitive damages. No assurances can be given that we will not experience material financial losses in the future as a result of litigation or other legal proceedings.
The Dodd-Frank Act authorizes the newly created CFPB to adopt rules that could potentially have a material adverse effect on our operations and financial performance.
Title X of the Dodd-Frank Act established the CFPB, which became operational on July 21, 2011. Under the Dodd-Frank Act, the CFPB has regulatory, supervisory and enforcement powers over providers of consumer financial products, such as Contracts and the direct loans that we offer, including explicit supervisory authority to examine and require registration of installment lenders such as ourselves. Included among the powers afforded to the CFPB is the authority to adopt rules describing specified acts and practices as being “unfair,” “deceptive” or “abusive,” and hence unlawful. Although the Dodd-Frank Act expressly provides that the CFPB has no authority to establish usury limits, some consumer advocacy groups have suggested that certain forms of alternative consumer finance products, such as installment loans, should be a regulatory priority and it is possible that at some time in the future the CFPB could propose and adopt rules making such lending or other products that we may offer materially less profitable or impractical. Further, the CFPB may target specific features of loans by rulemaking that could cause us to cease offering certain products. Any such rules could have a material adverse effect on our business, results of operation and financial condition. The CFPB could also adopt rules imposing new and potentially burdensome requirements and limitations with respect to any of our current or future lines of business, which could have a material adverse effect on our operations and financial performance.
In addition to the Dodd-Frank Act’s grant of regulatory powers to the CFPB, the Dodd-Frank Act gives the CFPB authority to pursue administrative proceedings or litigation for violations of federal consumer financial laws. In these proceedings, the CFPB can obtain cease and desist orders (which can include orders for restitution or rescission of contracts, as well as other kinds of affirmative relief) and monetary penalties ranging from $5,000 per day for minor violations of federal consumer financial laws (including the CFPB’s own rules) to $25,000 per day for reckless violations and $1 million per day for knowing violations. If we are subject to such administrative proceedings, litigation, orders or monetary penalties in the future, this could have a material adverse effect on our operations and financial performance. Also, where a company has violated Title X of the Dodd-Frank Act or CFPB regulations under Title X, the Dodd-Frank Act empowers state attorneys general and state regulators to bring civil actions for the kind of cease and desist orders available to the CFPB (but not for civil penalties). If the CFPB or one or more state officials believe we have violated the foregoing laws, they could exercise their enforcement powers in ways that would have a material adverse effect on us.
We are subject to many laws and governmental regulations, and any material violations of or changes in these laws or regulations could have a material adverse effect on our financial condition and business operations.
Our financing operations are subject to regulation, supervision and licensing under various federal, state and local statutes and ordinances. Additionally, the procedures that we must follow in connection with the repossession of vehicles securing Contracts are regulated by each of the states in which we do business. The various federal, state and local statutes, regulations, and ordinances applicable to our business govern, among other things:
| • | licensing requirements; |
| • | requirements for maintenance of proper records; |
| • | payment of required fees to certain states; |
| • | maximum interest rates that may be charged on loans to finance new and used vehicles; |
| • | debt collection practices; |
| • | proper disclosure to customers regarding financing terms; |
| • | privacy regarding certain customer data; |
| • | interest rates on loans to customers; |
13
Table of Contents
| • | telephone solicitation of direct loan customers; and |
| • | collection of debts from loan customers who have filed bankruptcy. |
We believe that we maintain all material licenses and permits required for our current operations and are in substantial compliance with all applicable local, state and federal regulations. Our failure, or failure by dealers who originate the Contracts we purchase, to maintain all requisite licenses and permits, and to comply with other regulatory requirements, could result in consumers having rights of rescission and other remedies that could have a material adverse effect on our financial condition. Furthermore, any changes in applicable laws, rules and regulations, such as the passage of the Dodd-Frank Act and the creation of the CFPB, may make our compliance therewith more difficult or expensive or otherwise adversely affect our business and financial condition.
Our Chief Executive Officer holds a significant percentage of our common stock and may take actions adverse to your interests.
Peter L. Vosotas, our Chairman of the Board, President and Chief Executive Officer, owned approximately 14% of our common stock as of June 1, 2012. As a result, he may be able to influence matters requiring shareholder approval, including the election and removal of directors and approval of significant corporate transactions, such as mergers, consolidations and sales of assets. This concentration of ownership could have the effect of delaying, deferring or preventing a change in control or impeding a merger or consolidation, takeover or other business combination, which could cause the market price of our common stock to fall or prevent you from receiving a premium in such transaction.
Our stock is lightly traded, which may limit your ability to resell your shares.
The average daily trading volume of our shares on the NASDAQ Global Select Market for the fiscal year ended March 31, 2012 was approximately 31,660 shares. Thus, our common stock is thinly traded. Thinly traded stock can be more volatile than stock trading in an active public market. Factors such as our financial results, the introduction of new products and services by us or our competitors, and various factors affecting the consumer-finance industry generally may have a significant impact on the market price of our common stock. In recent years, the stock market has experienced a high level of price and volume volatility, and market prices for the stocks of many companies, including ours, have experienced wide price fluctuations that have not necessarily been related to their operating performance. Therefore, our shareholders may not be able to sell their shares at the volumes, prices, or times that they desire.
We may experience problems with our integrated computer systems or be unable to keep pace with developments in technology.
We use various technologies in our business, including telecommunication, data processing, and integrated computer systems. Technology changes rapidly. Our ability to compete successfully with other financing companies may depend on our ability to efficiently and cost-effectively implement technological changes. Moreover, to keep pace with our competitors, we may be required to invest in technological changes that do not necessarily improve our profitability.
We utilize integrated computer systems to respond to customer inquiries and to monitor the performance of our Contract and direct loan portfolios and the performance of individual customers under our Contracts and direct loans. Problems with our systems’ operations could adversely impact our ability to monitor our portfolios or collect amounts due under our Contracts and direct loans, which could have a material adverse effect on our financial condition and results of operations.
Item 1B. Unresolved Staff Comments
None.
The Company leases its Corporate Headquarters and branch office facilities. The Company’s Headquarters, located at 2454 McMullen Booth Road, Building C, in Clearwater, Florida, consist of approximately 15,000 square feet of office space at an annual rate of approximately $20.00 per square foot. The current lease relating to this space expires in March 2013.
Each of the Company’s 60 branch offices located in Alabama, Florida, Georgia, Illinois, Indiana, Kentucky, Maryland, Michigan, Missouri, North Carolina, Ohio, South Carolina, Tennessee, and Virginia consists of approximately 1,200 square feet of office space. These offices are located in office parks, shopping centers or strip malls and are occupied pursuant to leases with an initial term of one to five years at annual rates ranging from approximately $10.00 to $35.00 per square foot. The Company believes that these facilities and additional or alternate space available to it are adequate to meet its needs for the foreseeable future.
14
Table of Contents
The Company currently is not a party to any pending legal proceedings other than ordinary routine litigation incidental to its business, none of which, if decided adversely to the Company, would, in the opinion of management, have a material adverse affect on the Company’s financial condition or results of operations.
Item 4. Mine Safety Disclosures
Not Applicable.
15
Table of Contents
Item 5. Market for Registrant’s Common Equity, Related Stockholder Matters and Issuer Purchases of Equity Securities
The Company’s common stock trades on the NASDAQ Global Select Market under the symbol “NICK.”
The following table sets forth the high and low sales prices of the Company’s common stock for the fiscal years ended March 31, 2012 and 2011, respectively.
| High | Low | |||||||
| Fiscal year ended March 31, 2012 |
||||||||
| First Quarter |
$ | 13.61 | $ | 11.40 | ||||
| Second Quarter |
$ | 12.60 | $ | 9.26 | ||||
| Third Quarter |
$ | 12.92 | $ | 9.08 | ||||
| Fourth Quarter |
$ | 14.41 | $ | 12.17 | ||||
| High | Low | |||||||
| Fiscal year ended March 31, 2011 |
||||||||
| First Quarter |
$ | 9.20 | $ | 7.40 | ||||
| Second Quarter |
$ | 9.60 | $ | 7.90 | ||||
| Third Quarter |
$ | 10.60 | $ | 8.54 | ||||
| Fourth Quarter |
$ | 12.98 | $ | 10.01 | ||||
As of June 1, 2012, there were approximately 2,000 holders of record of the Company’s common stock.
The Company paid three quarterly cash dividends during the fiscal years ended March 31, 2012: a cash dividend of $0.10 per share of Common Stock on September 20, 2011; a cash dividend of $0.10 per share of Common Stock on October 20, 2011; and a cash dividend of $0.10 per share of Common Stock on March 20, 2012. Subsequent to the end of fiscal 2012, the Company’s Board of Directors declared a quarterly cash dividend of $0.10 per share of Common Stock payable on June 6, 2012. Any payments of future cash dividends and the amounts thereof will be dependent upon the Company’s earnings, financial measurements as described in its current line of credit facility, and other factors deemed relevant by the Board of Directors.
There are no Canadian foreign exchange controls or laws that would affect the remittance of dividends or other payments to the Company’s non-Canadian resident shareholders. There are no Canadian laws that restrict the export or import of capital, other than the Investment Canada Act (Canada), which requires the notification or review of certain investments by non-Canadians to establish or acquire control of a Canadian business. The Company is not a Canadian business as defined under the Investment Canada Act because it has no place of business in Canada, has no individuals employed in Canada in connection with its business, and has no assets in Canada used in carrying on its business.
Canada and the United States of America are signatories to the Canada-United States Tax Convention Act, 1984 (the “Tax Treaty”). The Tax Treaty contains provisions governing the tax treatment of interest, dividends, gains and royalties paid to or received by a person residing in the United States. The Tax Treaty also contains provisions to prevent the occurrence of double taxation, essentially by permitting the taxpayer to claim a tax credit for taxes paid in the foreign jurisdiction.
Dividends paid to the Company from its U.S. subsidiaries’ current and accumulated earnings and profits will be subject to a U.S. withholding tax of 5%. The gross dividends (i.e., before payment of the withholding tax) must be included in the Company’s net income. However, under certain circumstances, the Company may be allowed to deduct the dividends in the calculation of its Canadian taxable income. If the Company has no other foreign (i.e., non-Canadian) non-business income, no relief is available in that case to recover the withholding taxes previously paid.
16
Table of Contents
A 15% Canadian withholding tax applies to dividends paid by the Company to a U.S. shareholder that is an individual. The U.S. shareholder must include the gross amount of the dividends in his net income to be taxed at the regular rates In general, a U.S. shareholder can obtain a foreign tax credit for U.S. federal income tax purposes with respect to the Canadian withholding tax on such dividends, but the amount of such credit is subject to a limitation that depends, in part, on the amount of the shareholder’s income and losses from other sources. A U.S. shareholder that is an individual also can elect to claim a deduction (rather than a foreign tax credit) for all non-U.S. income taxes paid by the shareholder during the particular year. U.S. shareholders are urged to consult their own tax advisors regarding the U.S. federal income tax treatment of any Canadian withholding tax imposed on dividends from the Company.
Dividends paid to a corporate U.S. shareholder that owns less than 10% of the Company’s voting shares are also subject to a Canadian withholding tax of 15%.
Securities Authorized for Issuance Under Equity Compensation Plans
The following table sets forth certain information, as of March 31, 2012, with respect to compensation plans under which equity securities of the Company were authorized for issuance:
EQUITY COMPENSATION PLAN INFORMATION
| Plan Category |
Number of Securities to be Issued Upon Exercise of Outstanding Options, Warrants and Rights |
Weighted – Average Exercise Price of Outstanding Options, Warrants and Rights |
Number of Securities Remaining Available for Future Issuance Under Equity Compensation Plans (Excluding Securities Reflected in Column (a)) |
|||||||||
| (a) | (b) | (c) | ||||||||||
| Equity Compensation Plans Approved by Security Holders |
501,880 | $ | 6.36 | 313,335 | ||||||||
| Equity Compensation Plans Not Approved by Security Holders |
None | Not Applicable | None | |||||||||
|
|
|
|
|
|
|
|||||||
| TOTAL |
501,880 | $ | 6.36 | 313,335 | ||||||||
|
|
|
|
|
|
|
|||||||
17
Table of Contents
Performance Graph
Set forth below is a graph comparing the cumulative total return on the Company’s Common shares for the five-year period ended March 31, 2012, with that of an overall stock market (NASDAQ Composite) and the Company’s peer group index (Dow Jones US General Financial Index). The stock performance graph assumes that the value of the investment in each of the Company’s Common shares, the NASDAQ Composite Index and the Dow Jones US General Financial Index was $100 on April 1, 2007 and that all dividends were reinvested.
The graph displayed below is presented in accordance with SEC requirements. Shareholders are cautioned against drawing any conclusions from the data contained therein, as past results are not necessarily indicative of future performance. This graph in no way reflects the Company’s forecast of future financial performance.
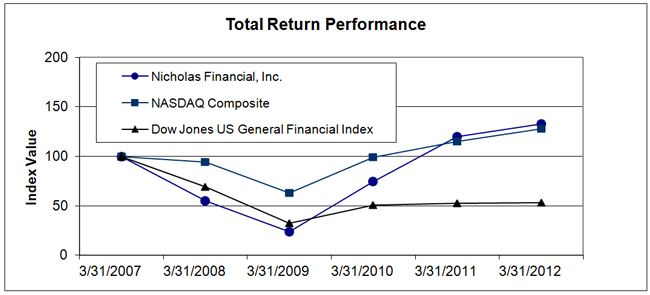
| 03/31/2007 | 03/31/2008 | 03/31/2009 | 03/31/2010 | 03/31/2011 | 03/31/2012 | |||||||||||||||||||
| Nicholas Financial, Inc. |
$ | 100.00 | $ | 55.29 | $ | 23.48 | $ | 74.62 | $ | 120.25 | $ | 132.97 | ||||||||||||
| NASDAQ Composite |
100.00 | 94.11 | 63.12 | 99.02 | 114.84 | 127.66 | ||||||||||||||||||
| Dow Jones US General Financial Index |
100.00 | 69.13 | 32.04 | 50.66 | 52.52 | 53.35 | ||||||||||||||||||
Item 6. Selected Financial Data
The following tables present selected consolidated financial data of the Company as of and for the fiscal years ended March 31, 2012, 2011, 2010, 2009 and 2008. The selected consolidated financial data have been derived from our consolidated financial statements. All historical share and per share amounts have been restated for all periods presented to reflect a 10% stock dividend paid on December 7, 2009 to shareholders of record as of the close of business on November 20, 2009.
You should read the selected consolidated financial data below in conjunction with “Item 7. Management’s Discussion and Analysis of Financial Condition and Results of Operations” and our audited consolidated financial statements and notes thereto that are included elsewhere in this Report.
18
Table of Contents
| Fiscal Year ended March 31, | ||||||||||||||||||||
| 2012 | 2011 | 2010 | 2009 | 2008 | ||||||||||||||||
| Statement of Operations Data |
||||||||||||||||||||
| Interest income on finance receivables |
$ | 68,122,532 | $ | 62,719,904 | $ | 56,403,536 | $ | 53,032,438 | $ | 50,007,510 | ||||||||||
| Sales |
44,070 | 53,622 | 68,117 | 69,933 | 75,287 | |||||||||||||||
|
|
|
|
|
|
|
|
|
|
|
|||||||||||
| 68,166,602 | 62,773,526 | 56,471,653 | 53,102,371 | 50,082,797 | ||||||||||||||||
| Interest expense |
4,891,854 | 5,599,951 | 5,169,736 | 5,384,532 | 6,310,465 | |||||||||||||||
| Provision for credit losses |
5,319 | 4,610,221 | 11,321,849 | 16,386,070 | 7,730,805 | |||||||||||||||
| Salaries and employee benefits |
17,582,967 | 16,430,763 | 14,380,695 | 13,349,523 | 12,572,039 | |||||||||||||||
| Change in fair value of interest rate swaps |
— | (495,136 | ) | (1,034,869 | ) | 1,530,005 | — | |||||||||||||
| Other expenses |
9,524,361 | 9,280,923 | 8,984,047 | 8,900,260 | 7,903,660 | |||||||||||||||
|
|
|
|
|
|
|
|
|
|
|
|||||||||||
| 32,004,501 | 35,426,722 | 38,821,458 | 45,550,390 | 34,516,969 | ||||||||||||||||
|
|
|
|
|
|
|
|
|
|
|
|||||||||||
| Operating income before income taxes |
36,162,101 | 27,346,804 | 17,650,195 | 7,551,981 | 15,565,828 | |||||||||||||||
| Income tax expense |
13,931,809 | 10,541,620 | 6,785,634 | 2,834,418 | 5,893,652 | |||||||||||||||
|
|
|
|
|
|
|
|
|
|
|
|||||||||||
| Net income |
$ | 22,230,292 | $ | 16,805,184 | $ | 10,864,561 | $ | 4,717,563 | $ | 9,672,176 | ||||||||||
|
|
|
|
|
|
|
|
|
|
|
|||||||||||
| Earnings per share – basic: |
$ | 1.89 | $ | 1.45 | $ | 0.95 | $ | 0.42 | $ | 0.88 | ||||||||||
|
|
|
|
|
|
|
|
|
|
|
|||||||||||
| Weighted average shares outstanding |
11,747,160 | 11,607,341 | 11,470,318 | 11,273,811 | 11,002,756 | |||||||||||||||
|
|
|
|
|
|
|
|
|
|
|
|||||||||||
| Earnings per share – diluted: |
$ | 1.85 | $ | 1.41 | $ | 0.93 | $ | 0.41 | $ | 0.85 | ||||||||||
|
|
|
|
|
|
|
|
|
|
|
|||||||||||
| Weighted average shares outstanding |
12,033,131 | 11,893,518 | 11,689,123 | 11,440,313 | 11,328,547 | |||||||||||||||
|
|
|
|
|
|
|
|
|
|
|
|||||||||||
| As of and for the Fiscal Year ended March 31, | ||||||||||||||||||||
| 2012 | 2011 | 2010 | 2009 | 2008 | ||||||||||||||||
| Balance Sheet Data |
||||||||||||||||||||
| Total assets |
$ | 257,236,034 | $ | 243,643,125 | $ | 214,136,073 | $ | 197,782,175 | $ | 189,837,825 | ||||||||||
| Finance receivables, net |
242,348,521 | 230,163,854 | 202,439,754 | 186,694,369 | 179,043,344 | |||||||||||||||
| Line of credit |
112,000,000 | 118,000,000 | 107,274,971 | 102,030,195 | 99,937,198 | |||||||||||||||
| Shareholders’ equity |
135,939,051 | 115,213,468 | 97,437,283 | 85,017,713 | 78,576,439 | |||||||||||||||
| Operating Data |
||||||||||||||||||||
| Return on average assets |
8.87 | % | 7.34 | % | 5.28 | % | 2.43 | % | 5.33 | % | ||||||||||
| Return on average equity |
17.70 | % | 15.81 | % | 11.91 | % | 5.77 | % | 13.04 | % | ||||||||||
| Gross portfolio yield (1) |
24.96 | % | 24.99 | % | 25.23 | % | 25.57 | % | 26.18 | % | ||||||||||
| Pre-tax yield (1) |
13.32 | % | 10.77 | % | 7.51 | % | 4.50 | % | 8.22 | % | ||||||||||
| Total delinquencies over 30 days |
3.01 | % | 2.21 | % | 3.16 | % | 4.20 | % | 3.45 | % | ||||||||||
| Write-off to liquidation (1) |
5.66 | % | 6.17 | % | 9.87 | % | 12.39 | % | 9.08 | % | ||||||||||
| Net charge-off percentage (1) |
4.59 | % | 4.65 | % | 7.37 | % | 9.93 | % | 8.24 | % | ||||||||||
| Automobile Finance Data & Direct Loan Origination |
||||||||||||||||||||
| Contracts purchased/direct loans originated |
$ | 152,315,679 | $ | 151,874,846 | $ | 125,315,736 | $ | 117,653,858 | $ | 126,661,703 | ||||||||||
| Average discount |
8.47 | % | 8.78 | % | 9.11 | % | 9.14 | % | 8.32 | % | ||||||||||
| Weighted average contractual rate (1) |
23.93 | % | 23.66 | % | 23.62 | % | 24.17 | % | 24.32 | % | ||||||||||
| Number of branch locations |
60 | 56 | 52 | 48 | 47 | |||||||||||||||
| (1) | See the definitions set forth in the notes to the Portfolio Summary table on pages 20 and 21under “Item 7. Management’s Discussion and Analysis of Financial Condition and Results of Operations—Overview.” |
19
Table of Contents
Item 7. Management’s Discussion and Analysis of Financial Condition and Results of Operations
Overview
Nicholas Financial-Canada is a Canadian holding company incorporated under the laws of British Columbia in 1986. Nicholas Financial-Canada conducts its business activities through two wholly-owned Florida corporations: Nicholas Financial, which purchases and services Contracts, makes direct loans and sells consumer-finance related products; and NDS, which supports and updates certain computer application software. Nicholas Financial accounted for more than 99% of the Company’s consolidated revenue for each of the fiscal years ended March 31, 2012, 2011, and 2010. Nicholas Financial-Canada, Nicholas Financial and Nicholas Data Services are collectively referred to herein as the “Company”.
The Company’s consolidated revenues increased for the fiscal year ended March 31, 2012 to $68.2 million as compared to $62.8 million and $56.5 million for the fiscal years ended March 31, 2011 and 2010, respectively. The Company’s consolidated net income increased for the fiscal year ended March 31, 2012 to $22.2 million as compared to $16.8 million and $10.9 million for the fiscal years ended March 31, 2011 and 2010, respectively. The Company’s earnings were positively impacted by a decrease in the net charge-off percentage to 4.59% for the fiscal year ended March 31, 2012 as compared to 4.65% for the fiscal year ended March 31, 2011. The Company believes the decrease in the charge-off percentage was primarily attributable to the following factors: a temporary reduction in competition, the increased market value of auctioned cars, the continued application of stricter underwriting guidelines, and the continued allocation of additional resources focused on collections. The Consumer Assistance to Recycle and Save Act of 2009 (“CARS”) established a voluntary vehicle trade-in and purchase program pursuant to which owners of vehicles were eligible to receive a credit of either $3,500 or $4,500 in connection with the purchase of a new vehicle from a participating dealer, depending upon how the trade-in and acquired vehicles fit within the program criteria, including the amount of improved fuel efficiency. The program reduced the supply of used cars in the market, resulting in increases in the market value of used cars in subsequent years, especially for older used cars such as those financed by Contracts held by the Company. The Company’s underwriting guidelines were changed in 2009 to increase the minimum income required by any applicant before loan approval can even be contemplated. The Company also reduced the maximum advance to any dealer, raised the minimum ENH beacon score, and reduced the maximum amount that can be financed.
During the latter part of fiscal year 2012 the Company began experiencing increased competition which has continued into the first quarter of fiscal 2013. Historically, when competition has increased, the Company has experienced higher losses, decreased contract origination and as a result reduced profits. While it is difficult to predict the level of competition long-term, the Company believes the current competitive environment will be prevalent throughout fiscal 2013.
| Portfolio Summary | Fiscal Year ended March 31, | |||||||||||
| 2012 | 2011 | 2010 | ||||||||||
| Average finance receivables, net of unearned interest (1) |
$ | 272,979,496 | $ | 250,962,519 | $ | 223,547,537 | ||||||
|
|
|
|
|
|
|
|||||||
| Average indebtedness (2) |
$ | 115,688,980 | $ | 113,833,641 | $ | 106,985,830 | ||||||
|
|
|
|
|
|
|
|||||||
| Interest and fee income on finance receivables (3) |
$ | 68,122,532 | $ | 62,719,904 | $ | 56,403,536 | ||||||
| Interest expense |
$ | 4,891,854 | $ | 5,599,951 | $ | 5,169,736 | ||||||
|
|
|
|
|
|
|
|||||||
| Net interest and fee income on finance receivables |
$ | 63,230,678 | $ | 57,119,953 | $ | 51,223,800 | ||||||
|
|
|
|
|
|
|
|||||||
| Weighted average contractual rate (4) |
23.93 | % | 23.66 | % | 23.62 | % | ||||||
|
|
|
|
|
|
|
|||||||
| Average cost of borrowed funds (2) |
4.23 | % | 4.92 | % | 4.83 | % | ||||||
|
|
|
|
|
|
|
|||||||
| Gross portfolio yield (5) |
24.96 | % | 24.99 | % | 25.23 | % | ||||||
| Interest expense as a percentage of average finance receivables, net of unearned interest |
1.79 | % | 2.23 | % | 2.31 | % | ||||||
| Provision for credit losses as a percentage of average finance receivables, net of unearned interest |
0.00 | % | 1.84 | % | 5.06 | % | ||||||
|
|
|
|
|
|
|
|||||||
| Net portfolio yield (5) |
23.17 | % | 20.92 | % | 17.86 | % | ||||||
| Marketing, salaries, employee benefits, depreciation and administrative expenses as a percentage of average finance receivables, net of unearned interest (6) |
9.85 | % | 10.15 | % | 10.35 | % | ||||||
|
|
|
|
|
|
|
|||||||
| Pre-tax yield as a percentage of average finance receivables, net of unearned interest (7) |
13.32 | % | 10.77 | % | 7.51 | % | ||||||
|
|
|
|
|
|
|
|||||||
| Write-off to liquidation (8) |
5.66 | % | 6.17 | % | 9.87 | % | ||||||
| Net charge-off percentage (9) |
4.59 | % | 4.65 | % | 7.37 | % | ||||||
20
Table of Contents
| (1) | Average finance receivables, net of unearned interest, represents the average of gross finance receivables, less unearned interest throughout the period. |
| (2) | Average indebtedness represents the average outstanding borrowings under the Company’s line of credit facility. Average cost of borrowed funds represents interest expense as a percentage of average indebtedness. |
| (3) | Interest and fee income on finance receivables does not include revenue generated by NDS. |
| (4) | Weighted average contractual rate represents the weighted average annual percentage rate (“APR”) of all Contracts purchased and direct loans originated during the period. |
| (5) | Gross portfolio yield represents interest and fee income on finance receivables as a percentage of average finance receivables, net of unearned interest. Net portfolio yield represents interest and fee income on finance receivables minus (a) interest expense and (b) the provision for credit losses as a percentage of average finance receivables, net of unearned interest. |
| (6) | Administrative expenses included in this calculation are net of administrative expenses associated with NDS which approximated $220,000, $216,000, and $213,000 during the fiscal years ended 2012, 2011 and 2010, respectively. |
| (7) | Pre-tax yield represents net portfolio yield minus operating expenses as a percentage of average finance receivables, net of unearned interest. |
| (8) | Write-off to liquidation percentage is defined as net charge-offs divided by liquidation. Liquidation is defined as beginning receivable balance plus current period purchases minus voids and refinances minus ending receivable balance. |
| (9) | Net charge-off percentage represents net charge-offs divided by average finance receivables, net of unearned interest, outstanding during the period. |
Critical Accounting Policy
The Company’s critical accounting policy relates to the allowance for credit losses. It is based on management’s opinion of an amount that is adequate to absorb losses in the existing portfolio. The allowance for credit losses is established through allocations of dealer discounts and a provision for loss based on management’s evaluation of the risk inherent in the loan portfolio, the composition of the portfolio, specific impaired loans and current economic conditions. Such evaluation considers, among other matters, the estimated net realizable value or the fair value of the underlying collateral, economic conditions, historical loan loss experience, management’s estimate of probable credit losses and other factors that warrant recognition in providing for an adequate credit loss allowance.
Because of the nature of the customers under the Company’s Contracts and its direct loan program, the Company considers the establishment of adequate reserves for credit losses to be imperative. The Company segregates its Contracts into static pools for purposes of establishing reserves for losses. All Contracts purchased by a branch during a fiscal quarter comprise a static pool. The Company pools Contracts according to branch location because the branches purchase Contracts in different geographic markets. This method of pooling by branch and quarter allows the Company to evaluate the different markets where the branches operate. The pools also allow the Company to evaluate the different levels of customer income, stability and credit history, and the types of vehicles purchased in each market. Each such static pool consists of the Contracts purchased by a branch office during a fiscal quarter.
Contracts are purchased from many different dealers and are all purchased on an individual Contract by Contract basis. Individual Contract pricing is determined by the automobile dealerships and is generally the lesser of the applicable state maximum interest rate, if any, or the maximum interest rate which the customer will accept. In certain markets, competitive forces will drive down Contract rates from the maximum rate to a level where an individual competitor is willing to buy an individual Contract. The Company only buys Contracts on an individual basis and never purchases Contracts in batches, although the Company may consider portfolio acquisitions as part of its growth strategy. See “Item 1. Business – Growth Strategy.”
The Company has detailed underwriting guidelines it utilizes to determine which Contracts to purchase. These guidelines are specific and are designed to cause all of the Contracts that the Company purchases to have common risk characteristics. The Company utilizes its District Managers to evaluate their respective branch locations for adherence to these underwriting guidelines. The Company also utilizes an internal audit department to assure adherence to its underwriting guidelines. The Company utilizes the branch model, which allows for Contract purchasing to be done on the branch level. Each Branch Manager may interpret the guidelines differently, and as a result, the common risk characteristics tend to be the same on an individual branch level but not necessarily compared to another branch.
A dealer discount represents the difference between the finance receivable, net of unearned interest, of a Contract, and the amount of money the Company actually pays for the Contract. The discount negotiated by the Company is a function of the credit quality of the customer, the wholesale value of the vehicle, and competition in any given market. The automotive dealer accepts these terms by executing a dealer agreement with the Company. The entire amount of discount is related to credit quality and is considered to be part of the allowance for credit losses. The Company utilizes a static pool approach to track portfolio performance. A static pool retains an amount equal to 100% of the discount as an allowance for credit losses.
21
Table of Contents
Subsequent to the purchase, if the reserve for credit losses is determined to be inadequate for a static pool which is not fully liquidated, then an additional charge to income through the provision is used to reestablish adequate reserves. If a static pool is fully liquidated and has any remaining reserves, the excess discounts are immediately recognized into income and the excess provision is immediately reversed during the period. For static pools not fully liquidated that are determined to have excess discounts, such excess amounts are accreted into income over the remaining life of the static pool. For static pools not fully liquidated that are deemed to have excess reserves, such excess amounts are reversed against provision for credit losses during the period.
In analyzing a static pool, the Company considers the performance of prior static pools originated by the branch office, the performance of prior Contracts purchased from the dealers whose Contracts are included in the current static pool, the credit rating of the customers under the Contracts in the static pool, and current market and economic conditions. Each static pool is analyzed monthly to determine if the loss reserves are adequate, and adjustments are made if they are determined to be necessary.
Fiscal 2012 Compared to Fiscal 2011
Interest and Fee Income on Finance Receivables
Interest income on finance receivables, predominantly finance charge income, increased 9% to $68.1 million in fiscal 2012 from $62.7 million in fiscal 2011. The average finance receivables, net of unearned interest, totaled $273.0 million for the fiscal year ended March 31, 2012, an increase of 9% from $251.0 million for the fiscal year ended March 31, 2011. The primary reason average finance receivables, net of unearned interest, increased was the development of new markets in Missouri, South Carolina, Ohio, and Alabama. The gross finance receivable balance increased 4% to $389.0 million at March 31, 2012 from $373.0 million at March 31, 2011. The primary reason interest income increased was the increase in the outstanding loan portfolio. The gross portfolio yield decreased to 24.96% for the fiscal year ended March 31, 2012 from 24.99% for the fiscal year ended March 31, 2011. The net portfolio yield increased to 23.17% for the fiscal year ended March 31, 2012 from 20.92% for the fiscal year ended March 31, 2011. The gross portfolio yield remained relatively flat primarily due to an unchanged weighted APR earned on finance receivables. The net portfolio yield increased primarily due to the decrease in provisions for credit losses. The Company has experienced favorable variances between projected write-offs and actual write-offs on certain pools which has resulted in an increase in expected future cash flows. Accordingly, the amount of additional provision necessary to maintain an adequate allowance to absorb losses in the existing portfolio was less than the provision in fiscal 2011. As a result, the provision for credit losses was less than write offs during the current periods. More specifically, during the 4th quarter of fiscal 2012 actual losses were considerably lower than expected along with auction prices of repossessed vehicles at historically high levels.
Marketing, Salaries, Employee Benefits, Depreciation, and Administrative Expenses
Marketing, salaries, employee benefits, depreciation, and administrative expenses increased to $27.1 million for the fiscal year ended March 31, 2012 from $25.7 million for the fiscal year ended March 31, 2011. This increase of 5% was primarily attributable to additional staffing at existing branches. The Company opened additional branches and increased average headcount to 293 for the fiscal year ended March 31, 2012 from 276 for the fiscal year ended March 31, 2011. Marketing, salaries, employee benefits, depreciation, and administrative expenses as a percentage of average finance receivables, net of unearned interest, decreased to 9.85% for the fiscal year ended March 31, 2012 from 10.15% for the fiscal year ended March 31, 2011.
Interest Expense
Interest expense decreased to $4.9 million for the fiscal year ended March 31, 2012 as compared to $5.6 million for the fiscal year ended March 31, 2011. The following table summarizes the Company’s average cost of borrowed funds for the fiscal years ended March 31:
| 2012 | 2011 | |||||||
| Variable interest under the line of credit facility |
0.48 | % | 0.53 | % | ||||
| Settlements under interest rate swap agreements |
0.00 | % | 0.70 | % | ||||
| Credit spread under the line of credit facility |
3.75 | % | 3.69 | % | ||||
|
|
|
|
|
|||||
| Average cost of borrowed funds |
4.23 | % | 4.92 | % | ||||
|
|
|
|
|
|||||
The primary reason that the Company’s average cost of funds decreased for the fiscal year ended March 31, 2012 as compared to the preceding fiscal year was the absence of costs associated with settlements under interest rate swap agreements during, such period, which costs were incurred during fiscal year ended March 31, 2011.
On January 12, 2010, the Company executed a new line of credit facility, or Line. Under the new Line, the Company’s credit facility pricing changed from 162.5 basis points above 30-day LIBOR to 300 basis points above 30-day LIBOR, with a 1% floor on LIBOR. The average cost of borrowings in future periods will continue to be impacted by such pricing increases. Effective September 1, 2011, the size of the Line was increased to $150.0 million from $140.0 million and the maturity date was extended to November 30, 2013. For a further discussion regarding the Company’s line of credit, see “— Liquidity and Capital Resources” below and note 5 (“Line of Credit”) to our audited consolidated financial statements included elsewhere in this Report.
22
Table of Contents
The weighted average notional amount of interest rate swaps was $23.3 million at a weighted average fixed rate of 3.80% during the fiscal year ended March 31, 2011. For a further discussion regarding the effect of our interest rate swap agreements, see note 6 (“Interest Rate Swap Agreements”) to our audited consolidated financial statements included elsewhere in this Report.
Analysis of Credit Losses
As of March 31, 2012, the Company had 1,249 active static pools. The average pool upon inception consisted of 65 Contracts with aggregate finance receivables, net of unearned interest, of approximately $640,000.
The following table sets forth a reconciliation of the changes in the allowance for credit losses on Contracts for the fiscal years ended March 31:
| 2012 | 2011 | |||||||
| Balance at beginning of year |
$ | 35,895,449 | $ | 30,408,578 | ||||
| Discounts acquired on new volume |
12,415,896 | 12,919,492 | ||||||
| Current year provision |
(176,745 | ) | 4,484,284 | |||||
| Losses absorbed |
(14,971,422 | ) | (14,036,888 | ) | ||||
| Recoveries |
2,405,750 | 2,255,683 | ||||||
| Discounts accreted |
(73,244 | ) | (135,700 | ) | ||||
|
|
|
|
|
|||||
| Balance at end of year |
$ | 35,495,684 | $ | 35,895,449 | ||||
|
|
|
|
|
|||||
The following table sets forth a reconciliation of the changes in the allowance for credit losses on direct loans for the fiscal years ended March 31:
| 2012 | 2011 | |||||||
| Balance at beginning of year |
$ | 378,418 | $ | 382,869 | ||||
| Current year provision |
182,062 | 125,937 | ||||||
| Losses absorbed |
(93,041 | ) | (173,970 | ) | ||||
| Recoveries |
24,745 | 43,582 | ||||||
|
|
|
|
|
|||||
| Balance at end of year |
$ | 492,184 | $ | 378,418 | ||||
|
|
|
|
|
|||||
The average dealer discount associated with new volume for the fiscal years ended March 31, 2012 and 2011 was 8.47% and 8.78%, respectively.
The provision for credit losses decreased to $5,000 for the fiscal year ended March 31, 2012 from $4.6 million for the fiscal year ended March 31, 2011, largely due to the fact that net charge offs during fiscal 2012 were less than the expected charge-offs previously contemplated in the allowance for loan losses. Accordingly, the amount of additional provision necessary to maintain an adequate allowance to absorb losses in the existing portfolio was less than the provision for prior periods.
The Company’s losses as a percentage of liquidation decreased to 5.66% for the fiscal year ended March 31, 2012 as compared to 6.17% for the fiscal year ended March 31, 2011. The Company experienced improvements in the quality of its Contracts in fiscal 2012 as compared to fiscal 2011 due to an increase in auction prices, and an increased focus on collections. Increased auction proceeds from repossessed vehicles reduced the amount of the write-off which, in turn, lowered the write-off to liquidation percentage. During the fiscal years ended March 31, 2012, 2011, and 2010, auction proceeds from the sale of repossessed vehicles averaged approximately 57%, 52%, and 45%, respectively, of the related principal balance.
Recoveries as a percentage of charge-offs were approximately 16.80% and 17.90% for the fiscal years ended March 31, 2012 and 2011, respectively. Historically, recoveries as a percentage of charge-offs have fluctuated from period to period, and the Company does not attribute this decrease to any particular change in operational strategy or economic event.
The delinquency percentage for Contracts more than thirty days past due as of March 31, 2012 increased to 3.01% from 2.21% as of March 31, 2011. The delinquency percentage for direct loans more than thirty days past due as of March 31, 2012 decreased to 1.09% from 1.13% as of March 31, 2011. The delinquency percentage increases reflect portfolio weakness that generally manifests itself in increased future losses. The Company utilizes a static pool approach to analyzing portfolio performance and looks at specific static pool performance and recent trends as leading indicators of the future performance of its portfolio.
23
Table of Contents
The Company considers the following factors to assist in determining the appropriate loss reserve levels: unemployment rates; competition; the number of bankruptcy filings; the results of internal branch audits; consumer sentiment; consumer spending; economic growth (i.e., changes in GDP); the condition of the housing sector; and other leading economic indicators. The Company continues to evaluate reserve levels on a pool-by-pool basis during each reporting period. While unemployment rates have stabilized, somewhat, they remain elevated, which will make it difficult for additional improvement in loss rates. The longer term outlook for portfolio performance will depend on overall economic conditions, the unemployment rate, the rationale or irrational behavior of the Company’s competitors, and the Company’s ability to monitor, manage and implement its underwriting philosophy in additional geographic areas as it strives to continue its expansion.
Income Taxes
The provision for income taxes increased to approximately $13.9 million in fiscal year 2012 from approximately $10.5 million in fiscal year 2011 primarily as a result of higher pretax income. The Company’s effective tax rate decreased to 38.53% in fiscal 2012 from 38.54% in fiscal 2011. The primary reason for this increase was an increase in the amount of taxable income subject to higher graduated federal income tax rates.
Fiscal 2011 Compared to Fiscal 2010
Interest and Fee Income on Finance Receivables
Interest income on finance receivables, predominantly finance charge income, increased 11% to $62.7 million in fiscal 2011 from $56.4 million in fiscal 2010. The average finance receivables, net of unearned interest, totaled $251.0 million for the fiscal year ended March 31, 2011, an increase of 12% from $223.5 million for the fiscal year ended March 31, 2010. The primary reason average finance receivables, net of unearned interest increased was the increase in the receivable base of several existing branches and the development of new markets in Georgia, Indiana, Illinois and Missouri. The gross finance receivable balance increased 15% to $373.0 million at March 31, 2011 from $325.4 million at March 31, 2010. The primary reason interest income increased was the increase in the outstanding loan portfolio. The gross portfolio yield decreased to 24.99% for the fiscal year ended March 31, 2011 from 25.23% for the fiscal year ended March 31, 2010. The net portfolio yield increased to 20.92% for the fiscal year ended March 31, 2011 from 17.86% for the fiscal year ended March 31, 2010. The gross portfolio yield decreased due to a lower weighted APR on contracts purchased during fiscal year 2011. The net portfolio yield increased primarily due to the fiscal year over fiscal year decrease in provisions for credit losses.
Marketing, Salaries, Employee Benefits, Depreciation, and Administrative Expenses
Marketing, salaries, employee benefits, depreciation, and administrative expenses increased to $25.7 million for the fiscal year ended March 31, 2011 from $23.3 million for the fiscal year ended March 31, 2010. This increase of 10% was primarily attributable to additional staffing at existing branches. Marketing, salaries, employee benefits, depreciation, and administrative expenses as a percentage of average finance receivables, net of unearned interest, decreased to 10.15% for the fiscal year ended March 31, 2011 from 10.35% for the fiscal year ended March 31, 2010.
Interest Expense
Interest expense increased to $5.6 million for the fiscal year ended March 31, 2011 as compared to $5.2 million for the fiscal year ended March 31, 2010. The following table summarizes the Company’s average cost of borrowed funds for the fiscal years ended March 31:
| 2011 | 2010 | |||||||
| Variable interest under the line of credit facility |
0.53 | % | 0.41 | % | ||||
| Settlements under interest rate swap agreements |
0.70 | % | 2.32 | % | ||||
| Credit spread under the line of credit facility |
3.69 | % | 2.10 | % | ||||
|
|
|
|
|
|||||
| Average cost of borrowed funds |
4.92 | % | 4.83 | % | ||||
|
|
|
|
|
|||||
The primary reason that the Company’s average cost of funds increased was an increase in pricing under its line of credit facility, mainly offset by the effects of the Company’s interest rate swap agreements.
On January 12, 2010, the Company executed a new Line. Under the new Line, the Company’s credit facility pricing changed from 162.5 basis points above 30-day LIBOR to 300 basis points above 30-day LIBOR, with a 1% floor on LIBOR. The average cost of borrowings in future periods will continue to be impacted by such pricing increases. For a further discussion regarding the Company’s line of credit, see “— Liquidity and Capital Resources” below and note 5 (“Line of Credit”) to our audited consolidated financial statements included elsewhere in this Report.
24
Table of Contents
The weighted average notional amount of interest rate swaps was $23.3 million at a weighted average fixed rate of 3.80% during the fiscal year ended March 31, 2011 as compared to $67.8 million at 3.95% for the fiscal year ended March 31, 2010. For a further discussion regarding the effect of our interest rate swap agreements, see note 6 (“Interest Rate Swap Agreements”) to our audited consolidated financial statements included elsewhere in this Report.
Analysis of Credit Losses
As of March 31, 2011, the Company had 1,147 active static pools. The average pool upon inception consisted of 63 Contracts with aggregate finance receivables, net of unearned interest, of approximately $610,000.
The following table sets forth a reconciliation of the changes in the allowance for credit losses on Contracts for the fiscal years ended March 31:
| 2011 | 2010 | |||||||
| Balance at beginning of year |
$ | 30,408,578 | $ | 24,926,076 | ||||
| Discounts acquired on new volume |
12,919,492 | 11,087,231 | ||||||
| Current year provision |
4,484,284 | 11,189,432 | ||||||
| Losses absorbed |
(14,036,888 | ) | (18,404,659 | ) | ||||
| Recoveries |
2,255,683 | 1,962,496 | ||||||
| Discounts accreted |
(135,700 | ) | (351,998 | ) | ||||
|
|
|
|
|
|||||
| Balance at end of year |
$ | 35,895,449 | $ | 30,408,578 | ||||
|
|
|
|
|
|||||
The following table sets forth a reconciliation of the changes in the allowance for credit losses on direct loans for the fiscal years ended March 31:
| 2011 | 2010 | |||||||
| Balance at beginning of year |
$ | 382,869 | $ | 513,067 | ||||
| Current year provision |
125,937 | 132,417 | ||||||
| Losses absorbed |
(173,970 | ) | (324,521 | ) | ||||
| Recoveries |
43,582 | 61,906 | ||||||
|
|
|
|
|
|||||
| Balance at end of year |
$ | 378,418 | $ | 382,869 | ||||
|
|
|
|
|
|||||
The average dealer discount associated with new volume for the fiscal years ended March 31, 2011 and 2010 was 8.78% and 9.11%, respectively.
The provision for credit losses decreased to $4.6 million for the fiscal year ended March 31, 2011 from $11.3 million for the fiscal year ended March 31, 2010, largely due to a decrease in the net charge-off rate to 4.65% for the fiscal year ended March 31, 2011 as compared to 7.37% for the fiscal year ended March 31, 2010.
The Company’s losses as a percentage of liquidation decreased to 6.17% for the fiscal year ended March 31, 2011 as compared to 9.87% for the fiscal year ended March 31, 2010. The Company experienced improvements in the quality of its Contracts due to an increase in auction prices, reduced competition, and an increased focus on collections. Increased auction proceeds from repossessed vehicles reduce the amount of the write-off, which, in turn, lowered the write-off to liquidation percentage. During the fiscal years ended March 31, 2011, 2010, and 2009, auction proceeds from the sale of repossessed vehicles averaged approximately 52%, 45%, and 40%, respectively, of the related principal balance.
Recoveries as a percentage of charge-offs were approximately 17.90% and 12.02% for the fiscal years ended March 31, 2011 and 2010, respectively. Historically, recoveries as a percentage of charge-offs have fluctuated from period to period, and the Company does not attribute this increase to any particular change in operational strategy or economic event.
The delinquency percentage for Contracts more than thirty days past due as of March 31, 2011 decreased to 2.21% from 3.16% as of March 31, 2010. The delinquency percentage for direct loans more than thirty days past due as of March 31, 2011 decreased to 1.13% from 3.06% as of March 31, 2010. The delinquency percentage decreases were attributable to the continued allocation of additional resources focused on collections, and the continued application of stricter underwriting guidelines. The Company utilizes a static pool approach to analyzing portfolio performance and looks at specific static pool performance and recent trends as leading indicators of the future performance of its portfolio.
25
Table of Contents
The Company considers the following factors to assist in determining the appropriate loss reserve levels: unemployment rates; competition; the number of bankruptcy filings; the results of internal branch audits; consumer sentiment; consumer spending; economic growth (i.e., changes in GDP); the condition of the housing sector; and other leading economic indicators. The Company continues to evaluate reserve levels on a pool-by-pool basis during each reporting period. While unemployment rates have stabilized, they remain elevated, which will make it difficult for additional improvement in loss rates. The longer term outlook for portfolio performance will depend on overall economic conditions, the unemployment rate, the rationale or irrational behavior of the Company’s competitors, and the Company’s ability to monitor, manage and implement its underwriting philosophy in additional geographic areas as it strives to continue its expansion.
Income Taxes
The provision for income taxes increased to approximately $10.5 million in fiscal year 2011 from approximately $6.8 million in fiscal year 2010 primarily as a result of higher pretax income. The Company’s effective tax rate increased to 38.54% in fiscal 2011 from 38.45% in fiscal 2010. The primary reason for this increase was an increase in the amount of taxable income subject to higher graduated federal income tax rates.
26
Table of Contents
Liquidity and Capital Resources
The Company’s cash flows are summarized as follows:
| Fiscal Year ended March 31, | ||||||||||||
| 2012 | 2011 | 2010 | ||||||||||
| Cash provided by (used in): |
||||||||||||
| Operations |
$ | 21,874,879 | $ | 21,357,624 | $ | 21,325,918 | ||||||
| Investing activities - (primarily purchases of Contracts) |
(12,756,214 | ) | (32,670,442 | ) | (27,277,523 | ) | ||||||
| Financing activities |
(8,333,151 | ) | 11,796,464 | 5,752,924 | ||||||||
|
|
|
|
|
|
|
|||||||
| Net (decrease) increase in cash |
$ | 785,514 | $ | 483,646 | $ | (198,681 | ) | |||||
|
|
|
|
|
|
|
|||||||
The Company’s primary use of working capital during the fiscal year ended March 31, 2012 was the funding of purchases of Contracts which purchases are financed substantially through borrowings under the Company’s Line. On September 1, 2011, the Company increased the size of the Line and extended the maturity date to November 30, 2013. The Line is secured by all of the assets of the Company. The Company may borrow up to $150.0 million under the Line. Borrowings under the Line may be made under various LIBOR pricing options (but typically 30-day LIBOR) plus 300 basis points with a 1% floor on LIBOR. As of March 31, 2012, the amount outstanding under the Line was approximately $112.0 million and the amount available under the Line was approximately $38.0 million.
The Company will continue to depend on the availability of the Line, together with cash from operations, to finance future operations. Amounts outstanding under the Line decreased by $6.0 million as of March 31, 2012 as compared to March 31, 2011 and increased by approximately $10.7 million as of March 31, 2011 as compared to March 31, 2010. The decrease in borrowings under the Line as of the end of fiscal 2012 resulted primarily from the fact that cash received from operations exceeded cash needed to fund new Contracts. The amount of debt the Company incurs from time to time under these financing mechanisms depends on the Company’s need for cash and ability to borrow under the terms of the Line. The Company believes that borrowings available under the Line as well as cash flow from operations will be sufficient to meet its short-term funding needs.
The Line requires compliance with certain debt covenants including financial ratios, asset quality and other performance tests. The Company is currently in compliance with all of its debt covenants but, during the current economic slowdown, a breach of one or more of these covenants could occur prior to the maturity date of the Line, which is November 30, 2013. The Company’s consortium of lenders could place the Company in default if certain covenants were breached and take one or more of the following actions: increase the Company’s borrowing costs; restrict the Company’s ability to obtain additional borrowings under the Line; accelerate all amounts outstanding under the Line; or enforce its interests against collateral securing the Line. Although the Company believes that its lenders would continue to allow it to operate in the event of a condition of default, no assurances can be given in this regard.
During the fiscal year ended March 31, 2012, three quarterly dividends were declared and paid. On August 30, 2011, the Company’s Board of Directors declared a quarterly cash dividend of $0.10 per share of common stock payable on September 20, 2011. On October 27, 2011, the Company’s Board of Directors declared a quarterly cash dividend of $0.10 per share of common stock payable on December 20, 2011. On January 31, 2012, the Company’s Board of Directors declared a quarterly cash dividend of $0.10 per share of common stock payable on March 20, 2012. Subsequent to the end of fiscal 2012, the Board of Directors declared a quarterly cash dividend of $0.10 per share of common stock payable on June 6, 2012. The Company intends to continue to pay quarterly cash dividends for the foreseeable future, provided its future earnings meet expectations. Any payment of future cash dividends and the amounts thereof will be dependent upon the Company’s earnings, financial and other covenants under the Line, and other factors deemed relevant by the Company’s Board of Directors.
Impact of Inflation
The Company is affected by inflation primarily through increased operating costs and expenses including increases in interest rates. Inflationary pressures on operating costs and expenses historically have been largely offset by the Company’s continued emphasis on stringent operating and cost controls, although no assurances can be given regarding the Company’s ability to offset the effects of inflation in the future.
27
Table of Contents
Contractual Obligations
The following table summarizes the Company’s material obligations as of March 31, 2012.
| Payments Due by Period | ||||||||||||||||||||
| Total | Less than 1 year |
1 to 3 years |
3 to 5 years |
More than 5 years |
||||||||||||||||
| Operating leases |
$ | 3,154,144 | $ | 1,701,149 | $ | 1,401,725 | $ | 51,270 | $ | — | ||||||||||
| Line of credit1 |
112,000,000 | — | 112,000,000 | — | — | |||||||||||||||
| Interest on line of credit1 |
7,896,000 | 4,737,600 | 3,158,400 | — | — | |||||||||||||||
|
|
|
|
|
|
|
|
|
|
|
|||||||||||
| Total |
$ | 123,050,144 | $ | 6,438,749 | $ | 116,560,125 | $ | 51,270 | $ | — | ||||||||||
|
|
|
|
|
|
|
|
|
|
|
|||||||||||
| 1 | The Company’s current Line matures on November 30, 2013. Interest on outstanding borrowings under the Line as of March 31, 2012 is based on an effective interest rate of 4.23%. The effective interest rate used in the above table does not contemplate the possibility of entering into interest rate swap agreements in the future. |
Item 7A. Quantitative and Qualitative Disclosures About Market Risk
Market risks relating to the Company’s operations result primarily from changes in interest rates. The Company does not engage in speculative or leveraged transactions, nor does it hold or issue financial instruments for trading purposes.
Interest Rate Risk
Management seeks to minimize the Company’s cost of borrowing and may do so through an appropriate mix of fixed and floating rate debt. Derivative financial instruments, such as interest rate swap agreements, historically were used, and may be used again in the future, for the purpose of managing fluctuating interest rate exposures that exist from ongoing business operations. The Company has not used, and will not use, interest rate swaps for speculative purposes. A hypothetical 1% change in the interest rate applicable to the borrowings outstanding at fiscal year end 2012 would result in an increase or decrease in interest expense of $1,110,000 per year before income taxes, assuming the same level of borrowings.
Item 8. Financial Statements and Supplementary Data
The following financial statements are filed as part of this Report (see pages 29-47)
| 29 | ||||
| Audited Consolidated Financial Statements |
||||
| 30 | ||||
| 31 | ||||
| 32 | ||||
| 33 | ||||
| 34 | ||||
| 35 | ||||
28
Table of Contents
REPORT OF INDEPENDENT REGISTERED PUBLIC ACCOUNTING FIRM
To the Board of Directors and Stockholders
Nicholas Financial, Inc.
We have audited the accompanying consolidated balance sheets of Nicholas Financial, Inc. and subsidiaries (the “Company”) as of March 31, 2012 and 2011 and the related consolidated statements of income, comprehensive income, shareholders’ equity, and cash flows for each of the years in the three-year period ended March 31, 2012. These consolidated financial statements are the responsibility of the Company’s management. Our responsibility is to express an opinion on these consolidated financial statements based on our audits.
We conducted our audits in accordance with the standards of the Public Company Accounting Oversight Board (United States). Those standards require that we plan and perform the audit to obtain reasonable assurance about whether the financial statements are free of material misstatement. An audit includes examining, on a test basis, evidence supporting the amounts and disclosures in the consolidated financial statements. An audit also includes assessing the accounting principles used and significant estimates made by management, as well as evaluating the overall financial statement presentation. We believe that our audits provide a reasonable basis for our opinion.
In our opinion, the consolidated financial statements referred to above present fairly, in all material respects, the financial position of the Company as of March 31, 2012 and 2011 and the results of its operations and its cash flows for each of the years in the three-year period ended March 31, 2011, in conformity with accounting principles generally accepted in the United States of America.
We have also audited, in accordance with the standards of the Public Company Accounting Oversight Board (United States), the Company’s internal control over financial reporting as of March 31, 2012, based on criteria established in the Internal Control-Integrated Framework issued by the Committee of Sponsoring Organizations of the Treadway Commission, and our report dated June 14, 2012 expressed an unqualified opinion.
/s/ Dixon Hughes Goodman LLP
Atlanta, Georgia
June 14, 2012
29
Table of Contents
Nicholas Financial, Inc. and Subsidiaries
Consolidated Balance Sheets
| March 31, | ||||||||
| 2012 | 2011 | |||||||
| Assets |
||||||||
| Cash |
$ | 2,803,054 | $ | 2,017,540 | ||||
| Finance receivables, net |
242,348,521 | 230,163,854 | ||||||
| Assets held for resale |
1,373,001 | 1,055,140 | ||||||
| Prepaid expenses and other assets |
751,040 | 680,615 | ||||||
| Income taxes receivable |
497,535 | — | ||||||
| Property and equipment, net |
758,784 | 771,311 | ||||||
| Deferred income taxes |
8,704,099 | 8,954,665 | ||||||
|
|
|
|
|
|||||
| Total assets |
$ | 257,236,034 | $ | 243,643,125 | ||||
|
|
|
|
|
|||||
| Liabilities and shareholders’ equity |
||||||||
| Line of credit |
$ | 112,000,000 | $ | 118,000,000 | ||||
| Drafts payable |
1,602,079 | 1,878,609 | ||||||
| Accounts payable and accrued expenses |
6,612,429 | 7,209,387 | ||||||
| Income taxes payable |
— | 233,754 | ||||||
| Deferred revenues |
1,082,475 | 1,107,907 | ||||||
|
|
|
|
|
|||||
| Total liabilities |
121,296,983 | 128,429,657 | ||||||
| Commitments and contingencies |
||||||||
| Shareholders’ equity: |
||||||||
| Preferred stock, no par: 5,000,000 shares authorized; none issued |
— | — | ||||||
| Common stock, no par: 50,000,000 shares authorized; 11,960,975 and 11,806,660 shares issued, respectively |
28,426,043 | 26,337,731 | ||||||
| Retained earnings |
107,513,008 | 88,875,737 | ||||||
|
|
|
|
|
|||||
| Total shareholders’ equity |
135,939,051 | 115,213,468 | ||||||
|
|
|
|
|
|||||
| Total liabilities and shareholders’ equity |
$ | 257,236,034 | $ | 243,643,125 | ||||
|
|
|
|
|
|||||
See accompanying notes.
30
Table of Contents
Nicholas Financial, Inc. and Subsidiaries
Consolidated Statements of Income
| Fiscal Year ended March 31, | ||||||||||||
| 2012 | 2011 | 2010 | ||||||||||
| Revenue: |
||||||||||||
| Interest and fee income on finance receivables |
$ | 68,122,532 | $ | 62,719,904 | $ | 56,403,536 | ||||||
| Sales |
44,070 | 53,622 | 68,117 | |||||||||
|
|
|
|
|
|
|
|||||||
| 68,166,602 | 62,773,526 | 56,471,653 | ||||||||||
| Expenses: |
||||||||||||
| Cost of sales |
12,177 | 12,866 | 18,288 | |||||||||
| Marketing |
1,252,854 | 1,224,484 | 1,205,596 | |||||||||
| Salaries and employee benefits |
17,582,967 | 16,430,763 | 14,380,695 | |||||||||
| Administrative |
7,971,491 | 7,776,887 | 7,438,113 | |||||||||
| Provision for credit losses |
5,319 | 4,610,221 | 11,321,849 | |||||||||
| Depreciation |
287,839 | 266,686 | 322,050 | |||||||||
| Interest expense |
4,891,854 | 5,599,951 | 5,169,736 | |||||||||
| Change in fair value of interest rate swaps |
— | (495,136 | ) | (1,034,869 | ) | |||||||
|
|
|
|
|
|
|
|||||||
| 32,004,501 | 35,426,722 | 38,821,458 | ||||||||||
|
|
|
|
|
|
|
|||||||
| Operating income before income taxes |
36,162,101 | 27,346,804 | 17,650,195 | |||||||||
| Income tax expense |
13,931,809 | 10,541,620 | 6,785,634 | |||||||||
|
|
|
|
|
|
|
|||||||
| Net income |
$ | 22,230,292 | $ | 16,805,184 | $ | 10,864,561 | ||||||
|
|
|
|
|
|
|
|||||||
| Earnings per share: |
||||||||||||
| Basic |
$ | 1.89 | $ | 1.45 | $ | 0.95 | ||||||
|
|
|
|
|
|
|
|||||||
| Diluted |
$ | 1.85 | $ | 1.41 | $ | 0.93 | ||||||
|
|
|
|
|
|
|
|||||||
| Dividends declared per share |
$ | 0.30 | $ | 0.00 | $ | 0.00 | ||||||
|
|
|
|
|
|
|
|||||||
See accompanying notes.
31
Table of Contents
Nicholas Financial, Inc. and Subsidiaries
Consolidated Statements of Comprehensive Income
| Fiscal Year ended March 31, | ||||||||||||
| 2012 | 2011 | 2010 | ||||||||||
| Net income |
$ | 22,230,292 | $ | 16,805,184 | $ | 10,864,561 | ||||||
| Other comprehensive income, net of tax |
||||||||||||
| Reclassification adjustment for loss on interest rate swaps, net of tax of $110,452 and $358,384 for 2011 and 2010, respectively |
— | 178,090 | 577,829 | |||||||||
|
|
|
|
|
|
|
|||||||
| Comprehensive income |
$ | 22,230,292 | $ | 16,983,274 | $ | 11,442,390 | ||||||
|
|
|
|
|
|
|
|||||||
32
Table of Contents
Nicholas Financial, Inc. and Subsidiaries
Consolidated Statements of Shareholders’ Equity
|
Common Stock |
Accumulated Other Comprehensive Loss |
Retained Earnings |
Total Shareholders’ Equity |
|||||||||||||||||
| Shares | Amount | |||||||||||||||||||
| Balance at March 31, 2009 |
11,411,145 | $ | 18,073,622 | $ | (755,919 | ) | $ | 67,700,010 | $ | 85,017,713 | ||||||||||
|
|
|
|
|
|
|
|
|
|
|
|||||||||||
| Net income |
— | — | — | 10,864,561 | 10,864,561 | |||||||||||||||
| Other comprehensive income, net of tax as applicable |
— | — | 577,829 | — | 577,829 | |||||||||||||||
| Issuance of common stock under stock options |
165,825 | 269,206 | — | — | 269,206 | |||||||||||||||
| Issuance of restricted share awards, net of forfeitures |
127,600 | — | — | — | — | |||||||||||||||
| Issuance of performance share awards |
14,300 | — | — | — | — | |||||||||||||||
| Excess tax benefit on share awards, net |
— | 257,600 | — | — | 257,600 | |||||||||||||||
| Share-based compensation |
— | 450,374 | — | — | 450,374 | |||||||||||||||
| Stock dividend |
— | 6,494,018 | — | (6,494,018 | ) | — | ||||||||||||||
|
|
|
|
|
|
|
|
|
|
|
|||||||||||
| Balance at March 31, 2010 |
11,718,870 | $ | 25,544,820 | $ | (178,090 | ) | $ | 72,070,553 | $ | 97,437,283 | ||||||||||
|
|
|
|
|
|
|
|
|
|
|
|||||||||||
| Net income |
— | — | — | 16,805,184 | 16,805,184 | |||||||||||||||
| Other comprehensive income, net of tax as applicable |
— | — | 178,090 | — | 178,090 | |||||||||||||||
| Issuance of common stock under stock options |
26,090 | 55,610 | — | — | 55,610 | |||||||||||||||
| Issuance of restricted share awards, net of forfeitures |
54,000 | — | — | — | — | |||||||||||||||
| Issuance of performance share awards |
7,700 | — | — | — | — | |||||||||||||||
| Excess tax benefit on share awards, net |
— | 76,973 | — | — | 76,973 | |||||||||||||||
| Share-based compensation |
— | 660,328 | — | — | 660,328 | |||||||||||||||
|
|
|
|
|
|
|
|
|
|
|
|||||||||||
| Balance at March 31, 2011 |
11,806,660 | $ | 26,337,731 | $ | — | $ | 88,875,737 | $ | 115,213,468 | |||||||||||
|
|
|
|
|
|
|
|
|
|
|
|||||||||||
| Net income |
— | — | — | 22,230,292 | 22,230,292 | |||||||||||||||
| Issuance of common stock under stock options |
174,715 | 830,277 | — | — | 830,277 | |||||||||||||||
| Issuance of restricted share awards, net of forfeitures |
(29,400 | ) | — | — | — | — | ||||||||||||||
| Issuance of performance share awards |
9,000 | — | — | — | — | |||||||||||||||
| Excess tax benefit on share awards, net |
— | 706,123 | — | — | 706,123 | |||||||||||||||
| Share-based compensation |
— | 551,912 | — | — | 551,912 | |||||||||||||||
| Cash dividend |
— | — | — | (3,593,021 | ) | (3,593,021 | ) | |||||||||||||
|
|
|
|
|
|
|
|
|
|
|
|||||||||||
| Balance at March 31, 2012 |
11,960,975 | $ | 28,426,043 | $ | — | $ | 107,513,008 | $ | 135,939,051 | |||||||||||
|
|
|
|
|
|
|
|
|
|
|
|||||||||||
See accompanying notes.
33
Table of Contents
Nicholas Financial, Inc. and Subsidiaries
Consolidated Statements of Cash Flows
| Fiscal Year ended March 31, | ||||||||||||
| 2012 | 2011 | 2010 | ||||||||||
| Cash flows from operating activities: |
||||||||||||
| Net income |
$ | 22,230,292 | $ | 16,805,184 | $ | 10,864,561 | ||||||
| Adjustments to reconcile net income to net cash provided by operating activities: |
||||||||||||
| Depreciation |
287,839 | 266,686 | 322,050 | |||||||||
| Gain on sale of property and equipment |
(26,945 | ) | (25,792 | ) | (10,032 | ) | ||||||
| Provision for credit losses |
5,319 | 4,610,221 | 11,321,849 | |||||||||
| Deferred income taxes |
250,566 | (1,417,788 | ) | (1,217,391 | ) | |||||||
| Share-based compensation |
551,912 | 660,328 | 450,374 | |||||||||
| Change in fair value of interest rate swaps |
— | (495,136 | ) | (1,034,869 | ) | |||||||
| Changes in operating assets and liabilities: |
||||||||||||
| Prepaid expenses and other assets |
(70,425 | ) | 101,807 | (65,291 | ) | |||||||
| Accounts payable and accrued expenses |
(596,958 | ) | 1,068,422 | 587,285 | ||||||||
| Income taxes receivable/payable |
(731,289 | ) | (187,065 | ) | 214,368 | |||||||
| Deferred revenues |
(25,432 | ) | (29,243 | ) | (106,986 | ) | ||||||
|
|
|
|
|
|
|
|||||||
| Net cash provided by operating activities |
21,874,879 | 21,357,624 | 21,325,918 | |||||||||
|
|
|
|
|
|
|
|||||||
| Cash flows from investing activities: |
||||||||||||
| Purchase and origination of finance contracts |
(134,347,957 | ) | (134,049,373 | ) | (110,184,843 | ) | ||||||
| Principal payments received |
122,157,971 | 101,715,052 | 83,117,609 | |||||||||
| (Increase) decrease in assets held for resale |
(317,861 | ) | 14,991 | (11,650 | ) | |||||||
| Purchase of property and equipment |
(320,537 | ) | (393,782 | ) | (208,671 | ) | ||||||
| Proceeds from sale of property and equipment |
72,170 | 42,670 | 10,032 | |||||||||
|
|
|
|
|
|
|
|||||||
| Net cash used in investing activities |
(12,756,214 | ) | (32,670,442 | ) | (27,277,523 | ) | ||||||
|
|
|
|
|
|
|
|||||||
| Cash flows from financing activities: |
||||||||||||
| Net (repayment of) proceeds from line of credit |
(6,000,000 | ) | 10,725,029 | 5,244,776 | ||||||||
| Payment of cash dividend |
(3,593,021 | ) | — | — | ||||||||
| (Decrease) increase in drafts payable |
(276,530 | ) | 937,402 | (34,033 | ) | |||||||
| Proceeds from exercise of stock options |
830,277 | 55,610 | 269,206 | |||||||||
| Excess tax benefits from exercise of stock options, vesting of restricted share awards and issuance of performance share awards |
706,123 | 78,423 | 272,975 | |||||||||
|
|
|
|
|
|
|
|||||||
| Net cash (used in) provided by financing activities |
(8,333,151 | ) | 11,796,464 | 5,752,924 | ||||||||
|
|
|
|
|
|
|
|||||||
| Net increase (decrease) in cash |
785,514 | 483,646 | (198,681 | ) | ||||||||
| Cash, beginning of year |
2,017,540 | 1,533,894 | 1,732,575 | |||||||||
|
|
|
|
|
|
|
|||||||
| Cash, end of year |
$ | 2,803,054 | $ | 2,017,540 | $ | 1,533,894 | ||||||
|
|
|
|
|
|
|
|||||||
| Supplemental disclosure of noncash investing and financing activities: |
||||||||||||
| Decrease in accumulated other comprehensive loss for change in fair value of interest rate swaps |
$ | — | $ | 178,090 | $ | 577,829 | ||||||
|
|
|
|
|
|
|
|||||||
| Shortfall of tax benefits from vesting of restricted share awards and issuance of performance share awards |
$ | — | $ | (1,450 | ) | $ | (15,375 | ) | ||||
|
|
|
|
|
|
|
|||||||
See accompanying notes.
34
Table of Contents
Nicholas Financial, Inc. and Subsidiaries
Notes to Consolidated Financial Statements
1. Organization
Nicholas Financial, Inc. (“Nicholas Financial – Canada”) is a Canadian holding company incorporated under the laws of British Columbia with two wholly-owned United States subsidiaries, Nicholas Data Services, Inc. (“NDS”) and Nicholas Financial, Inc. (“NFI”). NDS is engaged principally in the development, marketing and support of computer application software. NFI is a specialized consumer finance company engaged primarily in acquiring and servicing automobile finance installment contracts (“Contracts”) for purchases of new and used automobiles and light trucks. To a lesser extent, NFI also offers direct loans and sells consumer-finance related products. Both NDS and NFI are based in Florida, U.S.A. The accompanying consolidated financial statements are stated in U.S. dollars and are presented in accordance with accounting principles generally accepted in the United States of America (“GAAP”).
2. Summary of Significant Accounting Policies
Consolidation
The consolidated financial statements include the accounts of Nicholas Financial – Canada and its wholly owned subsidiaries, NDS and NFI, collectively referred to as (the “Company”). All intercompany transactions and balances have been eliminated.
Dividend
During fiscal year 2012, three quarterly dividends were declared. On August 30, 2011, the Company’s Board of Directors announced a quarterly cash dividend of $0.10 per share of common stock paid on September 20, 2011. On October 27, 2011, the Company’s Board of Directors announced a quarterly cash dividend of $0.10 per share of common stock paid on December 20, 2011. On January 31, 2012, the Company’s Board of Directors declared another quarterly dividend equal to $0.10 per common share, to be paid on March 20, 2012 to shareholders of record as of March 13, 2012. Subsequent to March 31, 2012, one quarterly dividend was declared. On May 2, 2012 the Board of Directors announced a quarterly cash dividend equal to $0.10 per common share, to be paid on June 6th to shareholders of record as of May 30th.
On November 10, 2009 the Boards of Directors declared a 10% stock dividend on December 7, 2009 to shareholders of record on November 20, 2009. As a result of this stock dividend, an entry of approximately $6.5 million was made to reflect the re-capitalization of shareholders’ equity from retained earnings to common stock. This amount was derived from the quoted market value of the shares at the date of declaration ($6.10) times the number of shares issued as a result of the 10% stock dividend. All references in the consolidated financial statements and notes to the number of shares outstanding, per share amounts, and share awards of the Company’s common shares have been restated to reflect the effect of the stock dividend for all periods presented.
Use of Estimates
The preparation of consolidated financial statements in conformity with GAAP requires management to make estimates and assumptions that affect the reported amounts of assets and liabilities and disclosure of contingent assets and liabilities at the date of the consolidated financial statements and the reported amounts of revenues and expenses during the reporting period. Actual results could differ from those estimates. Material estimates that are particularly susceptible to significant change relate to the determination of the allowance for credit losses on finance receivables and the net realizable value of assets held for resale.
Finance Receivables
Finance receivables are recorded at cost, net of unearned interest and the allowance for credit losses. The amount of unearned interest, discounts and allowance for credit losses as of March 31, 2012 and March 31, 2011 are approximately $146,640,000 and $142,786,000, respectively.
Allowance for Credit Losses
The allowance for credit losses is increased by charges against earnings and decreased by charge-offs (net of recoveries). In addition to the charges against earnings, the reserve for credit losses has been established using dealer discounts to absorb credit losses. A dealer discount represents the difference between the finance receivable, net of unearned interest, of a Contract, and the amount of money the Company actually pays for the Contract. The entire amount of the discount is related to credit quality and is considered to be part of the credit loss reserve. The Company aggregates Contracts into static pools consisting of Contracts purchased during a three-month period for each branch location. Management’s periodic evaluation of the adequacy of the allowance is based on the Company’s past loan experience, known and inherent risks in the portfolio, adverse situations that may affect the borrower’s ability to repay, the estimated value of any underlying collateral, and current economic conditions. As conditions change, the Company’s level of provisioning and/or allowance may change as well.
35
Table of Contents
2. Summary of Significant Accounting Policies (continued)
Assets Held for Resale
Assets held for resale are stated at net realizable value and consist primarily of automobiles that have been repossessed by the Company and are awaiting final disposition. Costs associated with repossession, transport and auction preparation expenses are reported under operating expenses in the period in which they are incurred.
Property and Equipment
Property and equipment are recorded at cost, net of accumulated depreciation. Expenditures for repairs and maintenance are charged to expense as incurred. Depreciation of property and equipment is computed using the straight-line method over the estimated useful lives of the assets as follows:
| Automobiles |
3 years | |
| Equipment |
5 years | |
| Furniture and fixtures |
7 years | |
| Leasehold improvements |
Lesser of lease term or useful life (generally 6 - 7 years) |
Drafts Payable
Drafts payable represent checks disbursed for loan purchases which have not yet been funded. Amounts generally clear within two business days of period end and then increase the line of credit or reduce cash.
Income Taxes
Income taxes are accounted for under the asset and liability method. Deferred tax assets and liabilities are recognized for the future tax consequences attributable to differences between the consolidated financial statement carrying amounts of existing assets and liabilities and their respective tax bases along with operating loss and tax credit carryforwards, if any. Deferred tax assets and liabilities are measured using enacted tax rates expected to apply to taxable income in the years in which those temporary differences are expected to be recovered or settled. The effect on deferred tax assets and liabilities of a change in tax rate is recognized in income in the period that includes the enactment date.
The Company recognizes tax benefits from an uncertain tax position only if it is more likely than not that the tax position will be sustained on examination by taxing authorities, based on the technical merits of the position. The tax benefits recognized in the consolidated financial statements from any such position would be measured based on the largest benefit that has a greater than fifty percent likelihood of being realized upon ultimate settlement. It is the Company’s policy to recognize interest and penalties accrued on any uncertain tax benefits as a component of income tax expense. The Company does not have any accrued interest or penalties associated with any unrecognized tax benefits, nor has the Company recognized any related interest or penalties during the three years ended March 31, 2012.
The Company files income tax returns in the U.S. Federal jurisdiction and various State jurisdictions. The Company is no longer subject to U.S. Federal tax examinations for years before 2011. State jurisdictions that remain subject to examination range from 2007 to 2011. The Company does not believe there will be any material changes in our unrecognized tax positions over the next 12 months.
Revenue Recognition
Interest income on finance receivables is recognized using the effective interest method. Accrual of interest income on finance receivables is suspended when a loan is contractually delinquent for 60 days or more or the collateral is repossessed, whichever is earlier. As of March 31, 2012, 2011 and 2010 the amount of gross finance receivables not accruing interest was approximately $2,572,000, $2,035,000 and $2,580,000, respectively.
The amount of future unearned income is computed as the product of the Contract rate, the Contract term, and the Contract amount.
Deferred revenues consist primarily of commissions received from the sale of ancillary products. These products include automobile warranties, roadside assistance programs, accident and health insurance, credit life insurance and forced placed automobile insurance. These commissions are amortized over the life of the contract using the interest method.
The Company’s net fees charged for processing a loan are recognized as an adjustment to the yield and are amortized over the life of the loan using the interest method.
The Company attributes its entire dealer discount to a reserve for credit losses. After the analysis of purchase date accounting is complete, any remaining potentially uncollectable amounts would be contemplated in estimating the allowance for loan losses.
36
Table of Contents
2. Summary of Significant Accounting Policies (continued)
Sales relate principally to telephone support agreements and the sale of business forms to the Company’s customer base. The aforementioned sales of NDS represent less than 1% of the Company’s consolidated revenues.
Earnings Per Share
Basic earnings per share is calculated by dividing the reported net income for the period by the weighted average number of shares of common stock outstanding. Diluted earnings per share includes the effect of dilutive options and other share awards. Basic and diluted earnings per share have been computed as follows:
| Fiscal Year ended March 31, | ||||||||||||
| 2012 | 2011 | 2010 | ||||||||||
| Numerator for earnings per share – net income |
$ | 22,230,292 | $ | 16,805,184 | $ | 10,864,561 | ||||||
|
|
|
|
|
|
|
|||||||
| Denominator: |
||||||||||||
| Denominator for basic earnings per share – weighted average shares |
11,747,160 | 11,607,341 | 11,470,318 | |||||||||
| Effect of dilutive securities: |
||||||||||||
| Stock options and other share awards |
285,971 | 286,177 | 218,805 | |||||||||
|
|
|
|
|
|
|
|||||||
| Denominator for diluted earnings per share |
12,033,131 | 11,893,518 | 11,689,123 | |||||||||
|
|
|
|
|
|
|
|||||||
| Earnings per share – basic |
$ | 1.89 | $ | 1.45 | $ | 0.95 | ||||||
|
|
|
|
|
|
|
|||||||
| Earnings per share – diluted |
$ | 1.85 | $ | 1.41 | $ | 0.93 | ||||||
|
|
|
|
|
|
|
|||||||
Diluted earnings per share does not include the effect of certain stock options as their impact would be anti-dilutive. Approximately 53,500, 28,500 and 331,650 stock options were not included in the computation of diluted earnings per share for the years ended March 31, 2012, 2011 and 2010 respectively, because their effect would have been anti-dilutive.
Share-Based Payments
The grant date fair value of share awards is recognized in earnings over the requisite service period (presumptively the vesting period). The Company estimates the fair value of option awards using the Black-Scholes option pricing model. The risk-free interest rate is based upon a U.S. Treasury instrument with a life that is similar to the expected term of the options. Expected volatility is based upon the historical volatility for the previous period equal to the expected term of the options. The expected term is based upon the average life of previously issued options. The expected dividend yield is based upon the current yield on date of grant. The fair value of non-vested restricted and performance shares is measured at the market price of a share on a grant date.
The pool of excess tax benefits available to absorb future tax deficiencies is based on increases to shareholders’ equity related to tax benefits from share-based compensation, combined with the tax on the cumulative incremental compensation costs previously included in pro forma net income disclosures as if the Company had applied the fair-value method to all awards.
Fair Value Measurements
The Company measures specific assets and liabilities at fair value, which is an exit price, representing the price that would be received to sell an asset or paid to transfer a liability in an orderly transaction between market participants at the measurement date. When applicable, the Company utilizes market data or assumptions that market participants would use in pricing the asset or liability under a three-tier fair value hierarchy, which prioritizes the inputs used in measuring fair value. These tiers include: Level 1, defined as observable inputs such as quoted prices in active markets; Level 2, defined as inputs other than quoted prices in active markets that are either directly or indirectly observable; and Level 3, defined as unobservable inputs about which little or no market data exists, therefore requiring an entity to develop its own assumptions.
Financial Instruments and Concentrations
The Company’s financial instruments consist of cash, finance receivables, accrued interest, line of credit, interest rate swap agreements and accounts payable. Financial instruments that are exposed to concentrations of credit risk are primarily finance receivables and cash.
The Company operates in fifteen states through its sixty branch locations. Florida represents 33% of the finance receivables total as of March 31, 2012. Ohio represents 14%, Georgia represents 11% and North Carolina represents 10% of the finance receivables total as of March 31, 2012. Of the remaining eleven states, no one state represents more than 7% of the total finance receivables. The Company provides credit during the normal course of business and performs ongoing credit evaluations of its customers.
37
Table of Contents
2. Summary of Significant Accounting Policies (continued)
The Company maintains reserves for potential credit losses which, when realized, have been within the range of management’s expectations. The Company perfects a primary security interest in all vehicles financed as a form of collateral.
The combined account balances the Company maintains at financial institutions typically exceed federally insured limits, and there is a concentration of credit risk related to accounts on deposit in excess of federally insured limits. The company has not experienced any losses in such accounts and believes this risk of loss is not significant.
Interest Rate Swaps
Interest rate swaps were not in place during fiscal year ending March 31, 2012. Interest rate swap agreements were reported as either assets or liabilities in the consolidated balance sheet at fair value. For interest rate swap agreements previously designated and qualifying as cash flow hedges, gains or losses on the effective portion of the hedge were initially included as a component of other comprehensive income and are subsequently reclassified into earnings when interest on the related debt was paid. For interest rate swap agreements which were not designated and qualifying as cash flow hedges, the changes in the fair value are recorded in earnings. The Company does not use interest rate swaps for speculative purposes. See note 6 – “Interest Rate Swap Agreements”.
Accumulated Other Comprehensive Income (Loss)
Accumulated other comprehensive income (loss) is composed entirely of previous mark-to-market adjustments of designated and qualifying cash flow hedges, net of the related tax effect.
Statements of Cash Flows
Cash paid for income taxes for the years ended March 31, 2012, 2011 and 2010 was approximately $13,764,000, $12,068,000 and $7,516,000, respectively. Cash paid for interest for the years ended March 31, 2012, 2011 and 2010 was approximately $4,878,000, $5,720,000 and $5,056,000, respectively.
Recent Accounting Pronouncements
During the year, the Company early adopted recent accounting guidance regarding financial statement presentation of comprehensive income. As a result, the Company included consolidated statements of comprehensive income. Other than financial statement display, the update had no impact on the reported amounts in the Company’s consolidated financial statements.
In May 2011, the Financial Accounting Standards Board issued Accounting Standards Update (“ASU”) 2011-04 Fair Value Measurement (Topic 820): Amendments to Achieve Common Fair Value Measurement and Disclosure Requirements in GAAP and IFRSs. ASU 2011-04 does not extend the use of fair value accounting, but provides clarification of existing guidance and additional disclosures. The amendments in are to be applied prospectively and are effective during interim and annual reporting periods beginning on or after December 15, 2011. As this standard impacts disclosure only, the adoption is not expected to have an impact on the Company’s financial condition, results of operations and cash flows.
Other recent accounting pronouncements issued by the FASB (including its EITF), the AICPA, and the SEC, did not have a material impact on the Company’s present or future consolidated financial statements.
3. Finance Receivables
Finance receivables consist of Contracts and direct consumer loans (“Direct Loans”), each of which comprise a portfolio segment. Each portfolio segment consists of smaller balance homogeneous loans which are collectively evaluated for impairment.
The Company purchases individual Contracts from new and used automobile dealers in its markets. There is no relationship between the Company and the dealer with respect to a given contract once the assignment of that contract is complete. The dealer has no vested interest in the performance of any installment contract the Company purchases. The Company charges-off receivables when an individual account has become more than 120 days contractually delinquent. In the event of repossession the charge-off will occur in the month in which the vehicle was repossessed.
38
Table of Contents
3. Finance Receivables (continued)
Contracts included in finance receivables are detailed as follows as of fiscal years ended March 31:
| 2012 | 2011 | 2010 | ||||||||||
| Indirect finance receivables, gross contract |
$ | 382,766,667 | $ | 368,099,418 | $ | 320,579,222 | ||||||
| Unearned interest |
(109,456,018 | ) | (105,622,007 | ) | (91,385,145 | ) | ||||||
|
|
|
|
|
|
|
|||||||
| Indirect finance receivables, net of unearned interest |
273,310,649 | 262,477,411 | 229,194,077 | |||||||||
| Allowance for credit losses |
(35,495,684 | ) | (35,895,449 | ) | (30,408,578 | ) | ||||||
|
|
|
|
|
|
|
|||||||
| Indirect finance receivables, net |
$ | 237,814,965 | $ | 226,581,962 | $ | 198,785,499 | ||||||
|
|
|
|
|
|
|
|||||||
The terms of the Contracts range from 12 to 72 months and bear a weighted average effective interest rate of 23.58% and 23.49% as of March 31, 2012 and 2011, respectively.
The following table sets forth a reconciliation of the changes in the allowance for credit losses on Contracts for the fiscal years ended March 31:
| 2012 | 2011 | 2010 | ||||||||||
| Balance at beginning of year |
$ | 35,895,449 | $ | 30,408,578 | $ | 24,926,076 | ||||||
| Discounts acquired on new volume |
12,415,896 | 12,919,492 | 11,087,231 | |||||||||
| Provision for credit losses |
(176,745 | ) | 4,484,284 | 11,189,432 | ||||||||
| Losses absorbed |
(14,971,422 | ) | (14,036,888 | ) | (18,404,659 | ) | ||||||
| Recoveries |
2,405,750 | 2,255,683 | 1,962,496 | |||||||||
| Discounts accreted |
(73,244 | ) | (135,700 | ) | (351,998 | ) | ||||||
|
|
|
|
|
|
|
|||||||
| Balance at end of year |
$ | 35,495,684 | $ | 35,895,449 | $ | 30,408,578 | ||||||
|
|
|
|
|
|
|
|||||||
The Company purchases Contracts from automobile dealers at a negotiated price that is less than the original principal amount being financed by the purchaser of the automobile. The Contracts are predominately for used vehicles. As of March 31, 2012, the average model year of vehicles collateralizing the portfolio was 2005. The average loan to value ratio, which expresses the amount of the Contract as a percentage of the value of the automobile, is approximately 90%. A dealer discount represents the difference between the finance receivable, net of unearned interest, of a Contract, and the amount of money the Company actually pays for the Contract. The discount negotiated by the Company is a function of the credit quality of the customer, the wholesale value of the vehicle, and competition in any given market. In making decisions regarding the purchase of a particular Contract the Company considers the following factors related to the borrower: place and length of residence; current and prior job status; history in making installment payments for automobiles; current income; and credit history. In addition, the Company examines its prior experience with Contracts purchased from the dealer from which the Company is purchasing the Contract, and the value of the automobile in relation to the purchase price and the term of the Contract. The entire amount of discount is related to credit quality and is considered to be part of the allowance for credit losses. The Company utilizes a static pool approach to track portfolio performance. A static pool retains an amount equal to 100% of the discount as an allowance for credit losses. Subsequent to the purchase, if the allowance for credit losses is determined to be inadequate for a static pool, then an additional charge to income through the provision is used to maintain adequate reserves based on management’s evaluation of the risk inherent in the loan portfolio, the composition of the portfolio, and current economic conditions. Such evaluation, considers among other matters, the estimated net realizable value or the fair value of the underlying collateral, economic conditions, historical loan loss experience, management’s estimate of probable credit losses and other factors that warrant recognition in providing for an adequate allowance for credit losses.
The average dealer discount associated with new volume for fiscal years ended March 31, 2012 and 2011 was 8.47% and 8.78%, respectively
39
Table of Contents
3. Finance Receivables (continued)
Direct Loans are also included in finance receivables and are detailed as follows as of fiscal years ended March 31:
| 2012 | 2011 | 2010 | ||||||||||
| Direct finance receivables, gross contract |
$ | 6,221,688 | $ | 4,850,865 | $ | 4,840,381 | ||||||
| Unearned interest |
(1,195,948 | ) | (890,555 | ) | (803,257 | ) | ||||||
|
|
|
|
|
|
|
|||||||
| Direct finance receivables, net of unearned interest |
5,025,740 | 3,960,310 | 4,037,124 | |||||||||
| Allowance for credit losses |
(492,184 | ) | (378,418 | ) | (382,869 | ) | ||||||
|
|
|
|
|
|
|
|||||||
| Direct finance receivables, net |
$ | 4,533,556 | $ | 3,581,892 | $ | 3,654,255 | ||||||
|
|
|
|
|
|
|
|||||||
The terms of the Direct Loans range from 6 to 48 months and bear a weighted average effective interest rate of 26.14% and 25.93% as of March 31, 2012 and 2011, respectively.
The following table sets forth a reconciliation of the changes in the allowance for credit losses on Direct Loans for the fiscal years ended March 31:
| 2012 | 2011 | 2010 | ||||||||||
| Balance at beginning of year |
$ | 378,418 | $ | 382,869 | $ | 513,067 | ||||||
| Provision for credit losses |
182,062 | 125,937 | 132,417 | |||||||||
| Losses absorbed |
(93,041 | ) | (173,970 | ) | (324,521 | ) | ||||||
| Recoveries |
24,745 | 43,582 | 61,906 | |||||||||
|
|
|
|
|
|
|
|||||||
| Balance at end of year |
$ | 492,184 | $ | 378,418 | $ | 382,869 | ||||||
|
|
|
|
|
|
|
|||||||
Direct Loans are loans originated directly between the Company and the consumer. These loans are typically for amounts ranging from $1,000 to $9,000 and are generally secured by a lien on an automobile, watercraft or other permissible tangible personal property. The majority of Direct Loans are originated with current or former customers under the Company’s automobile financing program. The typical Direct Loan represents a significantly better credit risk than Contracts due to the customer’s historical payment history with the Company. In deciding whether or not to make a loan, the Company considers the individual’s credit history, job stability, income and impressions created during a personal interview with a Company loan officer. Additionally, because most of the Direct Loans made by the Company to date have been made to borrowers under Contracts previously purchased by the Company, the payment history of the borrower under the Contract is a significant factor in making the loan decision. As of March 31, 2012, loans made by the Company pursuant to its direct loan program constituted approximately 2% of the aggregate principal amount of the Company’s loan portfolio.
Changes in the allowance for credit losses for both Contracts and Direct Loans were driven by current economic conditions and credit loss trends over several reporting periods which are useful in estimating future losses and overall portfolio performance.
The following table is an assessment of the credit quality by creditworthiness as of March 31. A performing account is defined as an account that is less than 60 days past due. A non-performing account is defined as an account that is contractually delinquent for 60 days or more and the accrual of interest income is suspended. When an account is 120 days contractually delinquent, the account is written off.
| 2012 | 2011 | |||||||||||||||
| Contracts | Direct Loans | Contracts | Direct Loans | |||||||||||||
| Non-bankrupt accounts |
$ | 382,358,608 | $ | 6,221,688 | $ | 367,685,305 | $ | 4,844,683 | ||||||||
| Bankrupt accounts |
408,059 | — | 414,113 | 6,182 | ||||||||||||
|
|
|
|
|
|
|
|
|
|||||||||
| Total |
$ | 382,766,667 | $ | 6,221,688 | $ | 368,099,418 | $ | 4,850,865 | ||||||||
|
|
|
|
|
|
|
|
|
|||||||||
| Performing accounts |
$ | 380,213,503 | $ | 6,202,498 | $ | 366,081,821 | $ | 4,833,310 | ||||||||
| Non-performing accounts |
2,553,164 | 19,190 | 2,017,597 | 17,555 | ||||||||||||
|
|
|
|
|
|
|
|
|
|||||||||
| Total |
$ | 382,766,667 | $ | 6,221,688 | $ | 368,099,418 | $ | 4,850,865 | ||||||||
|
|
|
|
|
|
|
|
|
|||||||||
40
Table of Contents
3. Finance Receivables (continued)
The following tables present certain information regarding the delinquency rates experienced by the Company with respect to Contracts and Direct Loans:
| Delinquencies | ||||||||||||||||||||
| Contracts |
Gross Balance Outstanding |
30 – 59 days | 60 – 89 days | 90 + days | Total | |||||||||||||||
| March 31, 2012 |
$ | 382,766,667 | $ | 8,994,485 | $ | 1,889,643 | $ | 663,521 | $ | 11,547,649 | ||||||||||
| 2.35 | % | 0.49 | % | 0.17 | % | 3.01 | % | |||||||||||||
| March 31, 2011 |
$ | 368,099,418 | $ | 6,106,211 | $ | 1,468,079 | $ | 549,518 | $ | 8,123,808 | ||||||||||
| 1.66 | % | 0.40 | % | 0.15 | % | 2.21 | % | |||||||||||||
| March 31, 2010 |
$ | 320,579,222 | $ | 7,613,284 | $ | 1,752,638 | $ | 778,606 | $ | 10,144,528 | ||||||||||
| 2.37 | % | 0.55 | % | 0.24 | % | 3.16 | % | |||||||||||||
| Direct Loans |
Gross Balance Outstanding |
30 – 59 days | 60 – 89 days | 90 + days | Total | |||||||||||||||
| March 31, 2012 |
$ | 6,221,688 | $ | 48,899 | $ | 14,257 | $ | 4,933 | $ | 68,089 | ||||||||||
| 0.79 | % | 0.23 | % | 0.07 | % | 1.09 | % | |||||||||||||
| March 31, 2011 |
$ | 4,850,865 | $ | 37,399 | $ | 5,636 | $ | 11,919 | $ | 54,954 | ||||||||||
| 0.77 | % | 0.11 | % | 0.25 | % | 1.13 | % | |||||||||||||
| March 31, 2010 |
$ | 4,840,381 | $ | 98,854 | $ | 34,864 | $ | 14,383 | $ | 148,101 | ||||||||||
| 2.04 | % | 0.72 | % | 0.30 | % | 3.06 | % | |||||||||||||
4. Property and Equipment
Property and equipment as of March 31, 2012 and 2011 is summarized as follows:
| Cost | Accumulated Depreciation |
Net Book Value |
||||||||||
| 2012 |
||||||||||||
| Automobiles |
$ | 618,320 | $ | 462,551 | $ | 155,769 | ||||||
| Equipment |
1,008,023 | 711,316 | 296,707 | |||||||||
| Furniture and fixtures |
535,595 | 437,218 | 98,377 | |||||||||
| Leasehold improvements |
1,058,362 | 850,431 | 207,931 | |||||||||
|
|
|
|
|
|
|
|||||||
| $ | 3,220,300 | $ | 2,461,516 | $ | 758,784 | |||||||
|
|
|
|
|
|
|
|||||||
| 2011 |
||||||||||||
| Automobiles |
$ | 612,914 | $ | 470,253 | $ | 142,661 | ||||||
| Equipment |
930,151 | 607,160 | 322,991 | |||||||||
| Furniture and fixtures |
498,325 | 402,213 | 96,112 | |||||||||
| Leasehold improvements |
987,729 | 778,182 | 209,547 | |||||||||
|
|
|
|
|
|
|
|||||||
| $ | 3,029,119 | $ | 2,257,808 | $ | 771,311 | |||||||
|
|
|
|
|
|
|
|||||||
5. Line of Credit
Prior to September 1, 2011, the Company had a $140,000,000 line of credit facility expiring on November 30, 2011. On September 1, 2011, the Company executed a new agreement with its consortium of lenders that increased the size of the line of credit facility (the “Line”) from $140,000,000 to $150,000,000. The pricing of the Line, which expires on November 30, 2013, is 300 basis points above 30-day LIBOR (4.00% at December 31, 2011 and March 31, 2011) with a 1% floor on LIBOR. Pledged as collateral for this credit facility are all of the assets of the Company. The outstanding amount of the credit facility was approximately $112,000,000 and $118,000,000 as of March 31, 2012 and March 31, 2011, respectively. The amount available under the line of credit was approximately $38,000,000 and $22,000,000 as of March 31, 2012 and March 31, 2011, respectively.
41
Table of Contents
5. Line of Credit (continued)
The facility requires compliance with certain financial ratios and covenants and satisfaction of specified financial tests, including maintenance of asset quality and performance tests. Dividends do not require consent in writing by the agent and majority lenders under the new facility as long as the Company is in compliance with a net income covenant. As of March 31, 2012, the Company was in full compliance with all debt covenants.
6. Interest Rate Swap Agreements
As of March 31, 2012 and March 31, 2011, the Company did not have any outstanding interest rate swap agreements (see footnote 13 for subsequent event related to the Company entering into a interest rate swap agreement). The swap agreements, in effect, converted a portion of the floating rate debt to a fixed rate, more closely matching the interest rate characteristics of finance receivables. The following table summarizes the activity in the Company’s notional amounts of interest rate swap agreements for fiscal years ended March 31:
| 2011 | 2010 | |||||||
| Notional amounts at beginning of year |
$ | 50,000,000 | $ | 80,000,000 | ||||
| New contracts |
— | — | ||||||
| Matured contracts |
(50,000,000 | ) | (30,000,000 | ) | ||||
|
|
|
|
|
|||||
| Notional amounts at end of year |
$ | — | $ | 50,000,000 | ||||
|
|
|
|
|
|||||
These interest rate swaps were previously designated as cash flow hedges. Based on credit market events that transpired in October 2008, the Company made an economic decision to elect the prime rate pricing option available under the Line for the month of October 2008. As a result, the critical terms of the interest rate swaps and hedged interest payments were no longer identical, and the Company undesignated its interest rate swaps as cash flow hedges. Consequently, beginning in October 2008 changes in the fair value of interest rate swaps (unrealized gains and losses) were recorded in earnings. Unrealized losses previously recorded in accumulated other comprehensive loss were reclassified into earnings as interest payments on the Line affect earnings over the remaining term of the respective swap agreements. The Company did not use interest rate swaps for speculative purposes and they were only intended for use as economic hedges.
The locations and amounts of gains (losses) recognized in income are detailed as follows for the fiscal years ended March 31:
| 2011 | 2010 | |||||||
| Periodic change in fair value of interest rate swaps |
$ | 783,678 | $ | 1,971,082 | ||||
| Losses reclassified from accumulated other comprehensive loss |
(288,542 | ) | (936,213 | ) | ||||
|
|
|
|
|
|||||
| 495,136 | 1,034,869 | |||||||
| Periodic settlement differentials included in interest expense |
(801,048 | ) | (2,485,232 | ) | ||||
|
|
|
|
|
|||||
| Loss recognized in income |
$ | (305,912 | ) | $ | (1,450,363 | ) | ||
|
|
|
|
|
|||||
Before maturing, interest rate swap agreements were recorded at fair value, which was approximately $784,000 as of March 31, 2010. Changes in the fair value of interest rate swaps were recorded in the change in fair value of interest rate swaps line item of the consolidated statements of income.
Accumulated other comprehensive loss as of March 31, 2010 of approximately $178,000, represents the after-tax effect of the derivative losses prior to October 2008 when the swaps were designated and qualifying as cash flow hedges. As of March 31, 2012 and 2011, no remaining accumulated other comprehensive loss exists to be reclassified and affect net earnings.
Net realized gains and losses from the swap agreements were recorded in the interest expense line item of the consolidated statement of income.
42
Table of Contents
6. Interest Rate Swap Agreements (continued)
The following table summarizes the average variable rates received and average fixed rates paid under the swap agreements as of March 31:
| 2012 | 2011 | |||||||
| Average variable rate received |
0.00 | % | 0.29 | % | ||||
| Average fixed rate paid |
0.00 | % | 3.80 | % | ||||
7. Fair Value Disclosures
Assets and Liabilities Recorded at Fair Value on a Recurring Basis
The Company may be required, from time to time, to measure certain assets and liabilities at fair value on a recurring basis. The Company does not currently have any assets or liabilities measured at fair value on a recurring basis.
Financial Instruments Not Measured at Fair Value
The Company’s financial instruments consist of cash, finance receivables, accrued interest, the Line, and accounts payable. For each of these financial instruments the carrying value approximates fair value. The carrying value of cash approximates the fair value due to the nature of these accounts. Finance receivables, net approximates fair value based on the price paid to acquire indirect loans. The price paid reflects competitive market interest rates and purchase discounts for the Company’s chosen credit grade in the economic environment. This market is highly liquid as the Company acquires individual loans on a daily basis from dealers. The initial terms of the indirect finance receivables range from 12 to 72 months. The initial terms of the direct finance receivables range from 6 to 48 months. In addition, there have been minimal changes in interest rates and purchase discounts related to these types of loans. If liquidated outside of the normal course of business, the amount received may not be the carrying value. The Line was amended within the quarter ended September 30, 2011. Based on current market conditions, any new or renewed credit facility would contain pricing that approximates the Company’s current Line. Based on these market conditions, the fair value of the Line as of March 31, 2012 was estimated to be equal to the book value. Accrued interest is paid monthly. As a result of the short-term nature of this activity, the carrying value of the accrued interest approximates fair value. The interest rate for the line of credit is a variable rate based on LIBOR pricing options.
Assets and Liabilities Recorded at Fair Value on a Nonrecurring Basis
The Company may be required, from time to time, to measure certain assets and liabilities at fair value on a nonrecurring basis. The Company does not currently have any assets or liabilities measured at fair value on a nonrecurring basis.
8. Income Taxes
The provision for income taxes consists of the following for the years ended March 31:
| 2012 | 2011 | 2010 | ||||||||||
| Current: |
||||||||||||
| Federal |
$ | 11,795,165 | $ | 10,272,425 | $ | 6,870,420 | ||||||
| State |
1,886,079 | 1,686,983 | 1,132,605 | |||||||||
|
|
|
|
|
|
|
|||||||
| Total current |
13,681,244 | 11,959,408 | 8,003,025 | |||||||||
|
|
|
|
|
|
|
|||||||
| Deferred: |
||||||||||||
| Federal |
216,022 | (1,217,796 | ) | (1,045,103 | ) | |||||||
| State |
34,543 | (199,992 | ) | (172,288 | ) | |||||||
|
|
|
|
|
|
|
|||||||
| Total deferred |
250,565 | (1,417,788 | ) | (1,217,391 | ) | |||||||
|
|
|
|
|
|
|
|||||||
| Income tax expense |
$ | 13,931,809 | $ | 10,541,620 | $ | 6,785,634 | ||||||
|
|
|
|
|
|
|
|||||||
43
Table of Contents
8. Income Taxes (continued)
The net tax effects of temporary differences between the carrying amounts of assets and liabilities for financial reporting purposes and the amounts used for income tax purposes are reflected in deferred income taxes. Significant components of the Company’s deferred tax assets consist of the following as of March 31:
| 2012 | 2011 | |||||||
| Allowance for credit losses not currently deductible for tax purposes |
$ | 8,037,787 | $ | 8,150,912 | ||||
| Share-based compensation |
436,131 | 543,624 | ||||||
| Other items |
230,181 | 260,129 | ||||||
|
|
|
|
|
|||||
| $ | 8,704,099 | $ | 8,954,665 | |||||
|
|
|
|
|
|||||
The provision for income taxes reflects an effective U.S tax rate, which differs from the corporate tax rate for the following reasons:
| 2012 | 2011 | 2010 | ||||||||||
| Provision for income taxes at Federal statutory rate |
$ | 12,656,735 | $ | 9,571,378 | $ | 6,177,568 | ||||||
| Increase resulting from: |
||||||||||||
| State income taxes, net of Federal benefit |
1,248,404 | 966,544 | 624,206 | |||||||||
| Other |
26,670 | 3,698 | (16,140 | ) | ||||||||
|
|
|
|
|
|
|
|||||||
| $ | 13,931,809 | $ | 10,541,620 | $ | 6,785,634 | |||||||
|
|
|
|
|
|
|
|||||||
9. Share-Based Payments
The Company has share awards outstanding under three share-based compensation plans (the “Equity Plans”). The Company believes that such awards better align the interests of its employees with those of its shareholders. Under the shareholder-approved 1998 Employee Stock Option Plan and Non-Employee Director Stock Option Plan (collectively the “1998 Plans”) the Board of Directors was authorized to grant option awards for up to 1,551,000 common shares to employees and directors. On August 9, 2006, the Company’s shareholders approved the Nicholas Financial, Inc. Equity Incentive Plan (the “2006 Plan”) for employees and non-employee directors. Under the 2006 Plan, the Board of Directors is authorized to grant total share awards for up to 1,072,500 common shares. The 2006 Plan replaced the 1998 Plans; accordingly no additional option awards may be granted under the 1998 Plans. In addition to option awards, the 2006 Plan provides for restricted stock and performance share awards.
Option awards previously granted to employees and directors under the 1998 Plans generally vest ratably based on service over a five and three-year period, respectively, and generally have a contractual term of ten years. Vesting and contractual terms for option awards under the 2006 Plan are essentially the same as those of the 1998 Plans. Restricted stock awards generally cliff vest over a three-year period based on service conditions. The annual vesting of performance share awards is contingent upon the attainment of company-wide performance goals including annual revenue growth and operating income targets. There are no post-vesting restrictions for share awards.
The Company funds share awards from authorized but unissued shares and does not purchase shares to fulfill the obligations of the plans. Cash dividends, if any, are not paid on unvested performance shares or unexercised options, but are paid on unvested restricted stock awards.
The fair value of each option granted is estimated on the date of grant using the Black-Scholes option-pricing model with the following weighted-average assumptions:
| 2012 | 2011 | 2010 | ||||||||||
| Risk-free interest rate |
1.84 | % | 1.88 | % | 2.02 | % | ||||||
| Weighted average expected original term |
5 years | 5 years | 5 years | |||||||||
| Expected volatility |
49 | % | 49 | % | 47 | % | ||||||
| Expected dividend yield |
0.00 | % | 0.00 | % | 0.00 | % | ||||||
44
Table of Contents
9. Share-Based Payments (continued)
A summary of option activity under the Equity Plans as of March 31, 2011, and changes during the year are presented below.
| Options |
Shares | Weighted Average Exercise Price |
Weighted Average Remaining Contractual Term |
Aggregate Intrinsic Value |
||||||||||||
| Outstanding at March 31, 2011 |
661,255 | $ | 5.47 | |||||||||||||
| Granted |
45,000 | $ | 12.96 | |||||||||||||
| Exercised |
(174,715 | ) | $ | 4.75 | ||||||||||||
| Forfeited |
(29,660 | ) | $ | 6.17 | ||||||||||||
|
|
|
|
|
|||||||||||||
| Outstanding at March 31, 2012 |
501,880 | $ | 6.36 | 5.92 | $ | 3,429,135 | ||||||||||
|
|
|
|
|
|
|
|
|
|||||||||
| Exercisable at March 31, 2012 |
364,740 | $ | 5.54 | 5.30 | $ | 2,788,713 | ||||||||||
|
|
|
|
|
|
|
|
|
|||||||||
The Company granted 45,000, 28,500 and 92,400 options with a weighted average fair value of $5.73, $4.19 and $1.55 during the years ended March 31, 2012, 2011 and 2010, respectively. The total intrinsic value of options exercised during the years ended March 31, 2012, 2011 and 2010 was approximately $1,335,000, $168,000 and $716,000, respectively.
During the fiscal year ended March 31, 2012, 174,715 options were exercised at exercise prices ranging from $2.00 to $10.21 per share. During the same period 29,660 options were forfeited at exercise prices ranging from $2.77 to $12.96 per share.
Cash received from options exercised during the fiscal years ended March 31, 2012, 2011 and 2010 totaled approximately $830,000, $56,000 and $269,000, respectively. Related income tax benefits during the same periods totaled approximately $511,000, $64,000 and $273,000, respectively. Such amounts are included in proceeds from exercise of stock options and income tax benefit related thereto under cash flows from financing activities in the consolidated statements of cash flows. As of March 31, 2012, there was approximately $415,000 of total unrecognized compensation cost related to options granted under the Plan. That cost is expected to be recognized over a weighted-average period of approximately 3 years.
A summary of the status of the Company’s non-vested restricted shares under the 2006 Plan as of March 31, 2012, and changes during the year then ended is presented below.
| Restricted Share Awards |
Shares | Weighted Average Grant Date Fair Value |
Weighted Average Remaining Contractual Term |
Aggregate Intrinsic Value |
||||||||||||
| Non-vested at March 31, 2011 |
184,900 | $ | 4.25 | |||||||||||||
| Granted |
5,000 | $ | 12.96 | |||||||||||||
| Vested |
(55,000 | ) | $ | 2.38 | ||||||||||||
| Forfeited |
(34,400 | ) | $ | 3.83 | ||||||||||||
|
|
|
|
|
|||||||||||||
| Non-vested at March 31, 2012 |
100,500 | $ | 5.85 | 0.36 | $ | 1,325,595 | ||||||||||
|
|
|
|
|
|
|
|
|
|||||||||
The Company awarded 5,000 restricted shares with a weighted average grant date fair value of $12.96 during the fiscal year ended March 31, 2012. During the same period 34,400 restricted shares were forfeited with a weighted average grant date fair value of $3.83.
As of March 31, 2012, there was approximately $119,000 of total unrecognized compensation cost related to non-vested restricted share awards granted under the 2006 Plan. That cost is expected to be recognized over a weighted-average period of approximately 6 months.
45
Table of Contents
9. Share-Based Payments (continued)
A summary of the status of the Company’s non-vested performance shares under the 2006 Plan as of March 31, 2012, and changes during the year then ended is presented below.
| Performance Share Awards |
Shares | Weighted Average Grant Date Fair Value |
Weighted Average Remaining Contractual Term |
Aggregate Intrinsic Value |
||||||||||
| Non-vested at March 31, 2011 |
— | $ | — | |||||||||||
| Granted |
11,000 | $ | 12.00 | |||||||||||
| Vested |
(9,000 | ) | $ | 12.00 | ||||||||||
| Forfeited |
(2,000 | ) | $ | 11.98 | ||||||||||
|
|
|
|
|
|||||||||||
| Non-vested at March 31, 2012 |
— | $ | $ | |||||||||||
|
|
|
|
|
|
|
|
||||||||
The Company awarded 11,000 performance shares with a weighted average grant date fair value of $12.00 during the fiscal year ended March 31, 2012. During the same period 2,000 performance shares were forfeited with a weighted average grant date fair value of $11.98.
As of March 31, 2012, there was no unrecognized compensation cost related to non-vested performance share awards granted under the 2006 Plan.
10. Employee Benefit Plans
The Company has a 401(k) retirement plan under which all employees are eligible to participate. Employee contributions are voluntary and subject to Internal Revenue Service limitations. The Company matches, based on annually determined factors, employee contributions provided the employee completes certain levels of service annually. For the plan years 2011 and 2010, the Board of Directors suspended the Company’s matching. The Board will re-evaluate the Company’s matching policy for plan year 2012 later this year. For the fiscal years ended March 31, 2012, 2011 and 2010, the Company recorded expenses of approximately $7,500, $7,000, and $7,000, respectively, related to this plan.
11. Commitments and Contingencies
The Company leases corporate and branch offices under operating lease agreements which provide for annual minimum rental payments as follows:
| Fiscal Year ending March 31: |
||||
| 2013 |
$ | 1,701,149 | ||
| 2014 |
865,838 | |||
| 2015 |
394,612 | |||
| 2016 |
141,275 | |||
| 2017 |
51,270 | |||
|
|
|
|||
| $ | 3,154,144 | |||
|
|
|
|||
Rent expense for the fiscal years ended March 31, 2012, 2011, and 2010 was approximately $1,761,000, $1,599,000, and $1,421,000, respectively. The Company recognizes rent expense on a straight-line basis over the term of the lease, taking into account, when applicable, lessor incentives for tenant improvements, periods where no rent payment is required and escalations in rent payments over the term of the lease.
The Company is not a party to any pending legal proceedings other than ordinary routine litigation incidental to its business, none of which, if decided adversely to the Company, in the opinion of management, would have a material adverse affect on the Company’s financial position.
46
Table of Contents
12. Quarterly Results of Operations (Unaudited)
| Fiscal Year ended March 31, 2012 | ||||||||||||||||
| First Quarter |
Second Quarter |
Third Quarter |
Fourth Quarter |
|||||||||||||
| Total revenue |
$ | 16,634,305 | $ | 17,210,999 | $ | 17,139,971 | $ | 17,181,327 | ||||||||
| Interest expense |
1,228,978 | 1,236,893 | 1,236,866 | 1,189,117 | ||||||||||||
| Provision for credit losses |
79,415 | 178,029 | 454,339 | (706,464 | ) | |||||||||||
| Non-interest expense |
6,695,286 | 6,779,122 | 6,755,283 | 6,877,637 | ||||||||||||
|
|
|
|
|
|
|
|
|
|||||||||
| Operating income before income taxes |
8,630,626 | 9,016,955 | 8,693,483 | 9,821,037 | ||||||||||||
| Income tax expense |
3,327,833 | 3,496,851 | 3,330,762 | 3,776,363 | ||||||||||||
|
|
|
|
|
|
|
|
|
|||||||||
| Net income |
$ | 5,302,793 | $ | 5,520,104 | $ | 5,362,721 | $ | 6,044,674 | ||||||||
|
|
|
|
|
|
|
|
|
|||||||||
| Earnings per share: |
||||||||||||||||
| Basic |
$ | 0.46 | $ | 0.47 | $ | 0.46 | $ | 0.51 | ||||||||
|
|
|
|
|
|
|
|
|
|||||||||
| Diluted |
$ | 0.44 | $ | 0.46 | $ | 0.45 | $ | 0.50 | ||||||||
|
|
|
|
|
|
|
|
|
|||||||||
| Dividends per share |
$ | 0.00 | $ | 0.10 | $ | 0.10 | $ | 0.10 | ||||||||
|
|
|
|
|
|
|
|
|
|||||||||
| Fiscal Year ended March 31, 2011 | ||||||||||||||||
| First Quarter |
Second Quarter |
Third Quarter |
Fourth Quarter |
|||||||||||||
| Total revenue |
$ | 14,952,147 | $ | 15,731,853 | $ | 15,995,350 | $ | 16,094,176 | ||||||||
| Interest expense |
1,539,373 | 1,449,757 | 1,382,950 | 1,227,871 | ||||||||||||
| Provision for credit losses |
1,595,661 | 1,711,873 | 1,201,172 | 101,515 | ||||||||||||
| Change in fair value of interest rate swaps |
(244,365 | ) | (137,828 | ) | (95,756 | ) | (17,187 | ) | ||||||||
| Non-interest expense |
6,249,175 | 6,241,584 | 6,244,376 | 6,976,551 | ||||||||||||
|
|
|
|
|
|
|
|
|
|||||||||
| Operating income before income taxes |
5,812,303 | 6,466,467 | 7,262,608 | 7,805,426 | ||||||||||||
| Income tax expense |
2,236,465 | 2,484,123 | 2,787,788 | 3,033,244 | ||||||||||||
|
|
|
|
|
|
|
|
|
|||||||||
| Net income |
$ | 3,575,838 | $ | 3,982,344 | $ | 4,474,820 | $ | 4,772,182 | ||||||||
|
|
|
|
|
|
|
|
|
|||||||||
| Earnings per share: |
||||||||||||||||
| Basic |
$ | 0.31 | $ | 0.34 | $ | 0.39 | $ | 0.41 | ||||||||
|
|
|
|
|
|
|
|
|
|||||||||
| Diluted |
$ | 0.30 | $ | 0.34 | $ | 0.38 | $ | 0.40 | ||||||||
|
|
|
|
|
|
|
|
|
|||||||||
13. Subsequent Event
On June 4, 2012, the Company entered into an interest rate swap transaction to convert a portion of the floating rate debt to a fixed rate, more closely matching the interest rate characteristics of finance receivables. The transaction sets forth the terms of a five-year interest rate swap in which the Company would pay a fixed rate of 1% and receives payments from the counterparty on the 1-month LIBOR rate. The swap has an effective date of June 13, 2012 and a notional amount of $25 million. The changes in the fair value of the interest rate swap (unrealized gains and losses) will be recorded in earnings.
47
Table of Contents
Item 9. Changes In and Disagreements with Accountants on Accounting and Financial Disclosure
None.
Item 9A. Controls and Procedures
Evaluation of Disclosure Controls and Procedures
The Company maintains disclosure controls and procedures designed to ensure information required to be disclosed in its reports filed pursuant to the Securities Exchange Act of 1934, as amended (the “Exchange Act”), is recorded, processed, summarized and reported within the time periods specified in the SEC’s rules and forms. Such information is accumulated and communicated to management, including our Chief Executive Officer and Chief Financial Officer as appropriate, to allow timely decisions regarding required disclosure. The Company’s management, including its Chief Executive Officer and Chief Financial Officer, does not expect that the Company’s disclosure controls and procedures or internal controls will prevent all possible error and fraud. A control system, no matter how well conceived and operated, can provide only reasonable, not absolute, assurance that the objectives of the control system are met. Further, the design of a control system must reflect the fact there are resource constraints, and the benefits of controls must be considered relative to their costs. Because of the inherent limitations in all control systems, no evaluation of controls can provide absolute assurance that all control issues and instances of fraud, if any, within the Company have been detected.
The Company’s management, including our Chief Executive Officer and Chief Financial Officer, conducted an evaluation of the effectiveness of the Company’s disclosure controls and procedures (as defined in Rule 13a-15(e) under the Exchange Act) as of March 31, 2012. Based upon this evaluation, our Chief Executive Officer and Chief Financial Officer have concluded that the Company’s disclosure controls and procedures were effective as of March 31, 2012.
Management’s Report on Internal Control over Financial Reporting
The Company’s management is responsible for establishing and maintaining adequate internal control over financial reporting, as such term is defined in Rule 13a-15(f) under the Exchange Act. The Company’s internal control over financial reporting is a process designed to provide reasonable assurance regarding the reliability of financial reporting and the preparation and fair presentation of financial statements in accordance with generally accepted accounting principles. The Company’s management, including our Chief Executive Officer and Chief Financial Officer, conducted an evaluation of the effectiveness of our internal control over financial reporting as of March 31, 2012, the end of the fiscal year covered by this Report, based on the criteria set forth in Internal Control-Integrated Framework issued by the Committee of Sponsoring Organizations of the Treadway Commission (“COSO”). Based on management’s evaluation under the framework in Internal Control-Integrated Framework, management has concluded that the Company’s internal control over financial reporting was effective as of March 31, 2012.
Dixon Hughes Goodman LLP, an independent registered public accounting firm, has audited the effectiveness of our internal control over financial reporting as of March 31, 2012, as stated in their report, which is included below.
June 14, 2012
| Peter L. Vosotas | Ralph T. Finkenbrink | |
| Chairman of the Board, President and Chief Executive Officer |
Senior Vice President-Finance and Chief Financial Officer |
Changes in Internal Control Over Financial Reporting
No change in the Company’s internal control over financial reporting occurred during the Company’s last fiscal quarter that has materially affected, or is reasonably likely to materially affect, the Company’s internal control over financial reporting.
48
Table of Contents
REPORT OF INDEPENDENT REGISTERED PUBLIC ACCOUNTING FIRM
To the Board of Directors and Stockholders
Nicholas Financial, Inc.
We have audited Nicholas Financial, Inc. and subsidiaries (the “Company”) internal control over financial reporting as of March 31, 2012, based on criteria established in Internal Control-Integrated Framework issued by the Committee of Sponsoring Organizations of the Treadway Commission (“COSO”). The Company’s management is responsible for maintaining effective internal control over financial reporting and for its assessment of the effectiveness of internal control over financial reporting, included in the accompanying Management’s Report on Internal Control Over Financial Reporting. Our responsibility is to express an opinion on the Company’s internal control over financial reporting based on our audit.
We conducted our audit in accordance with the standards of the Public Company Accounting Oversight Board (United States). Those standards require that we plan and perform the audit to obtain reasonable assurance about whether effective internal control over financial reporting was maintained in all material respects. Our audit included obtaining an understanding of internal control over financial reporting, assessing the risk that a material weakness exists, and testing and evaluating the design and operating effectiveness of internal control based on the assessed risk. Our audit also included performing such other procedures as we considered necessary in the circumstances. We believe that our audit provides a reasonable basis for our opinion.
A company’s internal control over financial reporting is a process designed to provide reasonable assurance regarding the reliability of financial reporting and the preparation of financial statements for external purposes in accordance with generally accepted accounting principles. A company’s internal control over financial reporting includes those policies and procedures that (1) pertain to the maintenance of records that, in reasonable detail, accurately and fairly reflect the transactions and dispositions of the assets of the company; (2) provide reasonable assurance that transactions are recorded as necessary to permit preparation of financial statements in accordance with generally accepted accounting principles, and that receipts and expenditures of the company are being made only in accordance with authorizations of management and directors of the company; and (3) provide reasonable assurance regarding prevention or timely detection of unauthorized acquisition, use, or disposition of the company’s assets that could have a material effect on the financial statements.
Because of its inherent limitations, internal control over financial reporting may not prevent or detect misstatements. Also, projections of any evaluation of effectiveness to future periods are subject to the risk that controls may become inadequate because of changes in conditions, or that the degree of compliance with the policies or procedures may deteriorate.
In our opinion, the Company maintained, in all material respects, effective internal control over financial reporting as of March 31, 2012, based on criteria established in Internal Control-Integrated Framework issued by COSO.
We also have audited, in accordance with the standards of the Public Company Accounting Oversight Board (United States), the consolidated financial statements of Nicholas Financial, Inc. as of and for the year ended March 31, 2012, and our report dated June 14, 2012, expressed an unqualified opinion.
/s/Dixon Hughes Goodman LLP
Atlanta, Georgia
June 14, 2012
49
Table of Contents
None.
Item 10. Directors, Executive Officers and Corporate Governance
The information to be set forth under the captions “Proposal 1: Election of Directors,” “Board of Directors,” “Executive Officers and Compensation” and “Section 16(a) Beneficial Ownership Reporting Compliance” in the definitive Proxy Statement and Information Circular for the 2012 Annual General Meeting of Members of the Company, which will be filed with the SEC on or about July 6, 2012 (the “Proxy Statement”), is incorporated herein by reference.
The Company has adopted a written code of ethics applicable to its chief executive officer, chief financial officer, principal accounting officer and persons performing similar functions. The text of this code of ethics is filed as Exhibit 14 to this Report. A copy of the code of ethics is also posted on the Company’s web site at www.nicholasfinancial.com. The Company intends to satisfy the disclosure requirements under Item 5.05 of the SEC’s Current Report on Form 8-K regarding amendments to, or waivers from, the code of ethics by posting such information on the Company’s web site at www.nicholasfinancial.com. The Company is not including the information contained on or available through its web site as a part of, or incorporating such information by reference into, this Report.
Item 11. Executive Compensation, Compensation Interlocks and Insider Participation
The information to be set forth under the captions “Executive Officers and Compensation” and “Board of Directors” in the Proxy Statement is incorporated herein by reference.
Item 12. Security Ownership of Certain Beneficial Owners and Management and Related Stockholder Matters
The information to be set forth under the caption “Voting Shares and Ownership of Management and Principal Holders” in the Proxy Statement is incorporated herein by reference. See also “Item 5. Market for Registrant’s Common Equity, Related Stockholder Matters and Issuer Purchases of Equity Securities – Securities Authorized for Issuance Under Equity Compensation Plans” on page 16 of this Report for certain information relating to the Company’s equity compensation plans.
Item 13. Certain Relationships and Related Transactions, Director Independence and Board of Directors
The information to be set forth under the captions “Board of Directors” and “Certain Relationships and Related Transactions” in the Proxy Statement is incorporated herein by reference.
Item 14. Principal Accountant Fees and Services
The information to be set forth under the caption “Proposal 2: Appointment of Independent Auditors” in the Proxy Statement is incorporated herein by reference.
50
Table of Contents
Item 15. Exhibits and Financial Statement Schedules
| (a) | The following documents are filed as part of this Report: |
| (1) | Financial Statements |
See Part II, Item 8, of this Report.
| (2) | Financial Statement Schedules |
All financial schedules are omitted as the required information is not applicable or the information is presented in the consolidated financial statements or related notes.
| (3) | Exhibits |
| Exhibit |
Description | |
| 3.1 | Articles of Nicholas Financial, Inc. (1) | |
| 3.2 | Notice of Articles of Nicholas Financial, Inc. (2) | |
| 4 | Form of Common Stock Certificate (3) | |
| 10.1 | Second Amended and Restated Loan and Security Agreement, dated January 12, 2010 (4) | |
| 10.2 | Amendment No. 1 to Second Amended and Restated Loan and Security Agreement, dated September 1, 2011 | |
| 10.3 | Nicholas Financial, Inc. Employee Stock Option Plan (6)* | |
| 10.4 | Nicholas Financial, Inc. Non-Employee Director Stock Option Plan (7)* | |
| 10.5 | Employment Contract, dated November 22, 1999, between Nicholas Financial, Inc. and Ralph Finkenbrink, Senior Vice President of Finance (8)* | |
| 10.6 | Employment Contract, dated March 16, 2001, between Nicholas Financial, Inc. and Peter L. Vosotas, President and Chief Executive Officer (9)* | |
| 10.7 | Summary of Fiscal 2012/2013 Annual Incentive Programs | |
| 10.8 | Form of Dealer Agreement and Schedule thereto listing dealers that are parties to such agreements | |
| 10.9 | Nicholas Financial, Inc. Equity Incentive Plan (10) * | |
| 10.10 | Form of Nicholas Financial, Inc. Equity Incentive Plan Stock Option Award (11)* | |
| 10.11 | Form of Nicholas Financial, Inc. Equity Incentive Plan Restricted Stock Award (12)* | |
| 10.12 | Form of Nicholas Financial, Inc. Equity Incentive Plan Performance Share Award (13)* | |
| 14 | Code of Ethics for Chief Executive Officer and Senior Financial Officers | |
| 21 | Subsidiaries of Nicholas Financial, Inc. (14) | |
| 23 | Consent of Dixon Hughes Goodman LLP | |
| 24 | Powers of Attorney (included on signature page hereto) | |
| 31.1 | Certification of President and Chief Executive Officer | |
| 31.2 | Certification of Senior Vice President and Chief Financial Officer | |
| 32.1 | Certification of the Chief Executive Officer Pursuant to 18 U.S.C. § 1350 | |
| 32.2 | Certification of the Chief Financial Officer Pursuant to 18 U.S.C. § 1350 | |
| 101.INS | XBRL Instance Document. | |
| 101.SCH | XBRL Taxonomy Extension Schema Document. | |
| 101.CAL | XBRL Taxonomy Extension Calculation Linkbase Document. | |
| 101.LAB | XBRL Taxonomy Extension Label Linkbase Document. | |
| 101.PRE | XBRL Taxonomy Extension Presentation Linkbase Document. | |
| 101.DEF | XBRL Taxonomy Extension Definition Linkbase Document. | |
51
Table of Contents
| * | Represents a management contract or compensatory plan, contract or arrangement in which a director or named executive officer of the Company participated. |
| (1) | Incorporated by reference to Appendix B to the Company’s Proxy Statement and Information Circular for the 2006 Annual General Meeting of Shareholders filed with the SEC on June 30, 2006 (File No. 0-26680). |
| (2) | Incorporated by reference to Exhibit 4.2 to the Company’s Registration Statement on Form S-8 filed with the SEC on May 24, 2007 (SEC File No. 0-26680). |
| (3) | Incorporated by reference to Exhibit 4 to the Company’s Annual Report on Form 10-KSB for the fiscal year ended March 31, 2004, as filed with the SEC on June 29, 2004. |
| (4) | Incorporated by reference to Exhibit 10.1 to the Company’s Amendment No. 1 to Quarterly Report on Form 10-Q/A for the fiscal quarter ended December 31, 2009 filed with the SEC on March 23, 2010. |
| (5) | Incorporated by reference to Exhibit 10.1.1 to the Company’s Quarterly Report on Form 10-Q for the fiscal quarter ended September 30, 2011 filed with the SEC on November 9, 2011. |
| (6) | Incorporated by reference to Exhibit 4 to the Company’s Registration Statement on Form S-8 filed with the SEC on June 30, 1999 (SEC File No. 333-81967). |
| (7) | Incorporated by reference to Exhibit 4 to the Company’s Registration Statement on Form S-8 filed with the SEC on June 30, 1999 (SEC File No. 333-81961). |
| (8) | Incorporated by reference to Exhibit 10.7 to the Company’s Registration Statement on Form S-2 (Reg. No. 333-113215) filed with the SEC on March 2, 2004. |
| (9) | Incorporated by reference to Exhibit 10.8 to the Company’s Registration Statement on Form S-2 (Reg. No. 333-113215) filed with the SEC on March 2, 2004. |
| (10) | Incorporated by reference to Appendix A to the Company’s Proxy Statement and Information Circular for the 2006 Annual General Meeting of Shareholders filed with the SEC on June 30, 2006. |
| (11) | Incorporated by reference to Exhibit 4.4 to the Company’s Registration Statement on Form S-8 filed with the SEC on May 24, 2007 (Reg. No. 333-143245). |
| (12) | Incorporated by reference to Exhibit 4.5 to the Company’s Registration Statement on Form S-8 filed with the SEC on May 24, 2007 (Reg. No. 333-143245). |
| (13) | Incorporated by reference to Exhibit 4.6 to the Company’s Registration Statement on Form S-8 filed with the SEC on May 24, 2007 (Reg. No. 333-143245). |
| (14) | Incorporated by reference to Exhibit 21 to the Company’s Annual Report on Form 10-KSB for the fiscal year ended March 31, 2004, as filed with the SEC on June 29, 2004. |
52
Table of Contents
SIGNATURES
Pursuant to the requirements of Section 13 or 15(d) of the Securities Exchange Act of 1934, the Registrant has duly caused this Report to be signed on its behalf by the undersigned, thereunto duly authorized.
| NICHOLAS FINANCIAL, INC. | ||||||
| Dated: June 14, 2012 | ||||||
| By: | /s/ Peter L. Vosotas | |||||
| Peter L. Vosotas | ||||||
| Chairman of the Board, Chief Executive Officer and President | ||||||
KNOW ALL MEN BY THESE PRESENTS that each person whose signature appears below constitutes and appoints Peter L. Vosotas and Ralph T. Finkenbrink, and each of them, his true and lawful attorneys-in-fact and agents, with full power of substitution and resubstitution, for him and in his name, place and stead, in any and all capacities, to sign any and all amendments to this Report, and to file the same, with all exhibits thereto, and any other documents in connection therewith, with the U.S. Securities and Exchange Commission, granting unto said attorneys-in-fact and agents, and each of them, full power and authority to perform each and every act and thing requisite and necessary to be done in and about the premises, as fully to all intents and purposes as he might or could do in person, hereby ratifying and confirming all that said attorney-in-fact and agents or either of them, or their substitutes, may lawfully do or cause to be done by virtue hereof.
Pursuant to the requirements of the Securities Exchange Act of 1934, this Report has been signed below by the following persons on behalf of the Registrant and in the capacities and on the dates indicated.
| Signature |
Title |
Date | ||
| /s/ Peter L. Vosotas |
Chairman of the Board, Chief Executive Officer, President and Director | June 14, 2012 | ||
| Peter L. Vosotas | ||||
| /s/ Ralph T. Finkenbrink |
Sr. Vice President – Finance, Chief Financial Officer, Chief Accounting Officer and Director | June 14, 2012 | ||
| Ralph T. Finkenbrink | ||||
| /s/ Stephen Bragin |
Director | June 14, 2012 | ||
| Stephen Bragin | ||||
| /s/ Alton R. Neal |
Director | June 14, 2012 | ||
| Alton R. Neal | ||||
| /s/ Scott Fink |
Director | June 14, 2012 | ||
| Scott Fink | ||||
53
Table of Contents
EXHIBIT INDEX
| Exhibit |
Description | |
| 3.1 | Articles of Nicholas Financial, Inc.* | |
| 3.2 | Notice of Articles of Nicholas Financial, Inc.* | |
| 4 | Form of Common Stock Certificate* | |
| 10.1 | Second Amended and Restated Loan and Security Agreement, dated January 12, 2010* | |
| 10.2 | Amendment No. 1 to Second Amended and Restated Loan and Security Agreement, dated September 1, 2011 | |
| 10.3 | Nicholas Financial, Inc. Employee Stock Option Plan* | |
| 10.4 | Nicholas Financial, Inc. Non-Employee Director Stock Option Plan* | |
| 10.5 | Employment Contract, dated November 22, 1999, between Nicholas Financial, Inc. and Ralph Finkenbrink, Senior Vice President of Finance* | |
| 10.6 | Employment Contract, dated March 16, 2001, between Nicholas Financial, Inc. and Peter L. Vosotas, President and Chief Executive Officer* | |
| 10.7 | Summary of Fiscal 2012/2013 Annual Incentive Bonus Programs | |
| 10.8 | Form of Dealer Agreement and Schedule thereto listing dealers that are parties to such agreements | |
| 10.9 | Nicholas Financial, Inc. Equity Incentive Plan* | |
| 10.10 | Form of Nicholas Financial, Inc. Equity Incentive Plan Stock Option Award* | |
| 10.11 | Form of Nicholas Financial, Inc. Equity Incentive Plan Restricted Stock Award* | |
| 10.12 | Form of Nicholas Financial, Inc. Equity Incentive Plan Performance Share Award* | |
| 14 | Code of Ethics for Chief Executive Officer and Senior Financial Officers | |
| 21 | Subsidiaries of Nicholas Financial, Inc.* | |
| 23 | Consent of Dixon Hughes Goodman LLP | |
| 24 | Powers of Attorney (included on signature page hereto) | |
| 31.1 | Certification of President and Chief Executive Officer | |
| 31.2 | Certification of Senior Vice President and Chief Financial Officer | |
| 32.1 | Certification of the Chief Executive Officer Pursuant to 18 U.S.C. §1350 | |
| 32.2 | Certification of the Chief Financial Officer Pursuant to 18 U.S.C. §1350 | |
| 101.INS | XBRL Instance Document. | |
| 101.SCH | XBRL Taxonomy Extension Schema Document. | |
| 101.CAL | XBRL Taxonomy Extension Calculation Linkbase Document. | |
| 101.LAB | XBRL Taxonomy Extension Label Linkbase Document. | |
| 101.PRE | XBRL Taxonomy Extension Presentation Linkbase Document. | |
| 101.DEF | XBRL Taxonomy Extension Definition Linkbase Document. | |
| * | Incorporated by reference. |