Attached files
| file | filename |
|---|---|
| 8-K - FORM 8-K - Addus HomeCare Corp | d365712d8k.htm |
 Sidoti
& Company Investment Conference
June 2012
Exhibit 99.1 |
 2
Mission Statement
It is the primary mission of Addus HealthCare to improve the health and well
being of our consumers through the provision of quality, cost-effective health
care services.
We will accomplish our goals by fostering an environment in which our
employees enthusiastically support and advance our mission.
Reward for accomplishing our mission includes pride in our organization,
contribution to the community and a reasonable profit.
|
 Forward-Looking Statements
3
The following information contains, or may be deemed to contain, forward-looking
statements. By their nature, forward-looking statements involve risks and
uncertainties because they relate to events and depend on circumstances that may
or may not occur in
the future. The future results of Addus may vary from the results expressed in,
or implied by, the following forward-looking statements, possibly to a
material degree, and historical results may not be an indication of future
performance. For a discussion of some of the important factors that could
cause Addus' results to differ from those expressed in, or implied by, the
following forward-looking statements, please refer to Addus’ most
recent Annual Report on Form 10-K, and its Quarterly reports on Form
10-Q, each of which is available at www.SEC.gov, particularly the Sections entitled
“Risk Factors”. Addus undertakes no obligation to update or
revise any forward-looking statements, except as may be required by law. |
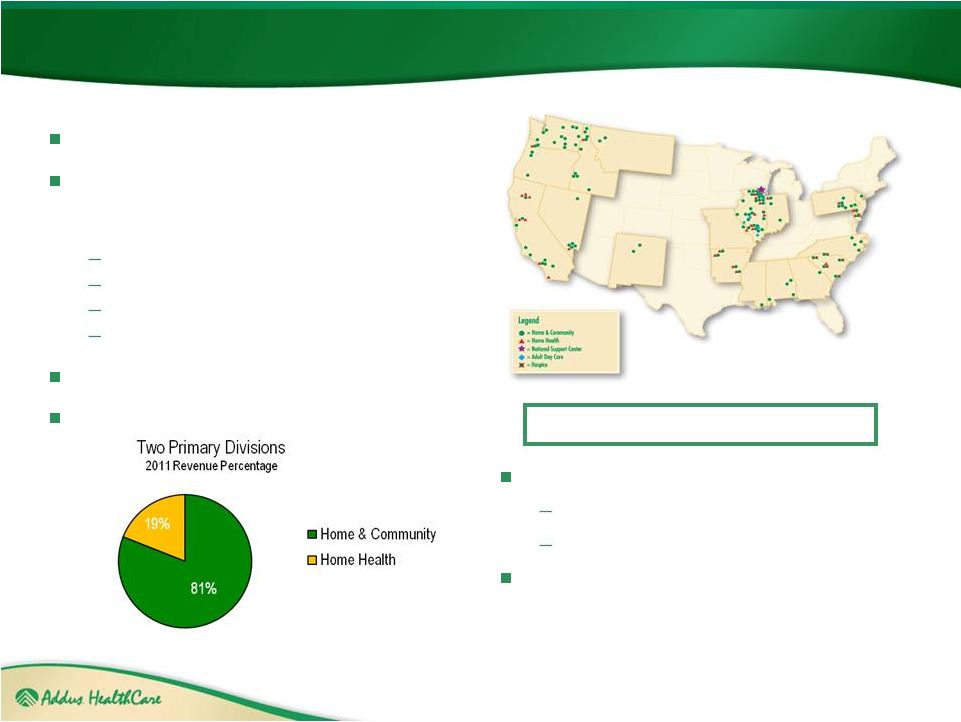 About
Addus Founded in 1979
Comprehensive provider of social and medical
services in the home, focused primarily on the
Dual Eligible population:
Personal Care
Home Health
Private Duty
Adult Day Service
13,000+ employees
26,000+ consumers (many dual eligible)
4
Diversified payor base (200+ payors)
Largest
payor
-
43%
of
2011
total
revenues
Medicare -
12% of 2011 total revenues
2011 revenues of $273.1 million and Adjusted
EBITDA
of $15.2 million
_____________________________________
118 Locations Across 19 States
Note:
Adjusted EBITDA is defined as earnings before goodwill and intangible asset impairment
charge, revaluation of contingent consideration, net interest (income) expense,
taxes, depreciation, amortization, and stock-based compensation expense. Adjusted EBITDA is a performance measure used by
management that is not calculated under generally accepted accounting principles in
the United States (GAAP). It should not be considered in isolation or as
a substitute for net income, operating income or any other measure of financial performance calculated in accordance with GAAP. |
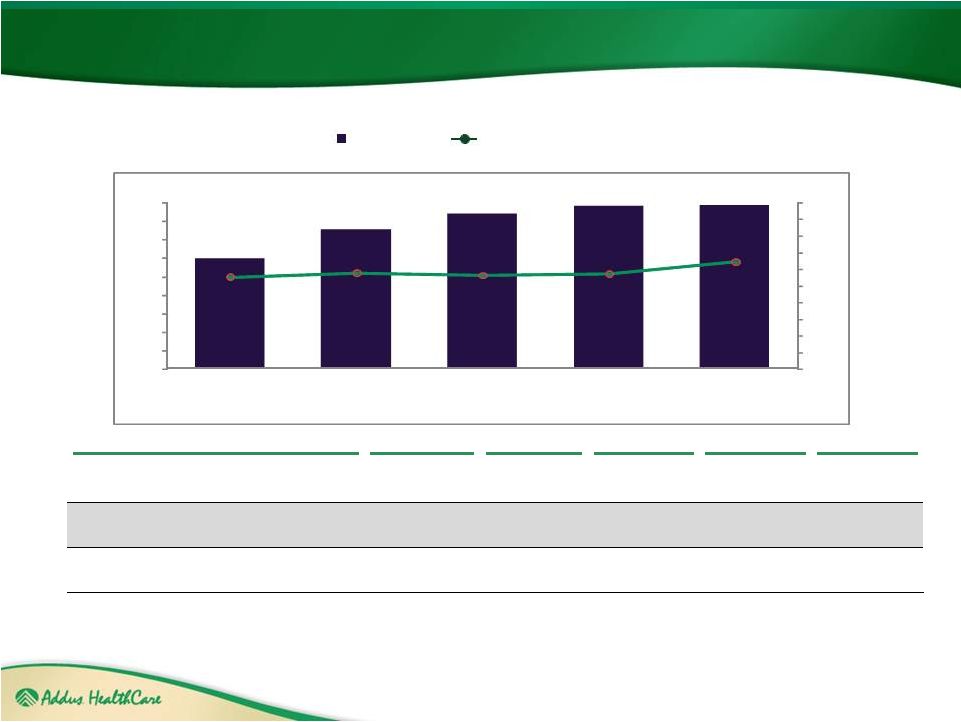
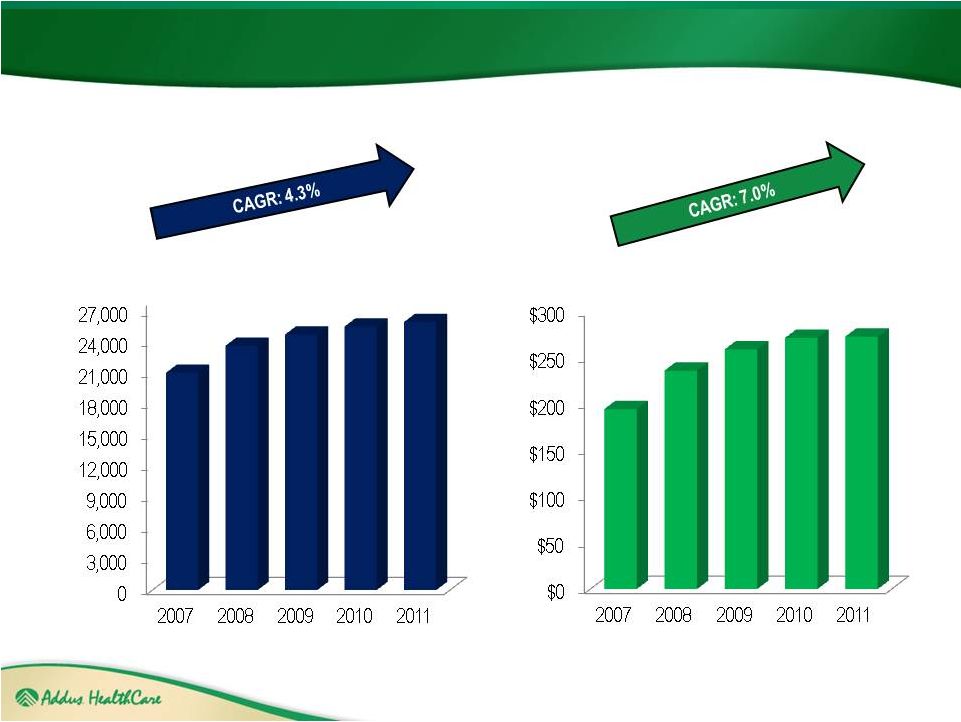 Average
Census and Revenue Trends 5
Revenues
(millions)
Average Census
(# of clients) |
 Our
Clients Facts: Nearly
75%
of
those
who
live
to
85
will
eventually
need
assistance
at
home.
Approximately 50% of US healthcare spending is concentrated in 5% of the
population. 97% of healthcare spending is concentrated on 50% of the
population. 6
Addus provides care for the 5% of the population that is the most costly!
Source: Kaiser Family Foundation calculations using data from U.S.
Department of Health and Human Services, Agency for Healthcare Research and
Quality, Medical Expenditure Panel Survey (MEPS), 2007 |
 Addus
Client Profile and Economics 7
Note: Data as of December 31, 2011
(1)
Home & Community revenues for the calendar year 2011 of $221.5 million divided by
average weekly census for 2011 of 22,786 divided by 12 months multiplied by 20 months.
(2)
Based on average Medicare revenues per episode completed for calendar 2011
of $2,399 and average length of service of 2.7 months. (3)
Gross Margin as a percentage of revenue base on the year ended December 31, 2011.
Home &
Home
Community
Health
Average length of Service
20 months
2.7 months
Average Reimbursement per Client
$16,199
(1)
$3,199
(2)
Gross Profit per Client Episode
$4,244
$1,468
Gross Margin Percentage
26.2%
45.9% |
 Trends
& Preferences 10,000 Americans Turn 65 Every Day!
U.S. Population Age 65 +
(Millions))
Delivery of Care Preferences Age 50+
0.0
10.0
20.0
30.0
40.0
50.0
60.0
70.0
80.0
90.0
100.0
2000
2010
2020
2030
2040
2050
13%
87%
Everyday Activities
Institutional Care
Home Care
27%
73%
24-Hour Help
Institutional Care
Home Care
8
Source: Wan He, Manisha Sangupta, Victoria A. Velkoff and Kimberly A. DeBarros.
National Institute on Aging Report: “ 65+ in the United States:
2005,” (December 2005).
Source: Mary Jo Gibson. AARP Public Policy Institute: “ Beyond 50 2003: A
Report to the Nation on Independent Living and Disability,”
http://assets.aarp.org/rgcenter/il/beyond_50_il_1.pdf. Note: Home Care
includes care administered in the home by friends, family, or an agency. Institutional care includes
care that is provided in an assisted living or residential setting, nursing home or
other. |
 9
Growth in Long-Term Care Expenditures
.
SOURCE: KCMU and Urban Institute analysis of HCFA/CMS-64 data. June 2011
Medicaid
Long
Term
Care
Expenditures
Medicaid Spending per
Beneficiary
Source: Kassner, Reinhard, Fox-Grage, Houser, Accius,
Coleman and Milne. AARP Public Policy Institute: “A
Balancing
Act:
State
Long-TermCare
Reform,
”July2008
$0.00
$10.00
$20.00
$30.00
$40.00
$50.00
$60.00
$70.00
$80.00
1990
1995
2000
2002
2004
2006
2008
2009
Institutional Care Expenditures
(Billions)
Home & Community Based Services Expenditures
(Billions)
$24,500
$9,200
$0
$5,000
$10,000
$15,000
$20,000
$25,000
$30,000
Nursing Home
Home Care |
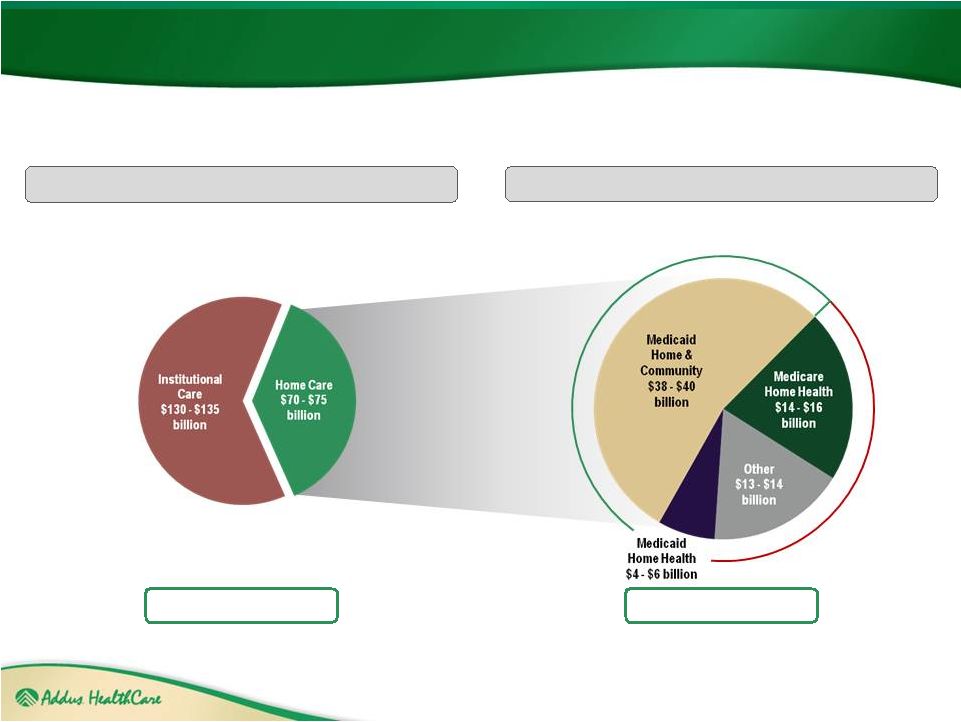 Current
Market Opportunity 10
$200 -
$210 billion
$70 -
$75 billion
Home Care Market
Long-Term Care Market
Social
Funding
Medical
Funding
Source: Company estimates based on: Georgetown University Long-Term Care
Financing Project. “Medicare and Long-Term Care,” (February 2007), http://ltc.georgetown.edu/pdfs/medicare0207.pdf and
Center for Medicare and Medicaid Services. “National Health Expenditure
Projections 2008-2018,” http://www.cms.hhs.gov/NationalHealthExpendData/downloads/proj2008.pdf, and MedPAC. “A Data Book:
Healthcare spending and the Medicare program: June 2010,”
http://www.medpac.gov/chapters/Jun09DataBookSec9.pdf. |
 Addus
Positioned to Excel Under Healthcare Reform 11
Addus Dual Advantage SM
“The Pre-Acute Solution . . . .
to
the
Post-Acute
Problem”
SM |
 Dual
Eligible – What is the Opportunity?
Medicare Program
Medicaid Programs
12
Pilot Program Features / Objectives
Sources: Kaiser Commission on Medicaid and the Uninsured, May 2011
Populations 65+ years
Hospital Services (Part A)
Post Acute Care SNF / Rehab
Duals Represent 36% of Total Medicare
Spending
Professional Services (Part B)
Post acute Home Care Services
Prescription Services (Part D)
Populations 65+ years w Income limits
Home Based Personal Care
Long term Nursing Home Care
Duals Represent 39% of Total Medicaid
Spending
70% of Medicaid Spending is for Long Term
Care
Total $300 Billion in annual spending for dual eligible enrollees in 2007
Funding for both programs administered through the States
26 States have indicated they will participate over the next 3 years
Each State will decide on the size, nature and timing of the pilots
Approximately 3.2 million covered lives of an estimated 9 million lives to be in
pilots Bids are being solicited from multiple “Managed Care
Companies” Health Plan Secondary Objectives:
Keep member functioning in the home environment
Avoid / lower the cost for Acute Care services
Stated Objectives - Eliminate service duplication / streamline administration |
 MCO Plans/Programs
already implemented
2013 Implementation
Plans
2014 Implementation
Plans
No Implementation
Plans
Addus location(s)
Dual Eligible Programs –
State Strategies
Source: Kaiser Commission on Medicaid and the Uninsured, May 2012
|
 14
The Current Delivery System
LOW
HIGH
Home
Personal
Care
Services
Home Health
Care
Services
PCP
Outpatient
Health Home
Skilled
Nursing &
Inpatient
Rehab
Long-Term
Acute Care
Facility
Acute Care
Hospital
COSTS
•
The current system "silos" provide care with little communication between
the pre and post-acute disciplines, resulting in a lack of continuity,
which means great opportunity to improve outcomes •
Existing infrastructure fails to manage the Member along the pre-acute
continuum
Low
Health Care Costs
High
“Pre-acute Continuum” |
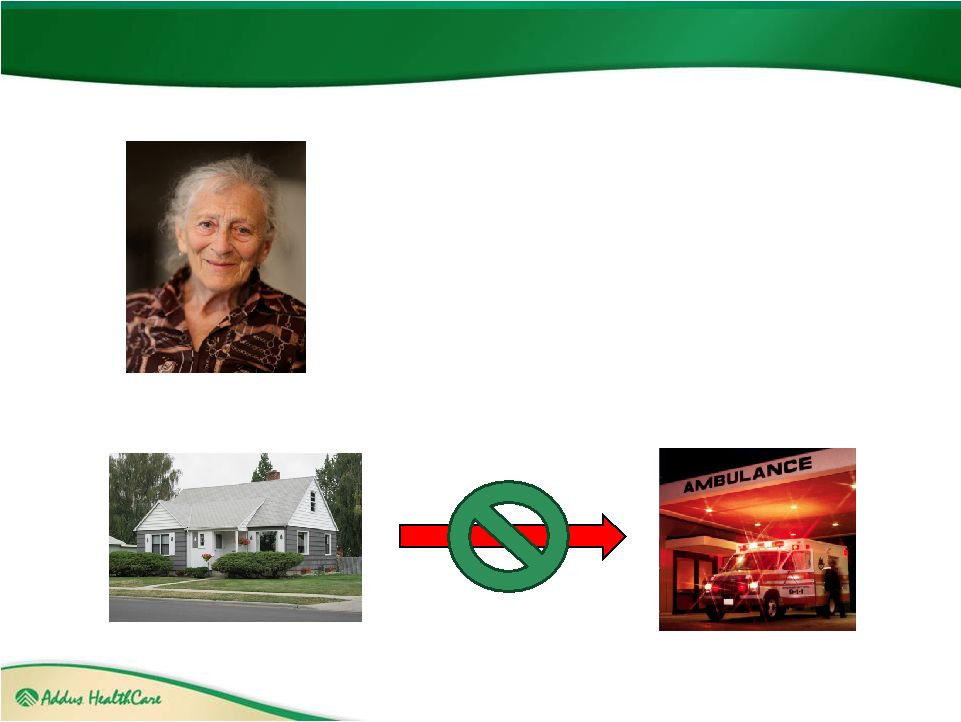
 15
Health Plan’s Nightmare -
$9,200 vs. $93,000
In-Home Personal
Care
$9,200/year
Emergency
Room
$1,700/visit
Acute Care Hospital
$37,500/stay
Rehab Facility
$28,500/stay
Nursing Home
$24,000/year
Vs.
Ambulance
$1,000/ride
Total Episodic Cost
& one-year of
Nursing Home
$92,700
Sources: Consumer Health Ratings.com
CMS.gov |
 16
Addus
Home
Care Aide
Addus Home
Health
Clinicians
Addus
Call
Center
Primary
Care
Physician
Health Plan
Case
Manager
Advocacy
Groups
Pharmacy
Family
Community
Resources
Home Care -
Integrated Clinical Strategy Begins In The Home |
 The Addus
Difference – Integrated Pre-Acute Services
•
Continuous monitoring of client / member medical
condition(s)
•
Coordination of medical care with healthcare team
•
Early identification of disease processes
•
Early intervention / lower costs
•
Reduced pain and suffering
•
Improved quality of life
•
Lower costs
17
Addus Integrated Pre-Acute Services: |
 18
The Addus Difference –
A Care Management Extension Model |
 Results
. . . and the results are!
19 |
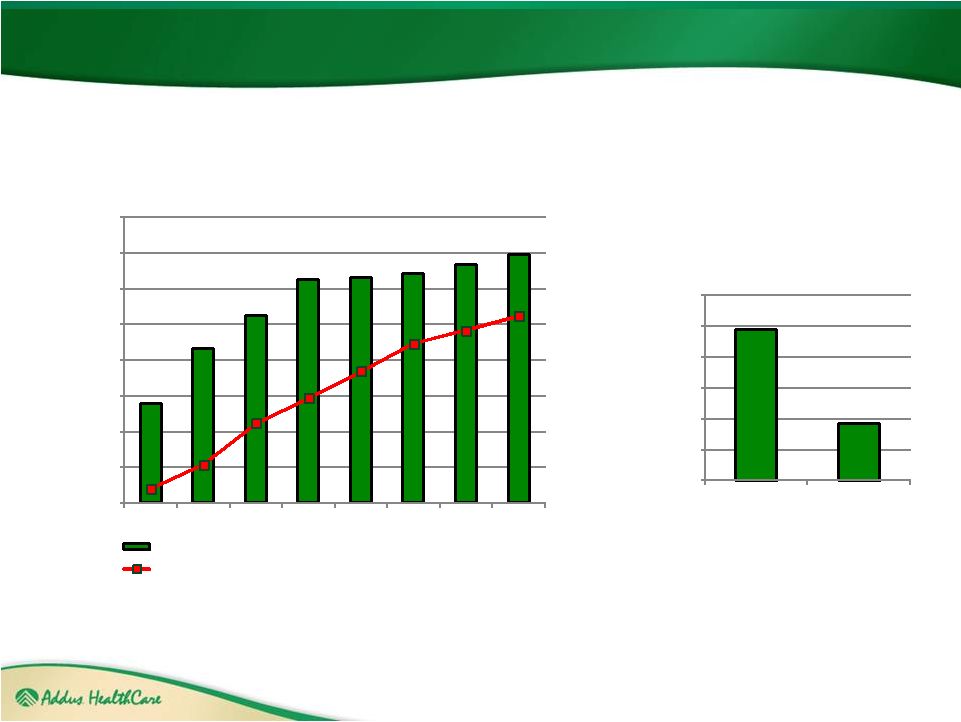
 20
Results -
Home Care Programs Improve Outcomes
Source: CCP Cost Effectiveness: Comparison of CCP growth with Nursing
Facility Prevalence Reductions HCBS Strategies Inc. February 10,
2010 Illinois Residents Age 75+
Total vs. Nursing Home Population
HCBS Strategies: Illinois Study Reveals Significant Savings
Conclusions:
Over a 28-year period, corresponding to
the development of the State’s
“Community Care” Home Care Program:
•
The nursing home population of
residents over age 75 declined by
8% in spite of the total 75+ population
increasing by 54%.
•
The study suggests that 2008 State
and Federal annual Nursing Home
Savings in Illinois equated to $799
million
. |
 21
Results -
Home Care Programs Improve Outcomes
Source: Coming of Age: Tracking the Progress and Challenges of Delivering
Long-Term Services and Supports in Ohio Scripps Gerontology Center, Miami
University of Ohio, June 2011 Conclusions:
Over a 12-year period corresponding
to the State’s “Passport”
Home Care
Program:
Ohio Residents Age 60+
Total vs. Nursing Home Population
Scripps Gerontology Center: Ohio Study Reveals Significant Savings
2300000
2250000
2200000
2150000
2100000
2050000
2000000
1950000
1900000
1850000
1800000
1750000
50000
48000
46000
44000
42000
40000
38000
36000
2009
1997
The nursing home population of
residents over age 60 declined by
14.5% in spite of the total 60+
population increasing by 15%.
The study suggests that the State’s
annual Nursing Home Savings
equates to $541 Million.
Ohio 60+ Population
Medicaid 60+ Nursing Home Population |
 Financial
Update – First Quarter 2012
22
Summary Financial Information
First Quarter 2012 |
 First
Quarter 2012 Summary Total net service revenues up 1.6% to $66.8M
Home & Community increased 5.1% to $56.9M
Home Health decreased 6.6% to $11.9M after considering the one-time adjustment to
accrued Medicare estimates of $0.9M
Adjusted EBITDA of $2.2M, compared to $3.0M in Q1 2011
Net income of $0.6M, or $0.06 per diluted share, compared to $0.9M, or
$0.08 per diluted share in 2011
Cash flows used in operations were $1.3M, compared to $11.5M generated
from operations in Q1 2011. Subsequent to the Quarter end we received
$16.0M in payments from the State of Illinois above normal levels.
Accounts receivable DSO were 96 days compared to 94 days as of
December 31, 2011
23 |
 Condensed
Consolidated Statements of Income 24
($ in millions
except per share amounts)
2007
2008
2009
2010
2011
(1)
3/31/2011
3/31/2012
(2)
Net service revenues
194.6
$
236.3
$
259.3
$
271.7
$
273.1
$
66.8
$
67.9
$
Gross profit
55.3
69.1
76.6
79.9
81.8
19.0
18.6
Gross profit %
28.4%
29.2%
29.5%
29.4%
30.0%
28.4%
27.4%
Total operating expenses
50.3
58.2
64.8
67.9
70
17.0
17.1
Net income
0.2
4
3.6
6
7.7
0.9
0.6
(3.7)
(0.3)
(1.8)
6.0
7.7
0.9
0.6
Earnings (loss) per share
(3.62)
$
(0.24)
$
(0.66)
$
0.57
$
0.72
$
0.08
$
0.06
$
For the Year Ended December 31,
For the Three Months Ended
(3)
Net income (loss)
attributable to common
(1) - - Total operating expenses and net income for 2011 excludes a $16.0
million goodwill and intangible asset impairment charge. Net income includes $2.3 million of Illinois
prompt payment interest income.
(2) - - Total operating expenses and net income for the first quarter of 2012
includes a $0.5 million gain on the sale of a Home Health agency. Net income includes $0.1 million
of Illinois prompt payment interest income.
(3) - - Three month amounts for 2011 and 2012 are unaudited.
|
 Home
& Community Segment 25
($ in millions)
Home & Community
12/31/2007
12/31/2008
12/31/2009
12/31/2010
12/31/2011
Average Census
18,527
21,032
21,844
22,598
22,786
Billable Hours (in thousands)
10,421
12,139
12,835
13,132
13,066
Reimbursement Rate per Billable Hour
$14.36
$15.57
$16.37
$16.81
$16.95
$149.6
$189.0
$210.1
$220.8
$221.5
11.1%
11.6%
11.3%
11.5%
12.9%
0.0%
2.0%
4.0%
6.0%
8.0%
10.0%
12.0%
14.0%
16.0%
18.0%
20.0%
$0.0
$25.0
$50.0
$75.0
$100.0
$125.0
$150.0
$175.0
$200.0
$225.0
CY 2007
CY 2008
CY 2009
CY 2010
CY 2011
(2)
Revenue
Division Pre-Corporate EBITDA Margin
(1)
(1)
Pre-Corporate EBITDA is defined as division operating income plus depreciation and
amortization. Pre-Corporate EBITDA margin is computed as the percentage of Pre-Corporate
EBITDA to revenue for the applicable period. Pre-Corporate EBITDA is a performance
measure used by management that is not calculated under generally accepted accounting
principles in the United States (GAAP). It should not be considered in isolation
or as a substitute for net income, operating income or any other measure of financial performance
calculated in accordance with GAAP. Pre-Corporate EBITDA margin is computed as the
percentage of Pre-Corporate EBITDA to revenue for the applicable period.
(2)
Includes incremental increase in bad debt expense of $1.5 million, recorded in the
fourth quarter of 2009. |
 Home
Health Segment 26
($ in millions)
Home Health
12/31/2007
12/31/2008
12/31/2009
12/31/2010
12/31/2011
Average Census
2,565
2,683
2,955
2,976
3,232
% of Medicare Revenues
55.1%
58.3%
61.3%
64.1%
64.8%
Medicare Episodic Amount
$2,563
$2,606
$2,569
$2,634
$2,399
(1)
Pre-Corporate EBITDA is defined as division operating income plus goodwill and
intangible asset impairment charge plus depreciation and amortization. Pre-Corporate EBITDA margin is
computed as the percentage of Pre-Corporate EBITDA to revenue for the applicable
period. Pre-Corporate EBITDA is a performance measure used by management that is not calculated
under generally accepted accounting principles in the United States (GAAP). It
should not be considered in isolation or as a substitute for net income, operating income or any other measure
of financial performance calculated in accordance with GAAP. Pre-Corporate EBITDA
margin is computed as the percentage of Pre-Corporate EBITDA to revenue for the applicable period.
(2)
Pre-Corporate EBITDA for 2011 excludes a $16.0 million goodwill and intangible
asset impairment charge. Division Pre-Corporate EBITDA Margin
(1)
Revenue
$44.9
$47.3
$49.2
$51.0
$51.6
10.5%
14.3%
15.3%
11.7%
4.2%
0.0%
2.0%
4.0%
6.0%
8.0%
10.0%
12.0%
14.0%
16.0%
18.0%
20.0%
$0.0
$10.0
$20.0
$30.0
$40.0
$50.0
CY 2007
CY 2008
CY 2009
CY 2010
CY 2011 (2) |
 Summary
Balance Sheet 27
($ in millions)
Key Balances
12/31/2010
12/31/2011
3/31/2012
Cash
$0.8
$2.0
$ 1.3
Accounts receivable, net
71.0
72.4
73.8
Total assets
166.9
154.7
154.4
Debt, including current maturities
45.2
31.5
31.9
Stockholders’
equity
88.1
86.4
87.1
Debt to capital ratio
33.9%
26.7%
26.8% |
 Investment Highlights
28
Multiple
Organic
Growth
Opportunities
Experienced
Management
Team
History of Growth through Acquisition
Significant
Operational
Scale
Across
National
Footprint
Positioned to Excel under Healthcare Reform
Differentiated, Integrated
Care
Model
Broad
Range
of
Services and Payors
Large & Growing Market |
 Pre-Corporate Divisional EBITDA by Reporting Segment
($ in millions)
29
Home & Community
Home Health
Note: Pre-Corporate EBITDA is defined as division operating income plus
goodwill and intangible asset impairment charge plus depreciation and amortization. Pre-Corporate EBITDA margin is computed as the percentage of
Pre-Corporate EBITDA to revenue for the applicable period. Pre-Corporate
EBITDA is a performance measure used by management that is not calculated under generally accepted accounting principles in the United
States
(GAAP).
It
should
not
be
considered
in
isolation
or
as
a
substitute
for
net
income,
operating
income
or
any
other
measure
of
financial
performance
calculated
in
accordance
with
GAAP.
3/31/2012 and 3/31/2011 amounts are unaudited.
(1)
Home Health division’s general & administrative expenses and Pre-Corporate
EBITDA for 2011 excludes a $16.0 million goodwill and intangible asset impairment charge.
(2)
Q1-2012 net service revenues and Division Pre-Corporate EBITDA for the
Home Health division includes a $0.9 million reduction of estimates of accrued Medicare revenues.
29
Year Ended
Three Months Ended
12/31/2007
12/31/2008
12/31/2009
12/31/2010
12/31/2011
3/31/2011
3/31/2012
Net Service Revenues
$149.6
$189.0
$210.1
$220.8
$221.5
$54.1
$56.9
Cost of Service Revenues
(113.8)
(141.8)
(156.6)
(164.6)
(163.4)
(40.8)
(42.6)
General & Administrative
(19.2)
(25.2)
(29.7)
(30.7)
(29.4)
(7.4)
(7.4)
Division Pre-Corporate EBITDA
$16.6
$22.0
$23.8
$25.5
$28.7
$5.9
$6.9
Year Ended
Three Months Ended
12/31/2007
12/31/2008
12/31/2009
12/31/2010
12/31/2011
(1)
3/31/2011
3/31/2012
(2)
Net Service Revenues
$44.9
$47.3
$49.2
$51.0
$51.6
$12.7
$11.0
Cost of Service Revenues
(25.5)
(25.4)
(26.1)
(27.2)
(27.9)
(7.0)
(6.7)
General & Administrative
(14.7)
(15.2)
(15.6)
(17.8)
(21.5)
(4.9)
(5.5)
$4.7
$6.7
$7.5
$6.0
$2.2
$0.8
$(1.2)
Division Pre-Corporate EBITDA |
 Adjusted
EBITDA Reconciliation 30
($ in millions)
Year Ended
Three Months Ended
12/31/2007
12/31/2008
12/31/2009
12/31/2010
12/31/2011
3/31/2011 (3)
3/31/2012 (3)
Net Income (loss)
$0.2
$4.0
$3.6
$6.0
$(2.0)
$0.9
$0.6
Goodwill and intangible asset
impairment charge
--
--
--
--
16.0
--
--
Revaluation of contingent
consideration
--
--
--
--
(0.5)
--
--
Interest Income
--
--
--
(0.2)
(2.2)
--
--
Interest Expense
4.8
5.8
6.8
3.2
2.5
0.7
0.4
Income Tax Expense
0.1
1.1
1.4
3.0
(2.5)
0.4
0.5
Depreciation & Amortization
6.0
6.1
4.9
4.0
3.6
0.9
0.6
Severance Costs Related to
Former Chairman
--
--
1.2
--
--
--
--
Stock-based Compensation
Expense
0.9
0.2
0.3
0.3
0.3
0.1
0.1
Adjusted EBITDA
$12.0
$17.2
$18.2
$16.3
$15.2
$3.0
$2.2
_____________________________________
(1)
Included as one-time charge associated with the Company’s IPO completed in
November 2009. (2)
Adjusted EBITDA is defined as earnings before goodwill and intangible asset impairment
charge, revaluation of contingent consideration, net interest (income) expense, taxes, depreciation, amortization, severance
costs for former employees, and stock-based compensation expense. Adjusted EBITDA
is a performance measure used by management that is not calculated under generally accepted accounting principles in the
United States (GAAP). It should not be considered in isolation or as a substitute
for net income, operating income or any other measure of financial performance calculated in accordance with GAAP.
(3)
3/31/2011 and 3/31/2012 amounts are unaudited.
(2)
(1) |
 Divisional EBITDA Reconciliation
31
($ in millions)
Home & Community
Home Health
Year Ended
Three Months Ended
12/31/2007
12/31/2008
12/31/2009
12/31/2010
12/31/2011
3/31/2011
3/31/2012
Operating Income
$12.7
$17.6
$20.4
$22.7
$26.2
$5.3
$6.4
Depreciation &
Amortization
3.9
4.4
3.4
2.8
2.4
0.6
0.5
Divisional
EBITDA
(1)
$16.6
$22.0
$23.8
$25.5
$2.86
$5.9
$6.9
Year Ended
Three Months Ended
12/31/2007
12/31/2008
12/31/2009
12/31/2010
12/31/2011
3/31/2011
3/31/2012
Operating Income (loss)
$3.5
$5.8
$6.8
$
5.3
$(14.2)
$0.7
$(1.2)
Goodwill and intangible
asset impairment charge
--
--
--
--
16.0
--
--
Depreciation &
Amortization
1.2
0.9
0.7
0.7
0.4
0.1
0.0
Divisional EBITDA
$4.7
$6.7
$7.5
$6.0
$2.2
$0.8
$(1.2)
(1) Divisional EBITDA is defined as divisional operating
income plus goodwill and intangible asset impairment charge, and depreciation and amortization. Divisional EBITDA is a performance measure used by
management that is not calculated under generally accepted accounting principles in the
United States (GAAP). It should not be considered in isolation or as a substitute for net income, operating income or any other
measure of financial performance calculated in accordance with GAAP.
(1) |