Attached files
| file | filename |
|---|---|
| 8-K - 8-K - PNC FINANCIAL SERVICES GROUP, INC. | d365749d8k.htm |
 The PNC
Financial Services Group, Inc. Morgan Stanley Financials Conference
June 12, 2012
Exhibit 99.1 |
 DRAFT
Cautionary Statement Regarding Forward-Looking
Information and Adjusted Information
This presentation includes “snapshot” information about PNC used by way of
illustration. It is not intended as a full business or financial review and
should be viewed in the context of all of the information made available by PNC in its SEC
filings. The presentation also contains forward-looking statements regarding
our outlook for earnings, revenues, expenses, capital levels and ratios, liquidity levels, asset levels, asset quality, financial
position, and other matters regarding or affecting PNC and its future business and
operations. Forward-looking statements are necessarily subject to numerous
assumptions, risks and uncertainties, which change over time. The forward-looking statements in this presentation are qualified by the factors affecting
forward-looking statements identified in the more detailed Cautionary Statement
included in the Appendix, which is included in the version of the presentation materials posted on our corporate website at
www.pnc.com/investorevents. We provide greater detail regarding some of these as well as
other factors in our 2011 Form 10-K, as amended by Amendment No. 1 thereto, and
first quarter 2012 Form 10-Q, including in the Risk Factors and Risk Management sections and in the Legal
Proceedings and Commitments and Guarantees Notes of the Notes to Consolidated Financial
Statements in those reports, and in our subsequent SEC filings. Our
forward-looking statements may also be subject to other risks and uncertainties, including those we may discuss in this presentation or
in SEC filings, accessible on the SEC’s website at www.sec.gov and on PNC’s
corporate website at www.pnc.com/secfilings. We have included web addresses in
this presentation as inactive textual references only. Information on these websites is not part of this presentation.
Future events or circumstances may change our outlook and may also affect the nature of the
assumptions, risks and uncertainties to which our forward-looking statements are
subject. Forward-looking statements in this presentation speak only as of the date of this presentation. We do not
assume any duty and do not undertake to update those statements. Actual results or
future events could differ, possibly materially, from those anticipated in
forward-looking statements, as well as from historical performance. In this presentation, we sometimes refer to adjusted results to help illustrate the impact of
certain types of items. This information supplements our results as reported in
accordance with GAAP and should not be viewed in isolation from, or as a substitute for, our GAAP results. We believe that
this additional information and the reconciliations we provide may be useful to investors,
analysts, regulators and others as they evaluate the impact of these respective items
on our results for the periods presented due to the extent to which the items may not be indicative of our ongoing
operations. We may also provide information on pretax pre-provision earnings (total
revenue less noninterest expense) and on tangible book value per share (calculated as
book value per share less total intangible assets, other than servicing rights, per share). We believe that pretax pre-
provision earnings, a non-GAAP measure, is useful as a tool to help evaluate our earnings
created by operating leverage. And we believe that tangible book value per share, a
non-GAAP measure, is useful as a tool to help to better evaluate growth of the company’s business apart from the
amount, on a per share basis, of intangible assets other than servicing rights included in
book value. Where applicable, we provide GAAP reconciliations for such additional
information, including in the Appendix and/or other slides on our corporate website at
www.pnc.com/investorevents.
In certain discussions, we may also provide information on yields and margins for all
interest-earning assets calculated using net interest income on a
taxable-equivalent basis by increasing the interest income earned on tax-exempt assets to make it fully equivalent to interest income earned on
taxable investments. We believe this adjustment may be useful when comparing yields and
margins for all earning assets. We may also use annualized, proforma, estimated
or third party numbers for illustrative or comparative purposes only. These may not reflect actual results.
This presentation may also include discussion of other non-GAAP financial measures, which,
to the extent not so qualified therein or in the Appendix, is qualified by GAAP
reconciliation information available on our corporate website at www.pnc.com under “About PNC–Investor Relations.”
|
 DRAFT
Today’s Discussion
Our successful business model positions us well for
the future
We have opportunities to capture organic growth
Our disciplined growth strategies provide
opportunities to deliver significant long-term
shareholder value
PNC Continues to Build a Great Company.
PNC Continues to Build a Great Company. |
 DRAFT
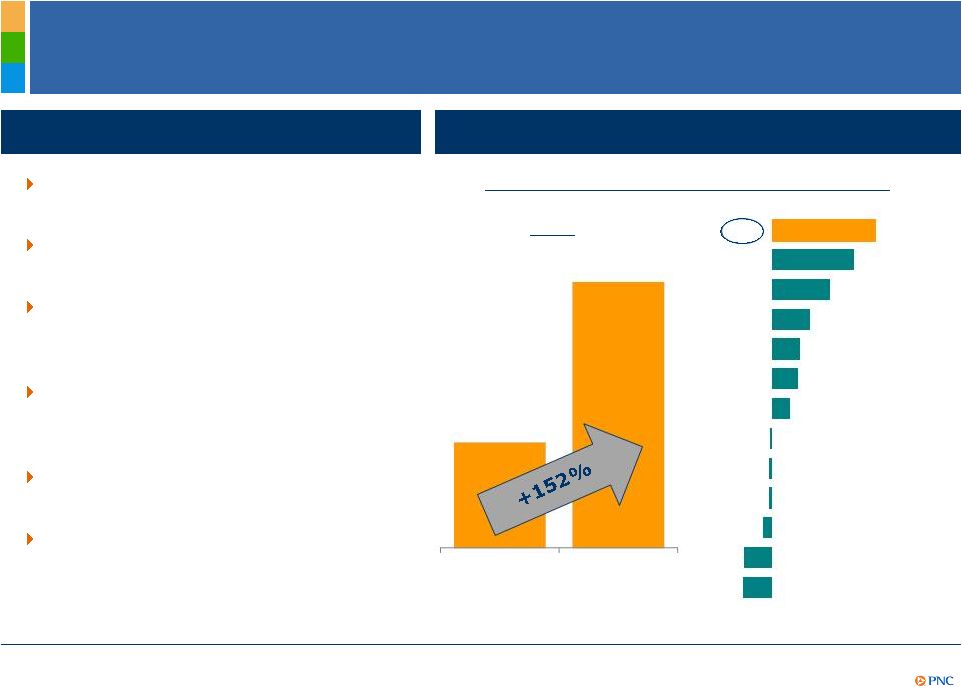
Executing Our Business Model has Delivered Value
CMA
BAC
FITB
STI
RF
KEY
$17.58
$44.27
Peer banks identified in the Appendix. Peer Source: SNL DataSource. (1) Tangible book value
per share calculated as book value per share less goodwill and certain other intangible
assets. Further information is provided in the Appendix. PNC
% change 12/31/2007 to 3/31/2012
Staying core funded and
disciplined in our deposit pricing
Committed to our moderate risk
philosophy
Leveraging customer relationships
and our strong brand to grow high
quality, diverse revenue streams
Creating positive operating
leverage while investing in
innovation
Remaining disciplined with our
capital
Executing on our strategies
Tangible book value per share
PNC’s successful business model
121%
86%
56%
41%
39%
27%
-3%
-4%
-5%
-14%
-41%
-43%
PNC
WFC
USB
JPM
COF
MTB
BBT
152%
12/31/2007
3/31/2012
1 |
 DRAFT
Our Franchise Provides Significant Opportunities for
Growth
PNC’s revenue growth strategies:
–
Expanding into large, faster growing markets with
successful Regional President “Go To Market”
strategy
–
Improving brand awareness to help drive customer
growth
–
Launching innovative new products that address client
needs
–
Improving cross-sell penetration
–
Repositioning our branches to capture greater share of
wallet
–
Capturing the investment and retirement assets
opportunity |
 DRAFT
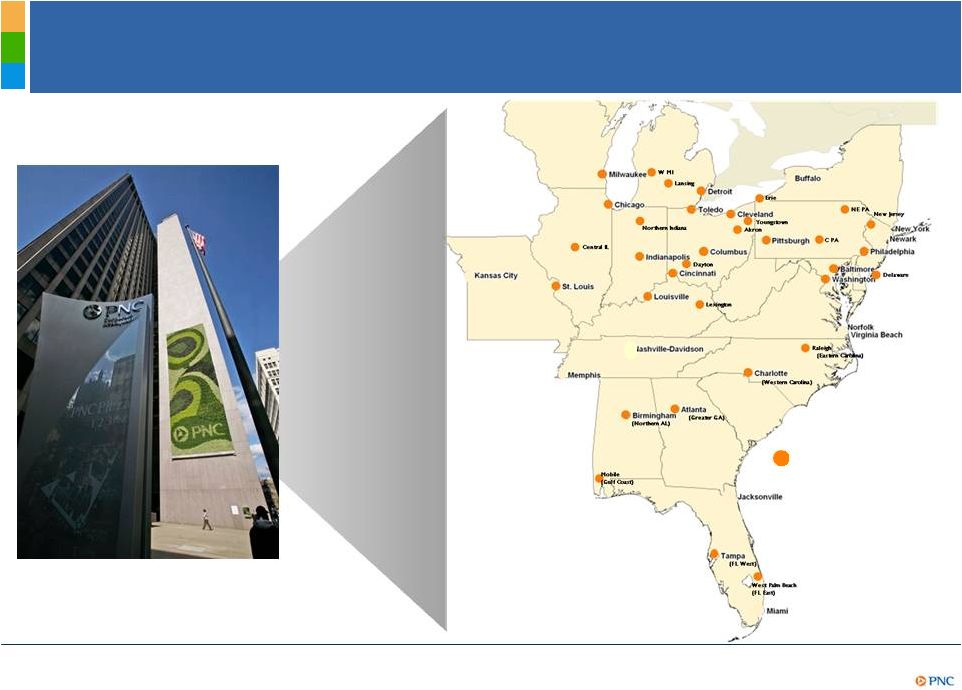
Regional Presidents Model Key to Delivering PNC’s
Capabilities to Local Markets
Connecting
large bank
products and
services to
local markets…
Regional Presidents
Markets |
 DRAFT
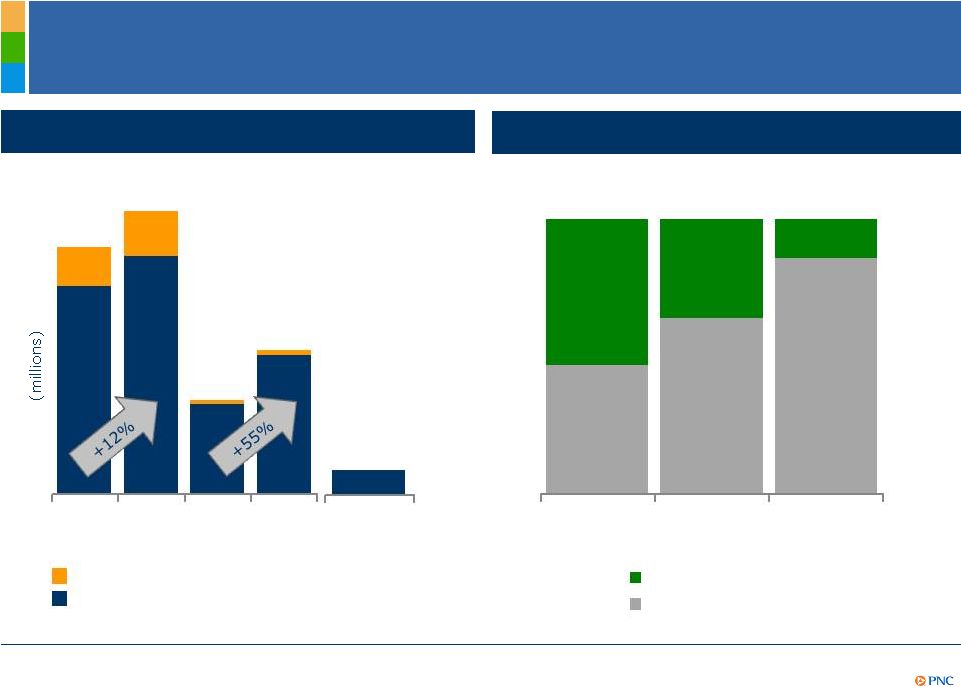
Expanding the PNC Model in Underpenetrated Markets
Philadelphia
Philadelphia
Chicago
RBC
markets
4
$xx
2010
2011
2010
2011
2012
$105
$118
$40
$62
AMG sales
Corporate Banking sales
RBC
markets
Chicago
Total Corporate Banking and AMG sales
Corporate Banking cross-sell sales by type
14
$
Non-
Credit Sales
Credit Sales
47%
64%
86%
53%
36%
14%
1
1
2
3
3
AMG refers to Asset Management Group. (1) Year over year total market sales. (2) RBC markets
defined as Eastern Carolina, Western Carolina, Greater Georgia, Northern Alabama and
Gulf Coast; March and April 2012 annualized revenues. AMG sales not yet significant to RBC
markets as we are in the build-out phase. (3) For the full year 2011. (4) March and April
2012. |
 DRAFT
Improving Brand Awareness and Customer Confidence
National Customer Confidence
PNC customer confidence
2
US
population
confidence
in
banking
industry
3
PNC’s Brand Awareness
1
Significant relative increase in PNC’s customer confidence
Investments in PNC’s brand producing results
55%
67%
75%
45%
55%
65%
75%
85%
2H 2009
2010
2011
53%
55%
56%
54%
58%
41%
32%
22%
23%
23%
2007
2008
2009
2010
2011
(1) Source: TNS Consumer Brand and Advertising Performance Research report dated as of 4Q11.
(2) Confidence is measured at PNC by asking “PNC is a name I can always
trust” and “PNC always delivers on what they promise.” A respondent is considered Confident if they
answer a “5” Strongly Agree to both items. Source: Gallup June 2011. (3) Confidence
is measured in the banking industry by asking ”Please tell me how much confidence
you, yourself, have in banks – a great deal, quite a lot, some, or very little?” Source: Gallup June 2011. |
 DRAFT
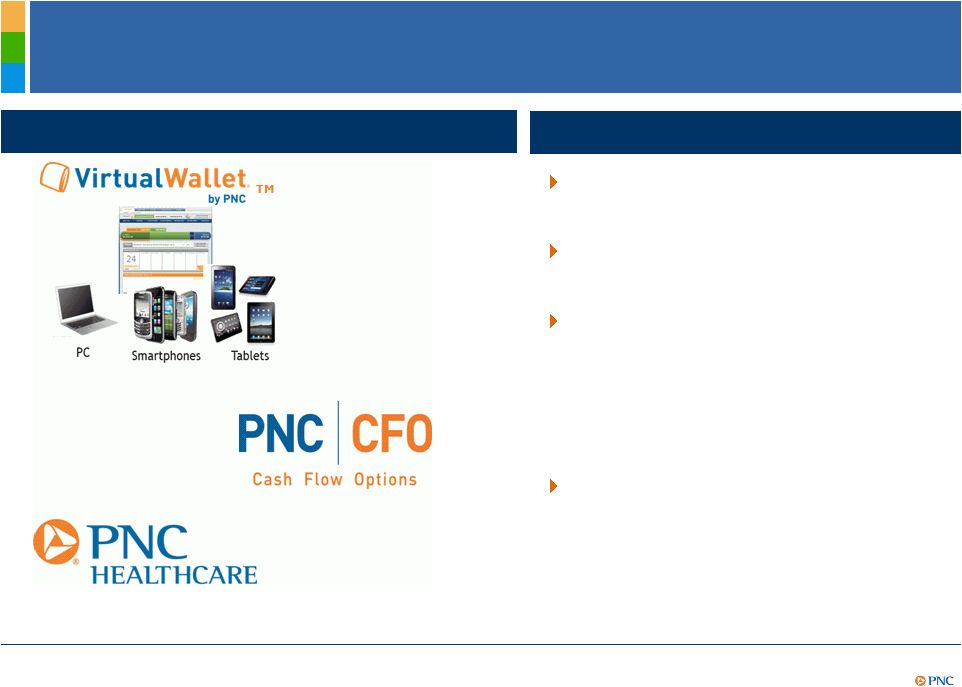
Launching New Products that Enhance Customer
Experience
Investing in technology across all
customer segments
Product innovation driving
customer growth
PNC’s customer service
differentiation:
–
Information organized based
on how customers think
–
Integrated experience
Giving customers choice
Driven by product innovation
Future service delivery model |
 DRAFT
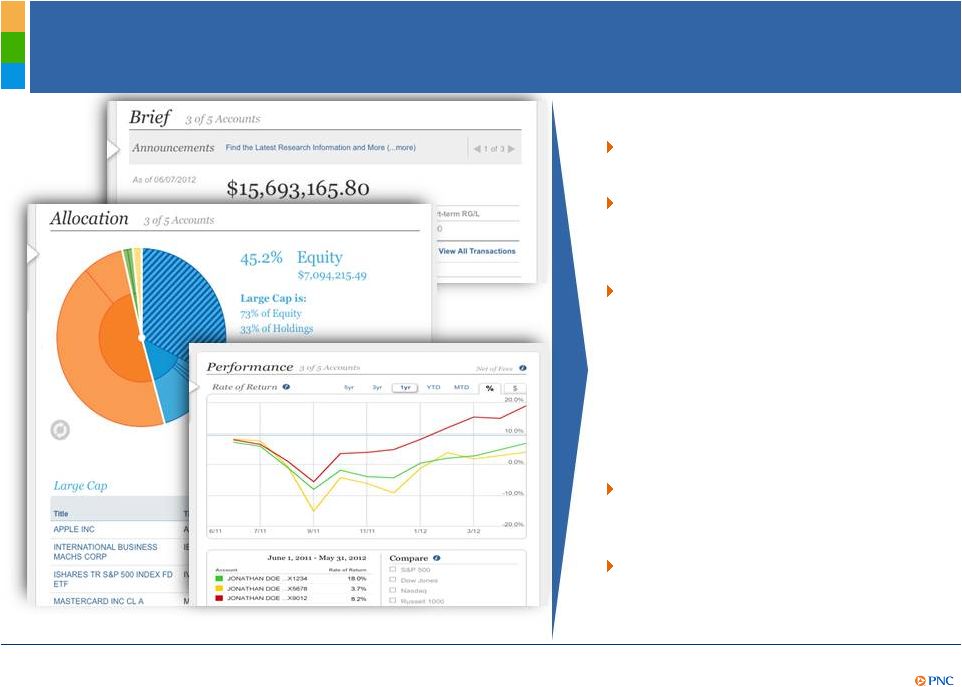
Launching New Products that Enhance Customer
Experience -
PNC Wealth Insight
®
Optimized for tablet and PC
Customer demand for
transparency, information
Launched last fall to Wealth
clients
–
70% adoption rate
Key features:
–
Aggregate and customize
–
Dynamic grouping
–
Personal rate of return
–
Integrated with banking
–
Collaborate with advisor
Recently recognized by
Forrester®, Change Sciences®
and CIO 100
Expanding to mass affluent |
 DRAFT
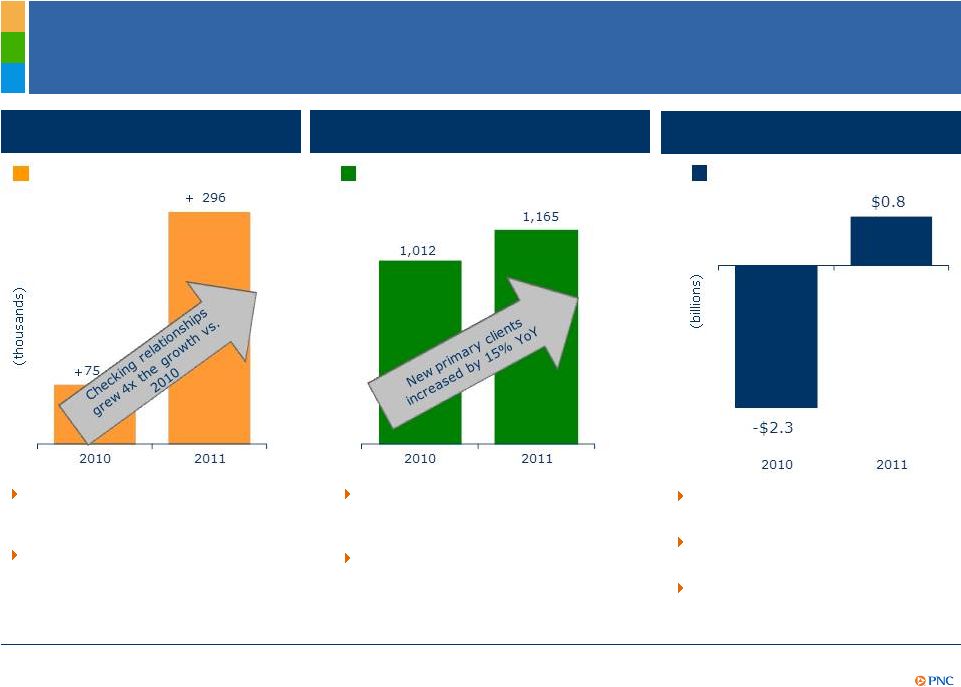
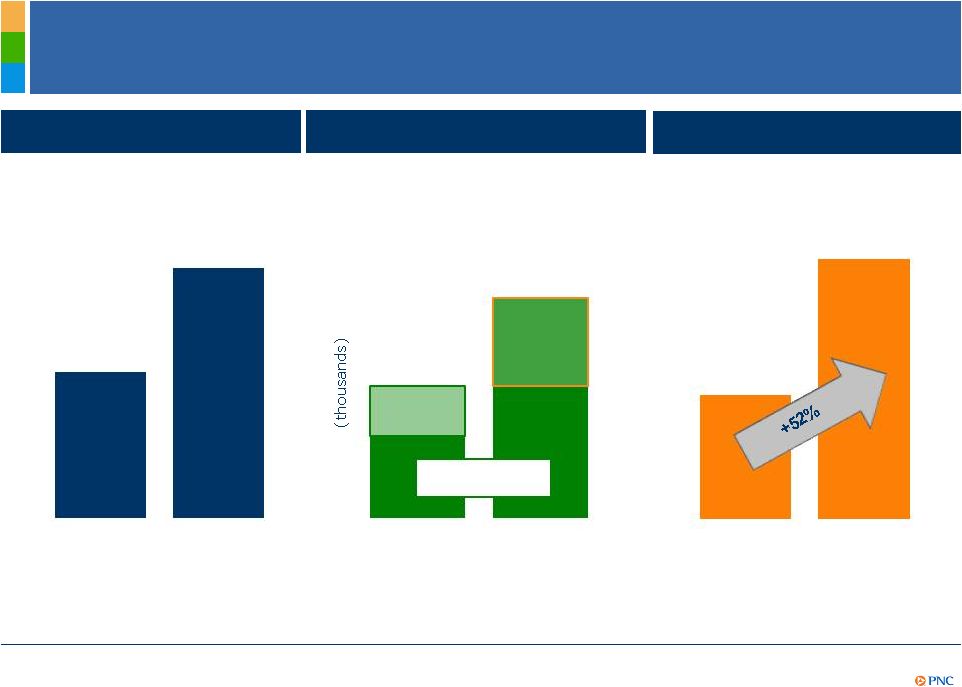
Growing Client Relationships
Asset Management Group
Retail Banking
Corporate & Institutional Banking
Discretionary AUM Total
Net Flows
4
2011
referral
sales
up
52%
vs.
2010
2011 new primary clients³
up 26%
vs. 2010
Total sales have increased by 38%
for 2011 vs. 2010
New clients represent 12% of total
existing primary clients at
December 31, 2011
Strong 2011 sales across all
markets and client segments
2011 total growth of 5.4%, greater
than 1.2% footprint population
growth
Active online bill payment customers
showed
total
growth²
of
2.4%
from
3Q11, 13% from 4Q10
Corporate Banking new primary
clients³
Checking relationship growth
1
5
(1) Checking relationship growth refers to consumer and small business accounts including
41,000 relationships acquired by acquisition in 2011. (2) Total growth includes 4,000
customer accounts acquired by acquisition in 2011. (3) A Corporate Banking primary client is defined as a
corporate banking relationship with annual revenue generation of $50,000 or more or, within
corporate banking, a commercial banking client relationship with annual revenue
generation of $10,000 or more. AMG primary client relationships are defined as client relationships with annual
revenue generation of $10,000 or more. (4) AUM refers to Assets Under Management. Total net
flows defined as net changes from clients including dividends received. (5) New client
sales referred to AMG by Retail Banking or C&IB. |
 DRAFT
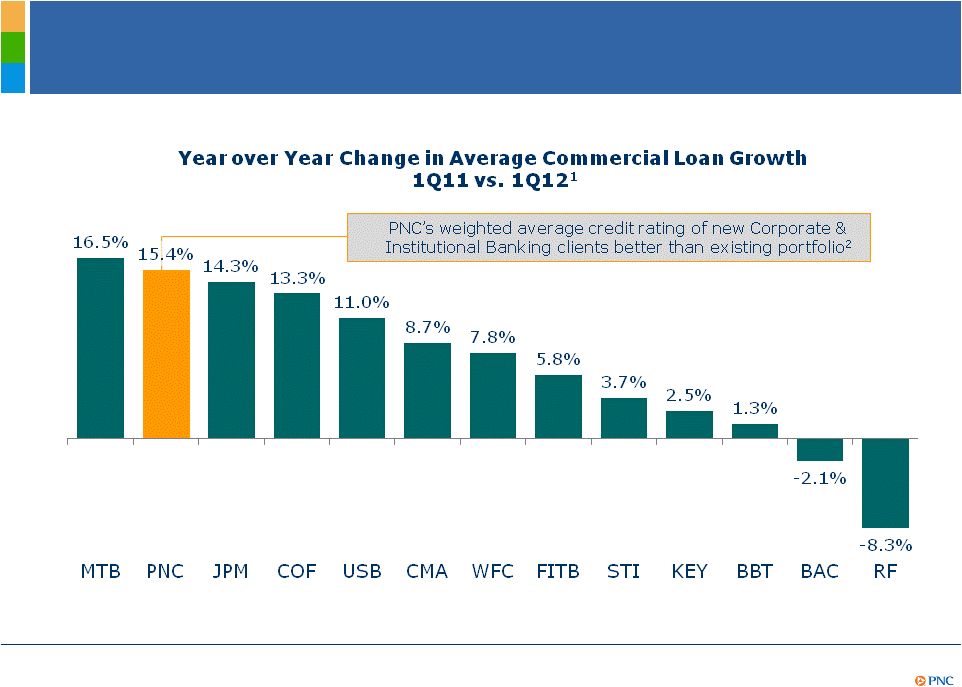
Generating Strong Commercial Loan Growth and
Gaining Share
(1) Peer Source: Company reports. JPM and COF loan growth reflects commercial banking segment
reported in company reports. PNC 1Q12 average commercial loan balance of $92,481
million includes impact of RBC Bank (USA) acquisition. PNC’s commercial loan balance includes
commercial,
commercial
real
estate
and
equipment
lease
financing.
(2)
New
Corporate
&
Institutional
Banking
clients
during
first
quarter
2012 include both organic client growth and acquired clients as part of the RBC Bank (USA)
transaction compared to existing client portfolio as of 12/31/2011.
|
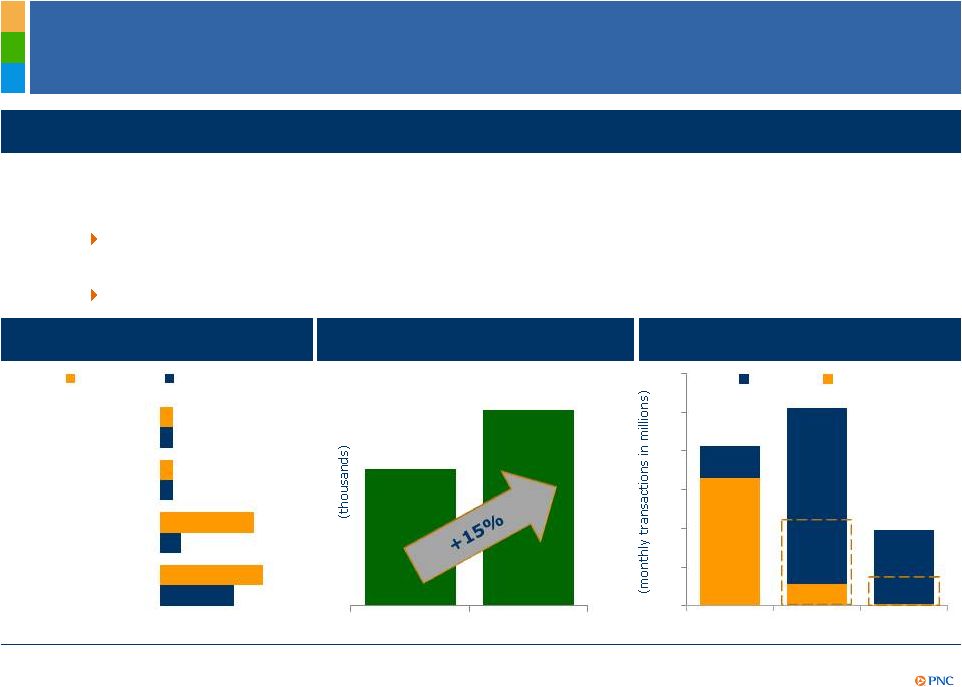
 DRAFT
(1) Percentage of new consumer households as measured within three months with a primary
checking account having at least two services and
one
additional
bank
deposit
or
loan
product
with
us.(2)
A
Corporate
Banking
primary
client
is
defined
as
a
corporate
banking
relationship
with annual revenue generation of $50,000 or more or, within corporate banking, a commercial
banking client relationship with annual revenue generation of $10,000 or more. (3)
Referral channel sales are new sales from clients referred to AMG by Retail Banking or Corporate
and Institutional Banking.
New retail banking consumer
household
cross-sell
penetration
Asset Management Group referral
channel
sales
Average revenue per average new
corporate
banking
primary
clients
$150
$250
Within 1 year
Actual
Within 3 years
Goal
34%
44%
2010
2011
Cross-sell
opportunity
38% non-
credit sales
Asset Management Group
Retail Banking
Corporate & Institutional Banking
2010
2011
$100
Average new
primary clients
Capturing Cross-Sell Opportunities
st
1
2
3 |
 DRAFT
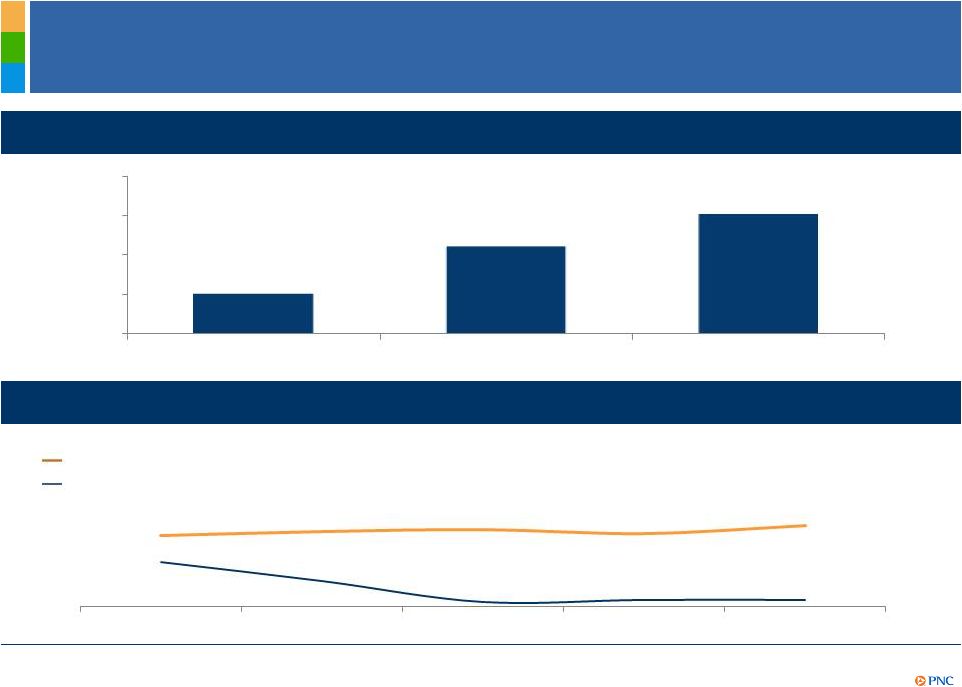
Changing Customer Behavior
Mobile
Online
ATM
Call center
Branch
U.S. banking transactions by channel (billions)
(1) Source: Tower Group, McKinsey & Company. (2) Source: Novantas. Represents the average
annual change measured in 2008-2011. U.S. branch transaction activity
(average annual change)
Deposit
Withdrawal
Check
Cashing
Total
-7% to -9%
-3% to -6%
-17% to -19%
-4% to -5%
Actual
Forecast
0
25
50
75
100
2003
2004
2005
2006
2007
2008
2009
2010
2011
2012
2013
1
2 |
 DRAFT
Serving Customers Tomorrow –
Lower Cost to Serve
Cost per transaction
Continue to deliver industry leading customer loyalties while we
evolve to a lower cost
structure
Lower cost to serve by migrating certain customer transactions toward lower cost
channels
Significant cost save opportunity with virtual sales kiosks and alternative formats
Active online banking
customers
1
ATM channel migration
opportunity
3,519
3,057
Goals
Withdrawals
Deposits
Check
cashing
40%
potential
20%
potential
(1) Active online banking customer is defined as a customer who has signed on at least once in
the past 3 months. 2010
2011
Teller
ATM
0
2
4
6
8
10
12
Branch
Call Center
ATM
Online/ Mobile
Business
Consumer |
 DRAFT
Serving Customers Tomorrow –
Grow Revenue
Approximately 20% of PNC’s customers are primarily non-branch transactors
–
Lower share of wallet relative to branch-heavy customers
–
Significant affluent opportunity
Use CIM across relevant channels to:
–
Offer higher margin products to Virtual Wallet customers
–
Cross-sell credit card
–
Offer review of investment and retirement plan
Significant opportunity to capture greater share of wallet
Use
customer
insights
about
transactional
behaviors
and
needs
to
inform
cross-channel
actions
Customer Interaction Management (CIM) capability enables delivery of targeted offers
Goals |
 DRAFT
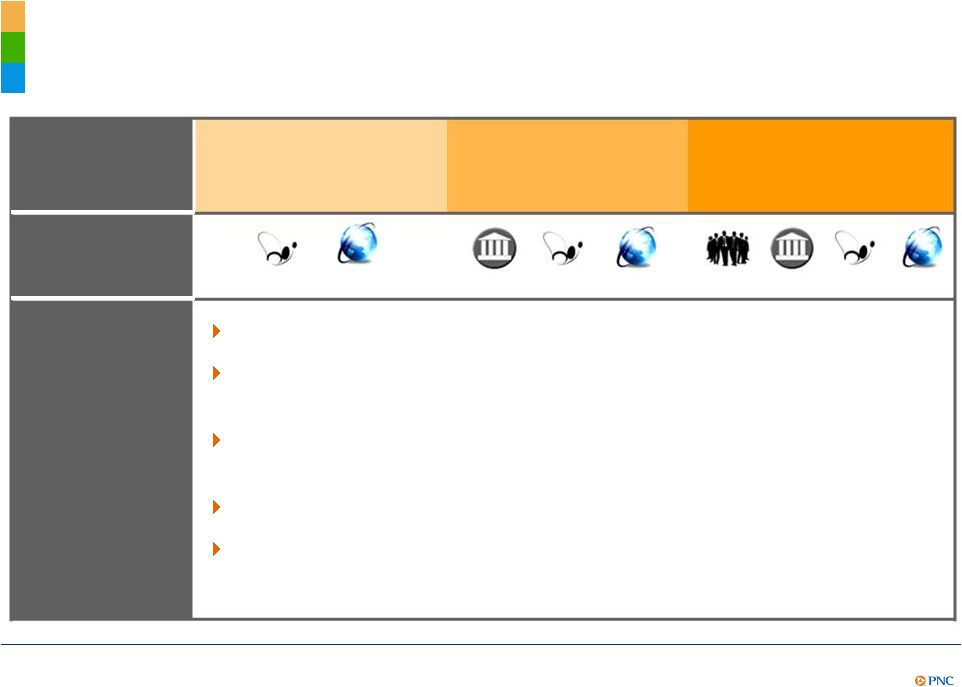
Branches to operate as a
team of customer
solution experts
Multiple physical formats
in the network
Differentiated experience
by customer segment
Integrated digital and call
center for sales and self-
service
Highlights
Extensive full
function ATM
network
Smaller special
segment “stores”
& kiosks
Remote sales
force specialists
Mobile stores,
street teams and
educational events
PNC’s Vision -
Branch as Part of our Future Network |
  DRAFT
Capturing the Investment and Retirement Assets
Opportunity
Client -
Focused
Mass Market
< $100K
Affluent
$100K
-
$1
MM
High Net Worth
> $1 MM
Differentiated
Multi
-Channel
Approach
“Go-to-Market”
Strategy
Focused on growth in all client segments
Diverse channel approach to deepen customer relationships and
share of wallet
Distinctive “concierge”
branch service model which directs
customers to appropriate channel for highest service level
Single platform drives exceptional user experience
Strong product capabilities across all client investment risk
spectrum
Call center
Internet
Branch
Salesforce
Call center
Internet
Branch
Call center
Internet
Mass market represents clients with <$100K in investable assets. Affluent represents
clients with investable assets between $100K and $1 million. High net worth represents
clients with over $1 million in investable assets.
|
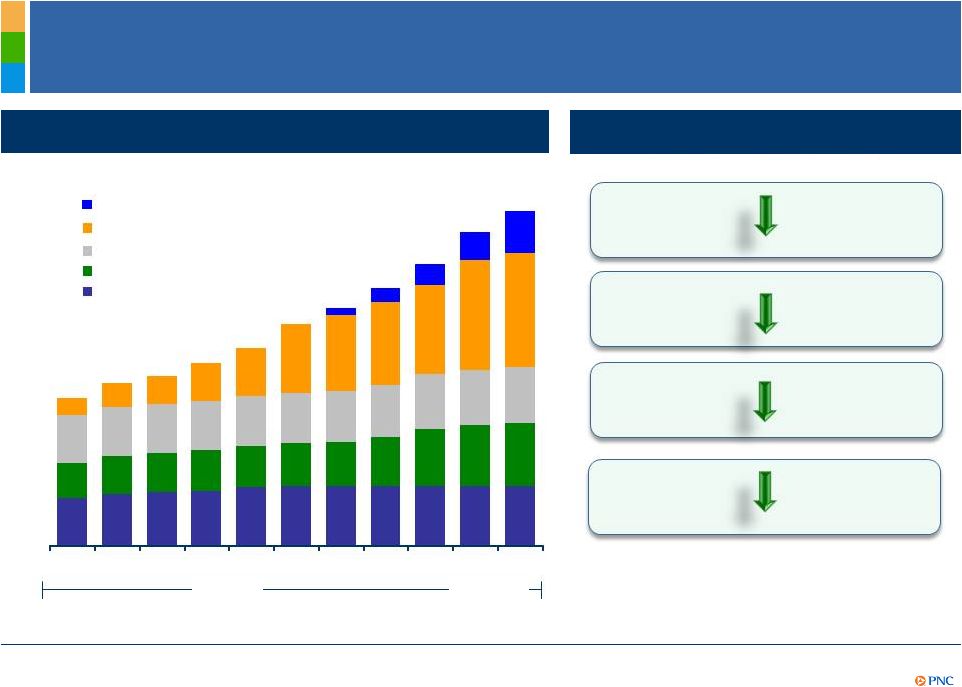
 DRAFT
We have identified more than 600 initiatives to deliver our savings
goals
–
94 initiatives are estimated to achieve savings of greater than $1
million
Our Continuous Improvement Drives Capacity For
Future Investments
Expense Reduction Goals
Estimated 2012 Financial
Impact (in millions)
% Complete
Total PNC Efficiency initiatives
$400
43%
RBC Bank (USA) integration
150
90%
Total
$550
59%
(1) Year-to-date 5/31/2012.
1 |
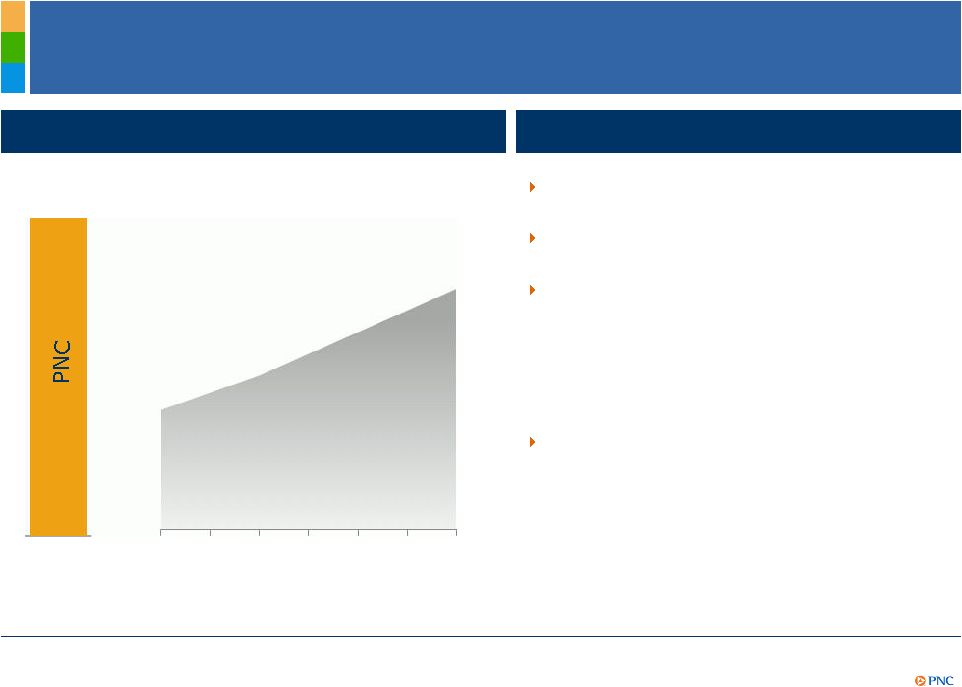 DRAFT
Strong Capital and Liquidity Position
1Q12 highlights
Basel III Tier 1 common ratio
2013 Target
Basel III
8.0% -
8.5%
1
Basel III requirements
Basel I Tier 1 common ratio of 9.3% at quarter
end
Target Basel III Tier 1 common ratio estimated to
be between 8.0-8.5% by year-end 2013
Capital priorities:
–
Build capital to support client growth and
business investment
–
Maintain appropriate capital in light of
economic uncertainty
–
Return excess capital to shareholders
Strong liquidity position
–
Loan-to-deposit ratio of 85%
–
Parent company two year liquidity coverage
of 114%
2
3
3.5%
4.0%
4.5%
5.1%
5.8%
6.4%
7.0%
2013
2014
2015
2016
2017
2018
2019
1
(1) Proforma estimate is based on PNC’s Basel I Tier 1 common ratio of 9.3% as of
3/31/12, adjusted by 1.6% to reflect projected retained earnings using First Call 2012
and 2013 estimates and the current dividend payout, and a decrease of 2.5%-3.0% primarily representing the estimated increase in risk
weighted assets due to current Basel II methodology regarding credit, operational and market
risks. This includes the assumed treatment of our investment in BlackRock and
sub-investment grade securities (assuming no AOCI double counting) in accordance with Basel II. This estimate is subject to further
regulatory guidance and clarity, and is based on the phase-in (beginning in 2013) of the
Basel III framework in effect as of 3/31/12. (2) Regulatory requirements are inclusive
of the capital conservation buffer and subject to further regulatory guidance and clarity. (3) Parent company liquidity coverage
defined as liquid assets divided by funding obligations within a two year period. |
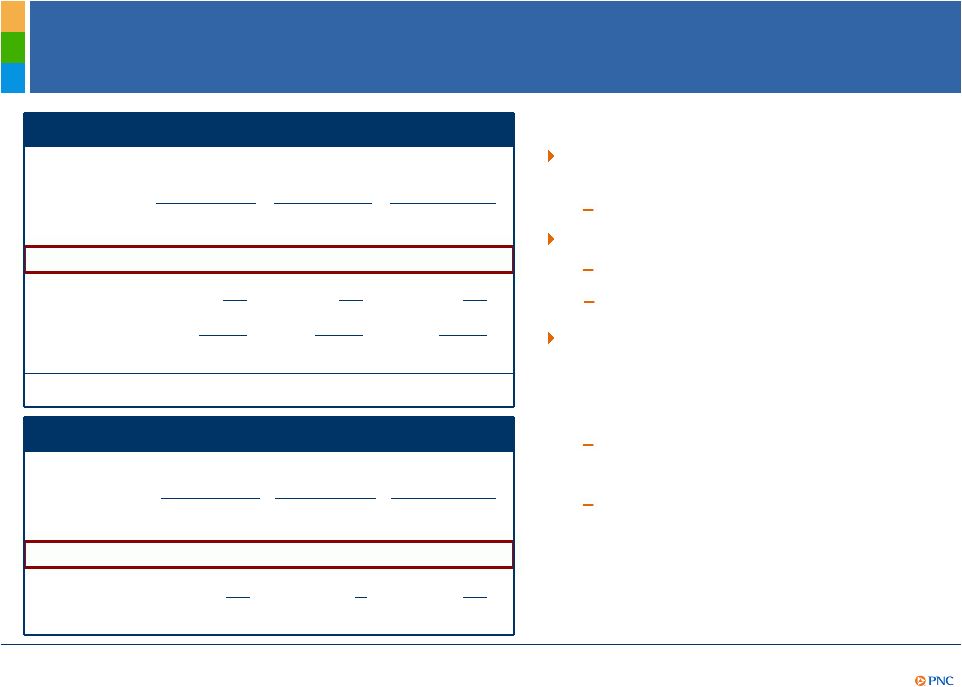 DRAFT
Impact of Recent Increase in Repurchase Demands
1
Experiencing recent elevated levels of
GSE-related repurchase demands
Top reasons cited for recent claims:
As a result, PNC expects to add
residential mortgage repurchase
reserves of approximately $350 million
in 2Q12
(1) Does not include home equity loans. (2) 2Q12 represents quarter to date as of May 31st.
(3) Estimate. (4) As of 5/31/12 Residential Mortgage Repurchase New Claims
($ millions)
Vintage:
Qtr Avg
2011
1Q12
2Q12
2004 & prior
$14
$7
$21
2005-2008
150
177
234
2009-2011
29
29
33
Total
$193
$213
$288
% GSE
84%
88%
87%
Losses
$(41)
$(40)
$(76)
Residential
Mortgage
Sold
Loan
Portfolio
-
Remaining
UPB
($ billions)
Vintage:
GSE
Non-GSE
Total
2004 & prior
$23
$14
$37
2005-2008
24
21
45
2009-2011
22
9
31
Total
$69
$44
$113
Primarily in 2005-08 vintages
Property values
Missing documentation
Will result in life-to-date accrued
losses of $1.6 billion
Barring significant changes in the
future behaviors and demand
patterns of investors, we believe
we are appropriately reserved
against future demands
2
4 |
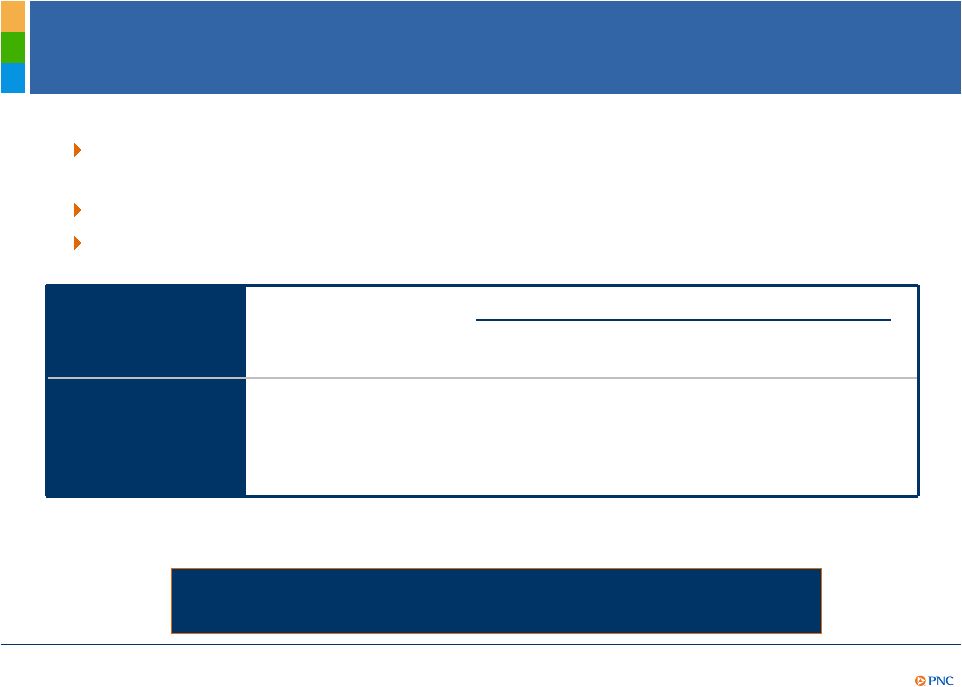 DRAFT
Outlook
1
–
Full Year 2012 vs. 2011
PNC is Positioned to Deliver Strong Results in 2012.
Estimated % Change
Combined
Balance sheet
Loans
Increase mid to high teens
Combined
Income
statement
Total revenue
Increase high single digits
Noninterest expense
Increase
high
single
digits
4,5
Loan loss provision
Improving
Strong balance sheet and revenue growth expected to drive higher
earnings
Credit costs expected to improve
RBC Bank (USA) acquisition expected to be accretive in 2012
2
2
6
3
(1) Refer to the Cautionary Statement in the Appendix, including assumptions. (2) Reflects
combined PNC and RBC Bank (USA). (3) Estimated change for 2012 is based on comparable
2011 results. (4) Bold item reflects revision to previous guidance. (5) Excluding legal and regulatory
related contingencies, integration costs and capital actions related to TPS redemptions for
2011 and 2012. (6) Excluding legal and regulatory related contingencies. |
 DRAFT
Cautionary Statement Regarding Forward-Looking
Information
Appendix
This presentation includes “snapshot” information about PNC used by way of
illustration and is not intended as a full business or financial review. It
should not be viewed in isolation but rather in the context of all of the information made available by PNC in its SEC filings.
We also make statements in this presentation, and we may from time to time make other
statements, regarding our outlook for earnings, revenues, expenses, capital levels and
ratios, liquidity levels, asset levels, asset quality, financial position, and other matters regarding or
affecting PNC and its future business and operations that are forward-looking statements
within the meaning of the Private Securities Litigation Reform Act.
Forward-looking statements are typically identified by words such as “believe,” “plan,” “expect,” “anticipate,” “see,” “look,”
“intend,” “outlook,” “project,” “forecast,”
“estimate,” “goal,” “will,” “should” and other similar words and expressions. Forward-looking
statements are subject to numerous assumptions, risks and uncertainties, which change over
time. Forward-looking statements speak only as of the date made. We do not assume any duty
and do not undertake to update forward-looking statements. Actual results or
future events could differ, possibly materially, from those anticipated in forward-looking statements, as well as
from historical performance.
Our forward-looking statements are subject to the following principal risks and
uncertainties. Our businesses, financial
results and balance sheet values are affected by business and economic conditions, including the following:
o
Changes in interest rates and valuations in debt, equity and other financial
markets.
o
Disruptions in the liquidity and other functioning of U.S. and global financial
markets.
o
The impact on financial markets and the economy of the downgrade by Standard
& Poor’s of U.S. Treasury obligations and other U.S. government-backed
debt, as well as issues surrounding the level of U.S. and European government debt and concerns regarding the
creditworthiness of certain sovereign governments, supranationals and financial institutions
in Europe.
o
Actions by Federal Reserve, U.S. Treasury and other government agencies,
including those that impact money supply and market interest rates.
o
Changes in customers’, suppliers’ and other counterparties’
performance and creditworthiness.
o
Slowing or failure of the current moderate economic expansion.
o
Continued effects of aftermath of recessionary conditions and uneven spread of
positive impacts of recovery on the economy and our counterparties, including adverse
impacts on levels of unemployment, loan utilization rates, delinquencies, defaults and counterparty
ability to meet credit and other obligations.
o
Changes in customer preferences and behavior, whether due to changing business
and economic conditions, legislative and regulatory initiatives, or other factors.
Our forward-looking financial statements are subject to the risk that economic and financial market conditions will be
substantially different
than we are currently expecting. These statements are based on our current view that the
moderate economic expansion will persist in 2012 and interest rates will remain very
low. |
 DRAFT
Cautionary Statement Regarding Forward-Looking
Information (continued)
Appendix
•
Legal and regulatory developments could have an impact on our ability to operate our
businesses, financial condition, results of operations, competitive position,
reputation, or pursuit of attractive acquisition opportunities. Reputational impacts could affect matters such as business
generation and retention, liquidity, funding, and ability to attract and retain
management. These developments could include:
o
Changes resulting from legislative and regulatory reforms, including major reform of the
regulatory oversight structure of the financial services industry and changes to laws
and regulations involving tax, pension, bankruptcy, consumer protection, and other industry
aspects, and changes in accounting policies and principles. We will be impacted by
extensive reforms provided for in the Dodd-Frank Wall Street Reform and Consumer
Protection Act (the “Dodd-Frank Act”) and otherwise growing out of the recent financial crisis, the
precise nature, extent and timing of which, and their impact on us, remains uncertain.
o
Changes to regulations governing bank capital and liquidity standards, including due to the
Dodd-Frank Act and to Basel III initiatives.
o
Unfavorable resolution of legal proceedings or other claims and regulatory and other
governmental investigations or other inquiries. In addition to matters relating
to PNC’s business and activities, such matters may include proceedings, claims, investigations, or inquiries
relating to pre-acquisition business and activities of acquired companies, such as
National City. These matters may result in monetary judgments or settlements or
other remedies, including fines, penalties, restitution or alterations in our business practices and in
additional expenses and collateral costs, and may cause reputational harm to PNC.
o
Results of the regulatory examination and supervision process, including our failure to
satisfy requirements of agreements with governmental agencies.
o
Impact on business and operating results of any costs associated with obtaining rights in
intellectual property claimed by others and of adequacy of our intellectual property
protection in general.
•
Business and operating results are affected by our ability to identify and effectively manage
risks inherent in our businesses, including, where appropriate, through effective use
of third-party insurance, derivatives, and capital management techniques, and to meet evolving regulatory
capital standards. In particular, our results currently depend on our ability to manage
elevated levels of impaired assets.
•
Business and operating results also include impacts relating to our equity interest in
BlackRock, Inc. and rely to a significant extent on information provided to us by
BlackRock. Risks and uncertainties that could affect BlackRock are discussed in more detail by BlackRock in its
SEC filings.
•
Our acquisition of RBC Bank (USA) presents us with risks and uncertainties related to the
integration of the acquired businesses into PNC, including:
o
Anticipated benefits of the transaction, including cost savings and strategic gains, may be
significantly harder or take longer to achieve than expected or may not be achieved in
their entirety as a result of unexpected factors or events.
o
Our ability to achieve anticipated results from this transaction is dependent also on the
extent of credit losses in the acquired loan portfolios and the extent of deposit
attrition, in part related to the state of economic and financial markets. Also, litigation and
regulatory and other governmental investigations that may be filed or commenced relating to
the pre-acquisition business and activities of RBC Bank (USA), could impact the
timing or realization of anticipated benefits to PNC.
o
Integration of RBC Bank (USA)’s business and operations into PNC may take longer than
anticipated or be substantially more costly than anticipated or have unanticipated
adverse results relating to RBC Bank (USA)’s or PNC’s existing businesses. PNC’s ability to integrate
RBC Bank (USA) successfully may be adversely affected by the fact that this transaction
results in PNC entering several geographic markets where PNC did not previously have
any meaningful retail presence. |
 DRAFT
Cautionary Statement Regarding Forward-Looking
Information (continued)
•In addition to the RBC Bank (USA) transaction, we grow our business in part by acquiring
from time to time other financial services companies, financial services assets and
related deposits and other liabilities. These other acquisitions often present risks and uncertainties analogous to those
presented by the RBC Bank (USA) transaction. Acquisition risks include those presented
by the nature of the business acquired as well as risks and uncertainties related to
the acquisition transactions themselves, regulatory issues, and the integration of the acquired businesses into PNC after
closing.
•Competition can have an impact on customer acquisition, growth and retention and on
credit spreads and product pricing, which can affect market share, deposits and
revenues. Industry restructuring in the current environment could also impact our business and financial performance through
changes in counterparty creditworthiness and performance and in the competitive and regulatory
landscape. Our ability to anticipate and respond to technological changes can
also impact our ability to respond to customer needs and meet competitive demands.
•Business
and
operating
results
can
also
be
affected
by
widespread
disasters,
dislocations,
terrorist
activities
or
international
hostilities
through
impacts on the economy and financial markets generally or on us or our counterparties
specifically. We provide greater detail regarding these as well as other factors in our
2011 Form 10-K, as amended by Amendment No. 1 thereto, and first quarter 2012 Form
10-Q, including in the Risk Factors and Risk Management sections and the Legal Proceedings and Commitments and Guarantees
Notes
of
the
Notes
to
Consolidated
Financial
Statements
in
those
reports,
and
in
our
subsequent
SEC
filings.
Our
forward-looking
statements
may
also be subject to other risks and uncertainties, including those we may discuss elsewhere in
this presentation or in SEC filings, accessible on the SEC’s website at
www.sec.gov and on our corporate website at www.pnc.com/secfilings. We have included these web addresses as inactive textual
references only. Information on these websites is not part of this document.
Any annualized, proforma, estimated, third party or consensus numbers in this presentation are
used for illustrative or comparative purposes only and may not reflect actual
results. Any consensus earnings estimates are calculated based on the earnings projections made by analysts who cover
that company. The analysts’
opinions, estimates or forecasts (and therefore the consensus earnings estimates) are theirs
alone, are not those of PNC or its management, and may not reflect PNC’s or other
company’s actual or anticipated results. Appendix |
 DRAFT
Non-GAAP to GAAP Reconcilement
In millions except per share data
Dec. 31, 2007
Mar. 31, 2012
% Change
Common shareholders' equity
$14,847
$33,408
Common shares outstanding
341
528
Book value per common share
$43.60
$63.26
45%
Goodwill and other intangible assets other than servicing rights
$8,853
$10,035
Common shareholders' equity less specified intangible assets
$5,994
$23,373
Common shares outstanding
341
528
Tangible book value per common share
$17.58
$44.27
152%
PNC
believes
that
tangible
book
value
per
common
share,
a
non-GAAP
measure,
is
useful
as
a
tool
to
help
to
better
evaluate
growth
of
the
company's
business
apart
from
the
amount,
on
a
per
share
basis,
of
goodwill
and
other
intangible
assets, other than servicing rights, included in book value per common share.
As of
Appendix |
 DRAFT
Peer Group of Banks
The PNC Financial Services Group, Inc.
PNC
BB&T Corporation
BBT
Bank of America Corporation
BAC
Capital One Financial, Inc.
COF
Comerica Inc.
CMA
Fifth Third Bancorp
FITB
JPMorgan Chase
JPM
KeyCorp
KEY
M&T Bank
MTB
Regions Financial Corporation
RF
SunTrust Banks, Inc.
STI
U.S. Bancorp
USB
Wells Fargo & Co.
WFC
Ticker
Appendix |