Attached files
| file | filename |
|---|---|
| 8-K - FORM 8-K - JONES LANG LASALLE INC | d365152d8k.htm |
Exhibit 99.1
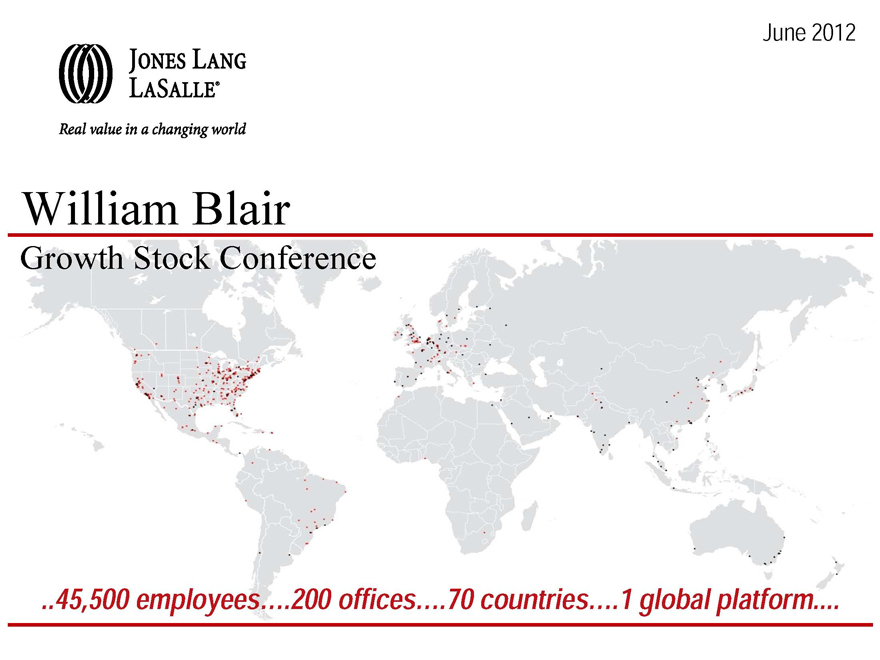
Exhibit 99.1
June 2012
William Blair
Growth Stock Conference
.45,500 employees….200 offices….70 countries….1 global platform
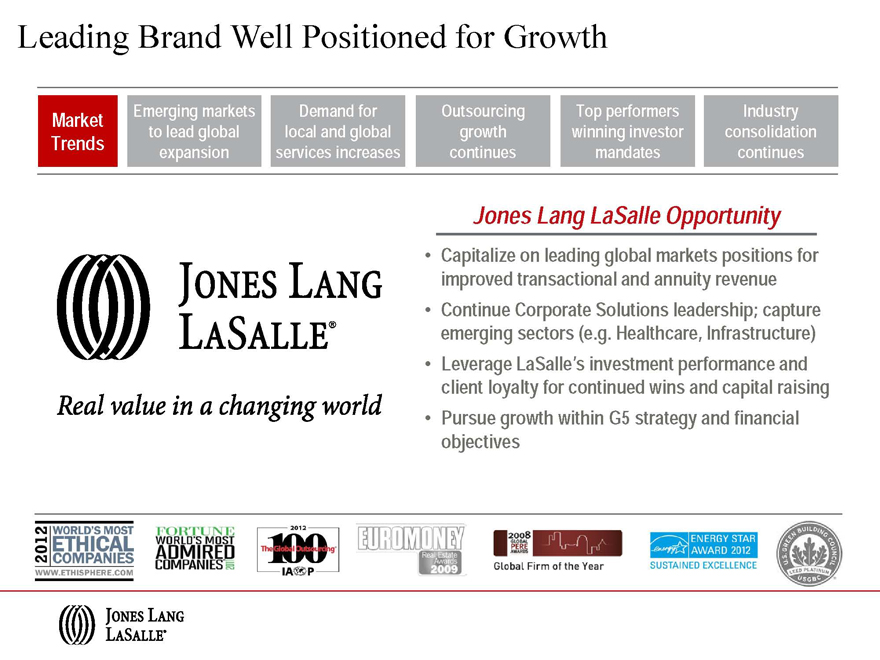
Leading Brand Well Positioned for Growth
Market Emerging markets Demand for Outsourcing Top performers Industry
to lead global local and global growth winning investor consolidation
Trends expansion services increases continues mandates continues
Jones Lang LaSalle Opportunity
Capitalize on leading global markets positions for improved transactional and annuity revenue Continue Corporate Solutions leadership; capture emerging sectors (e.g. Healthcare, Infrastructure) Leverage LaSalle’s investment performance and client loyalty for continued wins and capital raising Pursue growth within G5 strategy and financial objectives
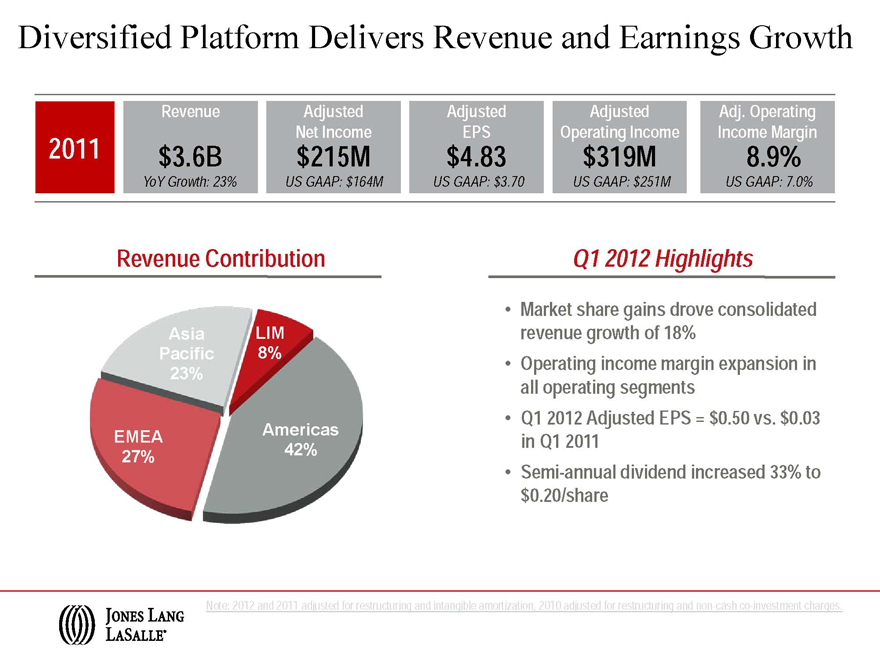
Diversified Platform Delivers Revenue and Earnings Growth
2011
Revenue
$3.6B
YoY Growth: 23%
Adjusted Net Income
$215M
US GAAP: $164M
Adjusted EPS
$4.83
US GAAP: $3.70
Adjusted Operating Income
$319M
US GAAP: $251M
Adj. Operating Income Margin
8.9%
US GAAP: 7.0%
Revenue Contribution
Asia Pacific 23%
EMEA 27%
LIM 8%
Americas 42%
Q1 2012 Highlights
Market share gains drove consolidated revenue growth of 18%
Operating income margin expansion in all operating segments
Q1 2012 Adjusted EPS = $0.50 vs. $0.03 in Q1 2011
Semi-annual dividend increased 33% to $0.20/share
Note: 2012 and 2011 adjusted for restructuring and intangible amortization, 2010 adjusted for restructuring and non-cash co-investment charges.
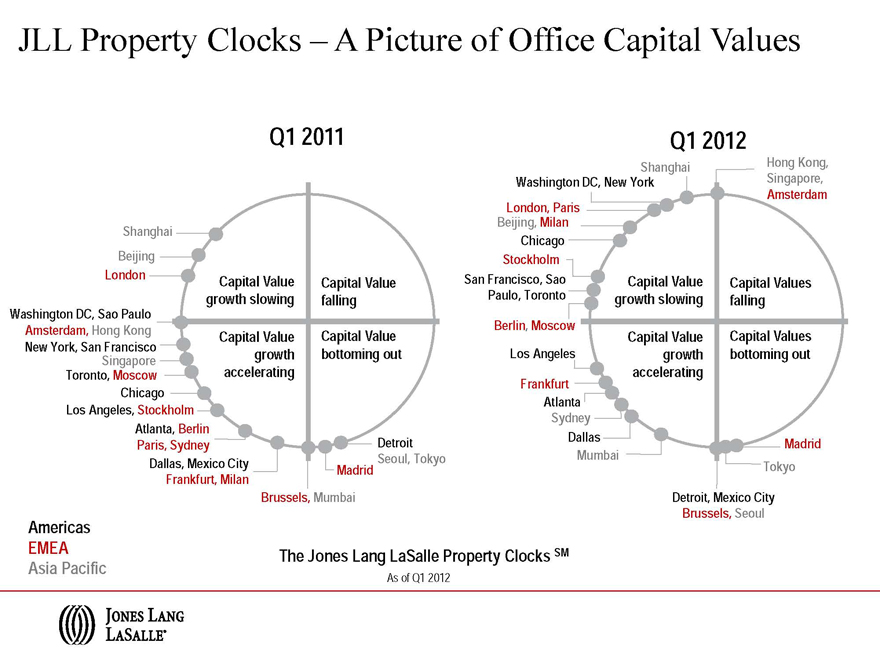
JLL Property Clocks – A Picture of Office Capital Values
Q1 2011
Shanghai Beijing London
Washington DC, Sao Paulo Amsterdam, Hong Kong New York, San Francisco Toronto, Singapore Moscow Chicago Los Angeles, Stockholm
Atlanta, Berlin
Paris, Sydney Dallas, Mexico City Frankfurt, Milan Brussels, Mumbai
Detroit
Seoul, Tokyo
Madrid
Capital Value Capital Value
growth slowing falling
Capital Value Capital Value
growth bottoming out
accelerating
Q1 2012
Shanghai Hong Kong,
Washington DC, New York Singapore,
Amsterdam
Beijing, London, Milan Paris Chicago Stockholm San Francisco, Sao Paulo, Toronto Berlin, Moscow Los Angeles Frankfurt Atlanta Sydney Dallas Mumbai
Madrid Tokyo Detroit, Mexico City Brussels, Seoul
Capital Value Capital Values
growth slowing falling
Capital Value Capital Values
growth bottoming out
accelerating
Americas EMEA Asia Pacific
The Jones Lang LaSalle Property Clocks SM
As of Q1 2012
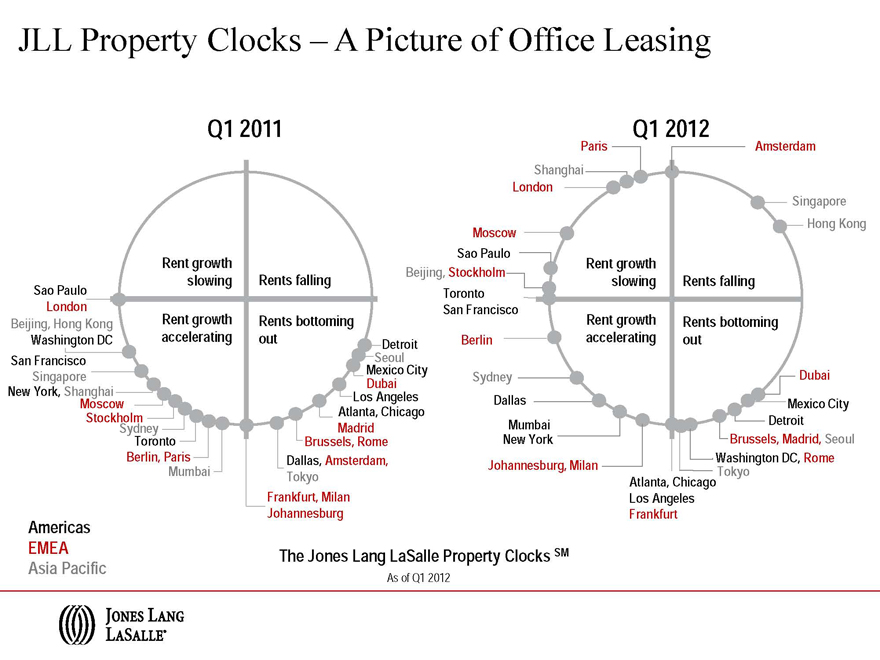
JLL Property Clocks – A Picture of Office Leasing
Q1 2011
Rent growth
slowing Rents falling
Rent growth Rents bottoming
accelerating out
Sao Paulo
London
Beijing, Hong Kong Rent
Washington DC
San Francisco
Singapore
New York, Shanghai
Moscow
Stockholm
Sydney
Toronto
Berlin, Paris
Mumbai
Detroit Seoul Mexico City Dubai
Atlanta, Los Angeles Chicago Madrid Brussels, Rome Dallas, Amsterdam, Tokyo Frankfurt, Milan Johannesburg
Q1 2012
Paris Shanghai London
Moscow Sao Paulo Beijing, Stockholm Toronto San Francisco Berlin Sydney Dallas New Mumbai York
Johannesburg, Milan
Atlanta, Chicago Los Angeles Frankfurt
Dubai Mexico City Detroit Brussels, Madrid, Seoul Washington DC, Rome Tokyo
Rent growth
slowing Rents falling
Rent growth Rents bottoming
accelerating out
Singapore Hong Kong
Amsterdam
Americas EMEA Asia Pacific
The Jones Lang LaSalle Property Clocks SM
As of Q1 2012
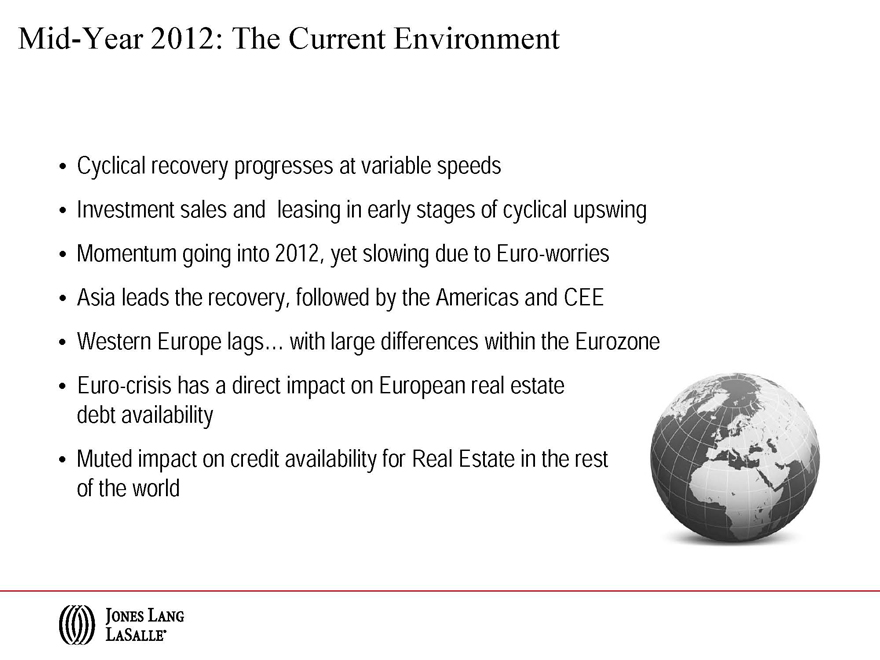
Mid-Year 2012: The Current Environment
Cyclical recovery progresses at variable speeds
Investment sales and leasing in early stages of cyclical upswing
Momentum going into 2012, yet slowing due to Euro- worries
Asia leads the recovery, followed by the Americas and CEE
Western Europe lags… with large differences within the Eurozone
Euro-crisis has a direct impact on European real estate debt availability
Muted impact on credit availability for Real Estate in the rest of the world
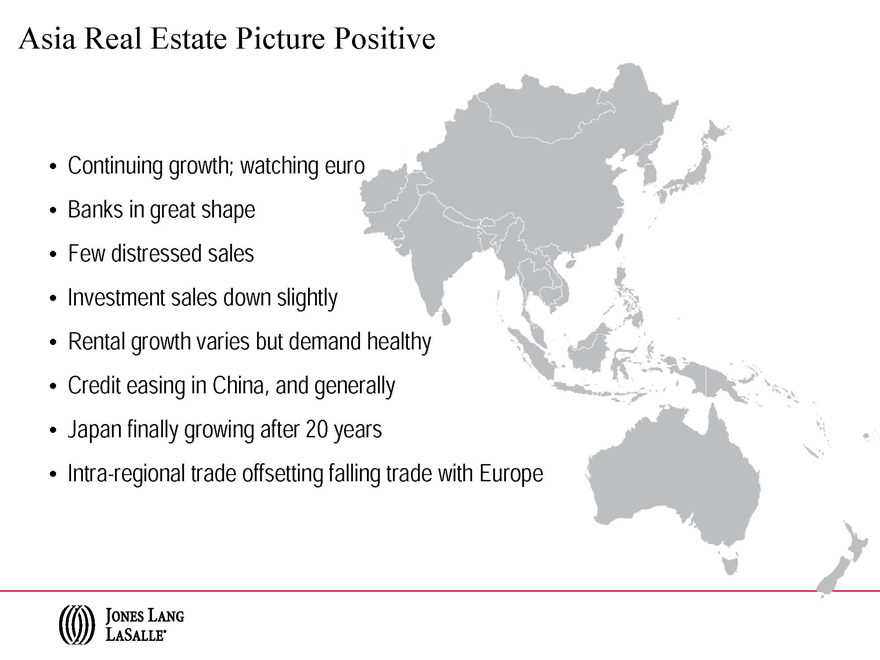
Asia Real Estate Picture Positive
Continuing growth; watching euro
Banks in great shape
Few distressed sales
Investment sales down slightly
Rental growth varies but demand healthy
Credit easing in China, and generally
Japan finally growing after 20 years
Intra-regional trade offsetting falling trade with Europe
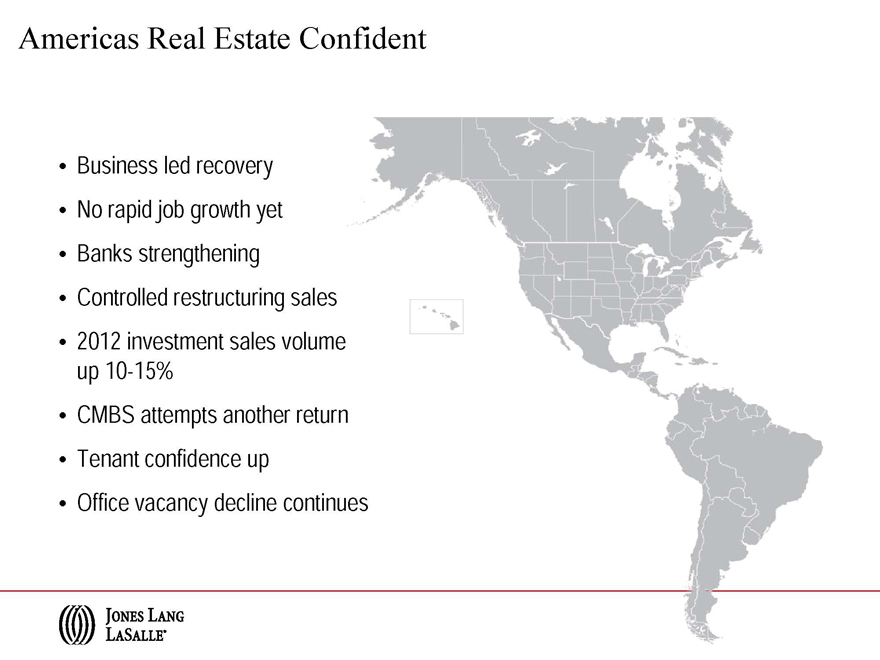
Americas Real Estate Confident
Business led recovery
No rapid job growth yet
Banks strengthening
Controlled restructuring sales
2012 investment sales volume up 10-15%
CMBS attempts another return
Tenant confidence up
Office vacancy decline continues
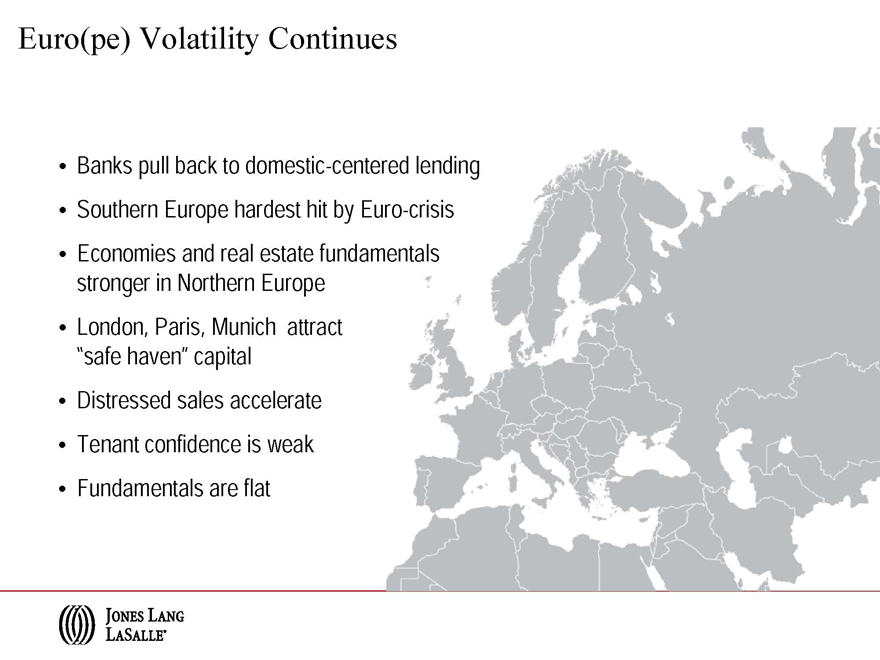
Euro(pe) Volatility Continues
Banks pull back to domestic-centered lending
Southern Europe hardest hit by Euro-crisis
Economies and real estate fundamentals stronger in Northern Europe
London, Paris, Munich attract “safe haven” capital
Distressed sales accelerate
Tenant confidence is weak
Fundamentals are flat
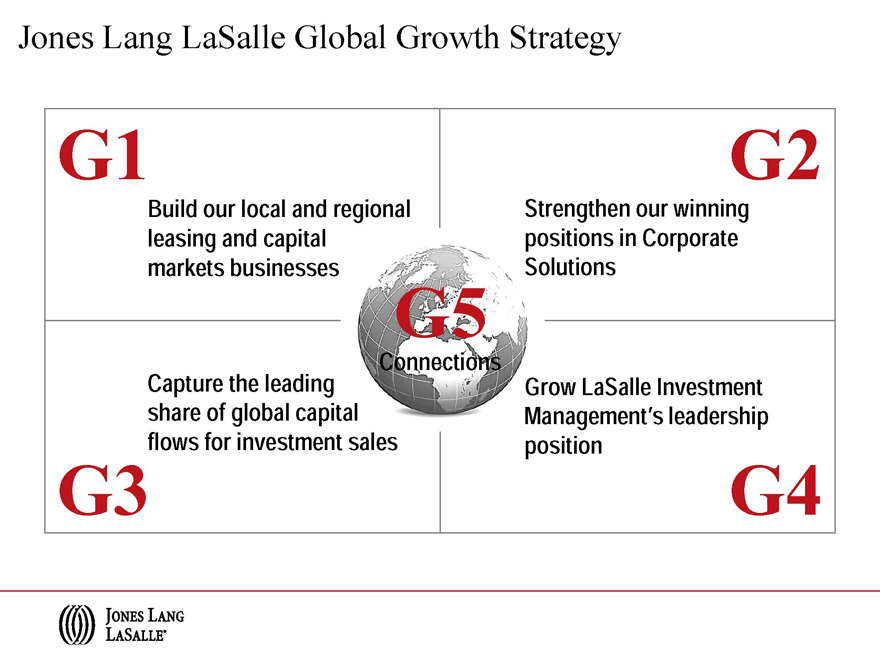
Jones Lang LaSalle Global Growth Strategy
G1
Build our local and regional leasing and capital markets businesses
G2
Strengthen our winning positions in Corporate Solutions
Capture the leading share of global capital flows for investment sales
G3
Grow LaSalle Investment Management’s leadership position G4
G5
Connections
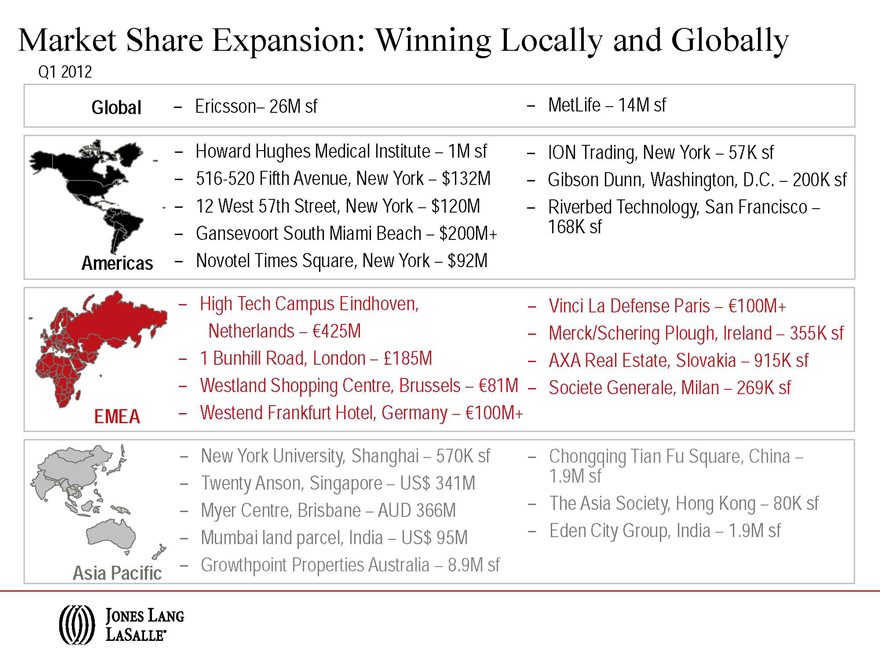
Market Share Expansion: Winning Locally and Globally
Q1 2012
Global—Ericsson– 26M sf—MetLife – 14M sf
Americas
Howard Hughes Medical Institute – 1M sf 516-520 Fifth Avenue, New York – $132M
12 West 57th Street, New York – $120M
Gansevoort South Miami Beach – $200M+ Novotel Times Square, New York – $92M
ION Trading, New York – 57K sf
Gibson Dunn, Washington, D.C. – 200K sf Riverbed Technology, San Francisco – 168K sf
EMEA
High Tech Campus Eindhoven, Netherlands – €425M
| 1 |
|
Bunhill Road, London – £185M |
Westland Shopping Centre, Brussels – €81M Westend Frankfurt Hotel, Germany – €100M+
Vinci La Defense Paris – €100M+ Merck/Schering Plough, Ireland – 355K sf AXA Real Estate, Slovakia – 915K sf Societe Generale, Milan – 269K sf
Asia Pacific
New York University, Shanghai – 570K sf Twenty Anson, Singapore – US$ 341M Myer Centre, Brisbane – AUD 366M Mumbai land parcel, India – US$ 95M Growthpoint Properties Australia – 8.9M sf
Chongqing Tian Fu Square, China –1.9M sf The Asia Society, Hong Kong – 80K sf Eden City Group, India – 1.9M sf
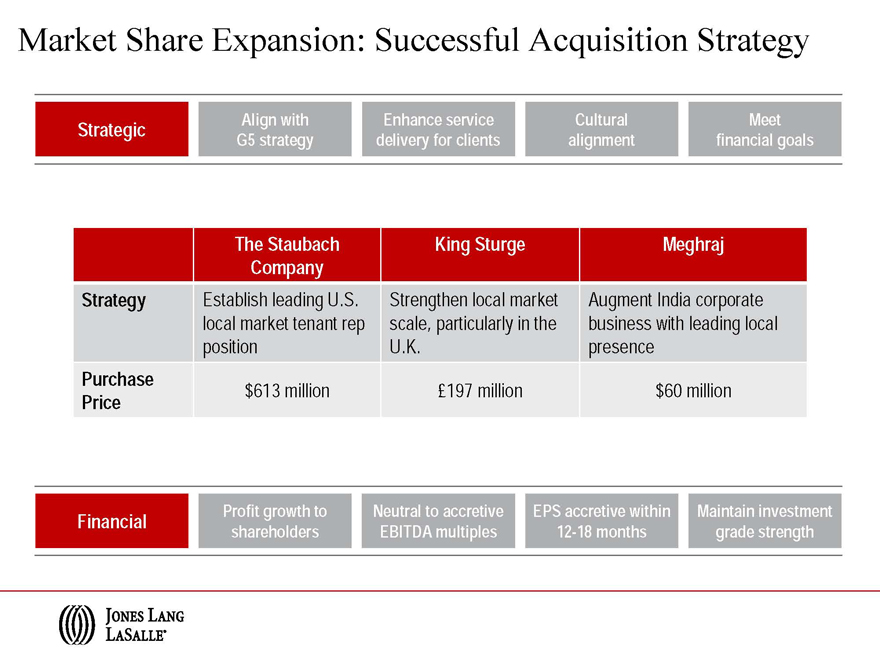
Market Share Expansion: Successful Acquisition Strategy
Strategic Align with Enhance service Cultural Meet
G5 strategy delivery for clients alignment financial goals
The Staubach King Sturge Meghraj
Company
Strategy Establish leading U.S. Strengthen local market Augment India corporate
local market tenant rep scale, particularly in the business with leading local
position U.K. presence
Purchase
Price $613 million £197 million $60 million
Financial Profit growth to Neutral to accretive EPS accretive within Maintain investment
shareholders EBITDA multiples 12-18 months grade strength
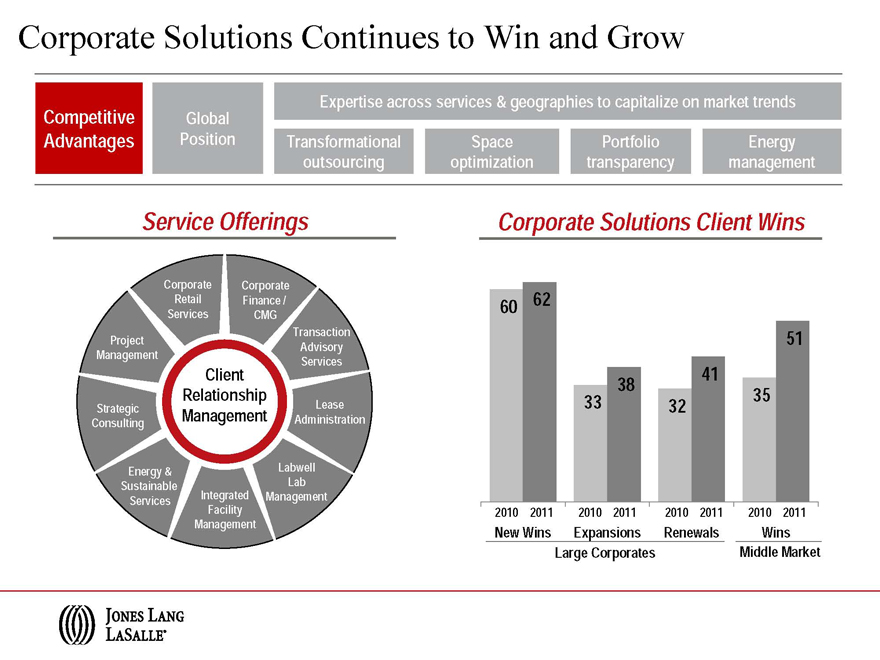
Corporate Solutions Continues to Win and Grow
Expertise across services & geographies to capitalize on market trends
Competitive Global
Advantages Position Transformational Space Portfolio Energy
outsourcing optimization transparency management
Service Offerings
Client Relationship Management
Corporate Retail Services
Project Management
Strategic Consulting
Energy & Sustainable Services
Labwell
Lab
Integrated Management
Facility
Management
Transaction Advisory Services
Lease Administration
Corporate Finance / CMG
Corporate Solutions Client Wins
60 62
38
33
41
32
35
51
2010 2011 2010 2011 2010 2011 2010 2011
New Wins Expansions Renewals Wins
Large Corporates Middle Market
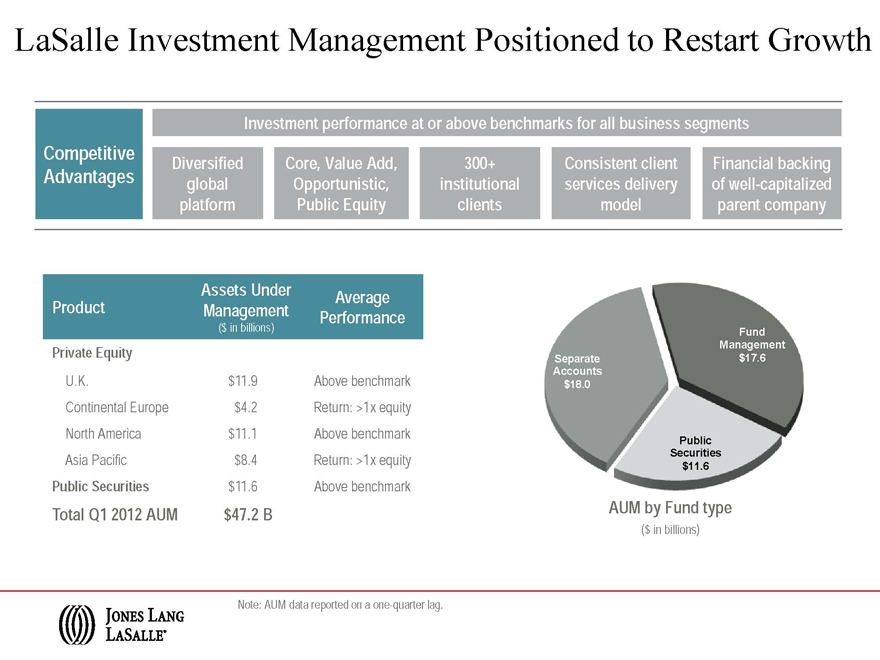
LaSalle Investment Management Positioned to Restart Growth
Investment performance at or above benchmarks for all business segments
Competitive Diversified Core, Value Add, 300+ Consistent client Financial backing
Advantages global Opportunistic, institutional services delivery of well-capitalized
platform Public Equity clients model parent company
Assets Under Average
Product Management Performance
($ in billions)
Private Equity
U.K. $11.9 Above benchmark
Continental Europe $4.2 Return: >1x equity
North America $11.1 Above benchmark
Asia Pacific $8.4 Return: >1x equity
Public Securities $11.6 Above benchmark
Total Q1 2012 AUM $47.2 B
Separate Accounts $18.0
Fund Management $17.6
Public Securities $11.6
AUM by Fund type
($ in billions)
Note: AUM data reported on a one-quarter lag.
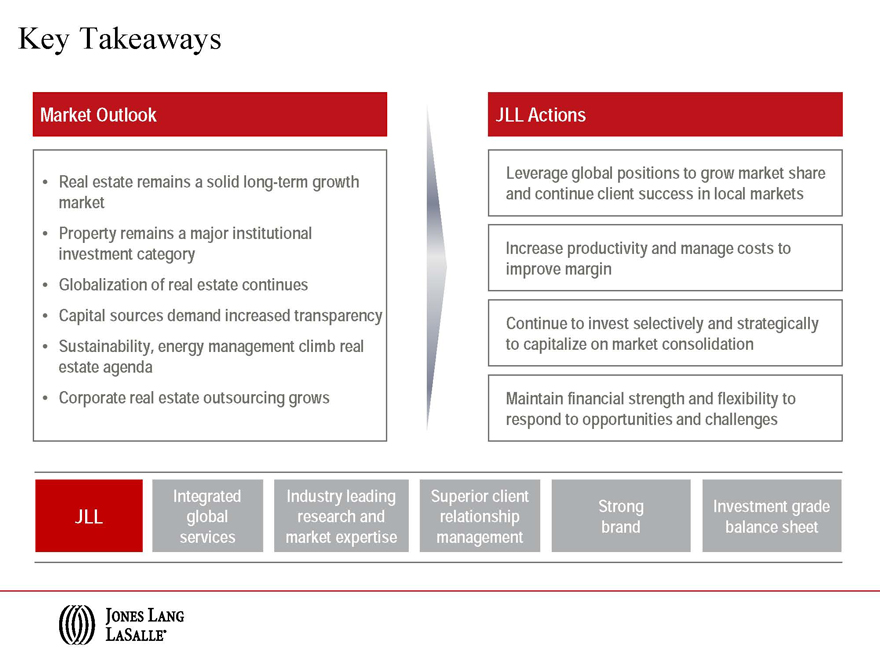
Key Takeaways
Market Outlook
Real estate remains a solid long-term growth market Property remains a major institutional investment category Globalization of real estate continues Capital sources demand increased transparency Sustainability, energy management climb real estate agenda Corporate real estate outsourcing grows
JLL Actions
Leverage global positions to grow market share and continue client success in local markets
Increase productivity and manage costs to improve margin
Continue to invest selectively and strategically to capitalize on market consolidation
Maintain financial strength and flexibility to respond to opportunities and challenges
Integrated Industry leading Superior client
JLL global research and relationship Strong brand Investment balance sheet grade
services market expertise management
Forward looking statements
Statements in this presentation regarding, among other things, future financial results and performance, achievements, plans and objectives and dividend payments may be considered forward-looking statements within the meaning of the Private Securities Litigation Reform Act of 1995. Such statements involve known and unknown risks, uncertainties and other factors which may cause actual results, performance, achievements, plans and objectives of Jones Lang LaSalle to be materially different from those expressed or implied by such forward-looking statements. Factors that could cause actual results to differ materially include those discussed under “Business,” “Risk Factors,” “Management’s Discussion and Analysis of Financial Condition and Results of Operations,” “Quantitative and Qualitative Disclosures about Market Risk,” “Cautionary Note Regarding Forward-Looking Statements” and elsewhere in Jones Lang LaSalle’s Annual Report on Form 10-K for the year ended December 31, 2011 and in the Quarterly Report on Form 10-Q for the quarter ended March 31, 2012 and in other reports filed with the Securities and Exchange Commission. There can be no assurance that future dividends will be declared since the actual declaration of future dividends, and the establishment of record and payment dates, remains subject to final determination by the Company’s Board of Directors. Statements speak only as of the date of this presentation. Jones Lang LaSalle expressly disclaims any obligation or undertaking to update or revise any forward-looking statements contained herein to reflect any change in Jones Lang LaSalle’s expectations or results, or any change in events.
© Jones Lang LaSalle IP, Inc. 2012. All rights reserved. No part of this publication may be reproduced by any means, whether graphically, electronically, mechanically or otherwise howsoever, including without limitation photocopying and recording on magnetic tape, or included in any information store and/or retrieval system without prior written permission of Jones Lang LaSalle IP, Inc.