Attached files
| file | filename |
|---|---|
| 8-K - FORM 8-K - DUKE REALTY CORP | d365467d8k.htm |
 RELIABLE. ANSWERS.
REIT WEEK: 2012 NAREIT INVESTOR FORUM
JUNE 12-14
Exhibit 99.1 |
 RELIABLE. ANSWERS.
2012 Duke Realty Corporation
40 Years Timeline
2 |
 RELIABLE. ANSWERS.
2012 Duke Realty Corporation
Focus on:
Increasing cash flow
Maximizing return on
assets
3
Strategy for Success
Focus on:
Improving coverage ratios
Improving ratings
Focus on:
Portfolio repositioning
Strategic acquisitions &
dispositions
Development opportunities
Strategies for delivering shareholder value |
 RELIABLE. ANSWERS.
2012 Duke Realty Corporation
Strategic Focus
4
Solid Q1 start and executing across all three aspects of our strategy
Operations
Strategy
Asset
Strategy
Capital
Strategy
2012 Goals and Objectives
Q1 2012 Update
•
Lease-up portfolio, manage cap ex; reach
positive same property income growth
•
Balance execution with capital strategy
relative to level and quality of cash flow
and same property NOI
•
Development starts of $150 to $250
million focus on medical office and build-
to-suit
•
Total portfolio occupancy as of quarter end 92.1%, up
1.4% from year-end; industrial portfolio at 93.6%; medical
office at 90.1%
•
Approximately 8.7 million square feet of leases completed
•
Debt to EBITDA @ 6.6x (7.38x excl. Blackstone); 4.7%
Same Property NOI growth
•
$120.8MM development starts. Two 100% leased bulk
industrial projects (at 6.9% stabilized yield) and one 100%
leased medical office (at 7.4% stabilized yield)
•
Continue strong momentum from 2011 on
repositioning of portfolio
•
Pursue acquisitions of medical and
industrial assets
•
Continue pruning suburban office
primarily in Midwest
•
Closed
on
over
$157MM
of
acquisitions
during
the
quarter,
weighted 45% in medical office and 55% in industrial
•
$63.7MM in dispositions of non-core assets
•
Opportunistically access capital markets .
. . push out maturity schedule further
•
Continue improving coverage ratios
•
Maintain minimal balance on line of credit
•
Fixed charge ratio of 1.81x
•
Issued $150MM of equity through ATM program
•
Redeemed Series M Preferred shares of $168MM
•
Zero credit facility balance and $15MM of cash at quarter
end |
 2012 Duke Realty Corporation
OPERATIONS STRATEGY
5 |
 2012 Duke Realty Corporation
6
Focus on Fundamentals
LEASING OF
PORTFOLIO
STRATEGIC
NEW DEVELOPMENT
AND LAND DISPOSITION
AFFO PAYOUT
Maximize return on assets
OPERATIONS STRATEGY |
 2012 Duke Realty Corporation
2007
2008
2009
2010
2011
2012 YTD
29.9
2007
2008
2009
2010
2011
2012 YTD
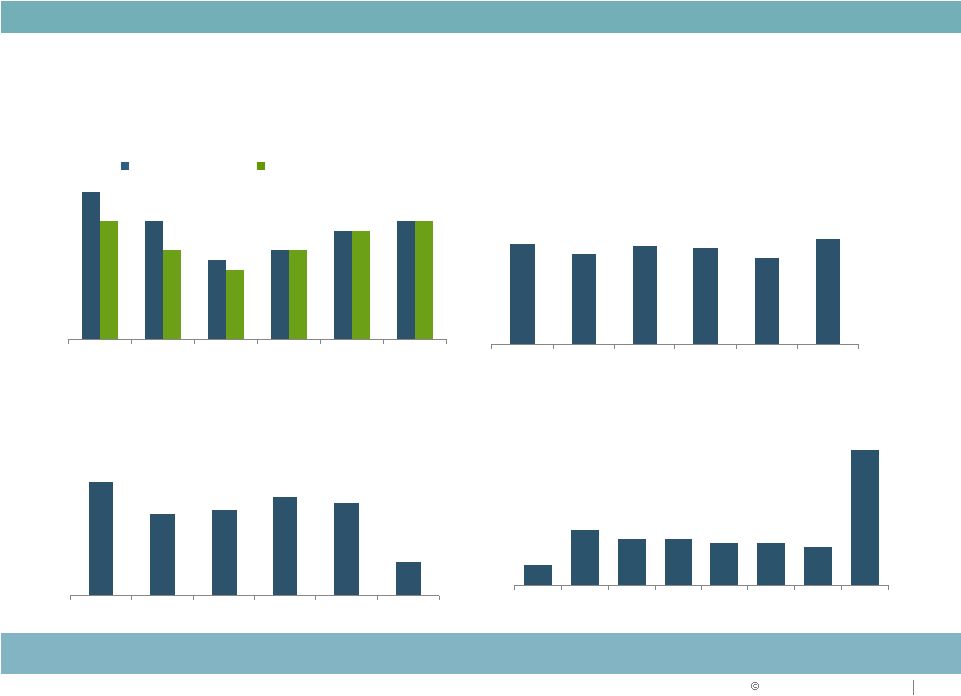
Consistent Operating Performance
Stabilized Occupancy (%)
Strong
historical
stabilized
occupancy
–
fundamentals
improving
Lease Renewals (%)
Strong lease renewal percentages
Stabilized occupancy
In-service occupancy
Leasing Activity
New
Leases
and
Renewals
–
Consistent
Execution
(in
millions
of
square feet)
Lease Maturity Schedule
Lease maturities are well balanced with no one year accounting for
more than 12%
Demonstrated ability to
maintain consistency through economic cycles
95%
92%
92%
89%
88%
91%
91%
89%
89%
87%
7
OPERATIONS STRATEGY
92%92%
72%
79%
77%
69%
84%
21.4
22.7
25.9
24.5
8.7
2007
2008
2009
2010
2011
2012 YTD
80%
5%
13%
11%
11%
10%
10%
9%
32%
2012
2013
2014
2015
2016
2017
2018
2019+ |
 2012 Duke Realty Corporation
1.5%
(0.2%)
(0.2%)
3.2%
(0.6%)
0.2%
(1.0%)
0.0%
1.0%
2.0%
3.0%
4.0%
Suburban Office Peers
Industrial Peers
5-Year Avg.
1-Year Avg.
Annual Same-Store
NOI Growth
(1)
%, y-y
Sources SNL and company filings
Duke Realty
Suburban Office Peers
(2)
Industrial Peers (3)
Consistent NOI Growth Outperformance
Relative Performance vs. Peers
OPERATIONS STRATEGY
8
Notes
1.
Based on simple average of year-over-year annual same-property cash NOI growth, includes
2007 - 2011 2.
Suburban Office Peers include BDN, CLI, HIW, LRY and PKY; weighted by historical market cap 3.
Industrial includes DCT, EGP, FR, FPO, PSB, AMB and PLD; weighted by historical market cap |
 RELIABLE. ANSWERS.
2012 Duke Realty Corporation
9
Positioned for NAV Growth
KEY NAV GROWTH DRIVERS
Increased
management &
service fees
Accretive future
development
Portfolio occupancy of 92.1%
Strong leasing pipeline
Demonstrated track record of 69-80% renewal rate
Will benefit from uptick in third party and JV partners development and
construction activity
Property
management
and
leasing
fees
-
will
trend
higher
as
occupancy
improves
Current pipeline of 686K SF of medical office, 344K SF of suburban office
2012 estimated development starts of $200 to $300 million
Land for 44 million SF of new development, 70% industrial
Acquisitions focused on asset strategy
Industrial and medical office assets
Higher rental rate growth markets
Rent roll downs burning off and positive same property NOI performance
Research forecasts market wide average annual rent growth of 3.2% from
2013-16 Source: PPR, Green Street and Duke Realty
Lease up
existing vacancy
Increase Rents/
Reduced Capex
Accretive future
acquisitions |
 2012 Duke Realty Corporation
10
Land and Development Capabilities
$498
million
HELD FOR DEVELOPMENT
Industrial
Office
Midwest
26.3
2.8
Indianapolis, Chicago,
Cincinnati, Columbus,
Minneapolis, and
St. Louis major
positions
East
3.8
2.1
New Jersey,
Baltimore,
Washington D.C., and
Raleigh
Southeast
8.5
1.3
Atlanta, Central
Florida, and, South
Florida
Southwest
5.8
0.7
Phoenix, Dallas, and
Houston
Total
44.4 million SF
6.9 million SF
Attractive positions contribute to future development and value
Development –
Amounts in million SF
Office
30%
Industrial
70%
OPERATIONS STRATEGY |
 2012 Duke Realty Corporation
OPERATIONS STRATEGY
11
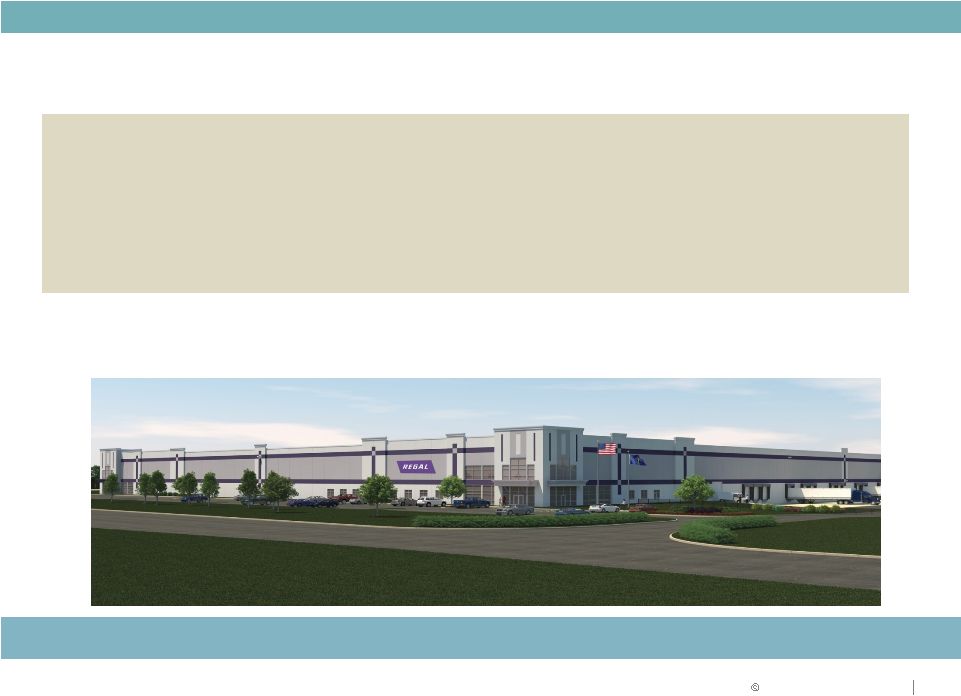
Indianapolis –
Industrial
OPERATIONS STRATEGY
Expand Industrial
•
Regal Beloit build-to-suit bulk distribution facility
•
376,000 square feet, ten year lease term to growing global manufacturing
company
•
Duke Realty won with strategic land position
•
$15 million project, 10 year average yield of 8.15% |
 2012 Duke Realty Corporation
OPERATIONS STRATEGY
12
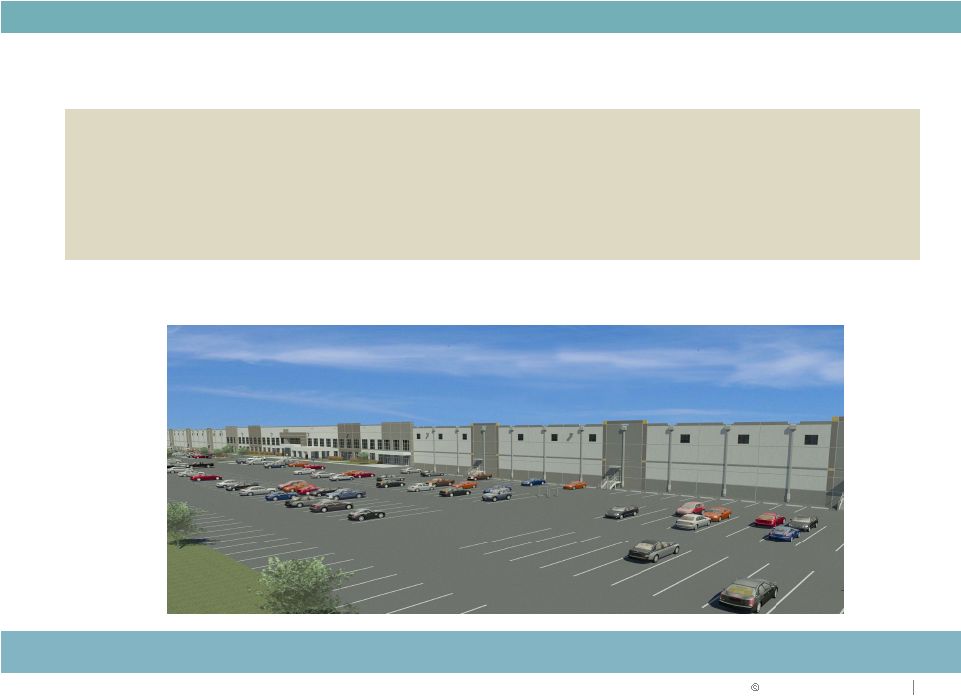
Northeast U.S. –
Bulk Industrial Build-to-Suit
Repeat business new development with growing tenant
•
Regional distribution center build-to-suit in Delaware for Amazon
•
1,015,000 square feet
•
Twelve year lease term
•
$82 million project, 12 year average yield 8.33% |
 2012 Duke Realty Corporation
OPERATIONS STRATEGY
13
Indianapolis –
Medical Office
Grow Medical Office
•
Wishard Faculty Office Building
•
Aa2 rated system sponsored by Marion County
•
275,000 square feet
•
Thirty year lease term
•
50/50 Joint Venture with Hospital System
•
On campus of new hospital to open in 2013
•
$90 million project, 30 year average yield of 8.37% |
 RELIABLE. ANSWERS.
2012 Duke Realty Corporation
14
Tampa –
Medical Office
•
VA Primary Care Annex at Tampa
•
Leased to Department of Veterans Affairs
•
120,000 square feet
•
$41 million project, 20 year average yield of 8.20%
Grow Medical Office |
 2012 Duke Realty Corporation
ASSET STRATEGY
15 |
 2012 Duke Realty Corporation
16
Flex disposition
Savannah
Washington DC
Healthcare
Asset Strategy
Dugan
CBRERT
Premier
Suburban
Office
Disposition
Proven ability to execute
ASSET STRATEGY
$1 Billion
Repositioning Track Record
$1 Billion
2005
2006
2007
2009
2010
2011 |
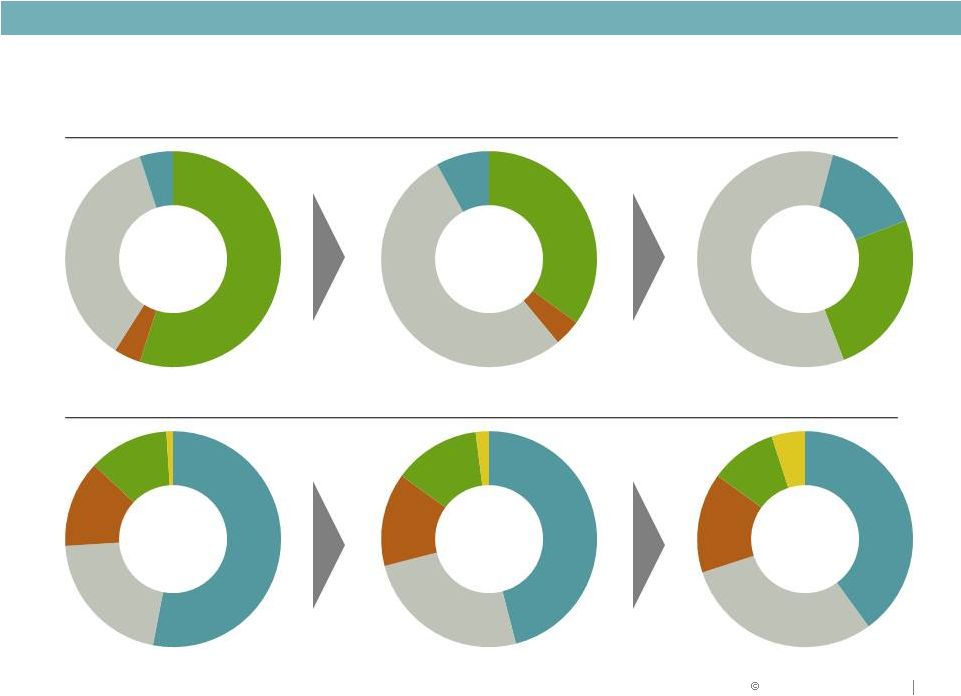 2012 Duke Realty Corporation
17
Asset Strategy
March 31, 2012
BY PRODUCT
2009
2013
BY GEOGRAPHY
ASSET STRATEGY
2009
2013
2012
Southeast
21%
Southeast
24%
Southeast
30%
2012
Office
55%
Retail
4%
Industrial
36%
Medical
Office
5%
Office
32%
Retail
4%
Industrial
53%
Medical
Office
11%
Office
25%
Industrial
60%
Medical
Office
15%
Midwest
53%
East
13%
West
1%
Midwest
40%
East
15%
South
10%
West
5%
Midwest
46%
East
14%
South
14%
West
2%
South
12% |
 2012 Duke Realty Corporation
18
Asset Strategy: Road Map
($ in millions)
Investment
12/31/10
Investment
3/31/12
ACTION PLAN
Investment
2013
PRODUCT TYPE
Amount
%
Amount
%
Acquisitions /
Developments /
Repositioning
Amount
%
Industrial
$3,645
45%
$4,264
53%
$656
$4,920
60%
Office
3,770
46%
2,529
32%
(479)
2,050
25%
Medical Office
515
6%
840
11%
390
1,230
15%
Retail
280
3%
305
4%
(305)
0
0%
$8,210
100%
$7,938
100%
$262
$8,200
100 %
REGION
Midwest
$3,970
48%
$3,710
46%
($430)
$3,280
40%
Southeast
2,270
28%
1,884
24%
526
2,460
30%
East
955
11%
1,089
14%
141
1,230
15%
South
950
12%
1,092
14%
(272)
820
10%
West
65
1%
163
2%
247
410
5%
$8,210
100%
$7,938
100%
$262
$8,200
100%
Portfolio sale accelerates suburban office repositioning
ASSET STRATEGY |
 2012 Duke Realty Corporation
19
New, High Quality Portfolio with Long-term Leases
ASSET STRATEGY
Premier portfolio of assets
Portfolio average
Bulk
Industrial
Suburban Office
Medical
Office
Property age
10.4 years
13.1 years
4.2 years
Property size
221,000 SF
117,000 SF
82,000 SF
Lease term
7.1 years
7.3 years
11.7 years
Tenant size
76,000 SF
12,000 SF
10,000 SF |
  2012
Duke Realty Corporation 20
Premier Quality Industrial Portfolio
ASSET STRATEGY
<100,000
100,000-250,000
250,000-500,000
>500,000
% to Total Square Feet
10%
26%
29%
35%
Building Square Footage (000's)
11,000
29,000
31,000
39,000
No. of Buildings
164
188
88
52
Average Tenant Size
18,700
49,100
150,000
382,500
Occupancy (at Q1
2012) 86.2%
90.5%
94.7%
97.2%
Building Size
Portfolio Metric
Industry
Leading
Focus
on
Newer
Built,
Modern
Bulk
Warehouse
Type
with strong performance characteristics |
 2012 Duke Realty Corporation
MEDICAL OFFICE STRATEGY &
Performance Update
21 |
 2012 Duke Realty Corporation
22
Healthcare Data Points
The nation’s largest industry
•
Represents more than 17% of GDP, predicted to exceed
23% by 2020
•
Americans spend more than 5% of pre-tax income on
healthcare. Lower income brackets pay 15% or more
($7,800 per capita health expenditures in 2008/2009)
Reform
•
Increased number of people insured expected to increase
by 30 to 50 million –
increased demand for care
•
Number of physicians will increase –
more space
demand
•
Hospitals expect margin pressure and need to increase
market share –
Hospitals seeking capital partners for
“non-core assets”
•
May reduce reimbursements –
real estate efficiency a
priority –
larger deals and floor plates
Healthcare systems growing and physician employment
changing
MEDICAL OFFICE STRATEGY |
 RELIABLE. ANSWERS.
2012 Duke Realty Corporation
23
Source: AHA Trendwatch Chartbook, 2011
Trends in Inpatient Days and Outpatient Visits
Outpatient demand drives occupancy in MOB’s |
 RELIABLE. ANSWERS.
2012 Duke Realty Corporation
Trends in Medical Practice Ownership
Hospitals are increasing physician employment to create efficiencies and to
position themselves to become Accountable Care Organizations
24
Source: MGMA Physician Compensation and Production Survey Report; Wall Street
Journal, 10/8/10 Hospital-owned practices creating access to better credit
generally Physicians are seeking employment in the declining reimbursement environment |
 Medical Office Portfolio at March 31, 2012
In-Service
Under
Development
Total
Properties
44
6
50
Investment $
$695 M
$145 M
$840 M
Square Feet
3.59 M
685 K
4.28 M
Occupancy
91%
86%
90%
MEDICAL OFFICE STRATEGY
©
2012
Duke
Realty
Corporation
25
Local
15%
Regional
55%
National
30%
Specialty
Hospital
7%
MOB
On-Campus
86%
MOB Off-Campus
7%
Portfolio investment
by product type
Portfolio investment by
hospital system |
 2012 Duke Realty Corporation
Top Health System Relationships
26
MEDICAL OFFICE STRATEGY
Lease Maturity (% of Total Sq. Ft.)
High credit tenants and limited lease maturity result in stable and growing
cash flow
Health System
Credit Rating
(
Moody's)
Rentable
SF
Baylor Health Care System
Aa2
461,000
Ascension Health
Aa1
367,000
Health & Hospital Corp Marion
County
Aa1
274,000
Scott & White Healthcare
A1
195,000
Franciscan Alliance, Inc.
Aa3
192,000
Carolinas Medical Center
Aa3
190,000
US Oncology, Inc.
(McKesson)
Baa2
182,000
Veterans Administration (US
Govt
Agencies)
Aaa
117,000 |
 RELIABLE. ANSWERS.
Medical Office NOI and Portfolio Occupancy
Medical office business projected to reach or exceed 15% of total asset base by
2013
NOI in
$millions
Annual NOI
Portfolio Occupancy
*Projected for lease up of unstabilized and completed development assets
*
As of 3/31/2012 |
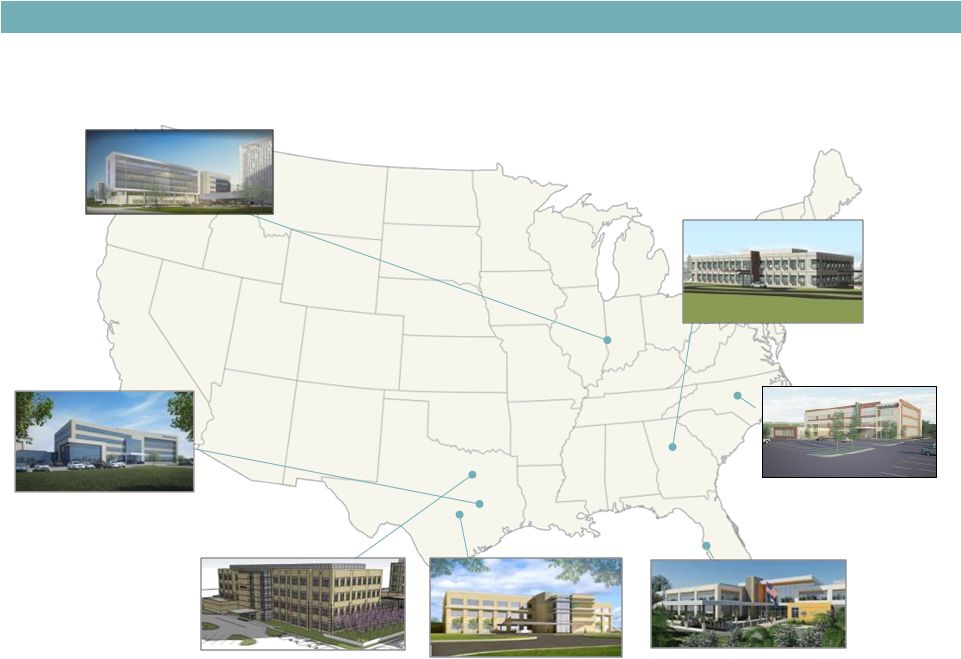 28
MEDICAL OFFICE STRATEGY
Recent Healthcare Developments
Baylor McKinney MOB I
McKinney, TX
115,000 SF, 69%
preleased
WakeMed Raleigh
Medical Park
Raleigh, NC
86,000 SF, 58% preleased
North Fulton MOB
Atlanta, GA
52,000 SF, 52% preleased
VA Tampa
Tampa, FL
117,000 SF, 100% preleased
Scott and White MOB
Marble Falls, TX
67,000 SF, 100% preleased
Scott & White MOB
College Station, TX
128,000 SF, 100% preleased
Wishard Health FOB
Indianapolis, IN
275,000 SF, 100% preleased |
 2012 Duke Realty Corporation
Our Plan
Existing healthcare assets $840 Million
New developments $200 Million in 2012
Acquire $200-$250 Million in 2012 and 2013
Our Focus
Goal: Grow Medical Office to over $1.2 Billion by 2013
29
MEDICAL OFFICE STRATEGY
On-campus assets
Major hospital system relationships |
 2012 Duke Realty Corporation
CAPITAL STRATEGY AND 2012 GUIDANCE
30 |
 2012 Duke Realty Corporation
Capital Strategy Focus
31
Reducing leverage
Increasing coverage ratios
Maintaining size and quality of unencumbered asset base
Executing portfolio repositioning in alignment with capital strategy
objectives
Further improve balance sheet strength and ratings
1
2
3
4
CAPITAL STRATEGY |
 2012 Duke Realty Corporation
32
Key Metrics & Goals
2009
Actual
2010
Actual
2011
Actual
2012
1Q
Actual
Goal
Debt to Gross Assets
44.5%
46.3%
46.8%
47.3
45.0%
Debt + Preferred to Gross
Assets
54.9%
55.5%
55.6%
54.3
50.0%
Fixed Charge Coverage
Ratio
1.79 : 1
1.79 : 1
1.82 : 1
1.81:1
2.00 : 1
Debt/EBITDA
6.65
7.31
6.02*
6.56**
< 6.00
Debt + Preferred/EBITDA
8.47
8.88
7.34*
7.64**
< 7.75
CAPITAL STRATEGY
Progressing toward strategic plan goals
*Timing of Blackstone transaction. Including adjustments to TTM EBITDA for Blackstone transaction
results in recast 2011 Debt to EBITDA of 7.03x and Debt+Preferred/EBITDA of 8.58x . **
For 1Q 2012, recast Debt to EBITDA of 7.38x and Debt+Preferred/EBITDA of 8.59x |
 RELIABLE. ANSWERS.
2012 Duke Realty Corporation
Relative Performance of Duke Realty vs. All Comps
Notes
1.
Comparables include BDN, CLI, DCT, EGP, FR, HIW, LRY, OFC, and PLD; PLD and AMB are
included historically; figures shown on a market cap weighted basis
2.
DRE stock price as of end of trading 5/31/12, @ $13.84
3.
DRE performance since 10/20 announcement of $1.1Bn office divestiture. Based upon
10/20/11 close of $10.68 YTD
2012
(2)
Since -
10/20
(3)
Ind Comps
-4.0%
S&P 400
-1.7%
FY 2011
DRE
+2.1%
Ind Comps
+13.6%
DRE
+17.6%
S&P 500
+5.2%
RMS
+8.8%
S&P 400
+5.9%
RMS
+8.7%
S&P 500
+2.1%
RMS
+19.4%
Ind Comps
+25.8%
DRE
+34.7%
S&P 400
+10.9%
S&P 500
+9.3%
Comps
-6.0%
S&P 400
-1.7%
DRE
+2.1%
Comps
+13.0%
DRE
+17.6%
S&P 500
+5.2%
RMS
+8.8%
S&P 400
+5.9%
RMS
+8.7%
S&P 500
+2.1%
FY
2011
YTD
2012
(2)
RMS
+19.4%
Comps
+22.6%
DRE
+34.7%
S&P 400
+10.9%
S&P 500
+9.3%
Since -
10/20
(3)
Industrial and Suburban Office Comps
Industrial Comps
% Total Shareholder Return
33 |
 Notes
1.
As of May 31, 2012
2.
Includes LRY, HIW, CLI, BDN, and OFC
3.
Includes PLD, FR, EGP, DCT, and LRY
4.
DCT’s beta only available since its IPO. Barra began tracking DCT’s
beta in Dec 2006 Duke Realty and Peers Barra Beta Analysis
Beta Trends are Slowly Improving Consistent with Asset and Capital Strategy….
Working on Further Lowering Beta
Source: Barra Beta and Morgan Stanley
CAPITAL STRATEGY
©
2012
Duke
Realty
Corporation
34 |
 2012 Duke Realty Corporation
35
CAPITAL STRATEGY
Executing on capital strategy objectives
CAPITAL SOURCE
2007
2008
2009
2010
2011
2012
YTD
TOTAL
Common Stock
$230
-
$575
$311
-
$150
$1,266
Preferred Stock
-
$300
-
-
-
-
$300
Unsecured Debt
$300
$325
$500
$250
-
$300
$1,675
Secured Debt
-
-
$270
-
-
-
$270
Asset Dispositions
$785
$475
$300
$533
$1,650
$65
$3,808
TOTAL
$1,315
$1,100
$1,645
$1,094
$1,650
$515
$7,319
•
Investment grade rated debt for over 15 years
•
Proven access to multiple capital sources
•
Available line of credit -
$850 million capacity
•
Dividend covered by AFFO
Continue to strengthen balance sheet
($ in millions) |
 Strong support from high quality fixed income investors
36
$300 million 10 year senior
notes offering
T+ 280 (coupon of 4.375%)
Significantly oversubscribed
Lowest coupon in 10 year senior
notes execution ever
60% of top 30 investors new
CAPITAL STRATEGY
$300,000,000
4.375% Senior Notes due June 15, 2022
Issuer:
Duke Realty Limited Partnership
Ratings (Moody’s / S&P)*:
Baa2/BBB-
(stable/stable)
Securities:
Senior unsecured
Format:
SEC registered
Principal Amount:
$300,000,000
Trade Date:
June 6, 2012
Settlement Date:
June 11, 2012 (T+3)
Maturity Date:
June 15, 2022
Interest Payment Dates:
June 15 and December 15, beginning December 15, 2012
Benchmark Treasury:
1.75% due May 15, 2022
Benchmark Treasury Price / Yield:
100-24+ / 1.666%
Spread to Benchmark Treasury:
+280 bps
Yield to Maturity:
4.466%
Coupon:
4.375% per annum (payable semi-annually)
Price to Public:
99.271%
Optional Redemption:
CUSIP/ ISIN:
26441Y AV9 / US26441YAV92
Joint Book-Running Managers:
Barclays Capital Inc.
RBC Capital Markets, LLC
Wells Fargo Securities, LLC
Senior Co-Managers:
J.P. Morgan Securities LLC
Morgan Stanley & Co. LLC
Scotia Capital (USA) Inc.
UBS Securities LLC
Co-Managers:
Credit Suisse Securities (USA) LLC
PNC Capital Markets LLC
SunTrust Robinson Humphrey, Inc.
U.S. Bancorp Investments, Inc.
Duke Realty Bond Transaction
Prior to March 15, 2022 at the Make-Whole Amount of Treasury plus 45
bps. On or after March 15, 2022, the notes will not
include a Make-Whole Amount |
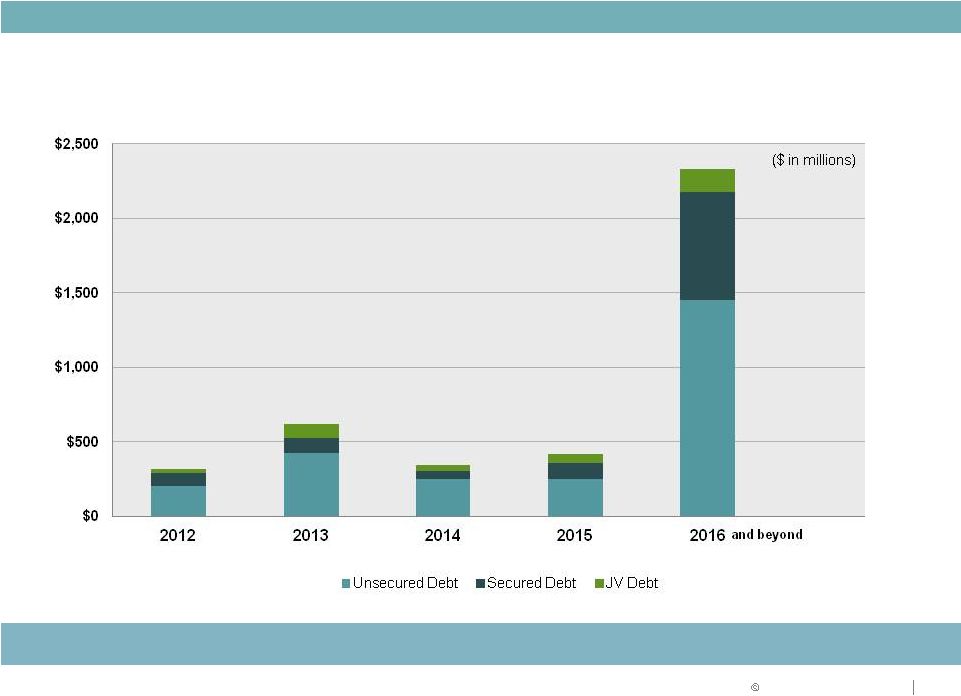 2012 Duke Realty Corporation
37
Liquidity Position
CAPITAL STRATEGY
Manageable debt maturities |
  2012
Duke Realty Corporation 2012 Range of Estimates
($ in millions)
Leasing Actions Combined with Modest Rental Rate Increases Drive
Upside
38
Metrics
2011
Actual
Q1 2012
Actual
Pessimistic
Optimistic
Key 2012 Assumptions
Core FFO per share
$1.15
$0.24
$0.94
$1.06
- Blackstone/repositioning dilution $.10 - $.12
- Lower service operations income
- Partially offset by improvement in occupancy of core portfolio
AFFO Payout Ratio
87%
85%
96%
80%
- Annual dividend maintained at $0.68 per share
Avg Occupancy - In-Service
89.7%
91.3%
89.5%
92.5%
- Positive momentum anticipated given industrial and medical office performa
- Lower expirations than 2011 (7% vs. 10%)
- Upside to guidance driven by lease-up of portfolio
Same Property NOI Growth
3.2%
3.6%
(1.5%)
2.5%
- Occupancy increase lower than 2011
- Rental rate pressure remains
Building Acquisitions
$747
$157
$300
$500
- Remain selective regarding property type and location in alignment with
long-term strategy
- Focus on industrial and medical office
Building Dispositions
$1,634
$64
$200
$300
- Continue to prune remaining non-core office portfolio
Land Sale Proceeds
$12
$2
$20
$30
- Selling 10% to 20% of identified non-strategic parcels
- Demand still sluggish
$489
$138
$300
$500
- Comprised of medical office and industrial starts
- Development of $200 to $300 million
- Third party of $100 to $200 million
Construction Volume
$727
$107
$400
$600
- Wind down of BRAC project partially offset by development volume
Service Operations Income
$46
$6
$20
$25
- Reduced fees from BRAC project
General & Admin expense
$40
$12
$43
$38
- In line with 2011
2012 Range of Estimates
Construction and
Development Starts
CAPITAL STRATEGY |
 2012 Duke Realty Corporation
39
WHY DUKE REALTY?
Quality portfolio improving with asset strategy
Solid balance sheet improving with capital strategy
Unmatched ability to execute on daily operations
Development capabilities in place with existing land bank
Talent and leadership depth to execute
Delivering on what we say we will do
MEDICAL OFFICE STRATEGY |
 RELIABLE. ANSWERS.
2012 Duke Realty Corporation
Forward-Looking Statement
40
This slide presentation contains statements that constitute “forward-looking statements”
within the meaning of the Securities Act of 1933 and the Securities Exchange Act of 1934 as
amended by the Private Securities Litigation Reform Act of 1995. These forward-looking
statements include, among others, our statements regarding (1) strategic initiatives with respect
to our assets, operations and capital and (2) the assumptions underlying our expectations.
Prospective investors are cautioned that any such forward-looking statements are not
guarantees of future performance and involve risks and uncertainties, and that actual results may differ
materially from those contemplated by such forward-looking statements. A number of important
factors could cause actual results to differ materially from those contemplated by
forward-looking statements in this slide presentation. Many of these factors are beyond
our ability to control or predict. Factors that could cause actual results to differ
materially from those contemplated in this slide presentation include the factors set forth in our
filings with the Securities and Exchange Commission, including our annual report on Form10-K,
quarterly report on Form 10-Q and current reports on Form 8-K. We believe these
forward-looking statements are reasonable, however, undue reliance should not be placed on
any forward-looking statements, which are based on current expectations. We do not
assume any obligation to update any forward-looking statements as a result of new information
or future developments or otherwise. Certain of the financial measures appearing in this slide presentation are or may be considered to be
non-GAAP financial measures. Management believes that these non-GAAP financial measures
provide additional appropriate measures of our operating results. While we believe these
non-GAAP financial measures are useful in evaluating our company, the information should be
considered supplemental in nature and not a substitute for the information prepared in accordance
with GAAP. We have provided for your reference supplemental financial disclosure for these
measures, including the most directly comparable GAAP measure and an associated reconciliation in
our most recent quarter supplemental report, which is available on our website at
www.dukerealty.com. Our
most recent quarter supplemental report also includes the information necessary to
recalculate certain operational ratios and ratios of financial position. The
calculation of these non-GAAP measures may differ from the methodology used by other REITs,
and therefore, may not be comparable.
|