Attached files
| file | filename |
|---|---|
| EX-99.1 - PRESS RELEASE - FIRST COMMUNITY BANKSHARES INC /VA/ | v315709_ex99-1.htm |
| 8-K - CURRENT REPORT - FIRST COMMUNITY BANKSHARES INC /VA/ | v315709_8k.htm |

NASDAQ: FCBC June 2012 www.fcbinc.com
This presentation may include forward - looking statements. These forward - looking statements include, but are not limited to, statements about (i) the benefits of merger and acquisition activity involving First Community Bancshares, Inc. and subsidiaries (the “Company”), including future financial and operating results, cost savings enhancements to revenue and accretion to reported earnings that may be realized from such activities; (ii) the Company’s plans , objectives, expectations and intentions and other statements contained in this presentation that are not historical facts; and (iii) other statements identified by words such as “expects,” “anticipates,” “intends,” “plans,” “believes,” “seeks,” “estimates,” “targets,” “projects,” or words of similar meaning generally intended to identify forward - looking statements. These forward - looking statements are based upon the current beliefs and expectations of the management of the Company and are inherently subject to significant business, economic and competitive uncertainties and contingencies, many of which are beyond the control of the Company. In addition, these forward - looking statements are subject to assumptions with respect to future business strategies and decisions that are subject to change. Actual results may differ materially from the anticipated results discussed in these forward - looking statements because of possible uncertainties. These forward - looking statements are based on current expectations that involve risks, uncertainties and assumptions. Should one or more of these risks or uncertainties materialize or should underlying assumptions prove incorrect, actual results may differ materially. These risks include: changes in business or other market conditions; the timely development, production and acceptance of new products and services; the challenge of managing asset/liability levels; the management of credit risk and interest rate risk; the difficulty of keeping expense growth at modest levels while increasing revenues; and other risks detailed from time to time in the Company’s Securities and Exchange Commission reports, including but not limited to the Annual Report on Form 10 - K for the most recent year ended, the Quarterly Report on Form 10 - Q for the most recent quarter, and the Company’s current report filings on Form 8 - K. Pursuant to the Private Securities Litigation Reform Act of 1995, the Company does not undertake to update forward - looking statements contained within this presentation. 2 Forward - Looking Disclosures
Transaction Overview 3 Structure: • FCBC has purchased and assumed certain assets and liabilities from the FDIC as receiver of Waccamaw Bank, Whiteville, NC Assets: • Purchased approximately $513 million in total assets, including $330 million in loans – All residential and commercial loans and OREO are 80.0% covered by a loss - share agreement Liabilities: • Assumed approximately $428 million in deposits – No deposit premium Other: • Acquired 16 branches: – Adds 12 branches to FCBC’s North Carolina franchise and expands presence into South Carolina with 4 branches • Asset discount bid of $15 million • All regulatory approvals have been received • Transaction closed on June 8, 2012
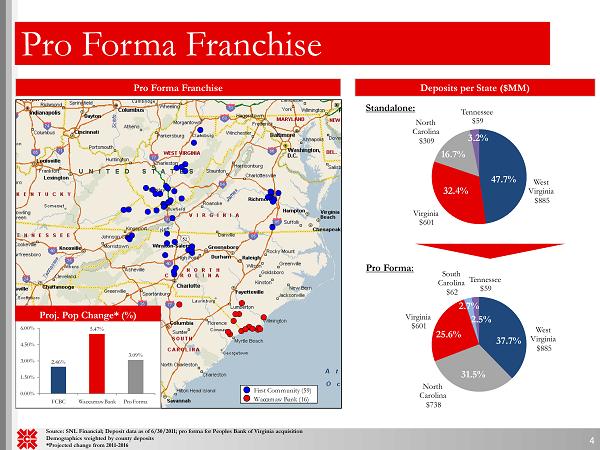
2.46% 5.47% 3.09% 0.00% 1.50% 3.00% 4.50% 6.00% FCBC Waccamaw Bank Pro Forma Pro Forma Franchise West Virginia $885 North Carolina $738 Virginia $601 South Carolina $62 Tennessee $59 West Virginia $885 Virginia $601 North Carolina $309 Tennessee $59 Pro Forma Franchise Standalone: 4 First Community (59) Waccamaw Bank (16) Deposits per State ($MM) Pro Forma: Proj. Pop Change* (%) Source: SNL Financial; Deposit data as of 6/30/2011; pro forma for Peoples Bank of Virginia acquisition Demographics weighted by county deposits *Projected change from 2011 - 2016 47.7% 32.4% 16.7% 3.2% 31.5% 37.7% 25.6% 2.5% 2.7%
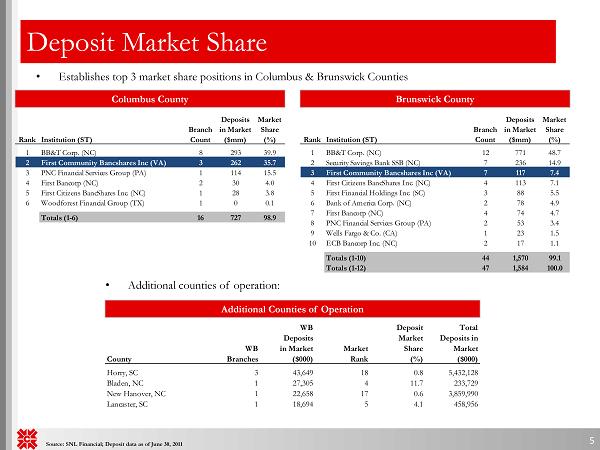
County WB Branches WB Deposits in Market ($000) Market Rank Deposit Market Share (%) Total Deposits in Market ($000) Horry, SC 3 43,649 18 0.8 5,432,128 Bladen, NC 1 27,305 4 11.7 233,729 New Hanover, NC 1 22,658 17 0.6 3,859,990 Lancaster, SC 1 18,694 5 4.1 458,956 Deposit Market Share • Establishes top 3 market share positions in Columbus & Brunswick Counties 5 Source: SNL Financial; Deposit data as of June 30, 2011 Columbus County Brunswick County Deposits Market Branch in Market Share Rank Institution (ST) Count ($mm) (%) 1 BB&T Corp. (NC) 8 293 39.9 2 First Community Bancshares Inc (VA) 3 262 35.7 3 PNC Financial Services Group (PA) 1 114 15.5 4 First Bancorp (NC) 2 30 4.0 5 First Citizens BancShares Inc. (NC) 1 28 3.8 6 Woodforest Financial Group (TX) 1 0 0.1 Totals (1-6) 16 727 98.9 Deposits Market Branch in Market Share Rank Institution (ST) Count ($mm) (%) 1 BB&T Corp. (NC) 12 771 48.7 2 Security Savings Bank SSB (NC) 7 236 14.9 3 First Community Bancshares Inc (VA) 7 117 7.4 4 First Citizens BancShares Inc. (NC) 4 113 7.1 5 First Financial Holdings Inc. (SC) 3 88 5.5 6 Bank of America Corp. (NC) 2 78 4.9 7 First Bancorp (NC) 4 74 4.7 8 PNC Financial Services Group (PA) 2 53 3.4 9 Wells Fargo & Co. (CA) 1 23 1.5 10 ECB Bancorp Inc. (NC) 2 17 1.1 Totals (1-10) 44 1,570 99.1 Totals (1-12) 47 1,584 100.0 Additional Counties of Operation • Additional counties of operation:
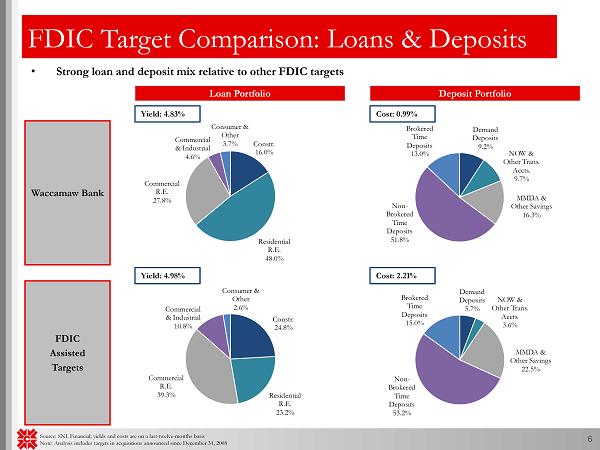
• Strong loan and deposit mix relative to other FDIC targets Source: SNL Financial; yields and costs are on a last - twelve - months basis Note: Analysis includes targets in acquisitions announced since December 31, 2008 6 FDIC Target Comparison: Loans & Deposits Loan Portfolio Deposit Portfolio Waccamaw Bank FDIC Assisted Targets Constr. 16.0% Residential R.E. 48.0% Commercial R.E. 27.8% Commercial & Industrial 4.6% Consumer & Other 3.7% Demand Deposits 9.2% NOW & Other Trans. Accts. 9.7% MMDA & Other Savings 16.3% Non - Brokered Time Deposits 51.8% Brokered Time Deposits 13.0% Constr. 24.8% Residential R.E. 23.2% Commercial R.E. 39.3% Commercial & Industrial 10.8% Consumer & Other 2.6% Demand Deposits 5.7% NOW & Other Trans. Accts. 3.6% MMDA & Other Savings 22.5% Non - Brokered Time Deposits 53.2% Brokered Time Deposits 15.0% Yield: 4.83% Yield: 4.98% Cost: 0.99% Cost: 2.21%
Strategically & Financially Compelling 7 • Consistent with our acquisition strategy – Extends footprint to a target growth market – Significantly accretive to core earnings per share – Deploys excess capital – No raise necessary – Minimal tangible book value dilution – Earnback dilution in approximately 2 years – Strong IRR in excess of 15% – Low risk transaction due to FDIC loss coverage – Financially attractive even under stress case modeling scenarios