Attached files
| file | filename |
|---|---|
| 8-K - FORM 8-K - SURO CAPITAL CORP. | v315425_8k.htm |
Exhibit 99.1
Annual Shareholder Meeting Michael Moe, CEO June 5, 2012

2 This presentation contains forward looking statements that involve substantial risks and uncertainties. All forward - looking stat ements included in this presentation are made only as of the date hereof and are subject to change without notice. Actual outcomes a nd results could differ materially from those suggested by this presentation due to the impact of many factors beyond the control of GSV Ca pital Corp. (“GSVC”), including those listed in the "Risk Factors" section of our filings with the Securities and Exchange Commissi on (“SEC”). Any such forward - looking statements are made pursuant to the safe harbor provisions available under applicable securities laws a nd GSVC assumes no obligation to update or revise any such forward - looking statements unless required by law . Certain information discussed in this presentation (including information relating to portfolio companies) was derived from t hir d party sources and has not been independently verified and, accordingly, GSVC makes no representation or warranty in respect of this information . The following slides contain summaries of certain financial and statistical information about GSVC. The information contained in this presentation is summary information that is intended to be considered in the context of our SEC filings and other public anno unc ements that we may make, by press release or otherwise, from time to time. We undertake no duty or obligation to publicly update or rev ise the information contained in this presentation unless required by law. In addition, information related to past performance, whil e h elpful as an evaluative tool, is not necessarily indicative of future results, the achievement of which cannot be assured. You should not vie w the past performance of GSVC or any of its portfolio companies, or information about the market, as indicative of GSVC’s or any of its po rtfolio companies’ future results. The performance data stated herein may have been due to extraordinary market conditions, which may no t be duplicated in the future. Current performance may be lower or higher than the performance data quoted. This presentation does no t constitute an offer to sell or the solicitation of an offer to buy any securities of GSVC. Forward - Looking Statements
Disciplined investment approach and demonstrated access to attractive pre - IPO opportunities 3 GSVC Summary Capitalizing on favorable dynamics for private company investing – disruptive technologies and longer time to liquidity Diversified portfolio of leading high - growth VC - backed companies Accomplished management team with relevant investing experience Liquid, publicly - traded security for investors to participate in pre - IPO value creation
4 Past 12 Months… Completed IPO in April 2011 with an innovative public security to invest in the fastest growing private companies in the world GSVC provides access for public investors as well as liquidity and capital for private companies Raised nearly $300 million of gross proceeds in 4 offerings and have invested in 32 companies including world class growth companies such as Twitter, Facebook, Dropbox , Bloom Energy, etc. NAV of $13.47 per share as of 3/31/12 and subsequently did an accretive follow - on offering of 6,900,000 shares at $16.25 per share, raising $105 million net Cash of approximately $120.0 million, $6.20 per share as of June 5, 2012 Continue to remain disciplined on core principles – the 4 Ps, people, product, potential and predictability and invest in the fastest growing private companies in the marketplace Fast Facts

5 Investment Portfolio GSVC has made $ 150mm of investments in 32 companies since the IPO ($3.8mm) ($2.3mm) ($31.5mm ) ( $2.0mm ) ($5.5mm) ($2.5mm) ($0.7mm) ($10.0mm) ($4.0mm) (1) ( $10.5mm ) ($2.0mm) ($ 0.3mm ) ($4.9mm) ($3.5mm) ($2.0mm) ($ 1.5mm ) ($5.0mm) ($0.75mm) ( $11.9mm ) ($2.0mm) ($ 1.3mm ) ($ 0.7mm ) ($0.25mm) ($2.0mm) ($3.0mm) ($ 0.2mm ) ($4.0mm) ($ 14.8mm ) ($ 2.2mm ) Note: Investments are shown at fair value as of March 31, 2012 for those investments held as of March 31, 2012. For those inves tments acquired subsequent to March 31, 2012, our board of directors has not yet determined their fair value and such investments are include d a t purchase cost on the acquisition date exclusive of transaction fees and costs (1) Structured note ( $4.2mm ) ($10.0mm ) ( $1.0mm ) NestGSV

6 Investment Timeline IPO 4/28/2011 Raised $46.5mm First Follow - On 9/23/2011 89% of IPO proceeds invested Raised additional $29.6mm Second Follow - On 2/10/2012 85% of total proceeds invested Raised additional $96.3mm $0.21mm $0.71mm $0.28mm $0.19mm $0.20mm $0.90mm $3.25mm $4.00mm $0.25mm $2.00mm $2.25mm $1.68mm $3.88mm $2.00mm $0.50mm $3.50mm $1.00mm $0.75mm $1.00mm $0.50mm $1.97mm $5.00mm $0.17mm $0.17mm $0.16mm $0.09mm $0.85mm $1.18mm $0.50mm $0.50mm $2.90mm $3.69mm $5.20mm $0.80mm $1.75mm $1.75mm $1.75mm $1.6mm $3.6mm Current Follow - On 5/2012 55% of total proceeds invested $0.10mm $0.15mm $0.20mm $0.50mm $4.00mm $0.25mm $0.75mm $1.00mm $2.00mm $4.00mm $3.00mm $10.00mm $0.86mm $1.14mm $2.37mm $1.28mm $0.35mm $5.31mm $4.88mm $7.31mm $3.80mm $1.97mm $0.75mm $2.50mm Note: Investments are shown at cost excluding transaction costs and fees. $0.27mm $0.22mm $0.27mm $0.14mm $10.00mm

7 GSVC ’ s Investing Ecosystem Michael Moe, CFA Stephen Bard, CFA Paul Lapping Luben Pampoulov Matthew Hanson, CFA Mark Flynn Mark Klein Michael Moe Leonard Potter David Spreng Scott Bedford Todd Bradley Bill Campbell Bob Grady Marc Mazur Dave Crowder Advisory Board Board of Directors
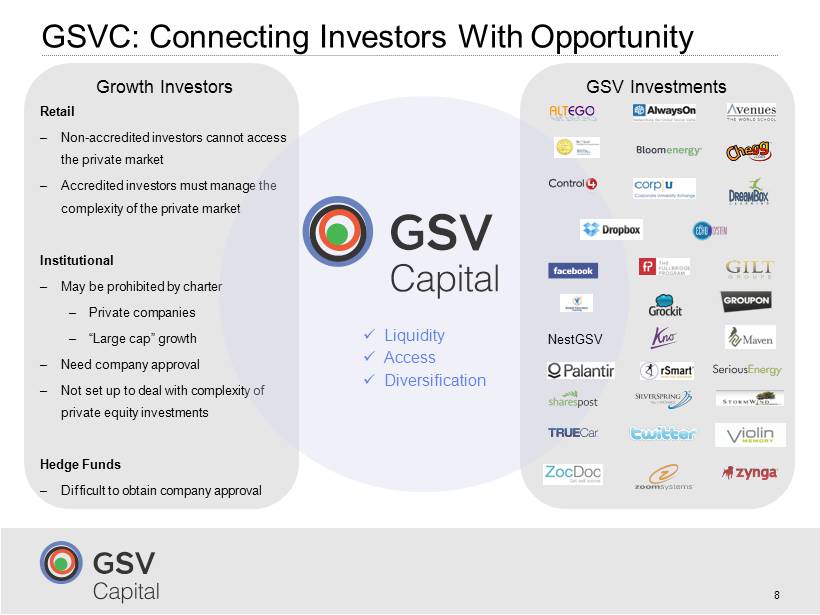
GSVC: Connecting Investors With Opportunity 8 Growth Investors GSV Investments Retail – Non - accredited investors cannot access the private market – Accredited investors must manage the complexity of the private market Institutional – May be prohibited by charter – Private companies – “Large cap” growth – Need company approval – Not set up to deal with complexity of private equity investments Hedge Funds – Difficult to obtain company approval x Liquidity x Access x Diversification NestGSV
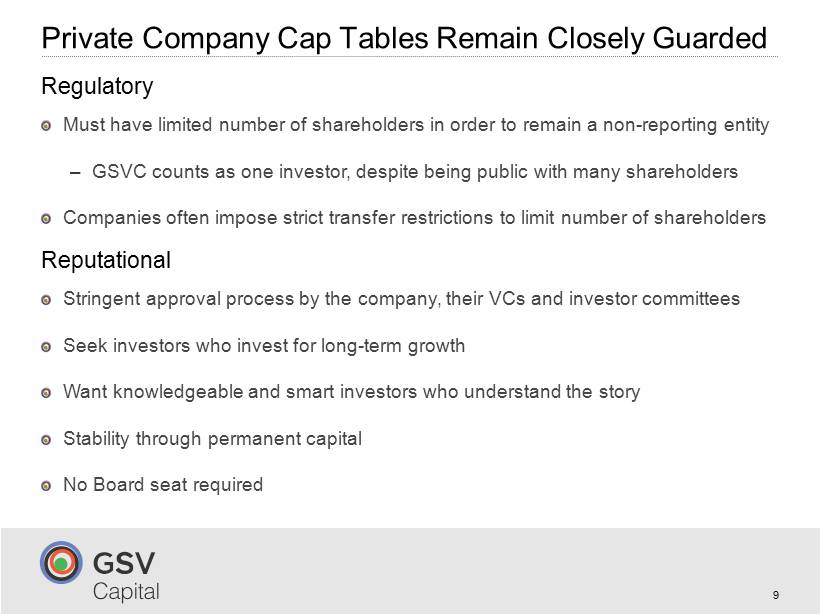
9 Private Company Cap Tables Remain Closely Guarded Regulatory Reputational Must have limited number of shareholders in order to remain a non - reporting entity – GSVC counts as one investor, despite being public with many shareholders Companies often impose strict transfer restrictions to limit number of shareholders Stringent approval process by the company, their VCs and investor committees Seek investors who invest for long - term growth Want knowledgeable and smart investors who understand the story Stability through permanent capital No Board seat required
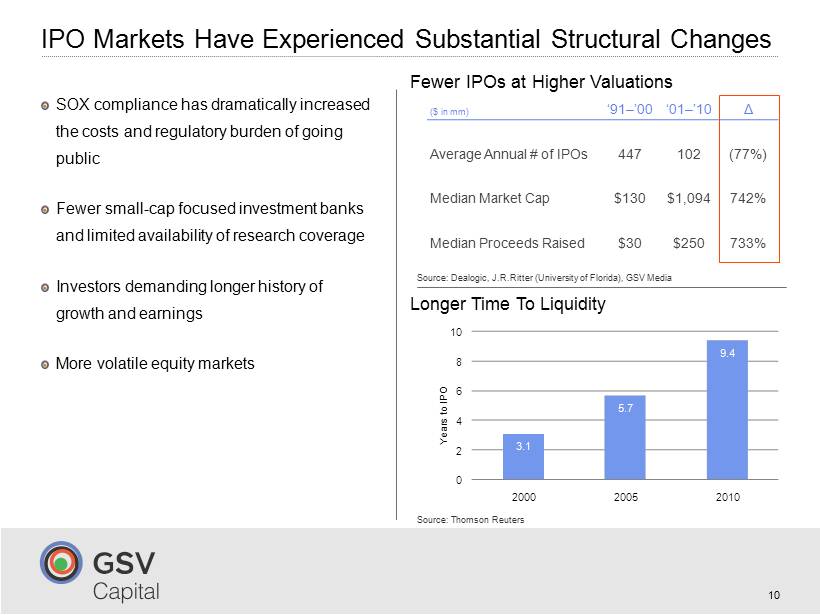
3.1 5.7 9.4 0 2 4 6 8 10 2000 2005 2010 10 IPO Markets Have Experienced Substantial Structural Changes SOX compliance has dramatically increased the costs and regulatory burden of going public Fewer small - cap focused investment banks and limited availability of research coverage Investors demanding longer history of growth and earnings More volatile equity markets Fewer IPOs at Higher Valuations Longer Time To Liquidity ($ in mm) ‘ 91 – ’ 00 ‘ 01 – ’ 10 Δ Average Annual # of IPOs 447 102 (77%) Median Market Cap $130 $1,094 742% Median Proceeds Raised $30 $250 733% Source: Dealogic, J.R.Ritter (University of Florida), GSV Media Source: Thomson Reuters Years to IPO

Recent Est. Valuation $8.4bn (1) $4.0bn (2) $2.5bn (3) $2.1bn (4) $1.6bn (5) Potential for Substantial Returns Shifting to Private Investors 11 Source: GSV Insight Past High - Growth IPOs Value of Private Companies Today Companies that would have been public in prior years are staying private longer and significantly more value is accruing to private investors (4) SharesPost trade on 12/19/2011 (5) SharesPost trade on 7/20/ 2011 (1) AllThingsD , 8/1/ 2011 (2) Crunchbase , 10/2011 (3) TechCrunch article on 5/15/2012 Year of IPO Mkt. Cap at IPO Mkt. Cap Increase to Today 1971 $53mm 2,568x 1986 $519mm 473x 1986 $228mm 626x 1988 $212mm 142x 1991 $314mm 310x 1992 $220mm 163x
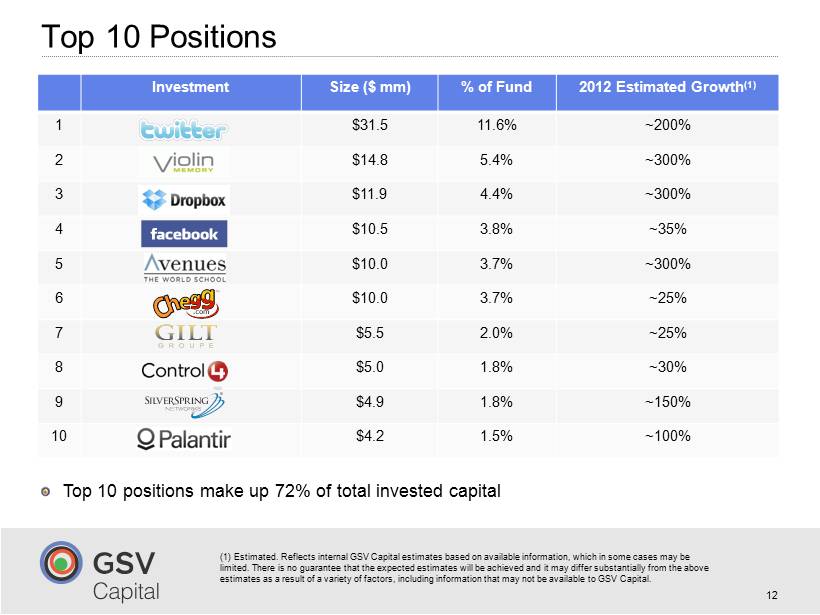
Top 10 Positions 12 Investment Size ($ mm) % of Fund 2012 Estimated Growth (1) 1 $31.5 11.6% ~200% 2 $14.8 5.4% ~300% 3 $11.9 4.4% ~300% 4 $10.5 3.8% ~35% 5 $10.0 3.7% ~300% 6 $10.0 3.7% ~25% 7 $5.5 2.0% ~25% 8 $5.0 1.8% ~30% 9 $4.9 1.8% ~150% 10 $4.2 1.5% ~100% ( 1) Estimated. There is no guarantee that expected growth rate will be achieved. Top 10 positions make up 72% of total invested capital
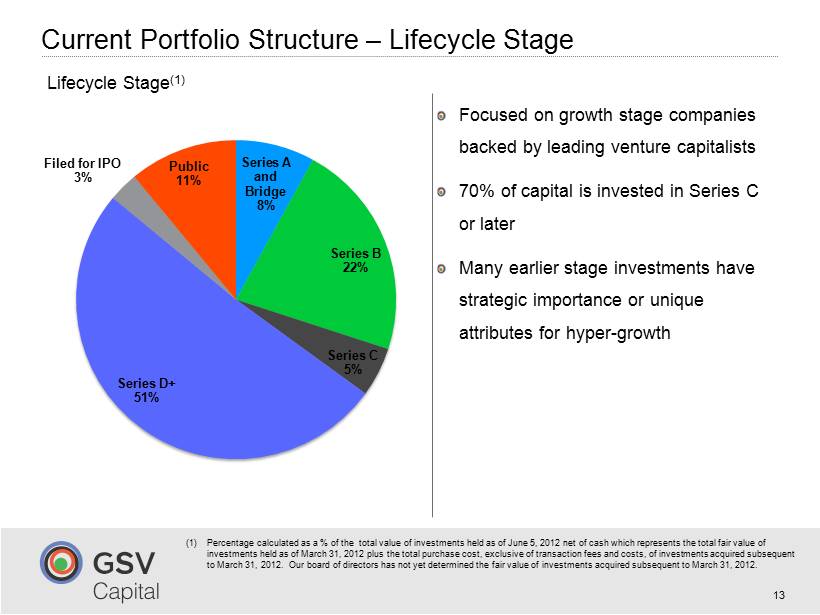
13 Current Portfolio Structure – Lifecycle Stage (1) Percentage calculated as a % of the total value of investments held as of June 5, 2012 net of cash which represents the total fair value of investments held as of March 31, 2012 plus the total purchase cost, exclusive of transaction fees and costs, of investments acquired subsequent to March 31, 2012 . Our board of directors has not yet determined the fair value of investments acquired subsequent to March 31, 2012 . Lifecycle Stage (1) Series A and Bridge 8% Series B 22% Series C 5% Series D+ 51% Filed for IPO 3% Public 11% Focused on growth stage companies backed by leading venture capitalists 70% of capital is invested in Series C or later Many earlier stage investments have strategic importance or unique attributes for hyper - growth
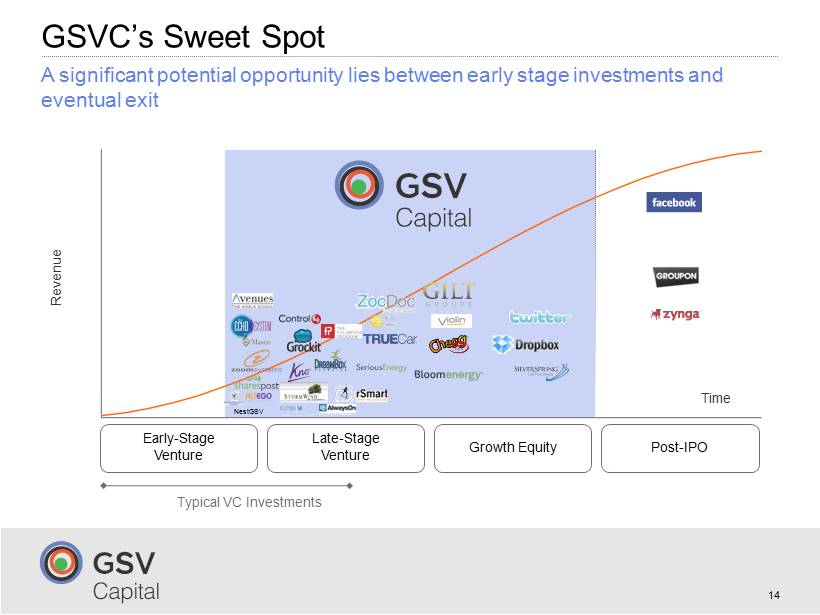
14 GSVC ’ s Sweet Spot Time Revenue A significant opportunity lies between early stage investments and eventual exit Early - Stage Venture Late - Stage Venture Growth Equity Post - IPO Typical VC Investments NestGSV
Investment Strategy
GSVC Philosophy 16 Over time, equity value is highly correlated to revenue and earnings growth. Growth drives stock price.

Top Performing Stocks – 2001 to 2011 Company Stock Mkt Cap (mil) EPS Revenue CAGR 12/31 /01 12/31 /11 CAGR 2001 2011 CAGR 1 Monster Beverage Corp. 68% $42 $8,024 55% $81 $1,703 36% 2 Deckers Outdoor 49% $40 $2,918 54% $91 $1,377 31% 3 NewMarket Corp. 46% $77 $2,656 45% $708 $2,150 12% 4 Sohu.com Inc. 45% $43 $1,904 27% $12 $830 52% 5 Clean Harbors, Inc. 44% $39 $3,382 27% $252 $1,984 23% 6 Apple Inc. 43% $7,703 $376,411 57% $5,731 $ 127,841 36% 7 Middleby Corp. 43% $47 $1,758 48% $104 $856 24% 8 Sina Corp. 42% $73 $3,425 NM $25 $483 35% 9 Terra Nitrogen Company 41% $97 $3,138 29% $305 $798 10% 10 HMS Holdings Corp. 41% $56 $2,720 28% $59 $364 20% 11 W.R. Grace & Co. 40% $102 $3,390 11% $1,723 $3,212 6% 12 Concur Technologies 39% $48 $2,747 NM $41 $370 25% 13 Cliffs Natural Resources 39% $186 $8,917 32% $349 $6,794 35% 14 Southwestern Energy 38% $260 $11,095 26% $345 $2,953 24% 15 Jos. A Bank Clothiers Inc. 38% $42 $1,357 27% $206 $858 15% 17 Source: CapitalIQ .
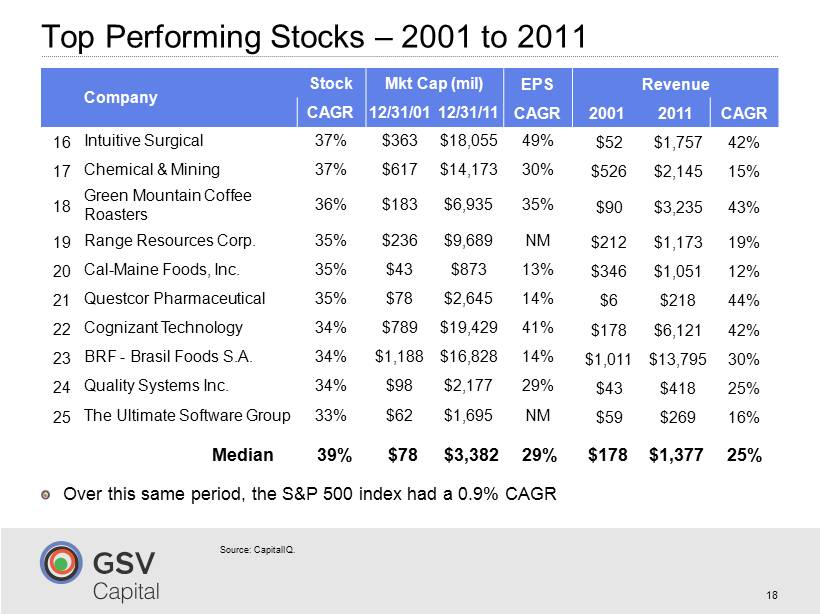
Top Performing Stocks – 2001 to 2011 18 Median 39% $78 $3,382 29% $178 $1,377 25% Company Stock Mkt Cap (mil) EPS Revenue CAGR 12/31 /01 12/31 /11 CAGR 2001 2011 CAGR 16 Intuitive Surgical 37% $363 $18,055 49% $52 $1,757 42% 17 Chemical & Mining 37% $617 $14,173 30% $526 $2,145 15% 18 Green Mountain Coffee Roasters 36% $183 $6,935 35% $90 $3,235 43% 19 Range Resources Corp. 35% $236 $9,689 NM $212 $1,173 19% 20 Cal - Maine Foods, Inc . 35% $43 $873 13% $346 $1,051 12% 21 Questcor Pharmaceutical 35% $78 $2,645 14% $6 $218 44% 22 Cognizant Technology 34% $789 $19,429 41% $178 $6,121 42% 23 BRF - Brasil Foods S.A . 34% $1,188 $16,828 14% $1,011 $13,795 30% 24 Quality Systems Inc. 34% $98 $2,177 29% $43 $418 25% 25 The Ultimate Software Group 33% $62 $1,695 NM $59 $269 16% Over this same period, the S&P 500 index had a 0.9% CAGR Source: CapitalIQ .
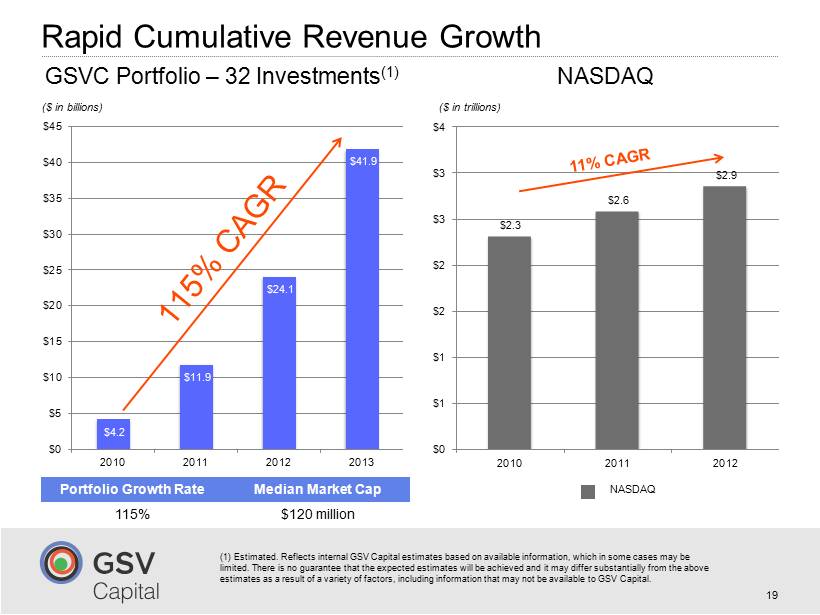
$2.3 $2.6 $2.9 $0 $1 $1 $2 $2 $3 $3 $4 2010 2011 2012 Rapid Cumulative Revenue Growth $4.2 $11.9 $24.1 $41.9 $0 $5 $10 $15 $20 $25 $30 $35 $40 $45 2010 2011 2012 2013 19 ($ in billions) Portfolio Growth Rate Median Market Cap 115% $120 million ($ in trillions) GSVC Portfolio – 32 Investments (1) NASDAQ NASDAQ (1) GSVC Estimates. There is no guarantee that expected growth will be achieved

20 We Are In The Midst of Game - Changing Growth Themes… Cloud Green Tech Internet Commerce Social - Mobile Education Technology
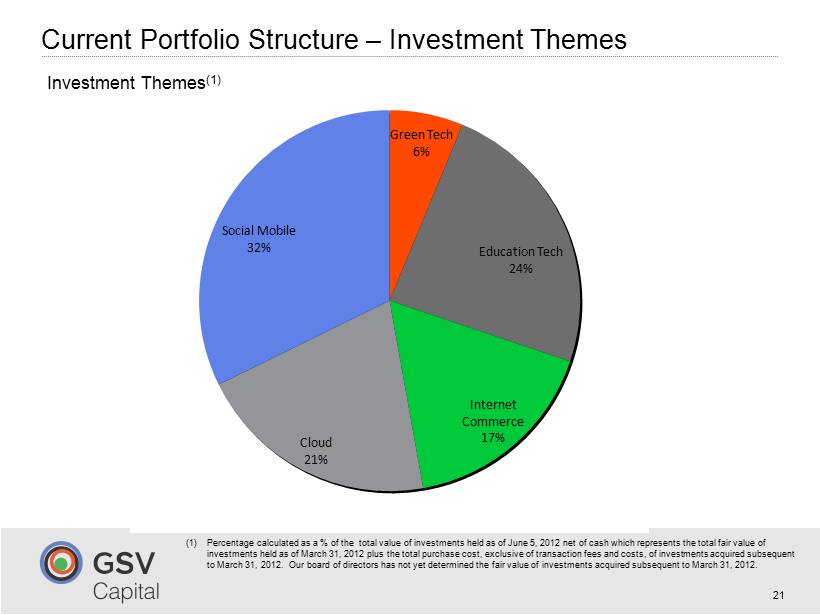
Green Tech 6% Education Tech 24% Internet Commerce 17% Cloud 21% Social Mobile 32% 21 Current Portfolio Structure – Investment Themes (1) Percentage calculated as a % of the total value of investments held as of June 5, 2012 net of cash which represents the total fair value of investments held as of March 31, 2012 plus the total purchase cost, exclusive of transaction fees and costs, of investments acquired subsequent to March 31, 2012 . Our board of directors has not yet determined the fair value of investments acquired subsequent to March 31, 2012 . Investment Themes (1)
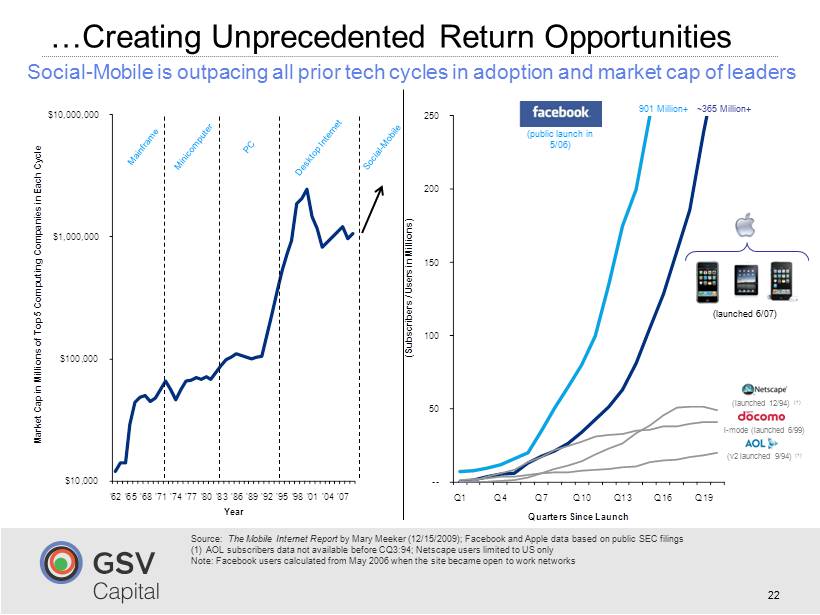
…Creating Unprecedented Return Opportunities 22 Source: The Mobile Internet Report by Mary Meeker (12/15/2009); Facebook and Apple data based on public SEC filings (1) AOL subscribers data not available before CQ3:94; Netscape users limited to US only Note: Facebook users calculated from May 2006 when the site became open to work networks Social - Mobile is outpacing all prior tech cycles in adoption and market cap of leaders $10,000 $ 100 , 000 $1,000,000 $10,000,000 '62 '65 ' 68 ' 71 ' 74 '77 '80 '83 '86 ' 89 '92 ' 95 '98 ' 01 '04 '07 Market Cap in Millions of Top 5 Computing Companies in Each Cycle Year -- 50 100 150 200 250 Q1 Q4 Q7 Q10 Q13 Q16 Q19 (Subscribers / Users in Millions) Quarters Since Launch (launched 12/94) (1) i - mode (launched 6/99) (v2 launched 9/94) (1) (launched 6/07) ~365 Million+ (public launch in 5/06) 901 Million+
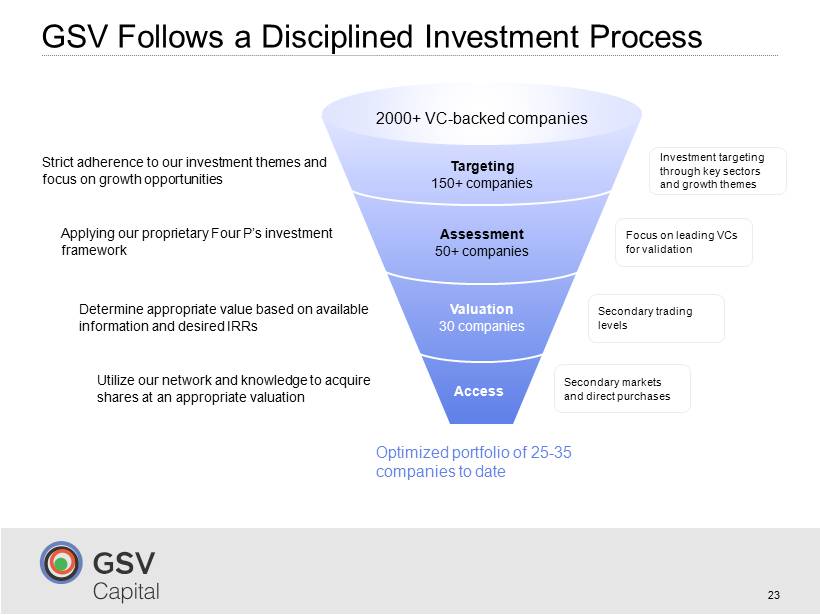
GSV Follows a Disciplined Investment Process 23 Access Targeting 150+ companies Assessment 50+ companies 2000+ VC - backed companies Valuation 30 companies Optimized portfolio of 25 - 35 companies to date Strict adherence to our investment themes and focus on growth opportunities Applying our proprietary Four P ’ s investment framework Determine appropriate value based on available information and desired IRRs Utilize our network and knowledge to acquire shares at an appropriate valuation Secondary trading levels Focus on leading VCs for validation Investment targeting through key sectors and growth themes Secondary markets and direct purchases
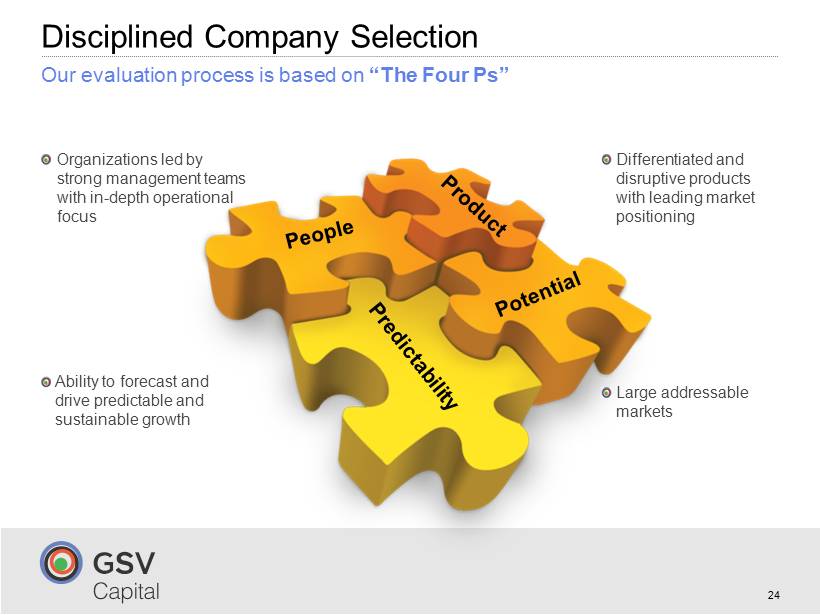
24 Disciplined Company Selection Our evaluation process is based on “ The Four Ps ” Differentiated and disruptive products with leading market positioning Large addressable markets Organizations led by strong management teams with in - depth operational focus Ability to forecast and drive predictable and sustainable growth

25 Case Study: Twitter Other Investors Investment: $31.5mm Investment Information Twitter is a real - time information network utilizing short - message microblogging available on the web and mobile applications 140 million monthly active users (MAUs) growing to an estimated 250 million MAUs by Q4 2012 Status: 7 th round of funding, no stated IPO plans Funds raised to date: Over $700mm Investment Thesis Company Overview Source: VentureSource Source: VentureSource , Company website, wired.com , the Social Skinny Large and increasing share of the global population gaining access to mobile devices We believe targeted advertising and data analytics should open new revenue streams over the near - term A high - growth model with potential significant network effects and high engagement Growth Potential:
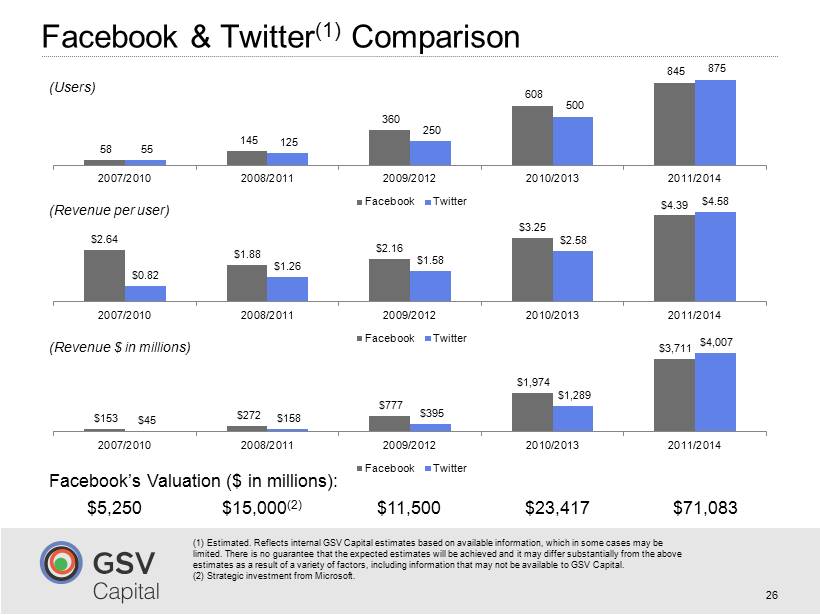
$2.64 $1.88 $2.16 $3.25 $4.39 $0.82 $1.26 $1.58 $2.58 $4.58 2007/2010 2008/2011 2009/2012 2010/2013 2011/2014 Facebook Twitter Facebook & Twitter (1) Comparison 26 $153 $272 $777 $1,974 $3,711 $45 $158 $395 $1,289 $4,007 2007/2010 2008/2011 2009/2012 2010/2013 2011/2014 Facebook Twitter (Revenue $ in millions) (Users) (Revenue per user) 58 145 360 608 845 55 125 250 500 875 2007/2010 2008/2011 2009/2012 2010/2013 2011/2014 Facebook Twitter $5,250 $15,000 (2) $11,500 $23,417 $71,083 (1) GSVC estimates for Twitter for 2012 - 2014. There is no guarantee that estimates will be achieved ( 2 ) Strategic investment from Microsoft. Facebook’s Valuation ($ in millions):

27 Case Study: Violin Memory 27 Violin provides a disruptive product with a strong enterprise customer base and has the potential to become the leader of the $15 billion Performance Optimization market Growth Potential: Other Investors Investment: $14.8mm Investment Information Violin Memory is a leader in scalable flash memory Its products enable companies to accelerate their most critical applications and to virtualize their data center storage with a scalable flash array Status: Series D raised in 4/12 Private funds raised to date: $ 170mm Source: Crunchbase Investment Thesis Company Overview Source: Crunchbase Violin is in a fast growing market driven by increasing data traffic and storage volumes We believe Violin has a strong pipeline to continue its strong enterprise growth
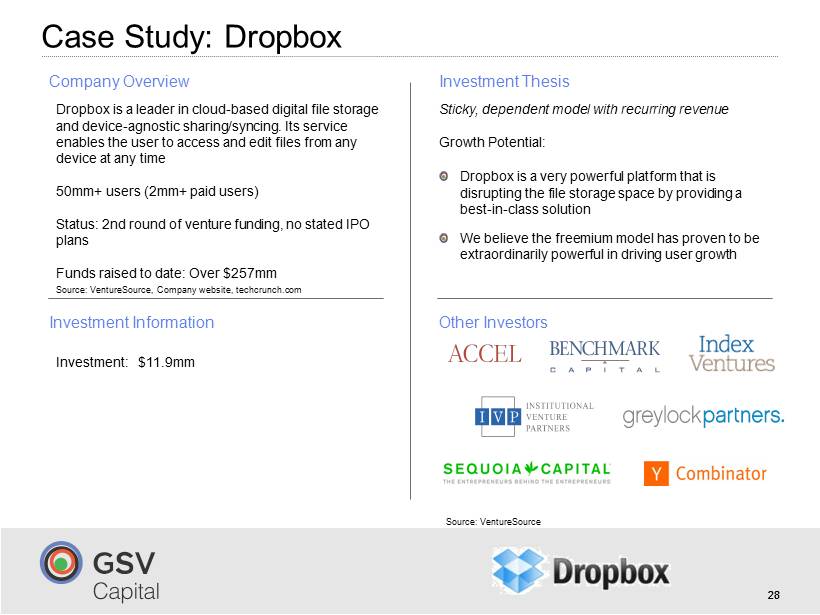
28 Case Study: Dropbox 28 Sticky, dependent model with recurring revenue Growth Potential: Other Investors Investment: $11.9mm Investment Information Dropbox is a leader in cloud - based digital file storage and device - agnostic sharing/ syncing. Its service enables the user to access and edit files from any device at any time 50mm+ users (2mm+ paid users) Status: 2nd round of venture funding , no stated IPO plans Funds raised to date: Over $257mm Source: VentureSource Investment Thesis Company Overview Source: VentureSource , Company website, techcrunch.com Dropbox is a very powerful platform that is disrupting the file storage space by providing a best - in - class solution We believe the freemium model has proven to be extraordinarily powerful in driving user growth
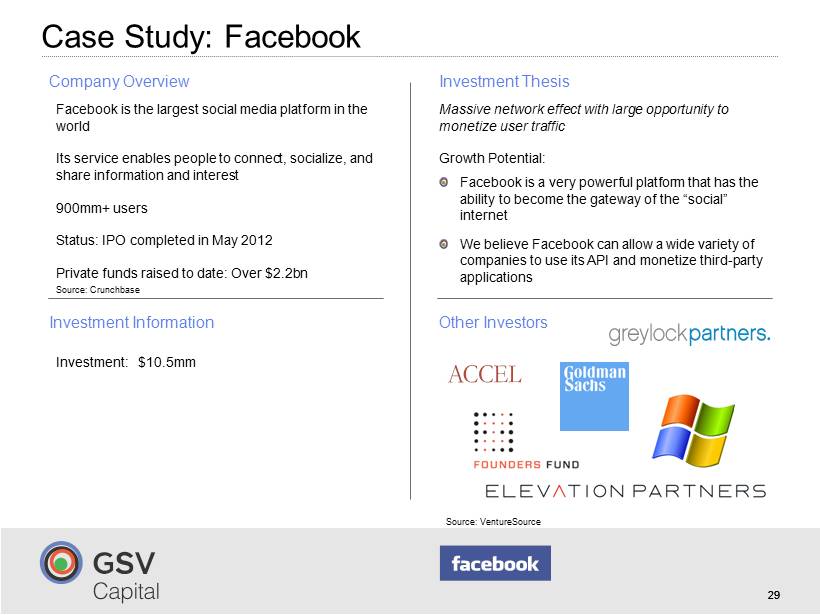
29 Case Study: Facebook 29 Massive network effect with large opportunity to monetize user traffic Growth Potential: Other Investors Investment: $10.5mm Investment Information Facebook is the largest social media platform in the world Its service enables people to connect, socialize, and share information and interest 900mm + users Status: IPO completed in May 2012 Private funds raised to date: Over $2.2bn Source: VentureSource Investment Thesis Company Overview Source: Crunchbase Facebook is a very powerful platform that has the ability to become the gateway of the “social” internet We believe Facebook can allow a wide variety of companies to use its API and monetize third - party applications

30 Case Study: Avenues 30 Avenues addresses the substantial demand imbalance for access to elite schools in the major cities around the world. It is led by p remier education leaders including former President of Yale University, former head of Phillips Exeter, and Hotchkiss Growth Potential: Other Investors Investment: $10.0mm Investment Information Avenues: The World School strives to become the world’s premier international educational experience for pre - K to 12 th grade The Avenues platform will allow students to receive differentiated, global learning opportunities Source: VentureSource Investment Thesis Company Overview Avenues is on track to launch its flagship campus in Chelsea, NY and has planned expansions in Beijing, London and other major international cities
31 Case Study: Chegg 31 The central education network and platform company with an opportunity for rapid expansion to providing every essential student service Growth Potential: Other Investors Investment: $10.0mm Investment Information Chegg is a leading online platform for students with apps such as textbook rental, note sharing, professor ranking, daily deals, and college search 5 mm+ users Status: Series F Funding in March, 2012 Funds raised to date: $195 Million Source: VentureSource Investment Thesis Company Overview Source: Crunchbase Chegg has built a large user base using its textbook business Going forward, we believe Chegg has hyper growth potential by offering daily deals, note sharing complementary tutoring and other critical services
32 Case Study: Gilt Groupe 32 Coveted fashion brands at clearance prices have allowed Gilt to gain a loyal following Growth Potential: Other Investors Investment: $5.5mm Investment Information Gilt Groupe is an online portal for premier luxury lifestyle brands It provides its members with access to luxury products at sale prices Status: Series E Funding in May, 2011 Funds raised to date: $221 Million Source: VentureSource Investment Thesis Company Overview Source: Crunchbase Gilt Groupe uses a concept of daily promotions to possess an “addictive” quality to its shopping experience Continued expansion beyond clothing to arenas including local services, home, and luxury travel
33 Case Study: Control4 33 Control 4 will be the leader in home automation as homeowners continue to look for increased convenience and automation in their homes Growth Potential: Other Investors Investment: $5.0mm Investment Information Control4 is a leading provider of the operating system for the “smart home” Control4 is a home automation platform that is interoperable with over 6,500 third - party consumer electronics devices Status: Series F+, November 2011 Funds raised to date: $93 Million Source: VentureSource Investment Thesis Company Overview Source: Crunchbase Control4 has an easy - to - use and intuitive software interface Control4 is now the platform of choice for electronics companies, residential homes, businesses and utilities, leaving it well positioned for future growth
34 Case Study: Silver Spring Networks 34 Silver Spring’s smart grid is the most feasible solution for addressing current energy transmission problems in the US Growth Potential: Other Investors Investment: $4.9mm Investment Information Silver Spring Networks transformed the existing infrastructure into a “smart grid” Silver Spring’s real - time, mash - based technology reduces costs and increases efficiency Status: Series D in March, 2009 Funds raised to date: $207 Million Source: VentureSource Investment Thesis Company Overview Source: Crunchbase Silver Spring is a leader in the movement for a more efficient energy system in the United States In the near term, we believe Silver Spring will continue to progress towards its IPO

35 Case Study: Palantir Technologies 35 Palantir has superior technology and algorithms and customers are increasingly looking to partner with Palantir Growth Potential: Other Investors Investment: $4.2 mm Investment Information Palantir Technologies is a “big data” company that uses its proprietary algorithms and solutions to solves critical intelligence and security issues for government agencies, banks, and large institutions Status: Series F, October 2011 Funds raised to date: $301 Million Source: VentureSource Investment Thesis Company Overview Source: Crunchbase Palantir’s products will continue to see increased demand as the complexity of systems expands in the future We believe the c ompany has built a positive reputation of providing superior solutions and should continue to win key customers
Disciplined and repeatable investment process 36 GSVC ’ s Competitive Advantages Deep relationships with significant credibility to source and complete transactions Source of permanent investing capital Highly experienced team of investment professionals Leader in new category with an early mover advantage