Attached files
| file | filename |
|---|---|
| 8-K - 8-K - GLEACHER & COMPANY, INC. | a12-14212_18k.htm |
Exhibit 99.1
|
|
Thomas J. Hughes Chief Executive Officer Sandler O’Neill Global Exchange and Brokerage Conference June 7, 2012 |

|
|
Forward-Looking Statements and Non-GAAP Financial Results This presentation contains "forward-looking statements." These statements are not historical facts but instead represent the Company's belief or plans regarding future events, many of which, by their nature, are inherently uncertain and outside of the Company's control. The Company often, but not always, identifies forward-looking statements by using words or phrases such as "anticipate," "estimate," "plan," "project," "target," "expect," "continuing," "ongoing," "believe" and "intend." The Company's forward-looking statements are based on facts as the Company understands them at the time the Company makes any such statement as well as estimates and judgments based on these facts. The Company's forward-looking statements may turn out to be inaccurate for a variety of reasons, many of which are outside of its control. Factors that could render the Company's forward-looking statements subsequently inaccurate include the conditions of the securities markets, generally, and demand for the Company's services within those markets, the risk of further credit rating downgrades of the U.S. government by major credit rating agencies, the impact of international and domestic sovereign debt uncertainties, the possibilities of localized or global economic recession and other risks and factors identified from time to time in the Company's filings with the Securities and Exchange Commission. Moreover, the Company is implementing a strategic plan designed to improve its operating results, and this plan may not be successful. It is possible that future events will differ materially from those suggested by the Company's forward-looking statements. You are cautioned not to place undue reliance on these forward-looking statements. The Company does not undertake to update any of its forward-looking statements. The Company has included in this presentation certain financial metrics that were not prepared in accordance with accounting principles generally accepted in the United States. These non-GAAP financial results, which include presentations of net revenues, compensation and benefits, non-compensation expenses, income before income taxes from continuing operations, provision for income taxes, net income from continuing operations, compensation expense ratios, pre-tax margin, diluted earnings per share, tangible stockholders’ equity, tangible book value per share, and return on tangible equity are presented as an additional aid in understanding and analyzing the Company's financial results. Specifically, the Company believes that the non-GAAP results provide useful information by excluding certain items that may not be indicative of the Company's core operating results or business outlook and also to emphasize information that the Company believes is important to understanding the Company’s performance. The Company believes these non-GAAP results will allow for a better evaluation of the operating performance of the business and facilitate a meaningful comparison of the Company's results in the current period to those in prior periods and future periods. References to these non-GAAP results should not be considered a substitute for results that are presented in a manner consistent with GAAP. A limitation of utilizing these non-GAAP financial results is that the GAAP accounting effects of these excluded items do in fact reflect the underlying financial results of the Company's business, and these effects should not be ignored in evaluating and analyzing its financial results. Therefore, the Company believes that non-GAAP results should always be considered together with their corresponding GAAP results. Reconciliations of non-GAAP financial results to the corresponding GAAP numbers are included in the Appendix to this presentation and can also be found on the Company’s website at www.gleacher.com. |
|
|
Agenda Historical Overview Company Overview Business Overview New Initiatives Update Financial Highlights Investment Highlights |
|
|
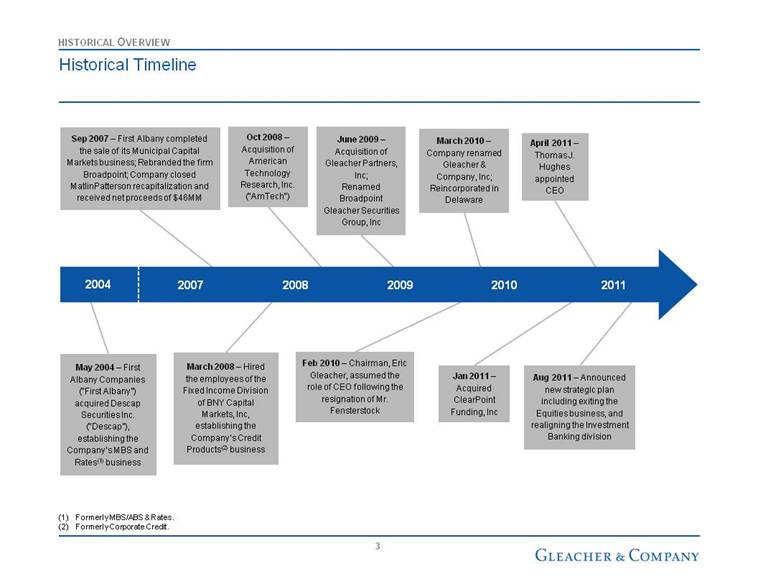
Historical Timeline Sep 2007 – First Albany completed the sale of its Municipal Capital Markets business; Rebranded the firm Broadpoint; Company closed MatlinPatterson recapitalization and received net proceeds of $46MM March 2008 – Hired the employees of the Fixed Income Division of BNY Capital Markets, Inc, establishing the Company’s Credit Products(2) business June 2009 – Acquisition of Gleacher Partners, Inc; Renamed Broadpoint Gleacher Securities Group, Inc Feb 2010 – Chairman, Eric Gleacher, assumed the role of CEO following the resignation of Mr. Fensterstock March 2010 – Company renamed Gleacher & Company, Inc; Reincorporated in Delaware Jan 2011 – Acquired ClearPoint Funding, Inc April 2011 – Thomas J. Hughes appointed CEO Aug 2011 – Announced new strategic plan including exiting the Equities business, and realigning the Investment Banking division Oct 2008 – Acquisition of American Technology Research, Inc. ("AmTech") May 2004 – First Albany Companies (“First Albany”) acquired Descap Securities Inc. (“Descap”), establishing the Company’s MBS and Rates(1) business 2007 2009 2011 2008 2004 2010 HISTORICAL OVERVIEW Formerly MBS/ABS & Rates. Formerly Corporate Credit. |
|
|
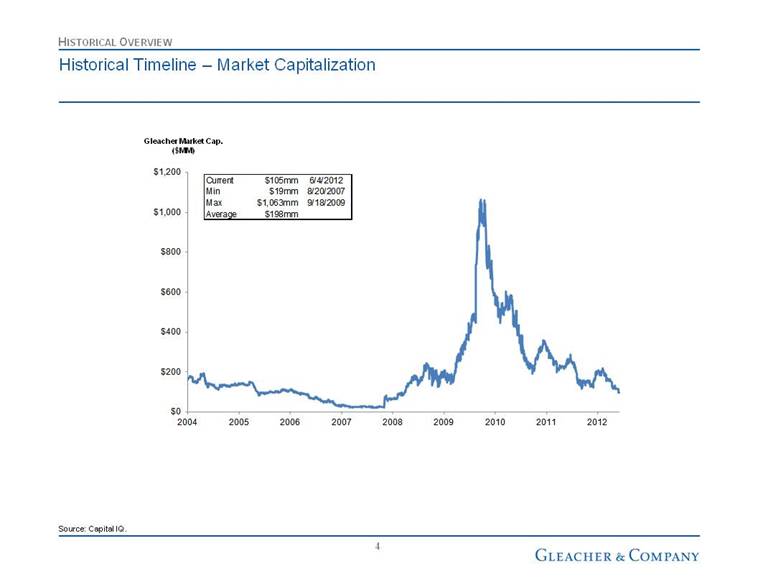
Historical Timeline – Market Capitalization HISTORICAL OVERVIEW Source: Capital IQ. Gleacher Market Cap. ($MM) $0 $200 $400 $600 $800 $1,000 $1,200 2004 2005 2006 2007 2008 2009 2010 2011 2012 Current $105mm 6/4/2012 Min $19mm 8/20/2007 Max $1,063mm 9/18/2009 Average $198mm |
|
|
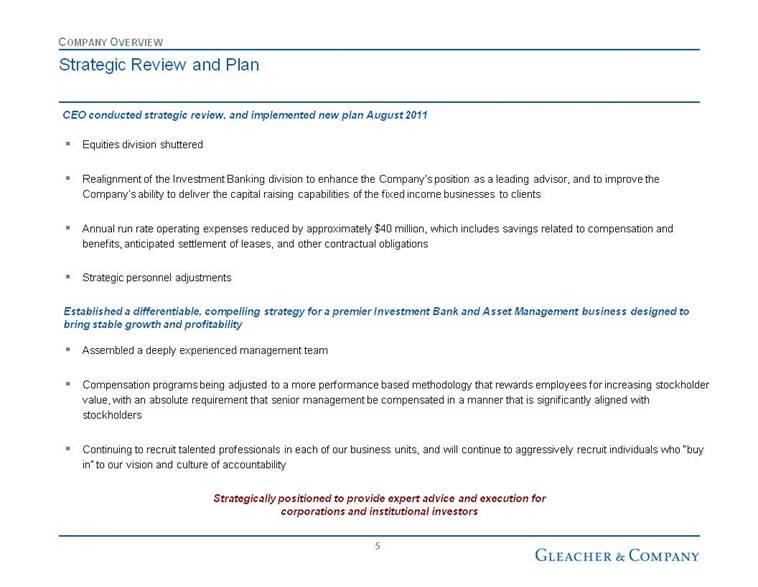
Equities division shuttered Realignment of the Investment Banking division to enhance the Company’s position as a leading advisor, and to improve the Company’s ability to deliver the capital raising capabilities of the fixed income businesses to clients Annual run rate operating expenses reduced by approximately $40 million, which includes savings related to compensation and benefits, anticipated settlement of leases, and other contractual obligations Strategic personnel adjustments Strategic Review and Plan CEO conducted strategic review, and implemented new plan August 2011 COMPANY OVERVIEW Established a differentiable, compelling strategy for a premier Investment Bank and Asset Management business designed to bring stable growth and profitability Assembled a deeply experienced management team Compensation programs being adjusted to a more performance based methodology that rewards employees for increasing stockholder value, with an absolute requirement that senior management be compensated in a manner that is significantly aligned with stockholders Continuing to recruit talented professionals in each of our business units, and will continue to aggressively recruit individuals who “buy in” to our vision and culture of accountability Strategically positioned to provide expert advice and execution for corporations and institutional investors |
|
|
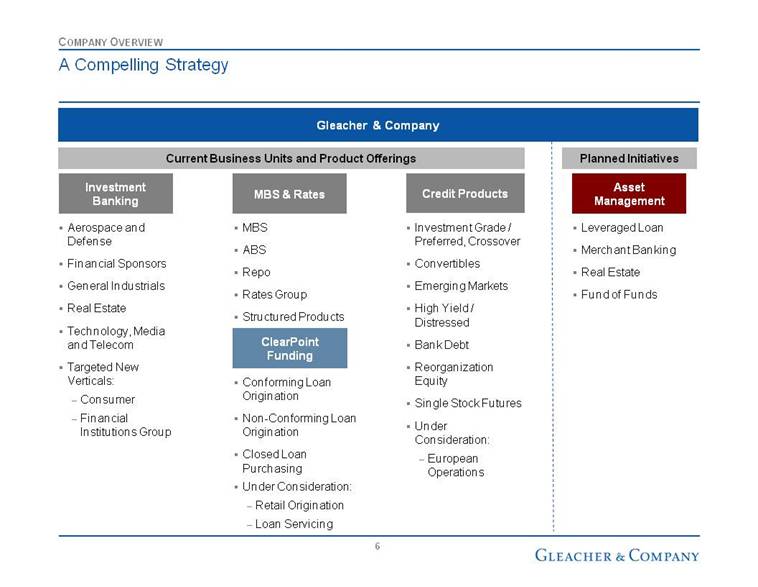
A Compelling Strategy Gleacher & Company MBS & Rates Asset Management Investment Banking Aerospace and Defense Financial Sponsors General Industrials Real Estate Technology, Media and Telecom Targeted New Verticals: Consumer Financial Institutions Group Credit Products Investment Grade / Preferred, Crossover Convertibles Emerging Markets High Yield / Distressed Bank Debt Reorganization Equity Single Stock Futures Under Consideration: European Operations MBS ABS Repo Rates Group Structured Products Leveraged Loan Merchant Banking Real Estate Fund of Funds COMPANY OVERVIEW ClearPoint Funding Conforming Loan Origination Non-Conforming Loan Origination Closed Loan Purchasing Under Consideration: Retail Origination Loan Servicing Current Business Units and Product Offerings Planned Initiatives |
|
|
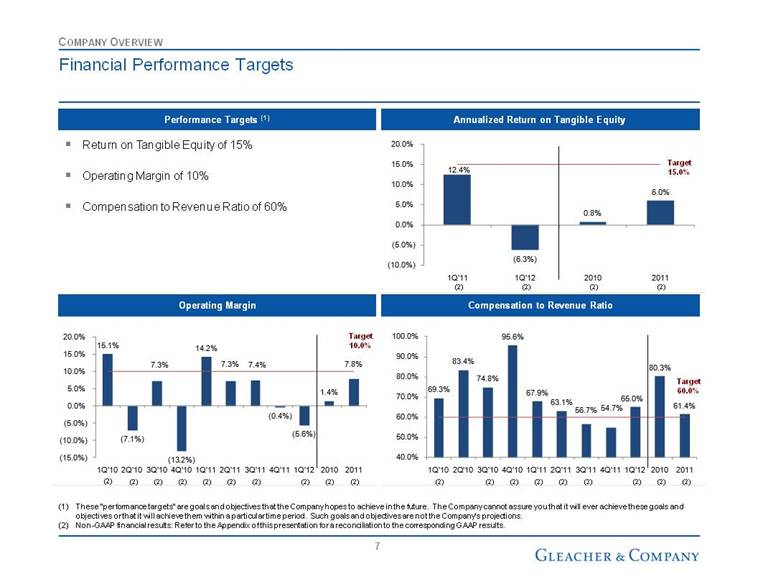
Return on Tangible Equity of 15% Operating Margin of 10% Compensation to Revenue Ratio of 60% Financial Performance Targets Annualized Return on Tangible Equity Operating Margin Compensation to Revenue Ratio Performance Targets (1) These “performance targets” are goals and objectives that the Company hopes to achieve in the future. The Company cannot assure you that it will ever achieve these goals and objectives or that it will achieve them within a particular time period. Such goals and objectives are not the Company’s projections. Non-GAAP financial results: Refer to the Appendix of this presentation for a reconciliation to the corresponding GAAP results. COMPANY OVERVIEW Target 15.0% Target 10.0% Target 60.0% (2) (2) (2) (2) (2) (2) (2) (2) (2) (2) (2) (2) (2) (2) (2) (2) (2) (2) (2) (2) (2) (2) (2) 12.4% (6.3%) 0.8% 6.0% (10.0%) (5.0%) 0.0% 5.0% 10.0% 15.0% 20.0% 1Q'11 1Q'12 2010 2011 15.1% (7.1%) 7.3% (13.2%) 14.2% 7.3% 7.4% (0.4%) (5.6%) 1.4% 7.8% (15.0%) (10.0%) (5.0%) 0.0% 5.0% 10.0% 15.0% 20.0% 1Q'10 2Q'10 3Q'10 4Q'10 1Q'11 2Q'11 3Q'11 4Q'11 1Q'12 2010 2011 69.3% 83.4% 74.8% 95.6% 67.9% 63.1% 56.7% 54.7% 65.0% 80.3% 61.4% 40.0% 50.0% 60.0% 70.0% 80.0% 90.0% 100.0% 1Q'10 2Q'10 3Q'10 4Q'10 1Q'11 2Q'11 3Q'11 4Q'11 1Q'12 2010 2011 |
|
|
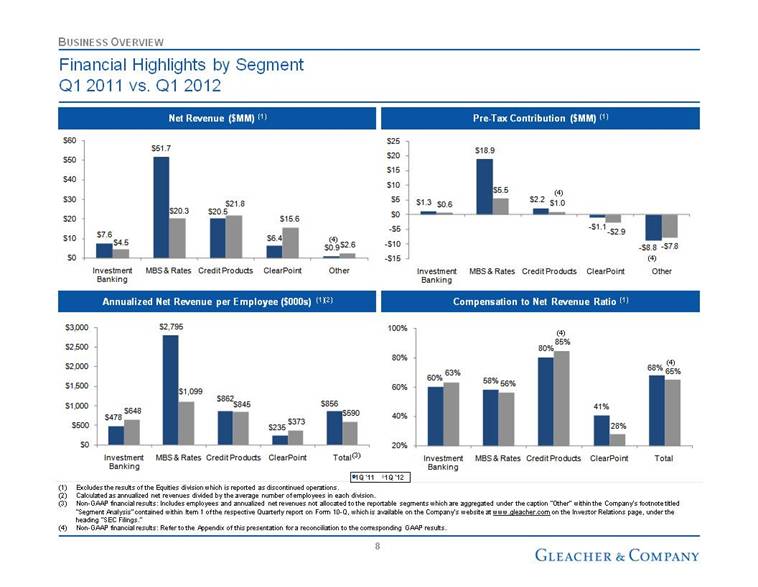
Financial Highlights by Segment Q1 2011 vs. Q1 2012 Net Revenue ($MM) (1) Pre-Tax Contribution ($MM) (1) Excludes the results of the Equities division which is reported as discontinued operations. Calculated as annualized net revenues divided by the average number of employees in each division. Non-GAAP financial results: Includes employees and annualized net revenues not allocated to the reportable segments which are aggregated under the caption “Other” within the Company’s footnote titled “Segment Analysis” contained within Item 1 of the respective Quarterly report on Form 10-Q, which is available on the Company’s website at www.gleacher.com on the Investor Relations page, under the heading “SEC Filings.” Non-GAAP financial results: Refer to the Appendix of this presentation for a reconciliation to the corresponding GAAP results. BUSINESS OVERVIEW Annualized Net Revenue per Employee ($000s) (1)(2) Compensation to Net Revenue Ratio (1) (3) (4) (4) (4) (4) (4) $7.6 $51.7 $20.5 $6.4 $0.9 $4.5 $20.3 $21.8 $15.6 $2.6 $0 $10 $20 $30 $40 $50 $60 Investment Banking MBS & Rates Credit Products ClearPoint Other 60% 58% 80% 41% 68% 63% 56% 85% 28% 65% 20% 40% 60% 80% 100% Investment Banking MBS & Rates Credit Products ClearPoint Total $478 $2,795 $862 $235 $856 $648 $1,099 $845 $373 $590 $0 $500 $1,000 $1,500 $2,000 $2,500 $3,000 Investment Banking MBS & Rates Credit Products ClearPoint Total $1.3 $18.9 $2.2 - $1.1 - $8.8 $0.6 $5.5 $1.0 - $2.9 - $7.8 - $15 - $10 - $5 $0 $5 $10 $15 $20 $25 Investment Banking MBS & Rates Credit Products ClearPoint Other |
|
|
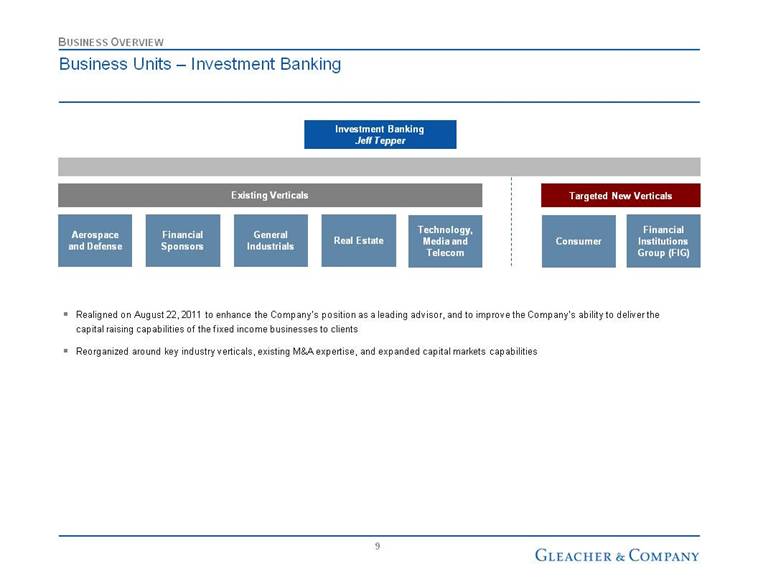
Business Units – Investment Banking Real Estate Investment Banking Jeff Tepper Consumer Technology, Media and Telecom Aerospace and Defense Financial Sponsors General Industrials Existing Verticals Targeted New Verticals Financial Institutions Group (FIG) Realigned on August 22, 2011 to enhance the Company’s position as a leading advisor, and to improve the Company’s ability to deliver the capital raising capabilities of the fixed income businesses to clients Reorganized around key industry verticals, existing M&A expertise, and expanded capital markets capabilities BUSINESS OVERVIEW |
|
|
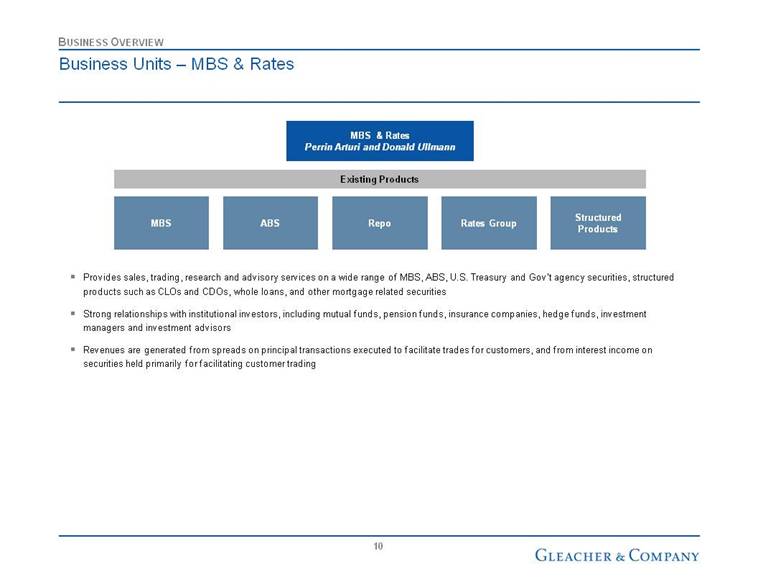
Business Units – MBS & Rates MBS & Rates Perrin Arturi and Donald Ullmann MBS ABS Repo Structured Products Existing Products Rates Group Provides sales, trading, research and advisory services on a wide range of MBS, ABS, U.S. Treasury and Gov’t agency securities, structured products such as CLOs and CDOs, whole loans, and other mortgage related securities Strong relationships with institutional investors, including mutual funds, pension funds, insurance companies, hedge funds, investment managers and investment advisors Revenues are generated from spreads on principal transactions executed to facilitate trades for customers, and from interest income on securities held primarily for facilitating customer trading BUSINESS OVERVIEW |
|
|
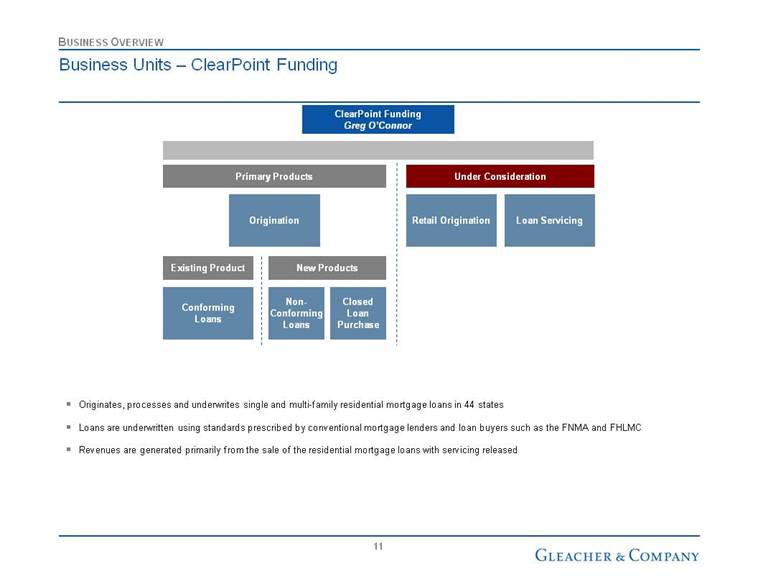
Business Units – ClearPoint Funding Originates, processes and underwrites single and multi-family residential mortgage loans in 44 states Loans are underwritten using standards prescribed by conventional mortgage lenders and loan buyers such as the FNMA and FHLMC Revenues are generated primarily from the sale of the residential mortgage loans with servicing released BUSINESS OVERVIEW ClearPoint Funding Greg O’Connor Origination Loan Servicing Retail Origination Existing Product New Products Conforming Loans Non-Conforming Loans Under Consideration Primary Products Closed Loan Purchase |
|
|
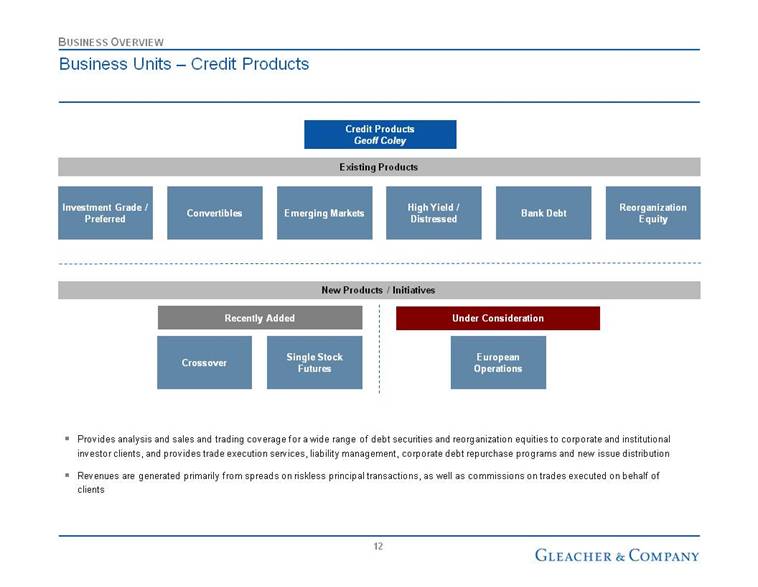
Business Units – Credit Products Credit Products Geoff Coley Investment Grade / Preferred Convertibles Emerging Markets Reorganization Equity Bank Debt Existing Products High Yield / Distressed Crossover Single Stock Futures European Operations New Products / Initiatives Recently Added Under Consideration Provides analysis and sales and trading coverage for a wide range of debt securities and reorganization equities to corporate and institutional investor clients, and provides trade execution services, liability management, corporate debt repurchase programs and new issue distribution Revenues are generated primarily from spreads on riskless principal transactions, as well as commissions on trades executed on behalf of clients BUSINESS OVERVIEW |
|
|
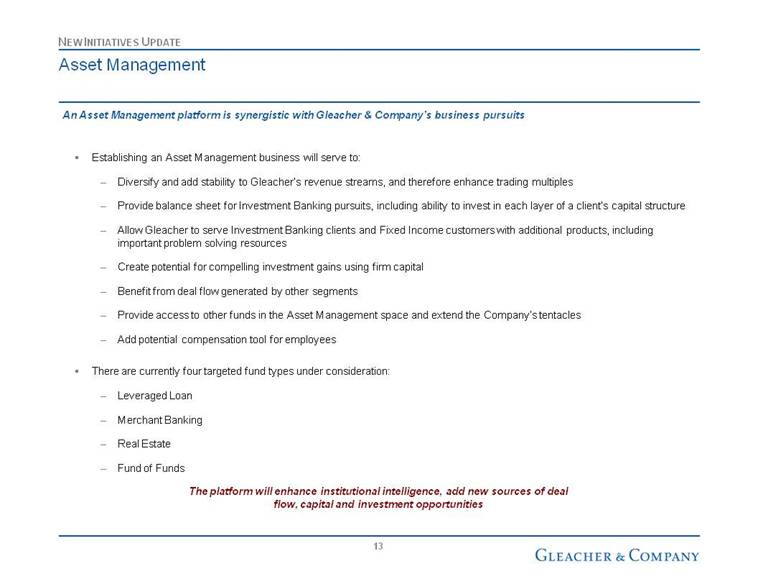
Asset Management Establishing an Asset Management business will serve to: Diversify and add stability to Gleacher’s revenue streams, and therefore enhance trading multiples Provide balance sheet for Investment Banking pursuits, including ability to invest in each layer of a client’s capital structure Allow Gleacher to serve Investment Banking clients and Fixed Income customers with additional products, including important problem solving resources Create potential for compelling investment gains using firm capital Benefit from deal flow generated by other segments Provide access to other funds in the Asset Management space and extend the Company’s tentacles Add potential compensation tool for employees There are currently four targeted fund types under consideration: Leveraged Loan Merchant Banking Real Estate Fund of Funds An Asset Management platform is synergistic with Gleacher & Company’s business pursuits NEW INITIATIVES UPDATE The platform will enhance institutional intelligence, add new sources of deal flow, capital and investment opportunities |
|
|
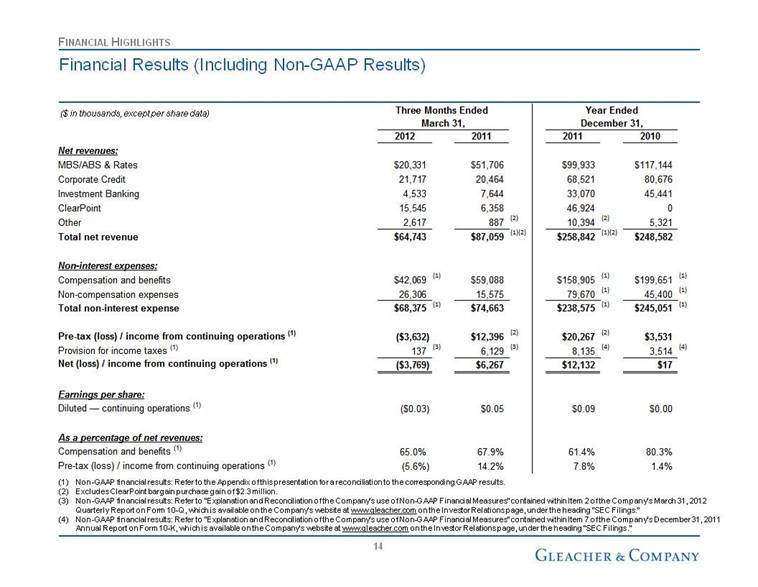
Financial Results (Including Non-GAAP Results) Non-GAAP financial results: Refer to the Appendix of this presentation for a reconciliation to the corresponding GAAP results. Excludes ClearPoint bargain purchase gain of $2.3 million. Non-GAAP financial results: Refer to “Explanation and Reconciliation of the Company’s use of Non-GAAP Financial Measures” contained within Item 2 of the Company’s March 31, 2012 Quarterly Report on Form 10-Q, which is available on the Company’s website at www.gleacher.com on the Investor Relations page, under the heading “SEC Filings.” Non-GAAP financial results: Refer to “Explanation and Reconciliation of the Company’s use of Non-GAAP Financial Measures” contained within Item 7 of the Company’s December 31, 2011 Annual Report on Form 10-K, which is available on the Company’s website at www.gleacher.com on the Investor Relations page, under the heading “SEC Filings.” FINANCIAL HIGHLIGHTS ($ in thousands, except per share data) Three Months Ended Year Ended March 31, December 31, 2012 2011 2011 2010 Net revenues: MBS/ABS & Rates $20,331 $51,706 $99,933 $117,144 Corporate Credit 21,717 20,464 68,521 80,676 Investment Banking 4,533 7,644 33,070 45,441 ClearPoint 15,545 6,358 46,924 0 Other 2,617 887 (2) 10,394 (2) 5,321 Total net revenue $64,743 $87,059 (1)(2) $258,842 (1)(2) $248,582 Non-interest expenses: Compensation and benefits $42,069 (1) $59,088 $158,905 (1) $199,651 (1) Non-compensation expenses 26,306 15,575 79,670 (1) 45,400 (1) Total non-interest expense $68,375 (1) $74,663 $238,575 (1) $245,051 (1) Pre-tax (loss) / income from continuing operations (1) ($3,632) $12,396 (2) $20,267 (2) $3,531 Provision for income taxes (1) 137 (3) 6,129 (3) 8,135 (4) 3,514 (4) Net (loss) / income from continuing operations (1) ($3,769) $6,267 $12,132 $17 Earnings per share: Diluted — continuing operations (1) ($0.03) $0.05 $0.09 $0.00 As a percentage of net revenues: Compensation and benefits (1) 65.0% 67.9% 61.4% 80.3% Pre-tax (loss) / income from continuing operations (1) (5.6%) 14.2% 7.8% 1.4% |
|
|
Net Revenue Composition Non-GAAP financial results: Excludes $2.3MM bargain purchase gain related to the ClearPoint acquisition. FINANCIAL HIGHLIGHTS 2010 Net Revenue 2011 Net Revenue Principal Transactions, 32.0% Net Interest Income, 18.5% Investment Banking, 18.2% Commissions, 30.9% Fees & Other, 0.4% Investment Gains / (Losses), 0.0% 1Q'10 2Q'10 3Q'10 4Q'10 2010 1Q'11 (1) 2Q'11 3Q'11 4Q'11 2011 (1) 1Q'12 Net Revenue by Type: Commissions 27.7% 39.8% 31.8% 27.1% 30.9% 21.2% 29.0% 29.4% 33.3% 27.6% 29.7% Principal Transactions 34.8% 29.3% 27.7% 34.5% 32.0% 52.1% 29.2% 18.1% 28.3% 34.3% 32.9% Investment Banking 20.2% 14.0% 19.7% 17.8% 18.2% 11.9% 17.8% 17.3% 5.4% 12.7% 10.3% Investment Gains / (Losses) 0.2% (3.4%) 1.6% 0.8% 0.0% (0.8%) 0.7% 5.3% 1.7% 1.4% 0.2% Fees & Other 0.1% 0.5% 0.4% 0.7% 0.4% 1.3% 2.4% 4.8% 4.8% 3.1% 4.4% Net Interest Income 17.0% 19.7% 18.7% 19.1% 18.5% 14.4% 21.0% 25.1% 26.5% 20.9% 22.5% Principal Transactions, 34.3% Net Interest Income, 20.9% Investment Banking, 12.7% Commissions, 27.6% Fees & Other, 3.1% Investment Gains / (Losses), 1.4% |

|
|
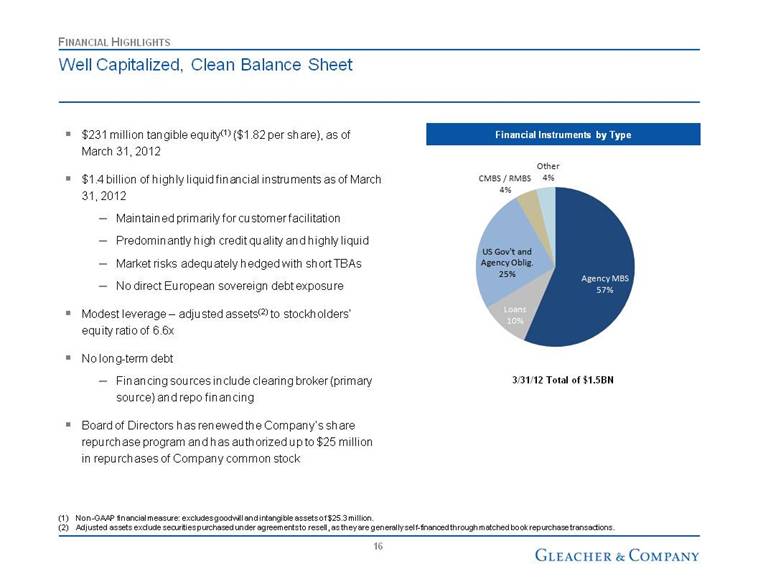
Well Capitalized, Clean Balance Sheet $231 million tangible equity(1) ($1.82 per share), as of March 31, 2012 $1.4 billion of highly liquid financial instruments as of March 31, 2012 Maintained primarily for customer facilitation Predominantly high credit quality and highly liquid Market risks adequately hedged with short TBAs No direct European sovereign debt exposure Modest leverage – adjusted assets(2) to stockholders’ equity ratio of 6.6x No long-term debt Financing sources include clearing broker (primary source) and repo financing Board of Directors has renewed the Company’s share repurchase program and has authorized up to $25 million in repurchases of Company common stock Financial Instruments by Type 3/31/12 Total of $1.5BN Non-GAAP financial measure: excludes goodwill and intangible assets of $25.3 million. Adjusted assets exclude securities purchased under agreements to resell, as they are generally self-financed through matched book repurchase transactions. FINANCIAL HIGHLIGHTS Agency MBS 57% Loans 10% US Gov't and Agency Oblig. 25% CMBS / RMBS 4% Other 4% |
|
|
Investment Highlights Independent, full-service investment bank Compelling strategic plan World-class M&A capabilities Powerful fixed income sales and distribution Experienced management team comprised of individuals who have been significant business builders Liquid, low-risk balance sheet Well-capitalized platform positioned for market share gains and stockholder return INVESTMENT HIGHLIGHTS |
|
|
Appendix |
|
|
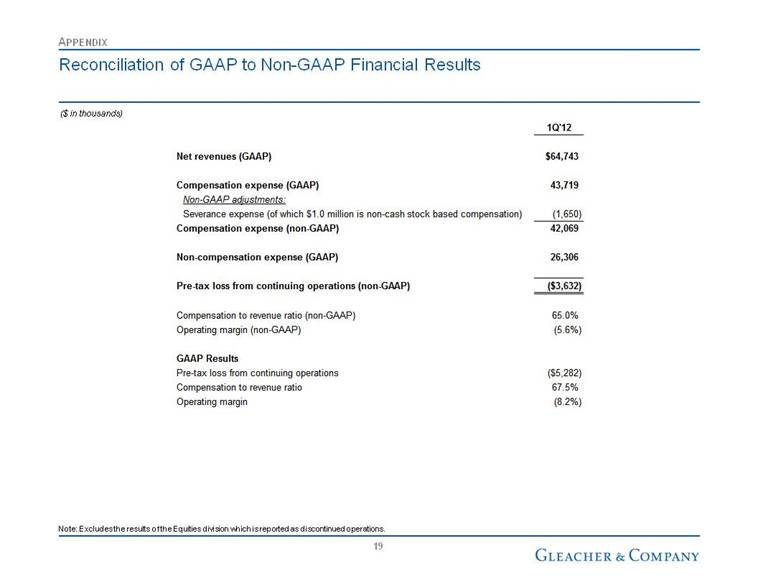
Reconciliation of GAAP to Non-GAAP Financial Results ($ in thousands) APPENDIX Note: Excludes the results of the Equities division which is reported as discontinued operations. 1Q'12 Net revenues (GAAP) $64,743 Compensation expense (GAAP) 43,719 Non-GAAP adjustments: Severance expense (of which $1.0 million is non-cash stock based compensation) (1,650) Compensation expense (non-GAAP) 42,069 Non-compensation expense (GAAP) 26,306 Pre-tax loss from continuing operations (non-GAAP) ($3,632) Compensation to revenue ratio (non-GAAP) 65.0% Operating margin (non-GAAP) (5.6%) GAAP Results Pre-tax loss from continuing operations ($5,282) Compensation to revenue ratio 67.5% Operating margin (8.2%) |
|
|
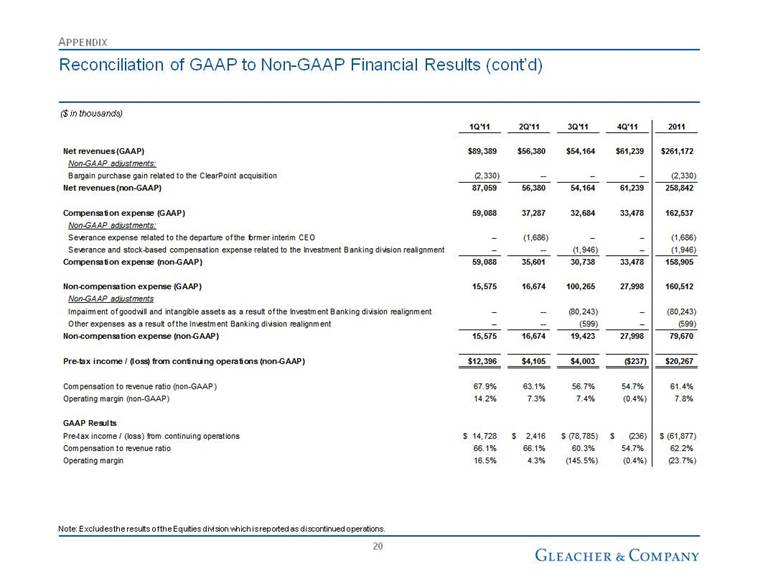
Reconciliation of GAAP to Non-GAAP Financial Results (cont’d) ($ in thousands) APPENDIX Note: Excludes the results of the Equities division which is reported as discontinued operations. 1Q'11 2Q'11 3Q'11 4Q'11 2011 Net revenues (GAAP) $89,389 $56,380 $54,164 $61,239 $261,172 Non-GAAP adjustments: Bargain purchase gain related to the ClearPoint acquisition (2,330) -- -- -- (2,330) Net revenues (non-GAAP) 87,059 56,380 54,164 61,239 258,842 Compensation expense (GAAP) 59,088 37,287 32,684 33,478 162,537 Non-GAAP adjustments: Severance expense related to the departure of the former interim CEO -- (1,686) -- -- (1,686) Severance and stock-based compensation expense related to the Investment Banking division realignment -- -- (1,946) -- (1,946) Compensation expense (non-GAAP) 59,088 35,601 30,738 33,478 158,905 Non-compensation expense (GAAP) 15,575 16,674 100,265 27,998 160,512 Non-GAAP adjustments Impairment of goodwill and intangible assets as a result of the Investment Banking division realignment -- -- (80,243) -- (80,243) Other expenses as a result of the Investment Banking division realignment -- -- (599) -- (599) Non-compensation expense (non-GAAP) 15,575 16,674 19,423 27,998 79,670 Pre-tax income / (loss) from continuing operations (non-GAAP) $12,396 $4,105 $4,003 ($237) $20,267 Compensation to revenue ratio (non-GAAP) 67.9% 63.1% 56.7% 54.7% 61.4% Operating margin (non-GAAP) 14.2% 7.3% 7.4% (0.4%) 7.8% GAAP Results Pre-tax income / (loss) from continuing operations 14,728 $ 2,416 $ (78,785) $ (236) $ (61,877) $ Compensation to revenue ratio 66.1% 66.1% 60.3% 54.7% 62.2% Operating margin 16.5% 4.3% (145.5%) (0.4%) (23.7%) |
|
|
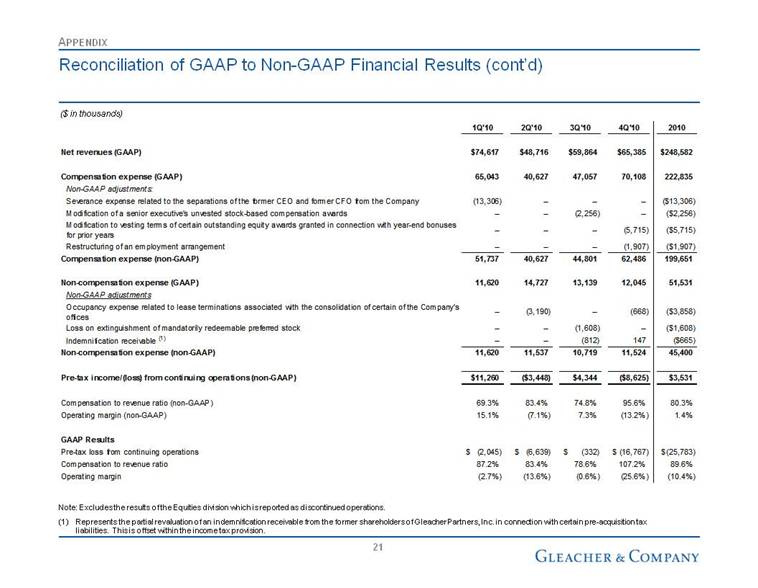
Reconciliation of GAAP to Non-GAAP Financial Results (cont’d) ($ in thousands) APPENDIX Note: Excludes the results of the Equities division which is reported as discontinued operations. (1) Represents the partial revaluation of an indemnification receivable from the former shareholders of Gleacher Partners, Inc. in connection with certain pre-acquisition tax liabilities. This is offset within the income tax provision. 1Q'10 2Q'10 3Q'10 4Q'10 2010 Net revenues (GAAP) $74,617 $48,716 $59,864 $65,385 $248,582 Compensation expense (GAAP) 65,043 40,627 47,057 70,108 222,835 Non-GAAP adjustments: Severance expense related to the separations of the former CEO and former CFO from the Company (13,306) -- -- -- ($13,306) Modification of a senior executive's unvested stock-based compensation awards -- -- (2,256) -- ($2,256) Modification to vesting terms of certain outstanding equity awards granted in connection with year-end bonuses for prior years -- -- -- (5,715) ($5,715) Restructuring of an employment arrangement -- -- -- (1,907) ($1,907) Compensation expense (non-GAAP) 51,737 40,627 44,801 62,486 199,651 Non-compensation expense (GAAP) 11,620 14,727 13,139 12,045 51,531 Non-GAAP adjustments Occupancy expense related to lease terminations associated with the consolidation of certain of the Company's offices -- (3,190) -- (668) ($3,858) Loss on extinguishment of mandatorily redeemable preferred stock -- -- (1,608) -- ($1,608) Indemnification receivable (1) -- -- (812) 147 ($665) Non-compensation expense (non-GAAP) 11,620 11,537 10,719 11,524 45,400 Pre-tax income/(loss) from continuing operations (non-GAAP) $11,260 ($3,448) $4,344 ($8,625) $3,531 Compensation to revenue ratio (non-GAAP) 69.3% 83.4% 74.8% 95.6% 80.3% Operating margin (non-GAAP) 15.1% (7.1%) 7.3% (13.2%) 1.4% GAAP Results Pre-tax loss from continuing operations (2,045) $ (6,639) $ (332) $ (16,767) $ (25,783) $ Compensation to revenue ratio 87.2% 83.4% 78.6% 107.2% 89.6% Operating margin (2.7%) (13.6%) (0.6%) (25.6%) (10.4%) |
|
|
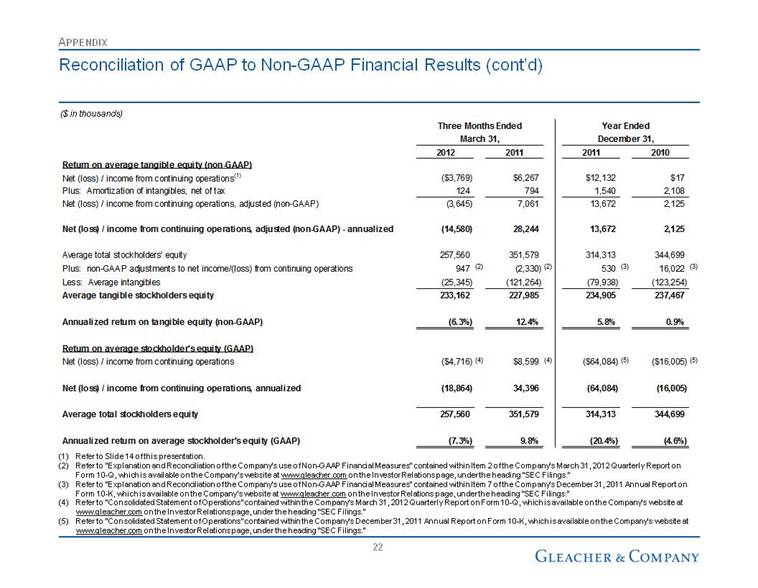
Reconciliation of GAAP to Non-GAAP Financial Results (cont’d) ($ in thousands) APPENDIX Refer to Slide 14 of this presentation. Refer to “Explanation and Reconciliation of the Company’s use of Non-GAAP Financial Measures” contained within Item 2 of the Company’s March 31, 2012 Quarterly Report on Form 10-Q, which is available on the Company’s website at www.gleacher.com on the Investor Relations page, under the heading “SEC Filings.” Refer to “Explanation and Reconciliation of the Company’s use of Non-GAAP Financial Measures” contained within Item 7 of the Company’s December 31, 2011 Annual Report on Form 10-K, which is available on the Company’s website at www.gleacher.com on the Investor Relations page, under the heading “SEC Filings.” Refer to “Consolidated Statement of Operations” contained within the Company’s March 31, 2012 Quarterly Report on Form 10-Q, which is available on the Company’s website at www.gleacher.com on the Investor Relations page, under the heading “SEC Filings.” Refer to “Consolidated Statement of Operations” contained within the Company’s December 31, 2011 Annual Report on Form 10-K, which is available on the Company’s website at www.gleacher.com on the Investor Relations page, under the heading “SEC Filings.” Three Months Ended Year Ended March 31, December 31, 2012 2011 2011 2010 Return on average tangible equity (non-GAAP) Net (loss) / income from continuing operations (1) ($3,769) $6,267 $12,132 $17 Plus: Amortization of intangibles, net of tax 124 794 1,540 2,108 Net (loss) / income from continuing operations, adjusted (non-GAAP) (3,645) 7,061 13,672 2,125 Net (loss) / income from continuing operations, adjusted (non-GAAP) - annualized (14,580) 28,244 13,672 2,125 Average total stockholders' equity 257,560 351,579 314,313 344,699 Plus: non-GAAP adjustments to net income/(loss) from continuing operations 947 (2) (2,330) (2) 530 (3) 16,022 (3) Less: Average intangibles (25,345) (121,264) (79,938) (123,254) Average tangible stockholders equity 233,162 227,985 234,905 237,467 Annualized return on tangible equity (non-GAAP) (6.3%) 12.4% 5.8% 0.9% Return on average stockholder's equity (GAAP) Net (loss) / income from continuing operations ($4,716) (4) $8,599 (4) ($64,084) (5) ($16,005) (5) Net (loss) / income from continuing operations, annualized (18,864) 34,396 (64,084) (16,005) Average total stockholders equity 257,560 351,579 314,313 344,699 Annualized return on average stockholder's equity (GAAP) (7.3%) 9.8% (20.4%) (4.6%) |
|
|
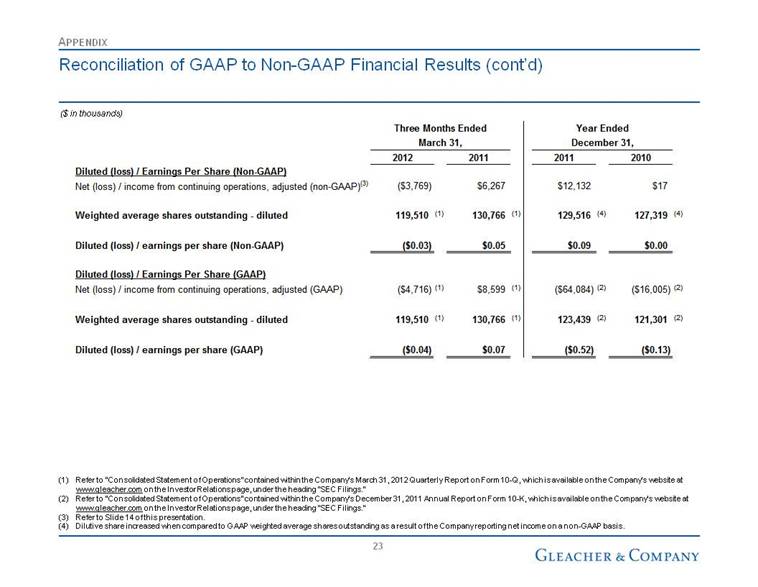
Reconciliation of GAAP to Non-GAAP Financial Results (cont’d) ($ in thousands) APPENDIX Refer to “Consolidated Statement of Operations” contained within the Company’s March 31, 2012 Quarterly Report on Form 10-Q, which is available on the Company’s website at www.gleacher.com on the Investor Relations page, under the heading “SEC Filings.” Refer to “Consolidated Statement of Operations” contained within the Company’s December 31, 2011 Annual Report on Form 10-K, which is available on the Company’s website at www.gleacher.com on the Investor Relations page, under the heading “SEC Filings.” Refer to Slide 14 of this presentation. Dilutive share increased when compared to GAAP weighted average shares outstanding as a result of the Company reporting net income on a non-GAAP basis. Three Months Ended Year Ended March 31, December 31, 2012 2011 2011 2010 Diluted (loss) / Earnings Per Share (Non-GAAP) Net (loss) / income from continuing operations, adjusted (non-GAAP) (3) ($3,769) $6,267 $12,132 $17 Weighted average shares outstanding - diluted 119,510 (1) 130,766 (1) 129,516 (4) 127,319 (4) Diluted (loss) / earnings per share (Non-GAAP) ($0.03) $0.05 $0.09 $0.00 Diluted (loss) / Earnings Per Share (GAAP) Net (loss) / income from continuing operations, adjusted (GAAP) ($4,716) (1) $8,599 (1) ($64,084) (2) ($16,005) (2) Weighted average shares outstanding - diluted 119,510 (1) 130,766 (1) 123,439 (2) 121,301 (2) Diluted (loss) / earnings per share (GAAP) ($0.04) $0.07 ($0.52) ($0.13) |
|
|
[LOGO] |