Attached files
| file | filename |
|---|---|
| 8-K - FORM 8-K - ABM INDUSTRIES INC /DE/ | d362439d8k.htm |
| EX-99.1 - EX-99.1 - ABM INDUSTRIES INC /DE/ | d362439dex991.htm |
Exhibit 99.2
| Second Quarter 2012 Investor Call NYSE: ABM June 7, 2012 |
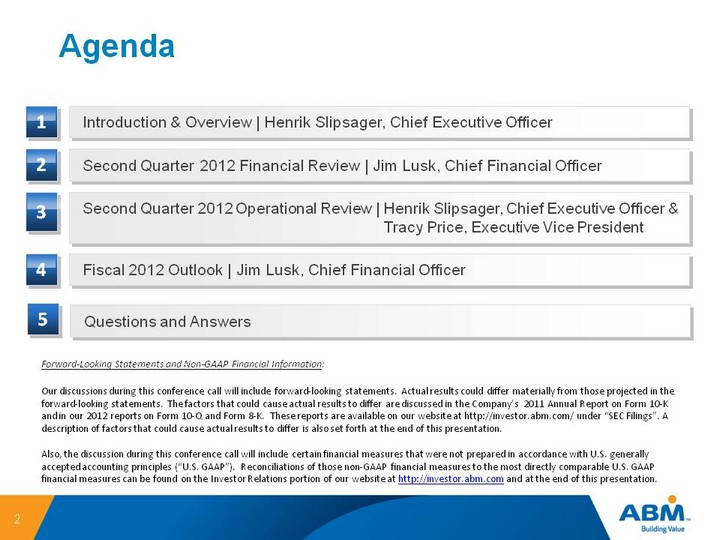
| Agenda 2 1 Introduction & Overview | Henrik Slipsager, Chief Executive Officer 2 Second Quarter 2012 Financial Review | Jim Lusk, Chief Financial Officer 3 Second Quarter 2012 Operational Review | Henrik Slipsager, Chief Executive Officer & Tracy Price, Executive Vice President 4 Fiscal 2012 Outlook | Jim Lusk, Chief Financial Officer Forward-Looking Statements and Non-GAAP Financial Information: Our discussions during this conference call will include forward-looking statements. Actual results could differ materially from those projected in the forward-looking statements. The factors that could cause actual results to differ are discussed in the Company's 2011 Annual Report on Form 10-K and in our 2012 reports on Form 10-Q and Form 8-K. These reports are available on our website at http://investor.abm.com/ under "SEC Filings". A description of factors that could cause actual results to differ is also set forth at the end of this presentation. Also, the discussion during this conference call will include certain financial measures that were not prepared in accordance with U.S. generally accepted accounting principles ("U.S. GAAP"). Reconciliations of those non-GAAP financial measures to the most directly comparable U.S. GAAP financial measures can be found on the Investor Relations portion of our website at http://investor.abm.com and at the end of this presentation. 5 Questions and Answers |

| 2012 Second Quarter Financial Highlights 3 Revenues essentially flat primarily due to lower contribution from government business and delays in new job starts. Cash flow from continuing operations of $42.6 million, up $11.3 million year-over- year Reduced outstanding loans under Line of Credit by $27 million sequentially Adjusted Income from Continuing Operations of $16.3 million, up $1.3 million or 9% Adjusted Income from Continuing Operations on a per diluted share basis up 7.1% to $0.30 Announced our 185th consecutive dividend |
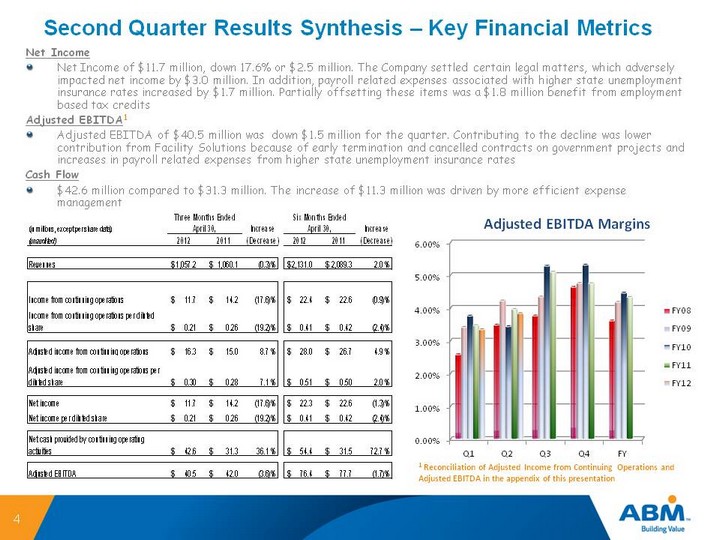
| Second Quarter Results Synthesis - Key Financial Metrics 4 Net Income Net Income of $11.7 million, down 17.6% or $2.5 million. The Company settled certain legal matters, which adversely impacted net income by $3.0 million. In addition, payroll related expenses associated with higher state unemployment insurance rates increased by $1.7 million. Partially offsetting these items was a $1.8 million benefit from employment based tax credits Adjusted EBITDA1 Adjusted EBITDA of $40.5 million was down $1.5 million for the quarter. Contributing to the decline was lower contribution from Facility Solutions because of early termination and cancelled contracts on government projects and increases in payroll related expenses from higher state unemployment insurance rates Cash Flow $42.6 million compared to $31.3 million. The increase of $11.3 million was driven by more efficient expense management 1 Reconciliation of Adjusted Income from Continuing Operations and Adjusted EBITDA in the appendix of this presentation |
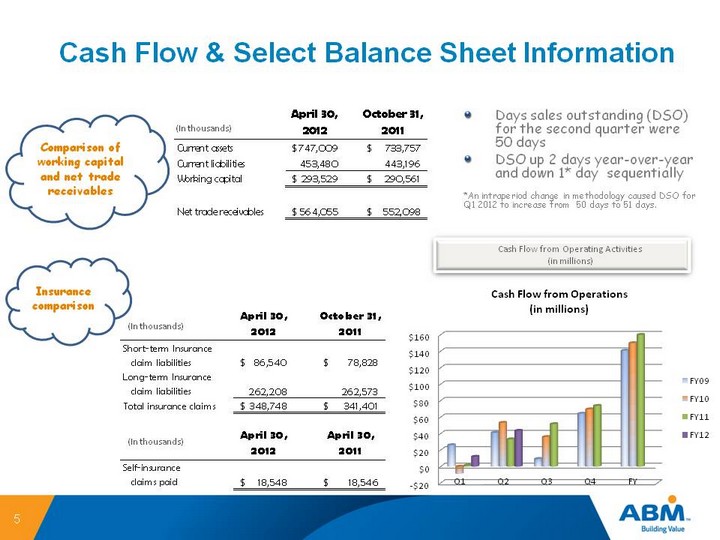
| Cash Flow & Select Balance Sheet Information Insurance comparison Comparison of working capital and net trade receivables (In thousands) (In thousands) (In thousands) Cash Flow from Operating Activities (in millions) Days sales outstanding (DSO) for the second quarter were 50 days DSO up 2 days year-over-year and down 1* day sequentially *An intraperiod change in methodology caused DSO for Q1 2012 to increase from 50 days to 51 days. 5 |
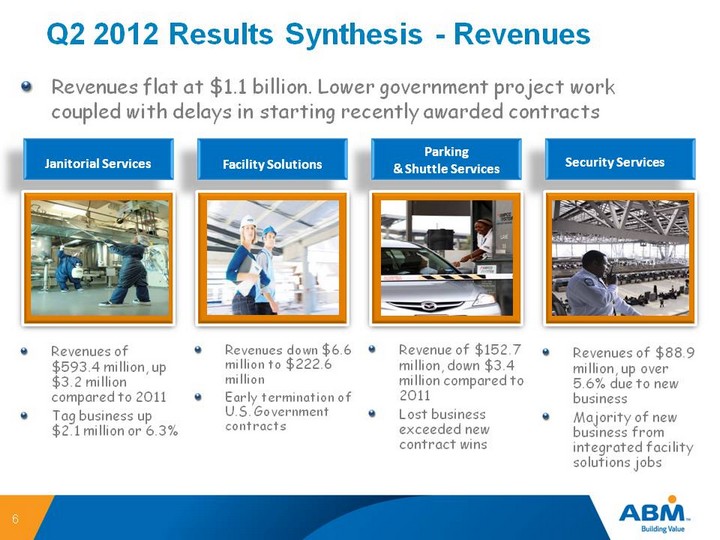
| Facility Solutions Q2 2012 Results Synthesis - Revenues Revenues of $593.4 million, up $3.2 million compared to 2011 Tag business up $2.1 million or 6.3% Revenues flat at $1.1 billion. Lower government project work coupled with delays in starting recently awarded contracts Janitorial Services Parking & Shuttle Services Security Services Revenues down $6.6 million to $222.6 million Early termination of U.S. Government contracts Revenue of $152.7 million, down $3.4 million compared to 2011 Lost business exceeded new contract wins Revenues of $88.9 million, up over 5.6% due to new business Majority of new business from integrated facility solutions jobs 6 |
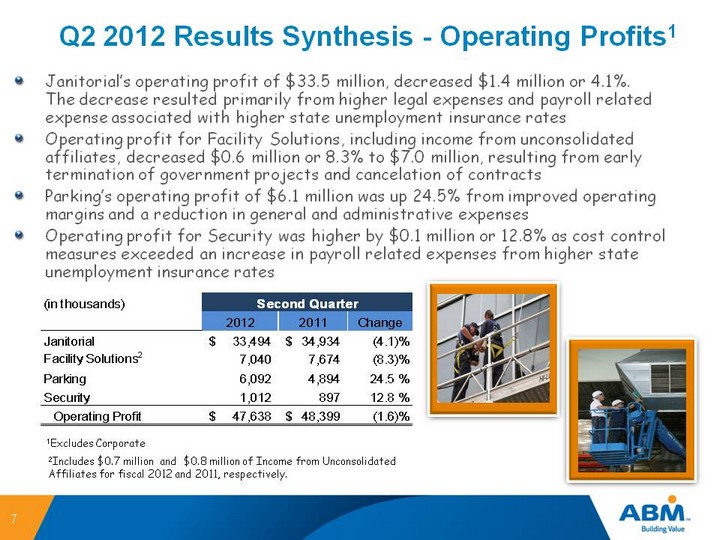
| Q2 2012 Results Synthesis - Operating Profits1 Janitorial's operating profit of $33.5 million, decreased $1.4 million or 4.1%. The decrease resulted primarily from higher legal expenses and payroll related expense associated with higher state unemployment insurance rates Operating profit for Facility Solutions, including income from unconsolidated affiliates, decreased $0.6 million or 8.3% to $7.0 million, resulting from early termination of government projects and cancelation of contracts Parking's operating profit of $6.1 million was up 24.5% from improved operating margins and a reduction in general and administrative expenses Operating profit for Security was higher by $0.1 million or 12.8% as cost control measures exceeded an increase in payroll related expenses from higher state unemployment insurance rates 1Excludes Corporate 2Includes $0.7 million and $0.8 million of Income from Unconsolidated Affiliates for fiscal 2012 and 2011, respectively. 7 |
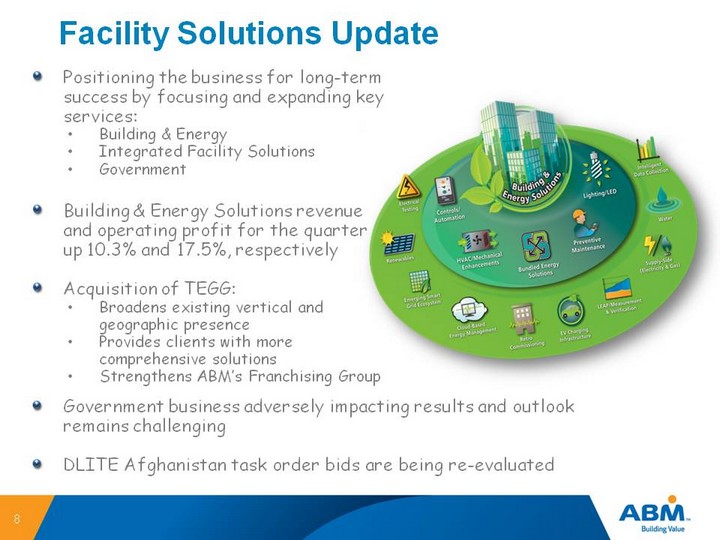
| Facility Solutions Update Positioning the business for long-term success by focusing and expanding key services: Building & Energy Integrated Facility Solutions Government Building & Energy Solutions revenue and operating profit for the quarter up 10.3% and 17.5%, respectively Acquisition of TEGG: Broadens existing vertical and geographic presence Provides clients with more comprehensive solutions Strengthens ABM's Franchising Group 8 Government business adversely impacting results and outlook remains challenging DLITE Afghanistan task order bids are being re-evaluated |

| 9 Linc Mobile Network HVAC Energy Solutions The Linc Group On-Site Business Drives Demand Pre-Acquisition Service Delivery System Urban - Suburban |
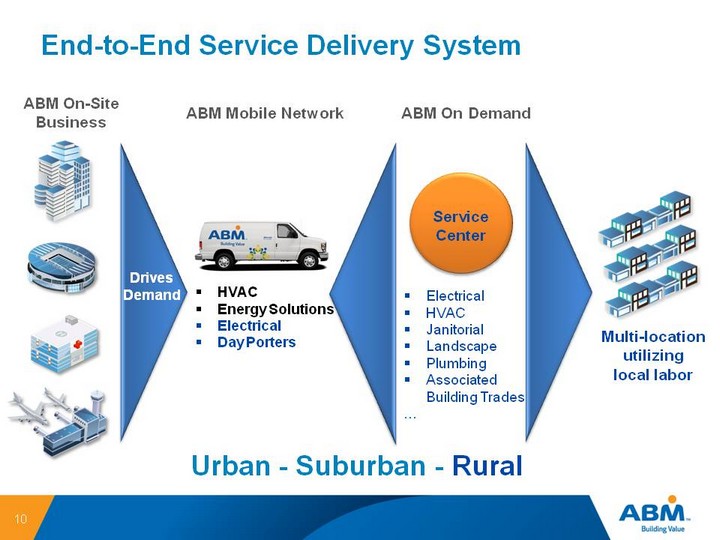
| 10 ABM Mobile Network HVAC Energy Solutions Electrical Day Porters Multi-location utilizing local labor ABM On-Site Business Drives Demand End-to-End Service Delivery System Urban - Suburban - Rural Service Center Electrical HVAC Janitorial Landscape Plumbing Associated Building Trades ... ABM On Demand |
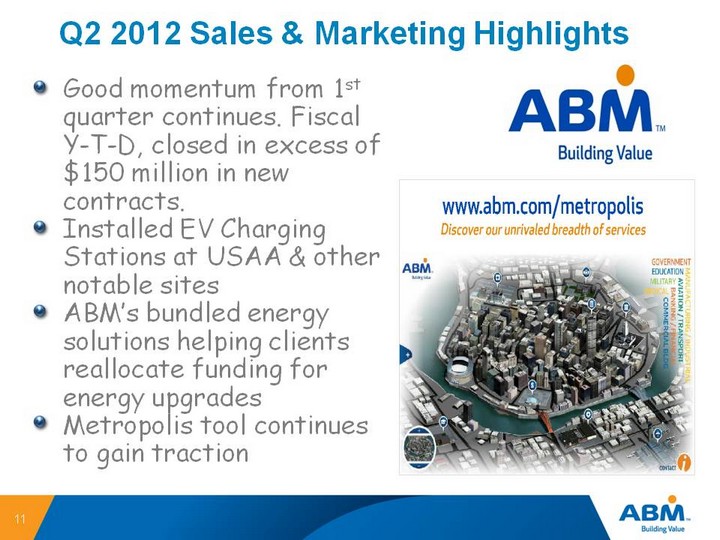
| Q2 2012 Sales & Marketing Highlights Good momentum from 1st quarter continues. Fiscal Y-T-D, closed in excess of $150 million in new contracts. Installed EV Charging Stations at USAA & other notable sites ABM's bundled energy solutions helping clients reallocate funding for energy upgrades Metropolis tool continues to gain traction 11 |
| Fiscal 2012 Outlook Summary Reaffirming guidance for fiscal year 2012 Anticipate Income from Continuing Operations of $1.26 to $1.36 per diluted share; and Adjusted Income from Continuing Operations of $1.40 to $1.50, which reflects higher expenses associated with payroll taxes (SUI & FUTA) and key initiatives to drive long-term growth Pre-tax $3.0 million to $4.0 million anticipated investments for strategic growth initiatives: Unified Workforce; ABM Energy; and Public Sourcing Additional key assumptions affecting Fiscal 2012 guidance One additional work day for FY2012; impact of approximately $3.5 million - $4.5 million pre-tax. The one additional workday will occur in the third quarter and negatively impact Income from Continuing Operations by $0.03 to $0.05 per diluted share Depreciation and Amortization expense of $52 million to $56 million Interest expense of $10 million to $12 million Expect seasonality trends to continue with the second half of the fiscal year much stronger than the first half, similar to fiscal 2011 Operating cash flow anticipated to remain strong but lower year-over-year OneSource NOL's diminishing. Cash taxes estimated to be approximately $24 million to $26 million Effective tax rate of 39% to 41%. The expiration of Work Opportunity Tax Credits (WOTC), were offset by certain discrete employment based tax credits 12 |
| Forward-Looking Statement This presentation contains forward-looking statements that set forth management's anticipated results based on management's current plans and assumptions. Any number of factors could cause the Company's actual results to differ materially from those anticipated. These factors include but are not limited to the following: we may not be able to achieve anticipated global growth due to various factors, including, but not limited to, an inability to make strategic acquisitions or compete internationally; our acquisition strategy may adversely impact our results of operations as we may not be able to achieve anticipated results from any given acquisition; and activities relating to integrating an acquired business may divert management's focus on operational matters; we are subject to intense competition that can constrain our ability to gain business, as well as our profitability; any increases in costs that we cannot pass on to clients could affect our profitability; we have high deductibles for certain insurable risks, and, therefore are subject to volatility associated with those risks; we primarily provide our services pursuant to agreements which are cancelable by either party upon 30 to 90 days' notice; our success depends on our ability to preserve our long-term relationships with clients; our international business exposes us to additional risks, including risks related to compliance with both U.S. and foreign laws; we conduct some of our operations through joint ventures and our ability to do business may be affected by the failure of our joint venture partners to perform their obligations or the improper conduct of employees, joint venture partners or agents; significant delays or reductions in appropriations for our government contracts as well as changes in government and client priorities and requirements (including cost-cutting, the potential deferral of awards, reductions or terminations of expenditures in response to the priorities of Congress and the Executive Office, or budgetary cuts) may negatively affect our business, and could have a material adverse effect on our financial position, results of operations or cash flows; we incur significant accounting and other control costs that reduce profitability; a decline in commercial office building occupancy and rental rates could affect our revenues and profitability; deterioration in economic conditions in general could further reduce the demand for facility services and, as a result, could reduce our earnings and adversely affect our financial condition; financial difficulties or bankruptcy of one or more of our major clients could adversely affect our results; our ability to operate and pay our debt obligations depends upon our access to cash; future declines in the fair value of our investments in auction rate securities could negatively impact our earnings; uncertainty in the credit markets may negatively impact our costs of borrowing, our ability to collect receivables on a timely basis and our cash flow; any future increase in the level of debt or in interest rates can affect out results of operations; an impairment charge could have a material adverse effect on our financial condition and results of operations; we are defendants in a number of class and representative actions or other lawsuits alleging various claims that could cause us to incur substantial liabilities; federal health care reform legislation may adversely affect our business and results of operations; changes in immigration laws or enforcement actions or investigations under such laws could significantly adversely affect our labor force, operations and financial results; labor disputes could lead to loss of revenues or expense variations; we participate in multi-employer defined benefit plans which could result in substantial liabilities being incurred; and natural disasters or acts of terrorism could disrupt services. Additional information regarding these and other risks and uncertainties the Company faces is contained in the Company's Annual Report on Form 10-K for the year ended October 31, 2011 and in other reports the Company files from time to time with the Securities and Exchange Commission 13 |

| Appendix - Unaudited Reconciliation of non-GAAP Financial Measures |
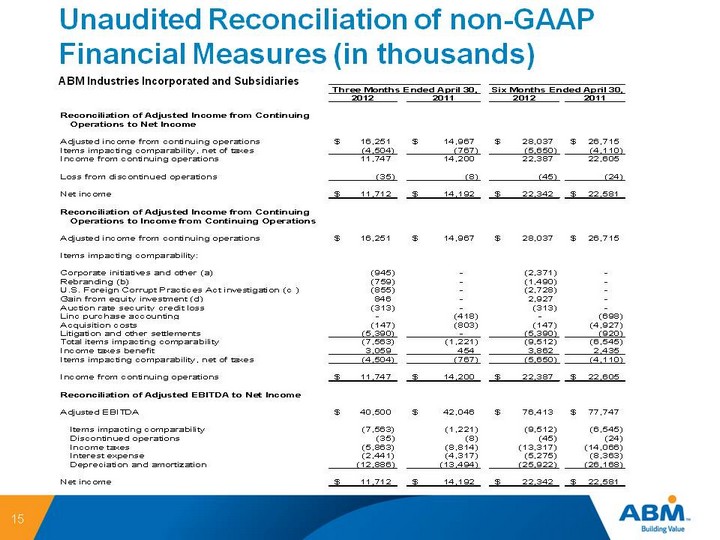
| Unaudited Reconciliation of non-GAAP Financial Measures (in thousands) 15 ABM Industries Incorporated and Subsidiaries |
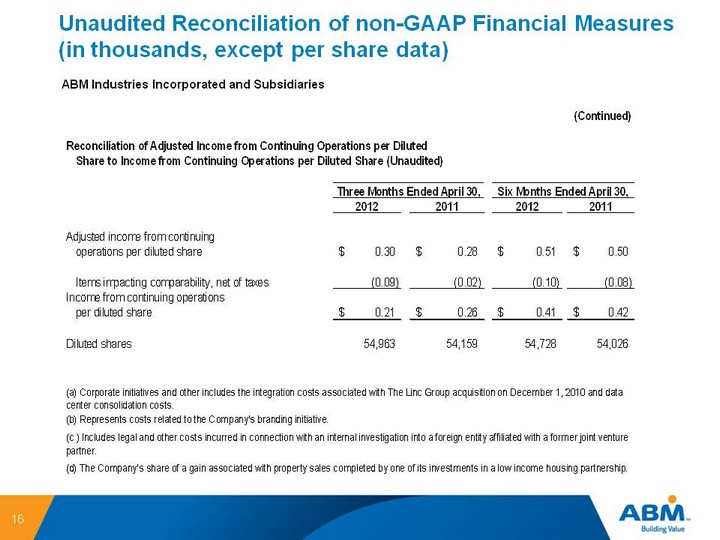
| Unaudited Reconciliation of non-GAAP Financial Measures (in thousands, except per share data) 16 ABM Industries Incorporated and Subsidiaries |

| Unaudited Reconciliation of non-GAAP Financial Measures 17 |