Attached files
| file | filename |
|---|---|
| 8-K - TWO HARBORS INVESTMENT CORP. | a8kq1-2012updatedinvestorp.htm |

Two Harbors Investment Corp. Updated First Quarter 2012 Investor Presentation

1 Safe Harbor Statement Forward-Looking Statements This presentation includes “forward-looking statements” within the meaning of the safe harbor provisions of the United States Private Securities Litigation Reform Act of 1995. Actual results may differ from expectations, estimates and projections and, consequently, readers should not rely on these forward-looking statements as predictions of future events. Words such as “expect,” “target,” “assume,” “estimate,” “project,” “budget,” “forecast,” “anticipate,” “intend,” “plan,” “may,” “will,” “could,” “should,” “believe,” “predicts,” “potential,” “continue,” and similar expressions are intended to identify such forward-looking statements. These forward-looking statements involve significant risks and uncertainties that could cause actual results to differ materially from expected results. Factors that could cause actual results to differ include, but are not limited to, higher than expected operating costs, changes in prepayment speeds of mortgages underlying our RMBS, the rates of default or decreased recovery on the mortgages underlying our non-Agency securities, failure to recover certain losses that are expected to be temporary, changes in interest rates or the availability of financing, the impact of new legislation or regulatory changes on our operations, the impact of any deficiencies in the servicing or foreclosure practices of third parties and related delays in the foreclosure process, the inability to acquire mortgage loans or securitize the mortgage loans we acquire, the inability to acquire single family residential real properties at attractive prices or lease such properties on a profitable basis, the impact of new or modified government mortgage refinance or principal reduction programs, and unanticipated changes in overall market and economic conditions. Readers are cautioned not to place undue reliance upon any forward-looking statements, which speak only as of the date made. Two Harbors does not undertake or accept any obligation to release publicly any updates or revisions to any forward-looking statement to reflect any change in its expectations or any change in events, conditions or circumstances on which any such statement is based. Additional information concerning these and other risk factors is contained in Two Harbors’ most recent filings with the Securities and Exchange Commission. All subsequent written and oral forward looking statements concerning Two Harbors or matters attributable to Two Harbors or any person acting on its behalf are expressly qualified in their entirety by the cautionary statements above.

2 Our Mission Guides Us Our mission is to be recognized as the industry-leading hybrid mortgage REIT. We’ll accomplish this goal through the following: ▪ Superior portfolio construction and fluid capital allocation through rigorous security selection and credit analysis ▪ Unparalleled risk management with a strong focus on hedging and book value stability ▪ Targeted diversification of business model through asset securitization and single family residential properties ▪ Leading governance and disclosure practices
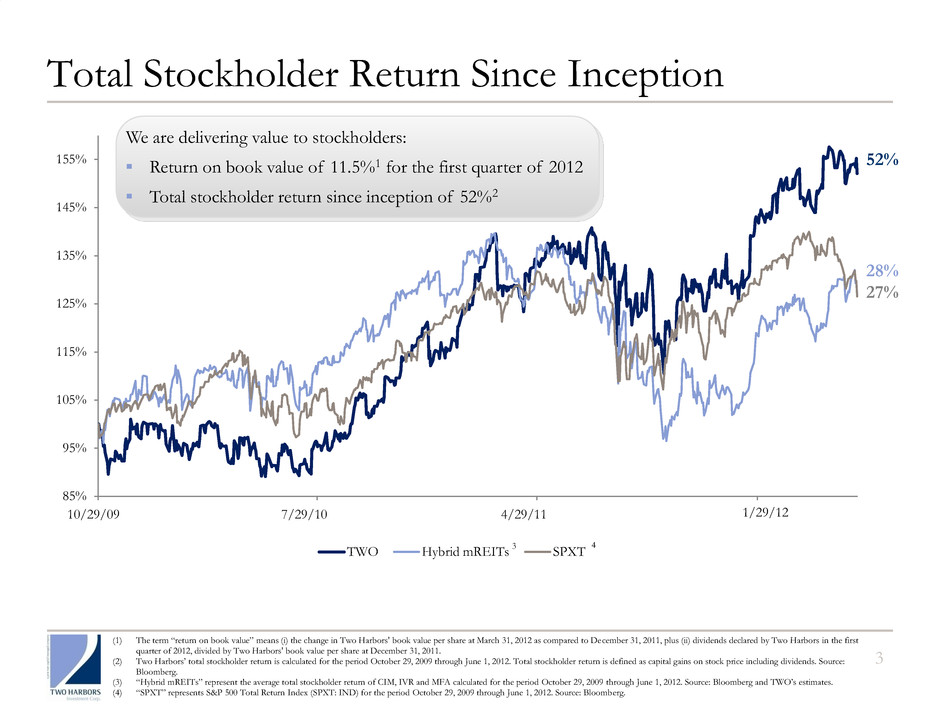
85% 95% 105% 115% 125% 135% 145% 155% 10/29/2009 7/29/2010 4/29/2011 1/29/2012 TWO Hybrid mREITs SPXT 10/29/09 7/29/10 4/29/11 1/29/ Total Stockholder Return Since Inception 3 52% 28% 27% (1) The term “return on book value” means (i) the change in Two Harbors' book value per share at March 31, 2012 as compared to December 31, 2011, plus (ii) dividends declared by Two Harbors in the first quarter of 2012, divided by Two Harbors' book value per share at December 31, 2011. (2) Two Harbors’ total stockholder return is calculated for the period October 29, 2009 through June 1, 2012. Total stockholder return is defined as capital gains on stock price including dividends. Source: Bloomberg. (3) “Hybrid mREITs” represent the average total stockholder return of CIM, IVR and MFA calculated for the period October 29, 2009 through June 1, 2012. Source: Bloomberg and TWO’s estimates. (4) “SPXT” represents S&P 500 Total Return Index (SPXT: IND) for the period October 29, 2009 through June 1, 2012. Source: Bloomberg. We are delivering value to stockholders: ▪ Return on book value of 11.5%1 for the first quarter of 2012 ▪ Total stockholder return since inception of 52%2 3 4
4 Market Opportunity for Two Harbors Two Harbors is well positioned to create value for stockholders: ▪ NYSE-listed hybrid mortgage REIT investing in residential mortgage and housing sectors ▪ Formed in 2009 - new REIT with veteran RMBS team and state-of-the-art analytics ▪ Twenty-fold increase in market capitalization since inception to over $2 billion The shifting landscape in the U.S. housing and mortgage markets create opportunity: ▪ U.S. government is reducing its involvement in sector ▪ Banks adjusting portfolios due to new regulatory framework for capital and liquidity requirements ▪ Private capital, such as mortgage-REITs, are essential to fill void in housing and mortgage sectors ▪ It will take many years to address all the issues surrounding housing finance and therein lies opportunity for Two Harbors
5 Our Strategic Focus Areas We look for opportunities to deploy capital where the greatest risk-adjusted returns can be derived. ▪ Agency: Well positioned to capitalize on reduced competition for Agency assets − Prepayment protection stories offer value − Hedging costs at historic lows − Policy uncertainty continues to create opportunity ▪ Non-Agency: Attractive on both an absolute and relative basis − Technicals have weighed on this sector, but fundamentals have improved − Improving underlying loan performance, including declining delinquencies, relatively stable housing prices and servicers’ actions benefiting bond holders − Potential benefit from policy actions ▪ Targeted diversification of business model to longer term opportunities − Single family residential real properties: This is an attractive asset class due to long duration, ability to leverage and potential for home price appreciation and increased rents. − Asset securitization: Our objective is to create attractive yielding credit bonds off high quality collateral.

110 Record Affordability and Attractive Yields 110 Target Markets 6 Single Family Residential Opportunity Home affordability is at all-time high, but many cannot get a mortgage, thus rental demand is strong U.S. real housing prices have fallen ~35% from their peak in 20061 Attractive current yields and discount to replacement cost suggest a compelling total return story 3% 4% 5% 6% 7% 8% 9% 100 120 140 160 180 200 220 2000 2002 2004 2006 2008 2010 2012 3 0 -Y r Av g M o rt ga ge R at e H o m e Affor d ab ili ty I n d ex Home Affordability Index 30-Yr Avg Mortgage Rate (%) 1,000 1,200 1,400 1,600 1,800 2,000 3,000 3,600 4,200 4,800 5,400 6,000 2000 2004 2008 2012 2016 2020 Population (K) Households (K) P o p u la ti o n H o u se h o ld s We are targeting properties at a significant discount to replacement cost New construction in target strata at virtual standstill Anticipated favorable absorption rates in our key markets, such as Phoenix, are based upon trends in population and household growth Housing Affordability at Record Levels2 Phoenix Housing Trends3 (1) Source: Case-Shiller. (2) Source: National Association of Realtors & Bankrate.com. (3) Source: Moody’s.

Fluid Asset Allocation Drives Performance 7 (1) The first quarter 2012 dividend may not be indicative of future dividend distributions. The company ultimately distributes dividends based on its taxable income per common share, not GAAP earnings. The annualized dividend yield on the company’s common stock is calculated based on the closing price of the last trading day of the quarter. (2) Respective yields include inverse interest-only securities (“Agency Derivatives”). (3) Net interest spread includes Agency Derivatives, cost of financing RMBS and swap interest rate spread. Targeted Capital Allocation Dividends1 Annualized Yields by Portfolio2 Net Interest Spread3 50% 60% 60% 55% 55% 52% 50% 40% 40% 45% 45% 48% 30% 40% 50% 60% Agency Allocation Non-Agency Allocation Q4-2010 Q1-2011 Q2-2011 Q3-2011 Q4-2011 Q1-2012 $0.40 $0.40 $0.40 $0.40 $0.40 $0.40 16.3 15.3% 14.9% 18.1% 17.3% 15.8% 0.0% 5.0% 10.0% 15.0% 20.0% $- $0.10 $0.20 $0.30 $0. 0 $0.50 Q4-2010 Q1-2011 Q2-2011 Q3-2011 Q4-2011 Q1-2012 Dividend per Share Dividend Yield (%) 3.8% 3.9% 4.7% 4.3% 3.5% 3.5% 11.4% 9.7% 8.8% 9.8% 9.7% 9.7% 5.8% 5.2% 5.4% 5.5% 4.8% 4.9% – 2.0% 4.0% 6.0% 8.0% 10.0% 12.0% Q4-2010 Q1-2011 Q2-2011 Q3-2011 Q4-2011 Q1-2012 Agency RMBS Non-Agency RMBS Aggregate Portfolio Three Months Ended December 31, 2011 March 31, 2012 Agency Non- Agency Aggregate Portfolio Agency Non- Agency Aggregate Portfolio Annualized Yield 3.5% 9.7% 4.8% 3.5% 9.7% 4.9% Cost of repurchase agreements (0.4%) (2.2%) (0.6%) (0.4%) (2.3%) (0.7%) Cost of interest rate swaps & swaptions (0.5%) - (0.4%) (0.3%) - (0.3%) Cost of financing (0.9%) (2.2%) (1.0%) (0.7%) (2.3%) (1.0%) Net interest spread 2.6% 7.5% 3.8% 2.8% 7.4% 3.9%
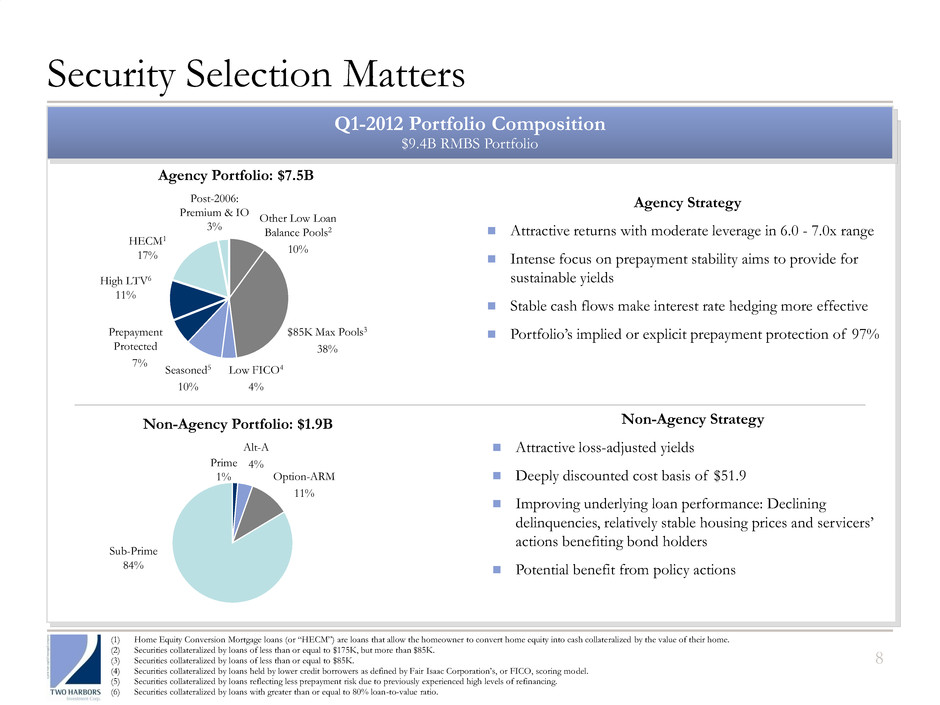
8 Security Selection Matters (1) Home Equity Conversion Mortgage loans (or “HECM”) are loans that allow the homeowner to convert home equity into cash collateralized by the value of their home. (2) Securities collateralized by loans of less than or equal to $175K, but more than $85K. (3) Securities collateralized by loans of less than or equal to $85K. (4) Securities collateralized by loans held by lower credit borrowers as defined by Fair Isaac Corporation’s, or FICO, scoring model. (5) Securities collateralized by loans reflecting less prepayment risk due to previously experienced high levels of refinancing. (6) Securities collateralized by loans with greater than or equal to 80% loan-to-value ratio. Agency Strategy Attractive returns with moderate leverage in 6.0 - 7.0x range Intense focus on prepayment stability aims to provide for sustainable yields Stable cash flows make interest rate hedging more effective Portfolio’s implied or explicit prepayment protection of 97% Non-Agency Strategy Attractive loss-adjusted yields Deeply discounted cost basis of $51.9 Improving underlying loan performance: Declining delinquencies, relatively stable housing prices and servicers’ actions benefiting bond holders Potential benefit from policy actions Q1-2012 Portfolio Composition $9.4B RMBS Portfolio Agency Portfolio: $7.5B $85K Max Pools3 38% Prepayment Protected 7% Post-2006: Premium & IO 3% High LTV6 11% Seasoned5 10% Sub-Prime 84% Option-ARM 11% Prime 1% Alt-A 4% HECM1 17% Other Low Loan Balance Pools2 10% Non-Agency Portfolio: $1.9B Low FICO4 4%
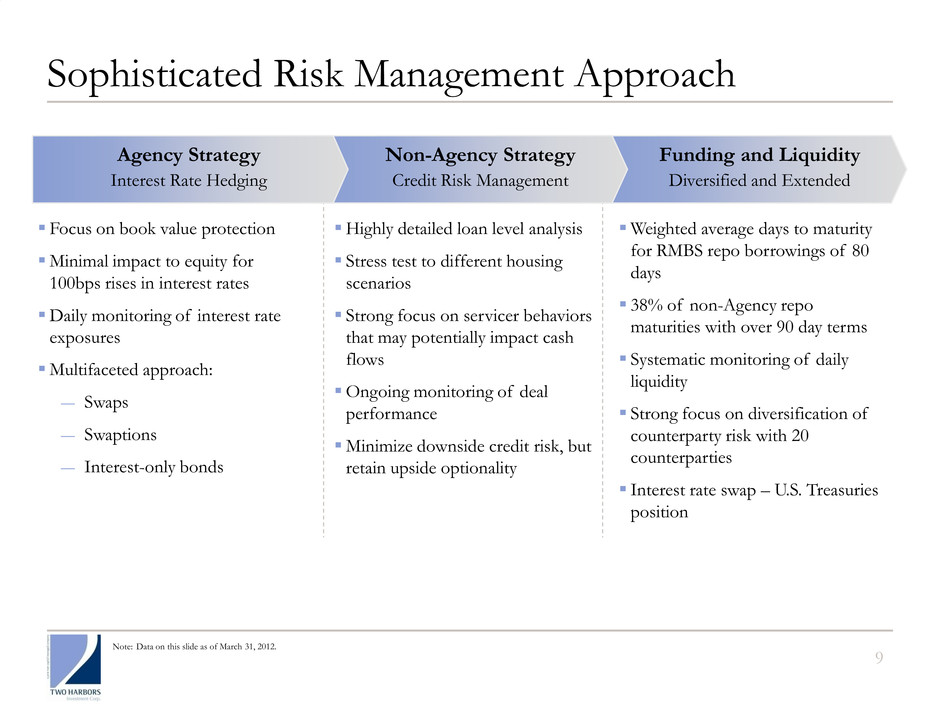
9 Sophisticated Risk Management Approach Funding and Liquidity Diversified and Extended Non-Agency Strategy Credit Risk Management Agency Strategy Interest Rate Hedging Focus on book value protection Minimal impact to equity for 100bps rises in interest rates Daily monitoring of interest rate exposures Multifaceted approach: ― Swaps ― Swaptions ― Interest-only bonds Highly detailed loan level analysis Stress test to different housing scenarios Strong focus on servicer behaviors that may potentially impact cash flows Ongoing monitoring of deal performance Minimize downside credit risk, but retain upside optionality Weighted average days to maturity for RMBS repo borrowings of 80 days 38% of non-Agency repo maturities with over 90 day terms Systematic monitoring of daily liquidity Strong focus on diversification of counterparty risk with 20 counterparties Interest rate swap – U.S. Treasuries position Note: Data on this slide as of March 31, 2012.
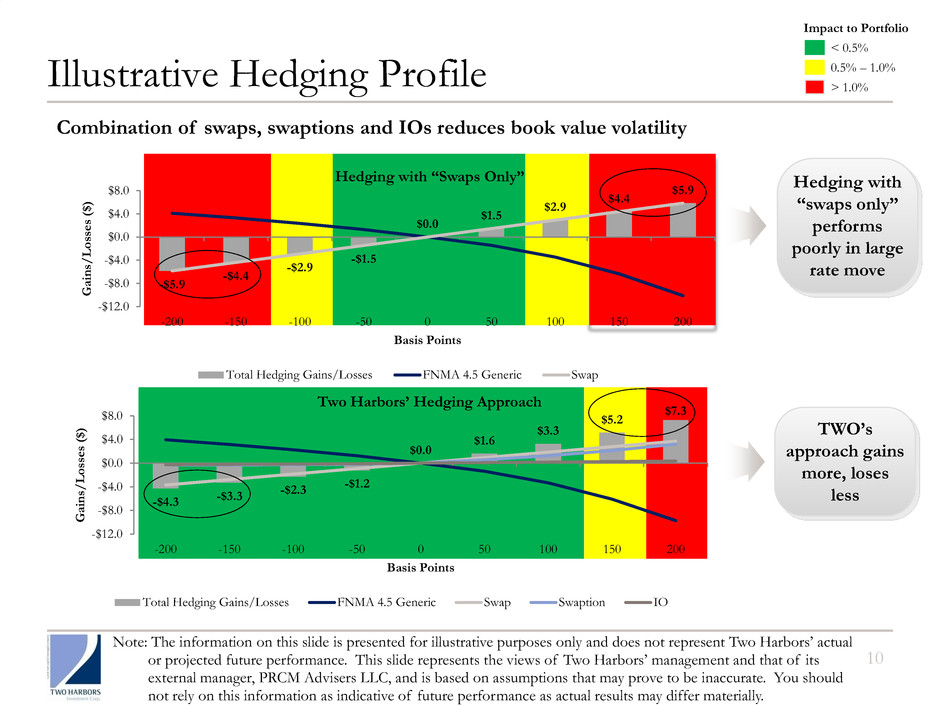
Illustrative Hedging Profile 10 < 0.5% 0.5% – 1.0% > 1.0% Impact to Portfolio Hedging with “Swaps Only” -$5.9 -$4.4 -$2.9 -$1.5 $0.0 $1.5 $2.9 $4.4 $5.9 -$12.0 -$8.0 -$4.0 $0.0 $4.0 $8.0 -200 -150 -100 -50 0 50 100 150 200 G ain s/ L os se s ($ ) Basis Points Total Hedging Gains/Losses FNMA 4.5 Generic Swap Hedging with “swaps only” performs poorly in large rate move Two Harbors’ Hedging Approach TWO’s approach gains more, loses less -$4.3 -$3.3 -$2.3 -$1.2 $0.0 $1.6 $3.3 $5.2 $7.3 -$12.0 -$8.0 -$4.0 $0.0 $4.0 $8.0 -200 -150 -100 -50 0 50 100 150 200 G ain s/ L os se s ($ ) Basis Points Total Hedging Gains/Losses FNMA 4.5 Generic Swap Swaption IO Note: The information on this slide is presented for illustrative purposes only and does not represent Two Harbors’ actual or projected future performance. This slide represents the views of Two Harbors’ management and that of its external manager, PRCM Advisers LLC, and is based on assumptions that may prove to be inaccurate. You should not rely on this information as indicative of future performance as actual results may differ materially. Combination of swaps, swaptions and IOs reduces book value volatility
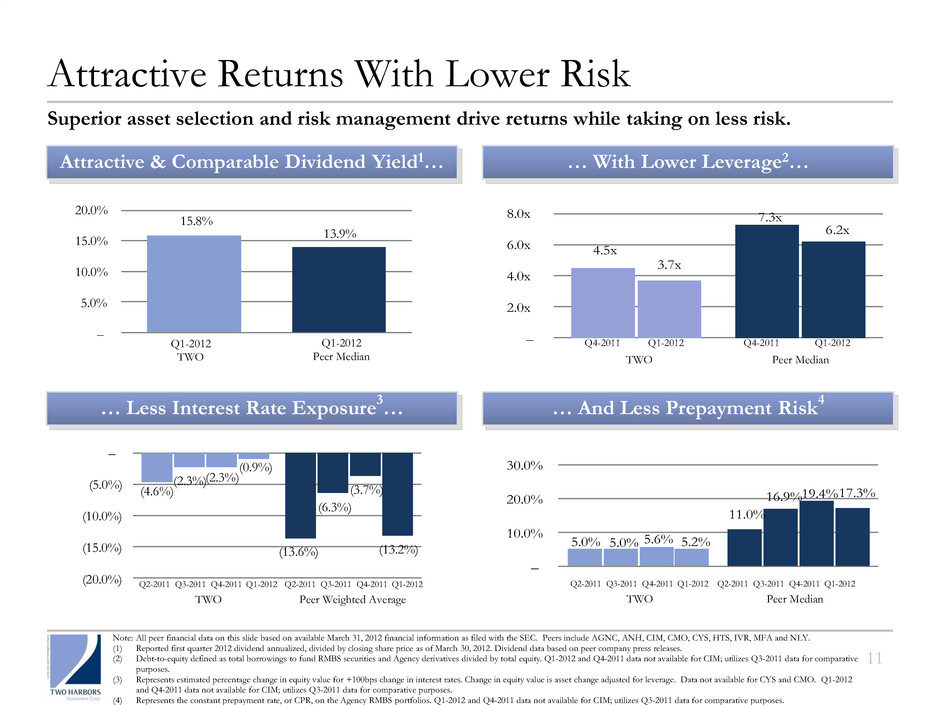
11 Attractive Returns With Lower Risk Attractive & Comparable Dividend Yield1… … With Lower Leverage2… … Less Interest Rate Exposure 3 … … And Less Prepayment Risk 4 4.5x 7.3x 3.7x 6.2x – 2.0x 4.0x 6.0x 8.0x 5.0% 11.0% 5.0% 16.9% 5.6% 19.4% 5.2% 17.3% – 10.0% 20.0% 30.0% 15.8% 13.9% – 5.0% 10.0% 15.0% 20.0% Note: All peer financial data on this slide based on available March 31, 2012 financial information as filed with the SEC. Peers include AGNC, ANH, CIM, CMO, CYS, HTS, IVR, MFA and NLY. (1) Reported first quarter 2012 dividend annualized, divided by closing share price as of March 30, 2012. Dividend data based on peer company press releases. (2) Debt-to-equity defined as total borrowings to fund RMBS securities and Agency derivatives divided by total equity. Q1-2012 and Q4-2011 data not available for CIM; utilizes Q3-2011 data for comparative purposes. (3) Represents estimated percentage change in equity value for +100bps change in interest rates. Change in equity value is asset change adjusted for leverage. Data not available for CYS and CMO. Q1-2012 and Q4-2011 data not available for CIM; utilizes Q3-2011 data for comparative purposes. (4) Represents the constant prepayment rate, or CPR, on the Agency RMBS portfolios. Q1-2012 and Q4-2011 data not available for CIM; utilizes Q3-2011 data for comparative purposes. Q1-2012 TWO Q1-2012 Peer Median TWO Peer Median Superior asset selection and risk management drive returns while taking on less risk. Q2-2011 Q3-2011 Q4-2011 Q1-2012 Q2-2011 Q3-2011 Q4-2011 Q1-2012 Peer Median TWO Q4-2011 Q1-2012 Q4-2011 Q1-2012 (4.6%) (13.6%) (2.3%) (6.3%) (2.3%) (3.7%) (0.9%) (13.2%) (20.0%) (15.0%) (10.0%) (5.0%) – TWO Peer Weighted Average Q2-2011 Q3-2011 Q4-2011 Q1-2012 Q2-2011 Q3-2011 Q4-2011 Q1-2012

12 For further information, please contact: Christine Battist Investor Relations Two Harbors Investment Corp. 612.629.2507 Christine.Battist@twoharborsinvestment.com Contact Information Anh Huynh Investor Relations Two Harbors Investment Corp. 212.364.3221 Anh.Huynh@twoharborsinvestment.com

Appendix
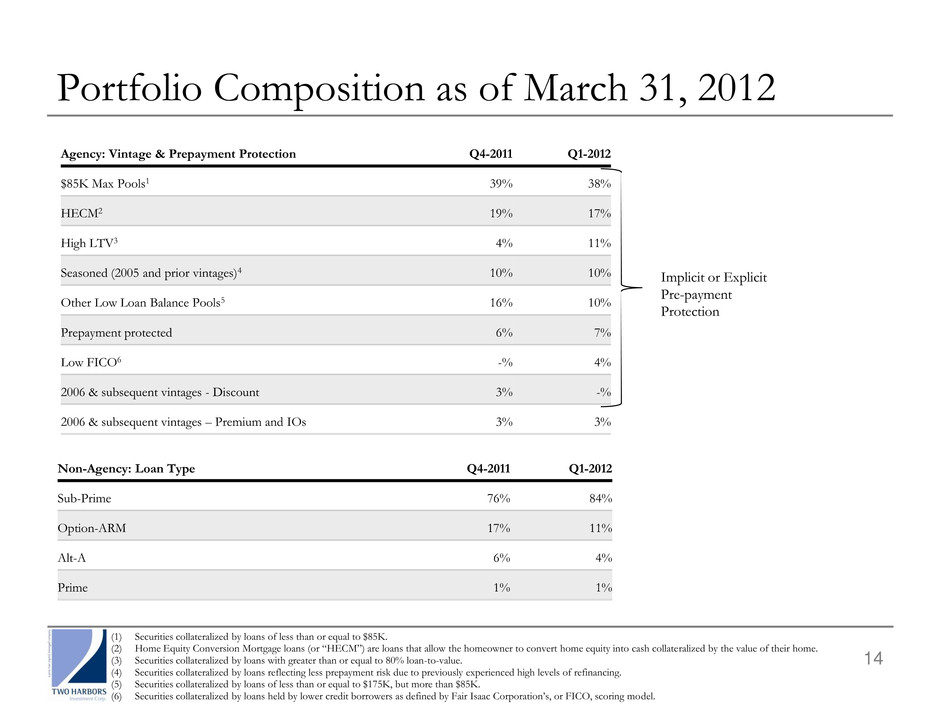
14 Portfolio Composition as of March 31, 2012 Agency: Vintage & Prepayment Protection Q4-2011 Q1-2012 $85K Max Pools1 39% 38% HECM2 19% 17% High LTV3 4% 11% Seasoned (2005 and prior vintages)4 10% 10% Other Low Loan Balance Pools5 16% 10% Prepayment protected 6% 7% Low FICO6 -% 4% 2006 & subsequent vintages - Discount 3% -% 2006 & subsequent vintages – Premium and IOs 3% 3% Implicit or Explicit Pre-payment Protection Non-Agency: Loan Type Q4-2011 Q1-2012 Sub-Prime 76% 84% Option-ARM 17% 11% Alt-A 6% 4% Prime 1% 1% (1) Securities collateralized by loans of less than or equal to $85K. (2) Home Equity Conversion Mortgage loans (or “HECM”) are loans that allow the homeowner to convert home equity into cash collateralized by the value of their home. (3) Securities collateralized by loans with greater than or equal to 80% loan-to-value. (4) Securities collateralized by loans reflecting less prepayment risk due to previously experienced high levels of refinancing. (5) Securities collateralized by loans of less than or equal to $175K, but more than $85K. (6) Securities collateralized by loans held by lower credit borrowers as defined by Fair Isaac Corporation’s, or FICO, scoring model.
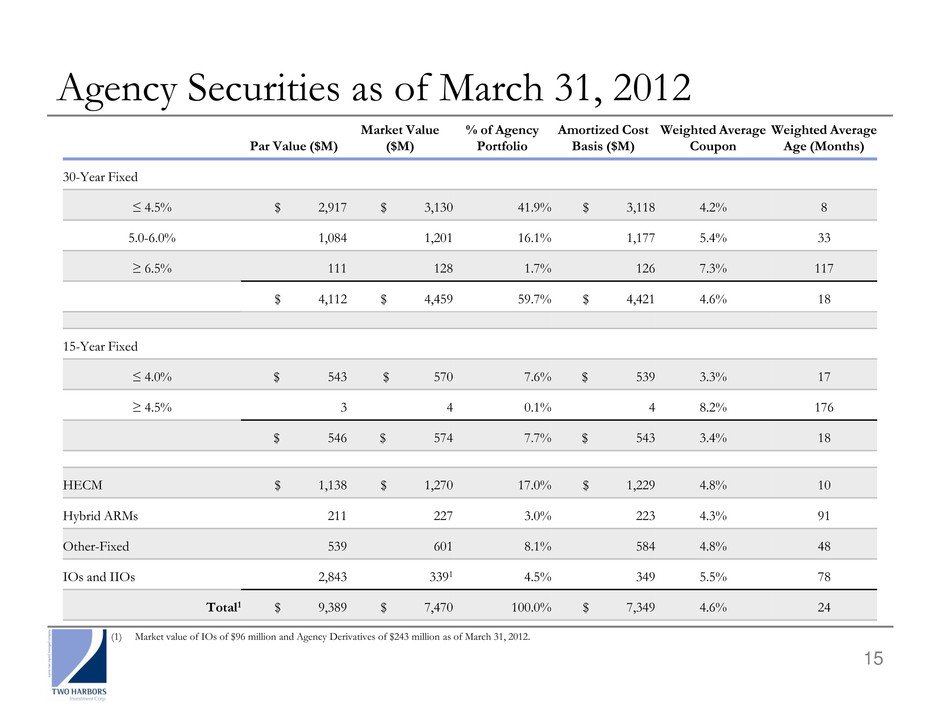
15 Agency Securities as of March 31, 2012 Par Value ($M) Market Value ($M) % of Agency Portfolio Amortized Cost Basis ($M) Weighted Average Coupon Weighted Average Age (Months) 30-Year Fixed ≤ 4.5% $ 2,917 $ 3,130 41.9% $ 3,118 4.2% 8 5.0-6.0% 1,084 1,201 16.1% 1,177 5.4% 33 ≥ 6.5% 111 128 1.7% 126 7.3% 117 $ 4,112 $ 4,459 59.7% $ 4,421 4.6% 18 15-Year Fixed ≤ 4.0% $ 543 $ 570 7.6% $ 539 3.3% 17 ≥ 4.5% 3 4 0.1% 4 8.2% 176 $ 546 $ 574 7.7% $ 543 3.4% 18 HECM $ 1,138 $ 1,270 17.0% $ 1,229 4.8% 10 Hybrid ARMs 211 227 3.0% 223 4.3% 91 Other-Fixed 539 601 8.1% 584 4.8% 48 IOs and IIOs 2,843 3391 4.5% 349 5.5% 78 Total1 $ 9,389 $ 7,470 100.0% $ 7,349 4.6% 24 (1) Market value of IOs of $96 million and Agency Derivatives of $243 million as of March 31, 2012.
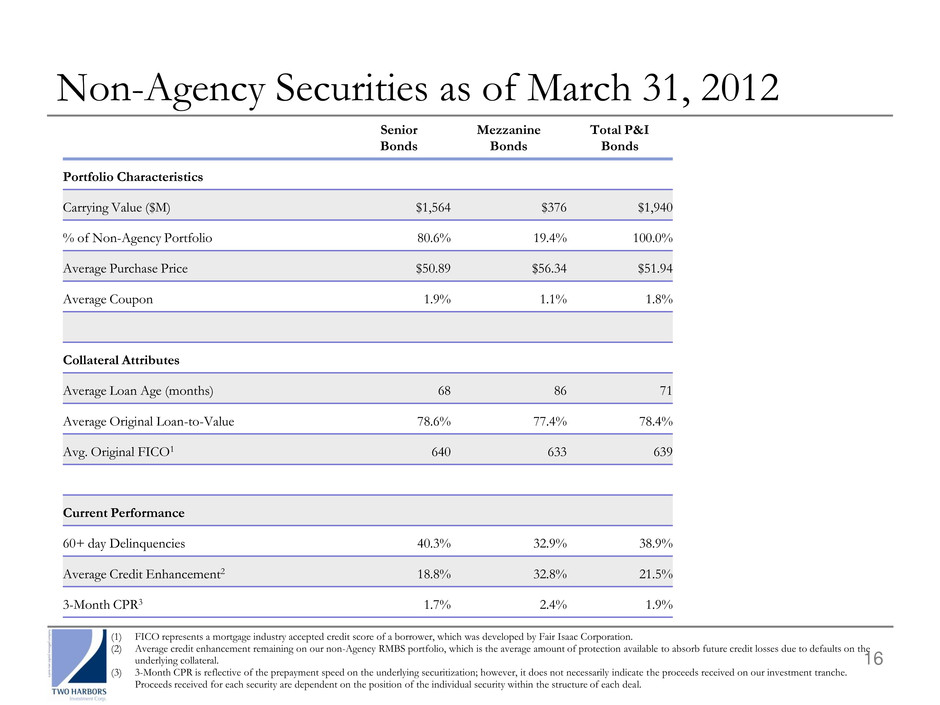
16 Non-Agency Securities as of March 31, 2012 Senior Bonds Mezzanine Bonds Total P&I Bonds Portfolio Characteristics Carrying Value ($M) $1,564 $376 $1,940 % of Non-Agency Portfolio 80.6% 19.4% 100.0% Average Purchase Price $50.89 $56.34 $51.94 Average Coupon 1.9% 1.1% 1.8% Collateral Attributes Average Loan Age (months) 68 86 71 Average Original Loan-to-Value 78.6% 77.4% 78.4% Avg. Original FICO1 640 633 639 Current Performance 60+ day Delinquencies 40.3% 32.9% 38.9% Average Credit Enhancement2 18.8% 32.8% 21.5% 3-Month CPR3 1.7% 2.4% 1.9% (1) FICO represents a mortgage industry accepted credit score of a borrower, which was developed by Fair Isaac Corporation. (2) Average credit enhancement remaining on our non-Agency RMBS portfolio, which is the average amount of protection available to absorb future credit losses due to defaults on the underlying collateral. (3) 3-Month CPR is reflective of the prepayment speed on the underlying securitization; however, it does not necessarily indicate the proceeds received on our investment tranche. Proceeds received for each security are dependent on the position of the individual security within the structure of each deal.
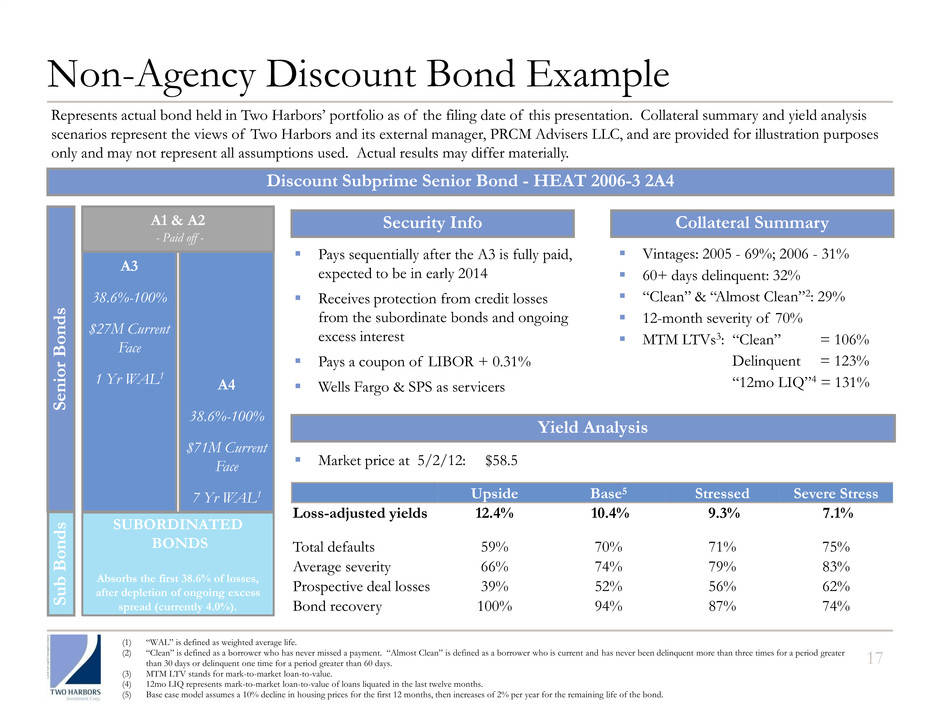
Pays sequentially after the A3 is fully paid, expected to be in early 2014 Receives protection from credit losses from the subordinate bonds and ongoing excess interest Pays a coupon of LIBOR + 0.31% Wells Fargo & SPS as servicers A3 38.6%-100% $27M Current Face 1 Yr WAL1 Discount Subprime Senior Bond - HEAT 2006-3 2A4 SUBORDINATED BONDS Absorbs the first 38.6% of losses, after depletion of ongoing excess spread (currently 4.0%). Vintages: 2005 - 69%; 2006 - 31% 60+ days delinquent: 32% “Clean” & “Almost Clean”2: 29% 12-month severity of 70% MTM LTVs3: “Clean” = 106% Delinquent = 123% “12mo LIQ”4 = 131% Market price at 5/2/12: $58.5 Security Info Collateral Summary Yield Analysis Upside Base5 Stressed Severe Stress Loss-adjusted yields 12.4% 10.4% 9.3% 7.1% Total defaults 59% 70% 71% 75% Average severity 66% 74% 79% 83% Prospective deal losses 39% 52% 56% 62% Bond recovery 100% 94% 87% 74% Non-Agency Discount Bond Example 17 A4 38.6%-100% $71M Current Face 7 Yr WAL1 S e n ior Bon d s A1 & A2 - Paid off - S u b Bon d s (1) “WAL” is defined as weighted average life. (2) “Clean” is defined as a borrower who has never missed a payment. “Almost Clean” is defined as a borrower who is current and has never been delinquent more than three times for a period greater than 30 days or delinquent one time for a period greater than 60 days. (3) MTM LTV stands for mark-to-market loan-to-value. (4) 12mo LIQ represents mark-to-market loan-to-value of loans liquated in the last twelve months. (5) Base case model assumes a 10% decline in housing prices for the first 12 months, then increases of 2% per year for the remaining life of the bond. Represents actual bond held in Two Harbors’ portfolio as of the filing date of this presentation. Collateral summary and yield analysis scenarios represent the views of Two Harbors and its external manager, PRCM Advisers LLC, and are provided for illustration purposes only and may not represent all assumptions used. Actual results may differ materially.
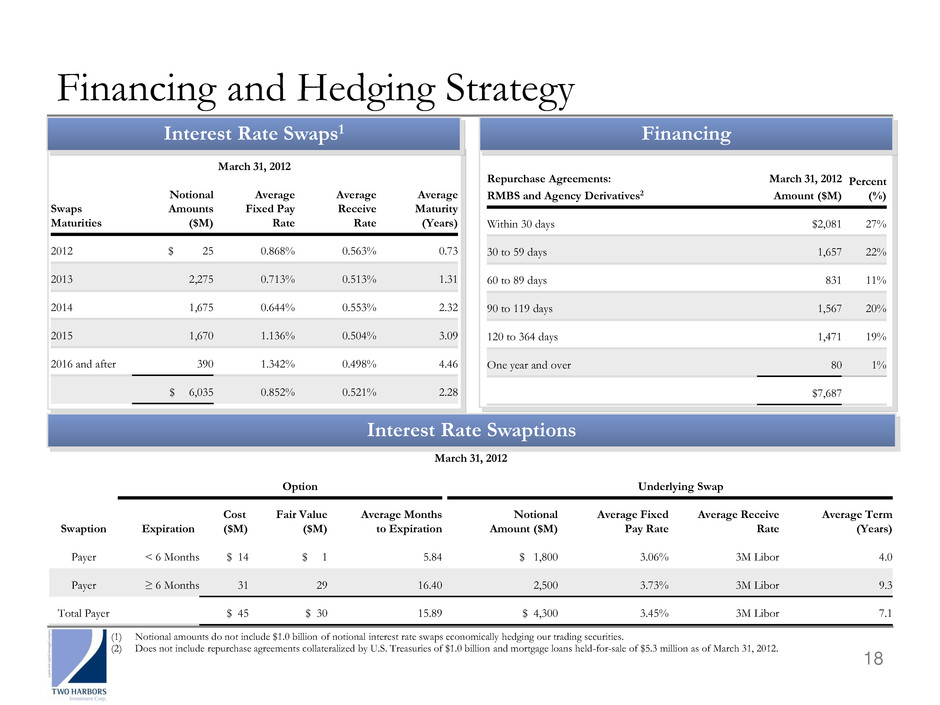
March 31, 2012 Option Underlying Swap Swaption Expiration Cost ($M) Fair Value ($M) Average Months to Expiration Notional Amount ($M) Average Fixed Pay Rate Average Receive Rate Average Term (Years) Payer < 6 Months $ 14 $ 1 5.84 $ 1,800 3.06% 3M Libor 4.0 Payer ≥ 6 Months 31 29 16.40 2,500 3.73% 3M Libor 9.3 Total Payer $ 45 $ 30 15.89 $ 4,300 3.45% 3M Libor 7.1 110 110 March 31, 2012 Swaps Maturities Notional Amounts ($M) Average Fixed Pay Rate Average Receive Rate Average Maturity (Years) 2012 $ 25 0.868% 0.563% 0.73 2013 2,275 0.713% 0.513% 1.31 2014 1,675 0.644% 0.553% 2.32 2015 1,670 1.136% 0.504% 3.09 2016 and after 390 1.342% 0.498% 4.46 $ 6,035 0.852% 0.521% 2.28 18 Financing and Hedging Strategy (1) Notional amounts do not include $1.0 billion of notional interest rate swaps economically hedging our trading securities. (2) Does not include repurchase agreements collateralized by U.S. Treasuries of $1.0 billion and mortgage loans held-for-sale of $5.3 million as of March 31, 2012. Repurchase Agreements: RMBS and Agency Derivatives2 March 31, 2012 Amount ($M) Percent (%) Within 30 days $2,081 27% 30 to 59 days 1,657 22% 60 to 89 days 831 11% 90 to 119 days 1,567 20% 120 to 364 days 1,471 19% One year and over 80 1% $7,687 Interest Rate Swaps1 Financing Interest Rate Swaptions
19 Market Overview: Single Family Residential Real Properties The market opportunity is attractive for Two Harbors’ diversification into single family residential real properties. ― Affordability is high ― Overhang of shadow inventory needs to be cleared ― Strong rental demand ― Signs of housing stabilization underway ― Declining foreclosures and delinquencies Market participants who can bring institutional excellence surrounding property acquisition and management will have a competitive advantage. Attractive current yields and discount to replacement cost suggest a compelling total return story. Two Harbors’ investment in single family residential properties aligns with our core competencies including residential credit analysis.
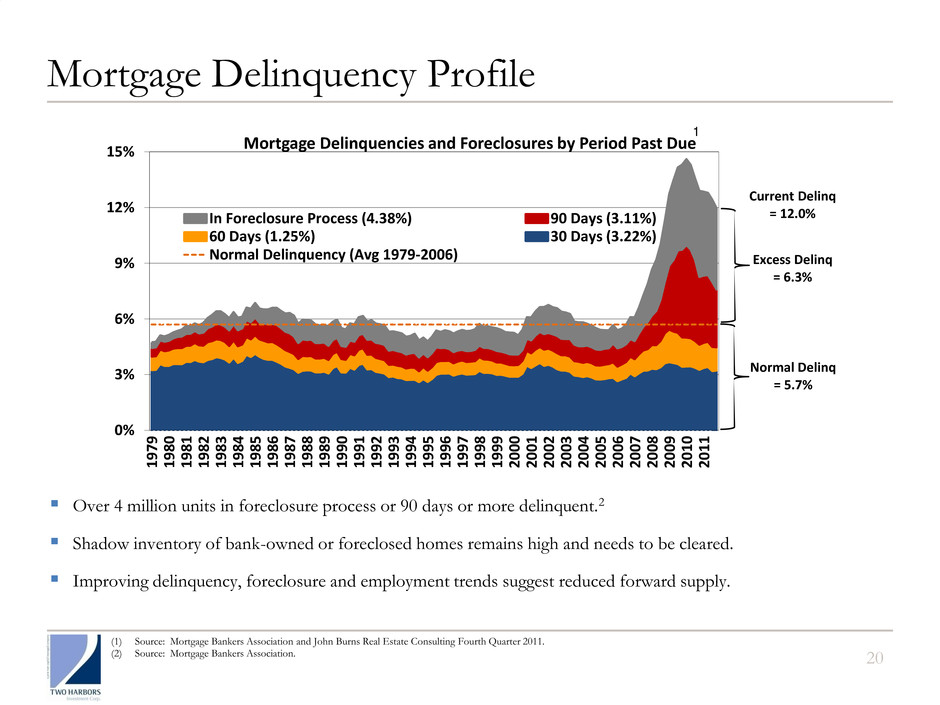
20 Mortgage Delinquency Profile Over 4 million units in foreclosure process or 90 days or more delinquent.2 Shadow inventory of bank-owned or foreclosed homes remains high and needs to be cleared. Improving delinquency, foreclosure and employment trends suggest reduced forward supply. (1) Source: Mortgage Bankers Association and John Burns Real Estate Consulting Fourth Quarter 2011. (2) Source: Mortgage Bankers Association. 0% 3% 6% 9% 12% 15% 197 9 198 0 198 1 198 2 198 3 198 4 198 5 198 6 198 7 198 8 198 9 199 0 199 1 199 2 199 3 199 4 199 5 199 6 199 7 199 8 199 9 200 0 200 1 200 2 200 3 200 4 200 5 200 6 200 7 200 8 200 9 201 0 201 1 Mortgage Delinquencies and Foreclosures by Period Past Due In Foreclosure Process (4.38%) 90 Days (3.11%) 60 Days (1.25%) 30 Days (3.22%) Normal Delinquency (Avg 1979-2006) Source: Mortgage Bankers Association, JBREC; 2011Q4 Excess Delinq = 6.3% Normal Delinq = 5.7% Current Delinq = 12.0% 1
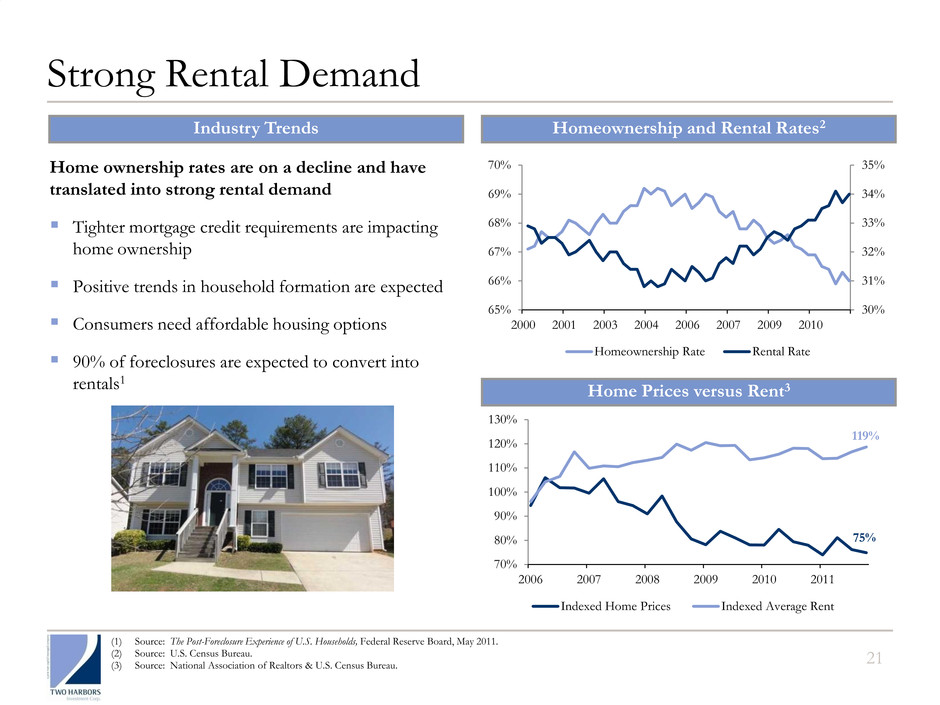
Strong Rental Demand 21 30% 31% 32% 33% 34% 35% 65% 66% 67% 68% 69% 70% 2000 2001 2003 2004 2006 2007 2009 2010 Homeownership Rate Rental Rate 75% 119% 70% 80% 90% 100% 110% 120% 130% 2006 2007 2008 2009 2010 2011 Indexed Home Prices Indexed Average Rent Industry Trends Home ownership rates are on a decline and have translated into strong rental demand Tighter mortgage credit requirements are impacting home ownership Positive trends in household formation are expected Consumers need affordable housing options 90% of foreclosures are expected to convert into rentals1 Homeownership and Rental Rates2 Home Prices versus Rent3 (1) Source: The Post-Foreclosure Experience of U.S. Households, Federal Reserve Board, May 2011. (2) Source: U.S. Census Bureau. (3) Source: National Association of Realtors & U.S. Census Bureau.
22 Experienced Property Manager Silver Bay combines the residential property acquisition and management experience of Provident with the critical industry and analytical experience of Pine River. ― Provident got its start in the residential real estate markets in 2009, and established significant infrastructure to acquire, refurbish, lease and manage single family homes. ― Pine River is a global asset manager with over $7 billion in assets under management and institutional quality investment, risk management and compliance capabilities. Collectively, Silver Bay and Provident have assisted clients in acquiring nearly 1,300 properties in five states.2 Silver Bay manages properties through a combination of in-house property managers and, where efficient, contracts with local third party managers. ― Key markets: Arizona, Florida, Nevada, Georgia and California ― Silver Bay has regional offices in several cities with plans to expand into additional markets ― Property managers are on the ground in each region We believe that the efficiencies gained through Silver Bay’s internalized property management structure can drive alpha through a residential property portfolio. Our acquisition and property management will be overseen by Silver Bay Property Management LLC. Silver Bay is a joint venture between an affiliate of Pine River Capital Management L.P.1 and Provident Real Estate Advisors LLC. Silver Bay was formed with the mission of bringing institutional excellence in residential real property acquisition and management to an industry that has traditionally been highly fragmented and unsophisticated. (1) Two Harbors is externally managed by PRCM Advisers LLC, a wholly-owned subsidiary of Pine River Capital Management L.P. (2) Includes nearly 400 of the 450+ homes acquired to date by Two Harbors; figures for Provident are historical and represent its operations pre-Silver Bay.

Single Family Residential Real Properties Illustrative Return Profile 23 The information presented below represents illustrative returns for single family residential real properties, and does not represent an actual property owned by Two Harbors. Estimated yields and related costs represent the views of Two Harbors and its external manager, PRCM Advisers LLC, and are provided for illustration purposes only and does not represent Two Harbors’ actual or future performance. Additional considerations that may impact returns include occupancy rates, capital expenditures, scalability, various operational costs, rents, home price appreciation, inflation and leverage. You should not rely on this information as actual results may differ materially. Net Rental Yield Estimated Cost of Home, including Refurbishment $100,000 Estimated Annual Rental Income $12,000-14,000 Estimated Annual Operating Costs1 $6,000 Estimated Net Rental Yield 6-8% Estimated Annual Home Price Appreciation (HPA) to Recapture Discount Discount to Replacement Cost 30-45% Years to Recapture Discount 7 years Estimated Annual HPA to Recapture Discount 4-6% Illustrative Total Return Potential 10-14% (1) Estimated annual operating costs include maintenance, repairs, property management, vacancy, taxes, insurance, HOA dues and other associated operating costs.

24 William Roth − Also serves as Partner of Pine River Capital Management − 31 years in mortgage securities market, including at Salomon Brothers and Citi; Managing Director in proprietary trading group managing MBS and ABS portfolios Investment Team Brad Farrell − Most recently served as Two Harbors’ Controller from 2009 to 2011 − Previously Vice President and Executive Director of Financial Reporting at GMAC ResCap from 2007 to 2009 and held financial roles at XL Capital Ltd from 2002 to 2007. Began his career with KPMG. Steven Kuhn − Also serves as Partner of Pine River Capital Management − Goldman Sachs Portfolio Manager from 2002 to 2007; 20 years investing in and trading mortgage backed securities and other fixed income securities for firms including Citadel and Cargill Thomas Siering − Also serves as Partner of Pine River Capital Management − Previously head of Value Investment Group at EBF & Associates; Partner since 1997 − 31 years of investing and management experience; commenced career at Cargill where he was a founding member of the Financial Markets Department Executive Officers Over 30 Professionals − Substantial RMBS team consisting of traders, investment analysts and a robust internal research team − Leverages proprietary analytical systems − Specialized repo funding group Chief Financial Officer Chief Executive Officer Co-Chief Investment Officers Substantial RMBS Team Two Harbors Team with Deep Securities Experience Note: Employee data as of May 1, 2012.
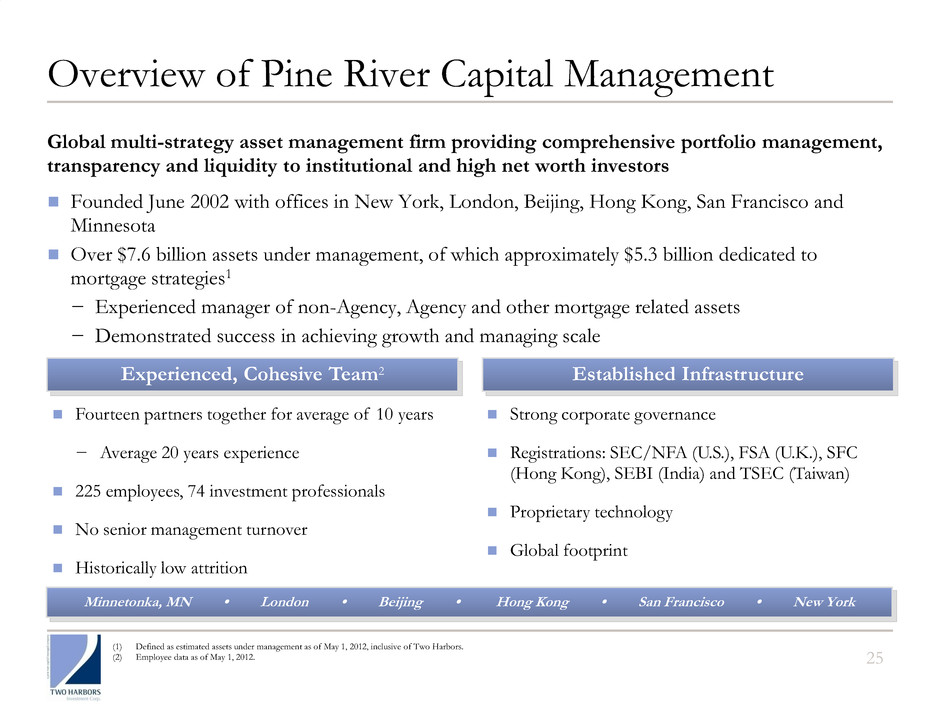
25 Overview of Pine River Capital Management Global multi-strategy asset management firm providing comprehensive portfolio management, transparency and liquidity to institutional and high net worth investors Founded June 2002 with offices in New York, London, Beijing, Hong Kong, San Francisco and Minnesota Over $7.6 billion assets under management, of which approximately $5.3 billion dedicated to mortgage strategies1 − Experienced manager of non-Agency, Agency and other mortgage related assets − Demonstrated success in achieving growth and managing scale Experienced, Cohesive Team2 Established Infrastructure Fourteen partners together for average of 10 years − Average 20 years experience 225 employees, 74 investment professionals No senior management turnover Historically low attrition Strong corporate governance Registrations: SEC/NFA (U.S.), FSA (U.K.), SFC (Hong Kong), SEBI (India) and TSEC (Taiwan) Proprietary technology Global footprint Minnetonka, MN • London • Beijing • Hong Kong • San Francisco • New York (1) Defined as estimated assets under management as of May 1, 2012, inclusive of Two Harbors. (2) Employee data as of May 1, 2012.
