Attached files
| file | filename |
|---|---|
| 8-K - ROCK-TENN COMPANY - Rock-Tenn CO | a50300364.htm |
Exhibit 99.1
J.P. Morgan Diversified Industrials Conference 2012 June 6, 2012
Statements in this presentation that do not relate strictly to historical facts are forward-looking statements within the meaning of the Private Securities Litigation Reform Act of 1995, including the slides entitled “3Q’12 Outlook” and “Key Financial Statistics – FY12 Outlook” that give guidance for future periods in 2012. Forward-looking statements are based on our current expectations, beliefs, plans or forecasts and use words in this presentation such as will, estimate, trending, or refer to future time periods. You should not place undue reliance on any forward-looking statements as such statements involve risks, uncertainties, assumptions and other factors that could cause actual results to differ materially, including the following: our ability to integrate Smurfit-Stone or to achieve benefits from the Smurfit-Stone Acquisition, including, without limitation, synergies and performance improvements; expected levels of depreciation, corporate expenses, interest expense, income tax rates, federal NOL utilization, Black Liquor and AMT tax credit utilization, pension contributions, capital expenditures, commodity costs, maintenance outages, containerboard inventory builds; the level of demand for our products; economic downtime; our ability to successfully identify and make performance improvements; anticipated returns on our capital investments; possible increases in energy, raw materials, shipping and capital equipment costs; any reduction in the supply of raw materials; fluctuations in selling prices and volumes; intense competition; the potential loss of certain customers; adverse changes in general market and industry conditions and other risks, uncertainties and factors discussed in Item 1A "Risk Factors" and under the caption "Business — Forward-Looking Information" in our 2011 Annual Report on Form 10-K and by similar disclosures in any of our subsequent SEC filings. The information contained herein speaks as of the date hereof and we do not have or undertake any obligation to update such information as future events unfold. 2 Cautionary Statement Regarding Forward-Looking Information
Use of Non-GAAP Financial Measures and Reconciliations We have included financial measures that are not prepared in accordance with accounting principles generally accepted in the United States ("GAAP"). The non-GAAP financial measures presented are not intended to be a substitute for GAAP financial measures, and any analysis of non-GAAP financial measures should be used only in conjunction with results presented in accordance with GAAP and the reconciliations of non-GAAP financial measures to GAAP financial measures included in the Appendix to this presentation. 3
Disclaimer We may from time to time be in possession of certain information regarding RockTenn that applicable law would not require us to disclose to the public in the ordinary course of business, but would require us to disclose if we were engaged in the purchase or sale of our securities. This presentation shall not be considered to be part of any solicitation of an offer to buy or sell RockTenn securities. This presentation also may not include all of the information regarding RockTenn that you may need to make an investment decision regarding RockTenn securities. Any such investment decision should be made on the basis of the overall mix of information regarding RockTenn that is publicly available as of the date of such decision. 4
RockTenn Overview On May 27, 2011, RockTenn closed on its acquisition of Smurfit-Stone A leader in North American packaging: The largest paper recycler in North America 2nd largest producer of containerboard and corrugated packaging 2nd largest producer of clay-coated recycled board and folding cartons Balanced fiber mix of 55% virgin and 45% recycled 2Q’12 Adjusted EPS of $0.97(1) Our outlook for 3Q’12 is for slightly higher adjusted earnings in the range of $1.00 per share as our higher maintenance outage costs and downtime will generally offset the improving export demand and pricing. Conservatively financed with a Leverage Ratio of 2.78x (1) at March 31, 2012 Liquidity of $1.0 billion at March 31, 2012 Leadership team with strong record of creating value and integrating acquisitions At the end of 2Q’12 we achieved a run rate of synergies and performance improvements in excess of $150 million; we continue to expect to achieve our target of $550 million in synergies and performance improvements 5 (1)See Use of Non-GAAP Financial Measures and Reconciliations in the Appendix.
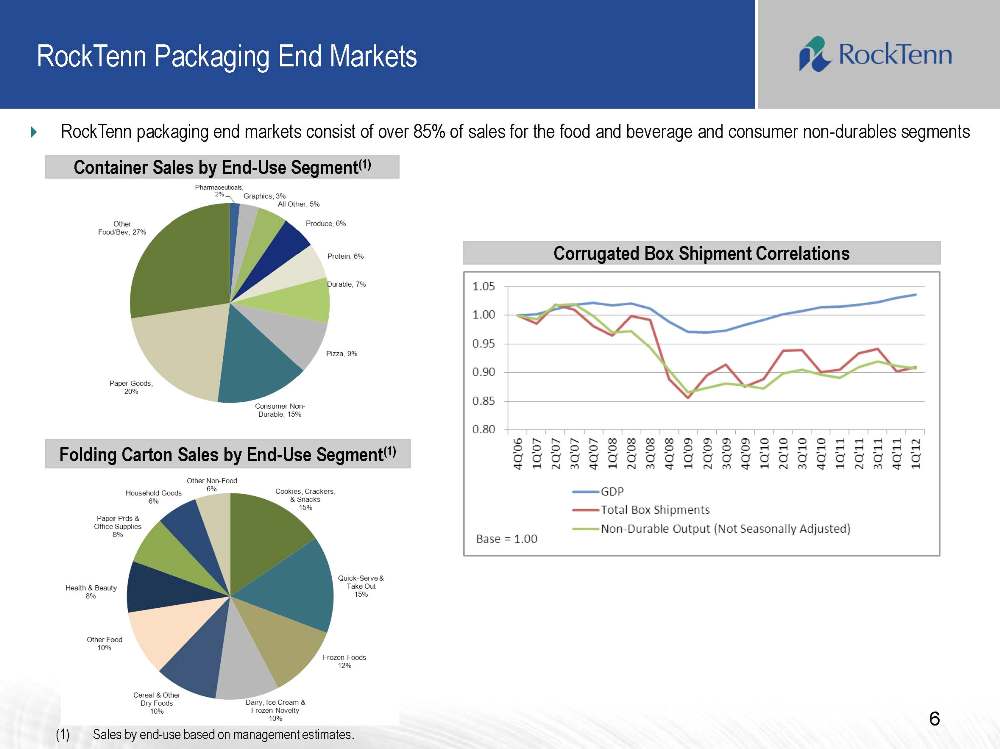
6 RockTenn packaging end markets consist of over 85% of sales for the food and beverage and consumer non-durables segments RockTenn Packaging End Markets Container Sales by End-Use Segment(1) Folding Carton Sales by End-Use Segment(1) (1)Sales by end-use based on management estimates. Corrugated Box Shipment Correlations
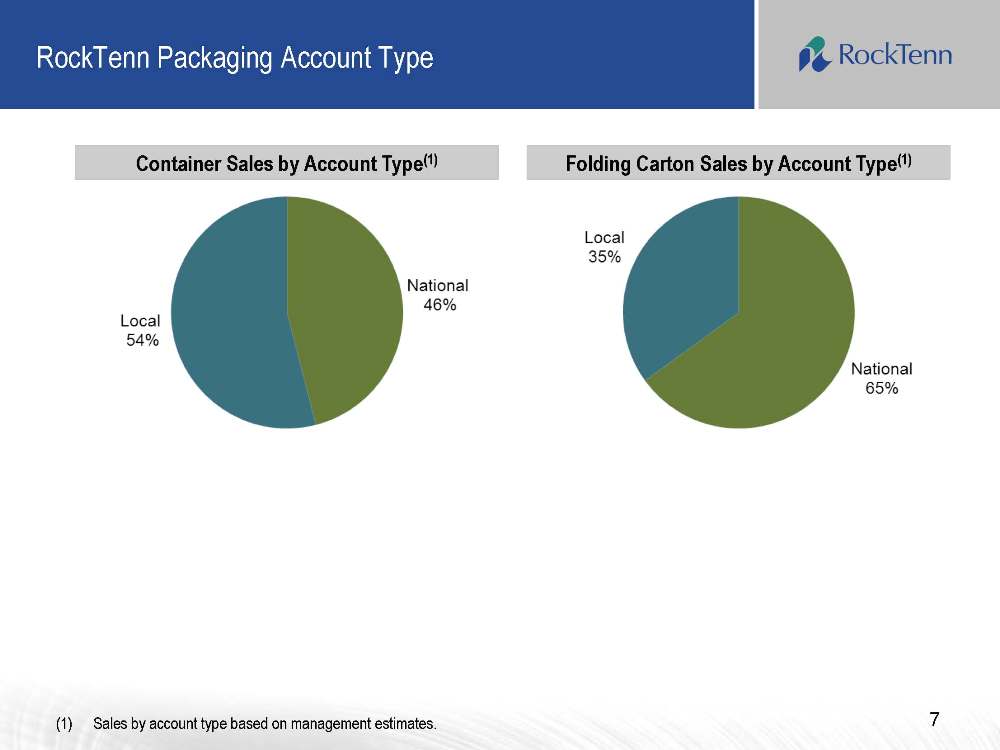
7 RockTenn Packaging Account Type Container Sales by Account Type(1) Folding Carton Sales by Account Type(1) (1)Sales by account type based on management estimates.
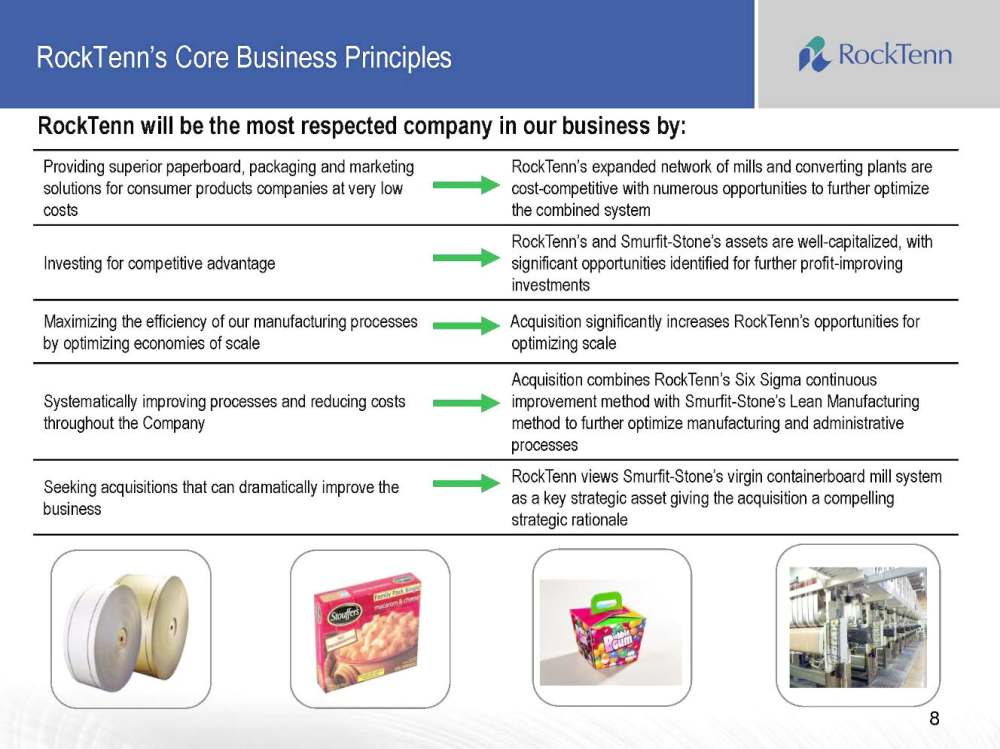
8 RockTenn’s Core Business Principles Providing superior paperboard, packaging and marketing solutions for consumer products companies at very low costs RockTenn’s expanded network of mills and converting plants are cost-competitive with numerous opportunities to further optimize the combined system Investing for competitive advantage RockTenn’s and Smurfit-Stone’s assets are well-capitalized, with significant opportunities identified for further profit-improving investments Maximizing the efficiency of our manufacturing processes by optimizing economies of scale Acquisition significantly increases RockTenn’s opportunities for optimizing scale Systematically improving processes and reducing costs throughout the Company Acquisition combines RockTenn’s Six Sigma continuous improvement method with Smurfit-Stone’s Lean Manufacturing method to further optimize manufacturing and administrative processes Seeking acquisitions that can dramatically improve the business RockTenn views Smurfit-Stone’s virgin containerboard mill system as a key strategic asset giving the acquisition a compelling strategic rationale RockTenn will be the most respected company in our business by:
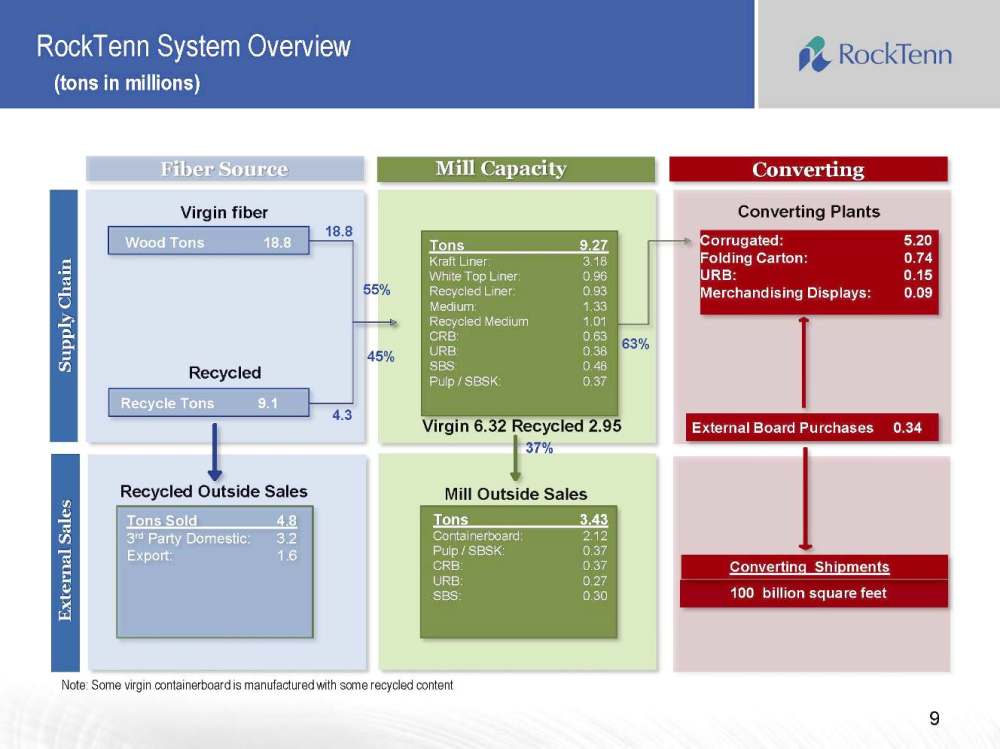
RockTenn System Overview (tons in millions) Mill Capacity Converting Supply Chain External Sales Virgin fiber Recycled Mill Outside Sales Virgin 6.32 Recycled 2.95 Converting Plants Corrugated: 5.20 Folding Carton: 0.74 URB: 0.15 Merchandising Displays: 0.09 External Board Purchases 0.34 18.8 4.3 Fiber Source Recycle Tons 9.1 Wood Tons 18.8 Tons 9.27 Kraft Liner: 3.18 White Top Liner: 0.96 Recycled Liner: 0.93 Medium: 1.33 Recycled Medium 1.01 CRB: 0.63 URB: 0.38 SBS: 0.48 Pulp / SBSK: 0.37 Tons 3.43 Containerboard: 2.12 Pulp / SBSK: 0.37 CRB: 0.37 URB: 0.27 SBS: 0.30 Tons Sold 4.8 3rd Party Domestic: 3.2 Export: 1.6 Recycled Outside Sales Converting Shipments 100 billion square feet Note: Some virgin containerboard is manufactured with some recycled content 63% 37% 9 55% 45%
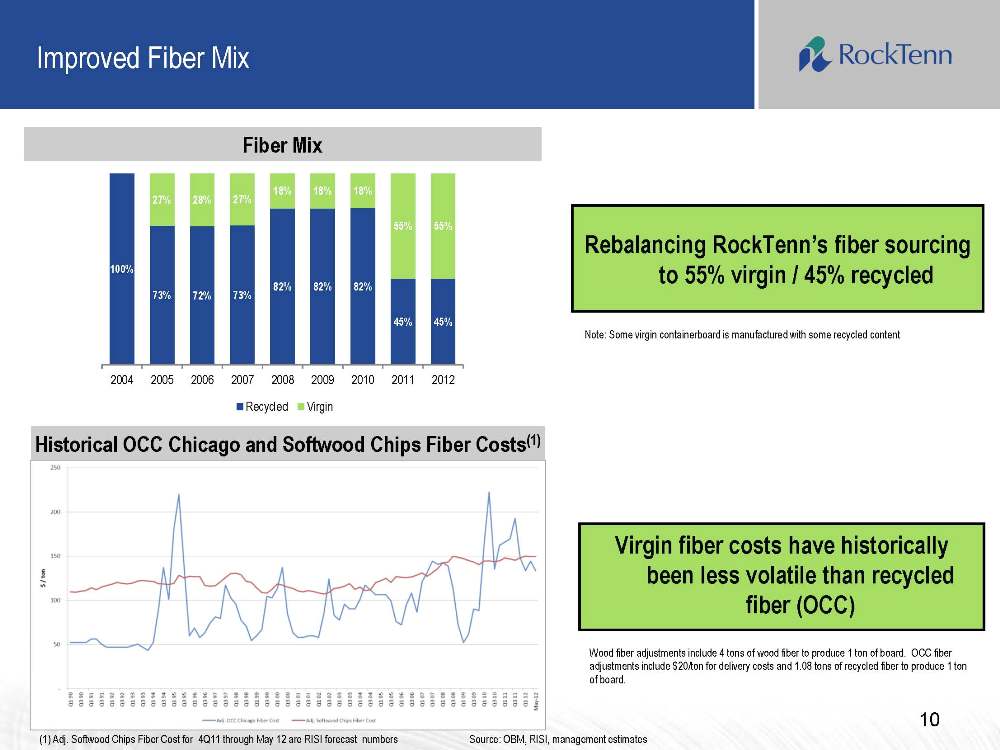
Improved Fiber Mix 10 Rebalancing RockTenn’s fiber sourcing to 55% virgin / 45% recycled Note: Some virgin containerboard is manufactured with some recycled content Source: OBM, RISI, management estimates Wood fiber adjustments include 4 tons of wood fiber to produce 1 ton of board. OCC fiber adjustments include $20/ton for delivery costs and 1.08 tons of recycled fiber to produce 1 ton of board. Fiber Mix Historical OCC Chicago and Softwood Chips Fiber Costs(1) Virgin fiber costs have historically been less volatile than recycled fiber (OCC) (1) Adj. Softwood Chips Fiber Cost for 4Q11 through May 12 are RISI forecast numbers 100% 73% 72% 73% 82% 82% 82% 45% 45% 27% 28% 27% 18% 18% 18% 55% 55% 2004 2005 2006 2007 2008 2009 2010 2011 2012 Recycled Virgin
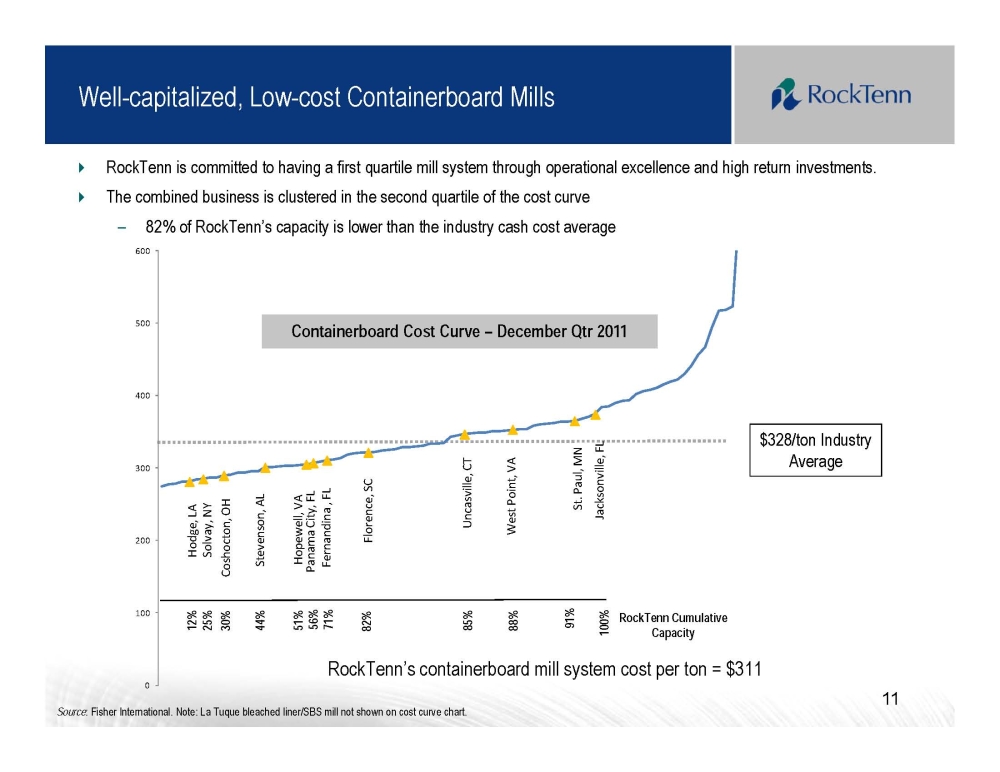
RockTenn is committed to having a first quartile mill system through operational excellence and high return investments. The combined business is clustered in the second quartile of the cost curve 82% of RockTenn’s capacity is lower than the industry cash cost average $328/ton Industry Average Source: December Qtr 2011 Fisher Data. Note: La Tuque bleached liner/SBS mill not shown on cost curve chart. Containerboard Cost Curve – December Qtr 2011
RockTenn’s containerboard mill system cost per ton = $311 11 RockTenn Cumulative Capacity 30% 25% 44% 100% 12% 82% 71% 56% 51% 91% 88% 85% Well-capitalized, Low-cost Containerboard Mills
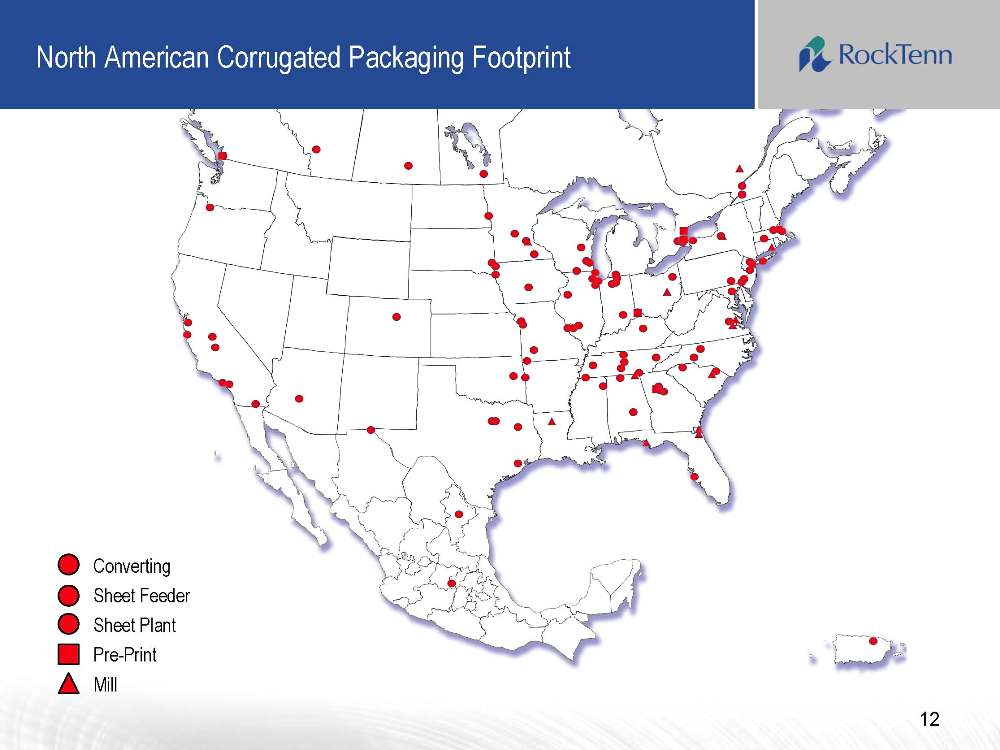
North American Corrugated Packaging Footprint Converting Sheet Feeder Sheet Plant Pre-Print Mill 12
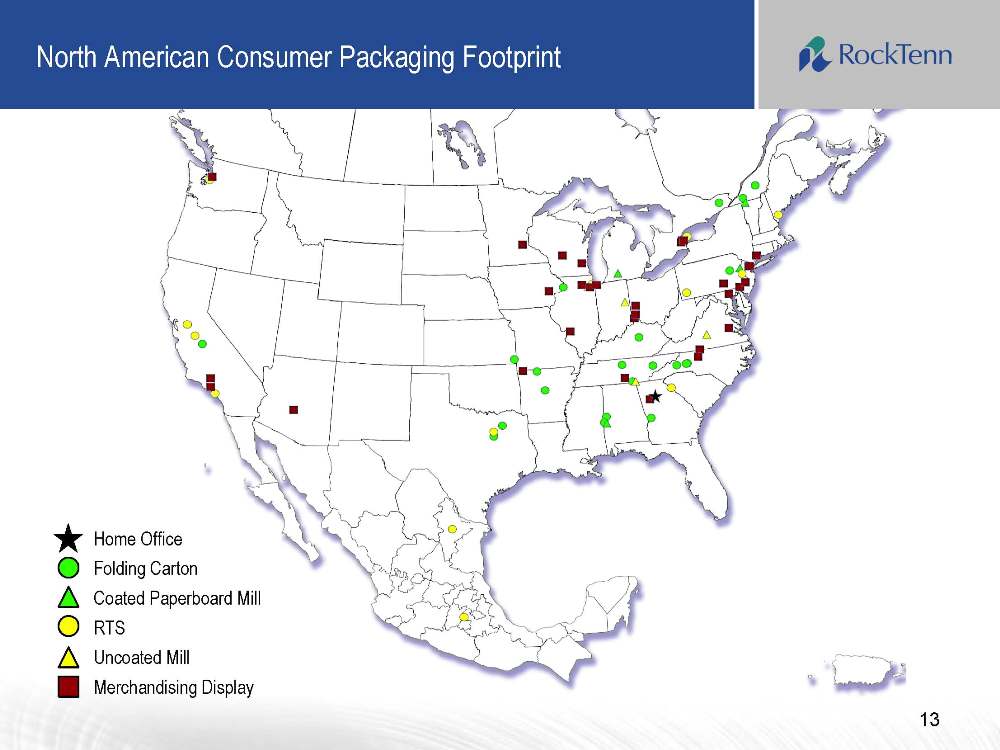
North American Consumer Packaging Footprint Home Office Folding Carton Coated Paperboard Mill RTS Uncoated Mill Merchandising Display 13
14 Integration Run rate of synergy and performance improvements in excess of $150 million Completed conversion of SAP to JD Edwards Completed first natural gas energy conversion at Stevenson mill; three additional conversions in late 2012 Closed the Matane recycled corrugated medium mill and announced closure of four additional box plants in fiscal 2012 To date, ten box plant closures have been announced
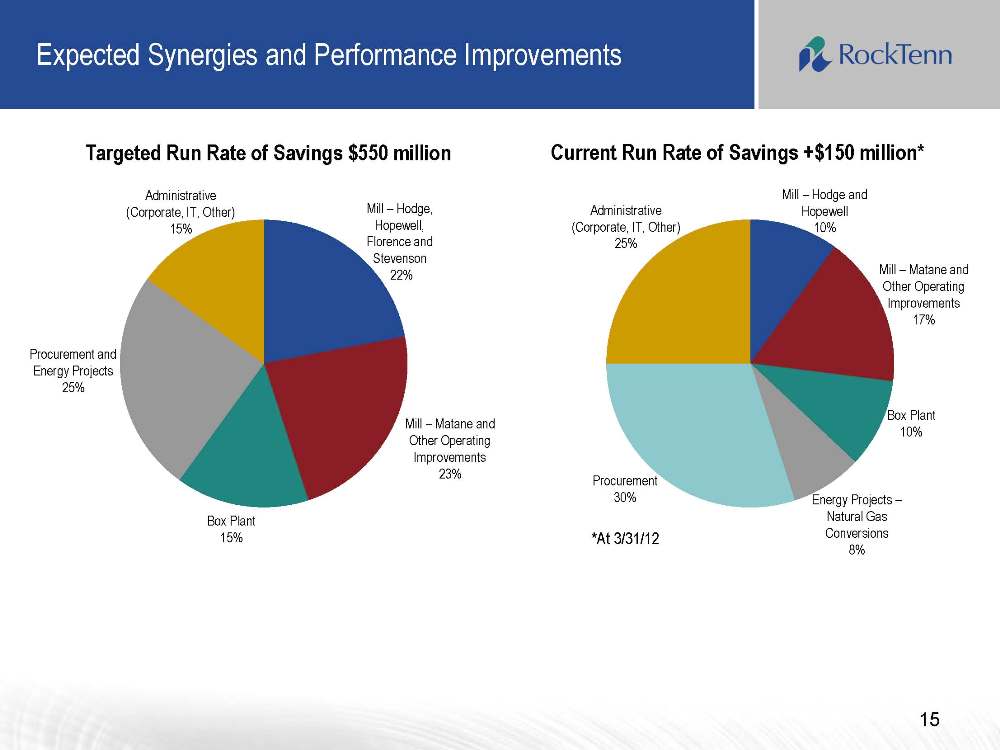
15 Expected Synergies and Performance Improvements Administrative (Corporate, IT, Other) 15% Mill – Hodge, Hopewell, Florence and Stevenson 22% Mill – Matane and Other Operating Improvements 23% Box Plant 15%
Procurement and Energy Projects 25% Box Plant 10% Administrative (Corporate, IT, Other) 25% Mill – Hodge and Hopewell 10% Mill – Matane and Other Operating Improvements 17% Energy Projects – Natural Gas Conversions
8% Procurement 30% *At 3/31/12 Targeted Run Rate of Savings $550 million Current Run Rate of Savings +$150 million*
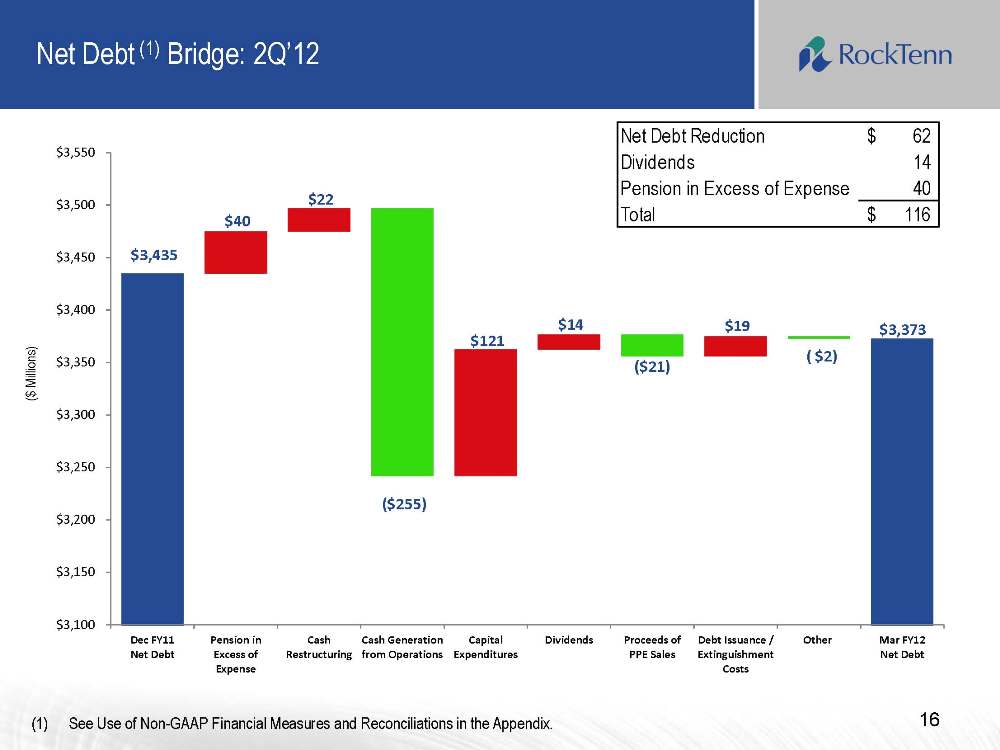
$3,435 $40 $22 ($255) $121 $14 ($21) $19 ( $2) $3,373 $3,100 $3,150 $3,200 $3,250 $3,300 $3,350 $3,400 $3,450 $3,500 $3,550 Dec FY11 Net Debt Pension in Excess of Expense Cash Restructuring Cash Generation from Operations Capital
Expenditures Dividends Proceeds of PPE Sales Debt Issuance / Extinguishment Costs Other Mar FY12 Net Debt Net Debt (1) Bridge: 2Q’12 16 (1)See Use of Non-GAAP Financial Measures and Reconciliations in the Appendix. ($ Millions)
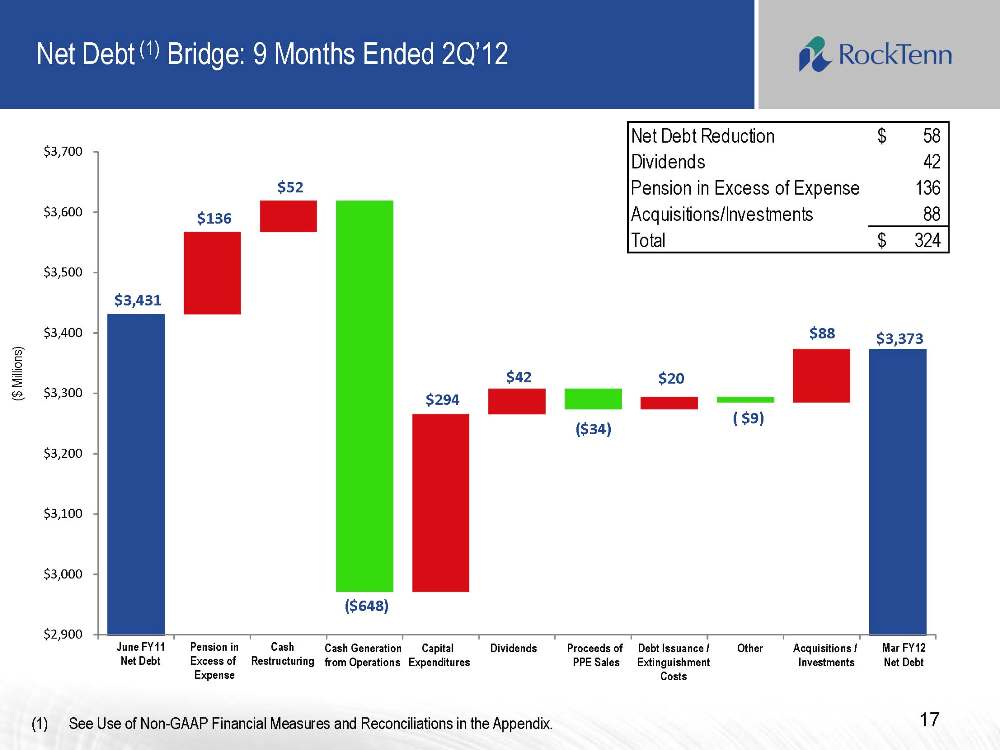
$3,431 $136 $52 ($648) $294 $42 ($34) $20 ( $9) $88 $3,373 $2,900 $3,000 $3,100 $3,200 $3,300 $3,400 $3,500 $3,600 $3,700 Net Debt (1) Bridge: 9 Months Ended 2Q’12 17 (1)See Use of Non-GAAP Financial Measures and Reconciliations in the Appendix. ($ Millions) June FY11 Net Debt Pension in Excess of Expense Cash Restructuring Cash Generation from Operations Capital Expenditures Dividends Proceeds of PPE Sales Debt Issuance / Extinguishment Costs
Other Acquisitions / Investments Mar FY12 Net Debt
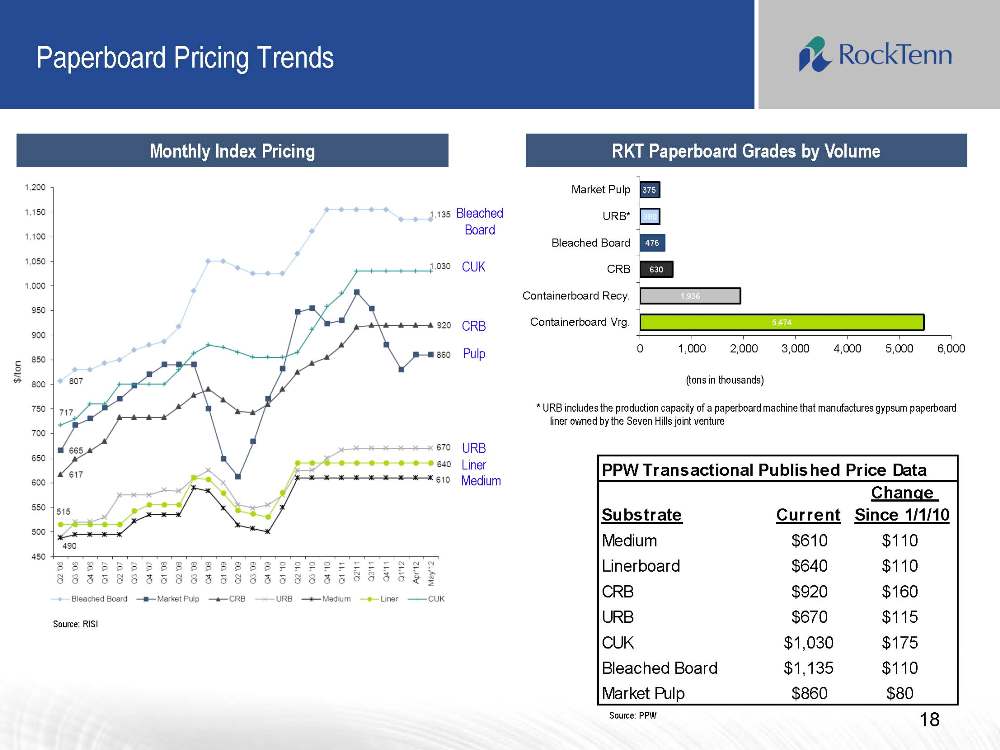
Liner Paperboard Pricing Trends Monthly Index Pricing Source: RISI Source: PPW RKT Paperboard Grades by Volume (tons in thousands) * URB includes the production capacity of a paperboard machine that manufactures gypsum paperboard liner owned by the Seven Hills joint venture Bleached Board CUK CRB Pulp URB Medium 18 5,474 1,936 630 476 380 375 0 1,000 2,000 3,000 4,000 5,000 6,000 Containerboard Vrg. Containerboard Recy. CRB Bleached Board URB* Market Pulp
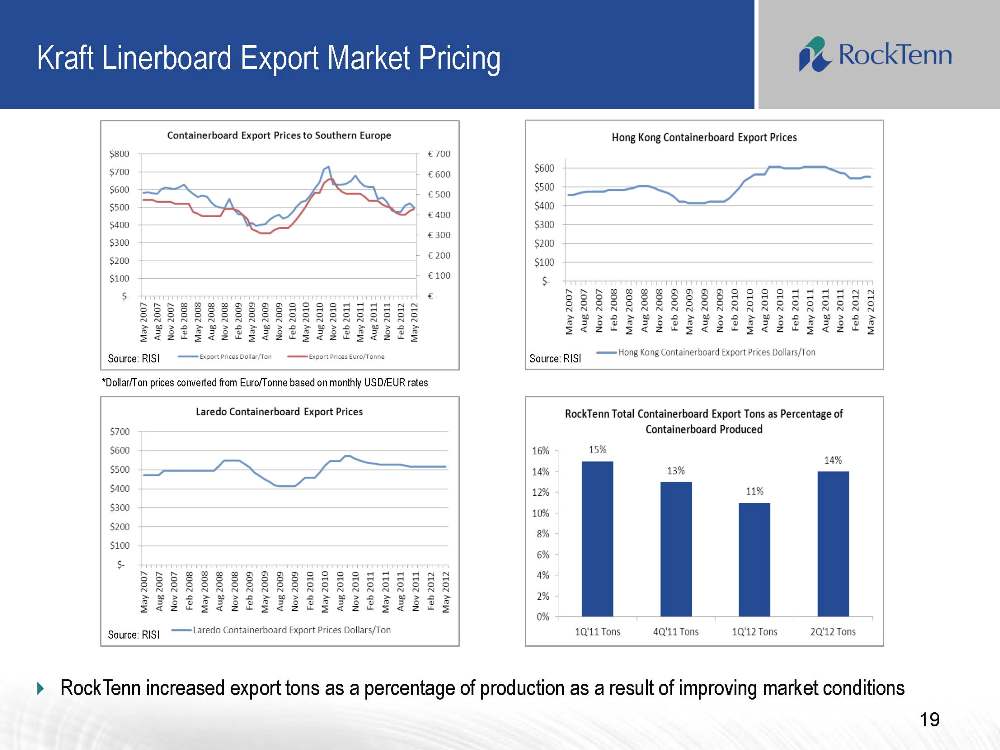
Kraft Linerboard Export Market Pricing Source: RISI RockTenn increased export tons as a percentage of production as a result of improving market conditions *Dollar/Ton prices converted from Euro/Tonne based on monthly USD/EUR rates 19 Source: RISI Source: RISI
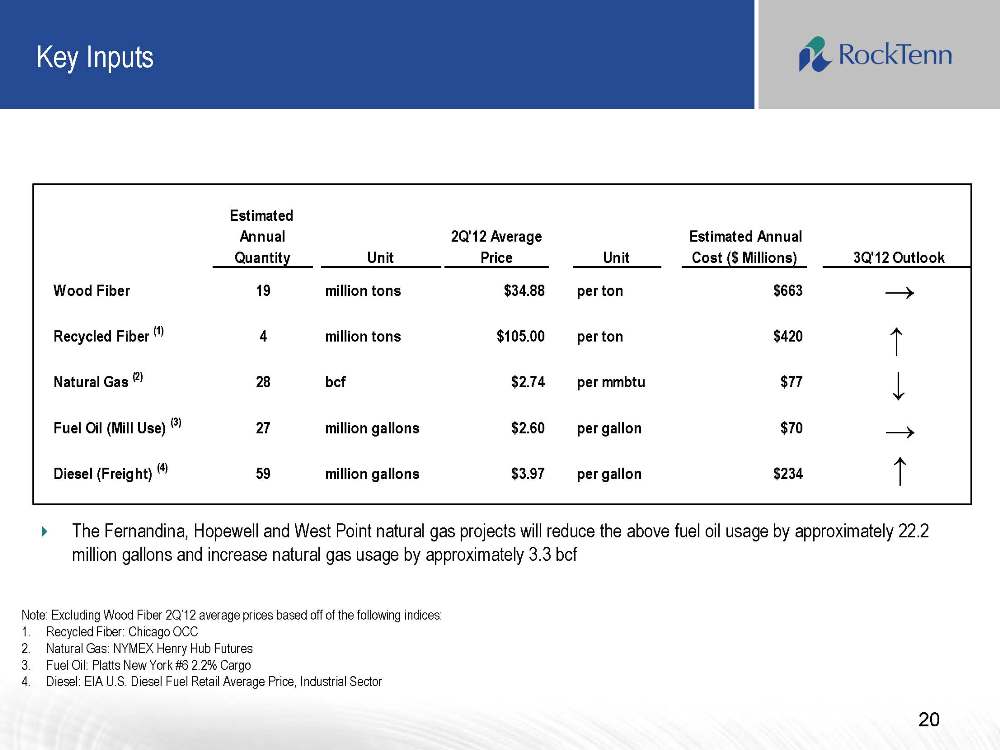
Key Inputs 20 Note: Excluding Wood Fiber 2Q’12 average prices based off of the following indices: 1.Recycled Fiber: Chicago OCC 2.Natural Gas: NYMEX Henry Hub Futures 3.Fuel Oil: Platts New York #6 2.2% Cargo 4.Diesel: EIA U.S. Diesel Fuel Retail Average Price, Industrial Sector The Fernandina, Hopewell and West Point natural gas projects will reduce the above fuel oil usage by approximately 22.2 million gallons and increase natural gas usage by approximately 3.3 bcf
Conclusion The largest paper recycler in North America 2nd largest producer of containerboard and corrugated packaging in North America 2nd largest producer of clay-coated recycled paperboard and folding cartons in North America Significant ownership of strategically valuable virgin containerboard mills; balanced fiber mix of 55% virgin and 45% recycled Significant, quantified opportunities to improve results through cost reduction and capital investment Leadership team with strong record of creating value and integrating acquisitions 21

Appendix 22
23 Use of Non-GAAP Financial Measures and Reconciliations Below, we define the non-GAAP financial measures, provide a reconciliation of each non-GAAP financial measure to the most directly comparable financial measure calculated in accordance with GAAP, and discuss the reasons that we believe this information is useful to management and may be useful to investors. These measures may differ from similarly captioned measures of other companies in our industry. Non-GAAP Measures Our definitions of Credit Agreement EBITDA and Segment EBITDA may differ from other similarly titled measures at other companies. Credit Agreement EBITDA (as defined) and Adjusted EBITDA (as defined) are not defined in accordance with GAAP and should not be viewed as alternatives to GAAP measures of operating results or liquidity. RockTenn management believes that net income is the most directly comparable GAAP measure to Credit Agreement EBITDA (as defined) and Segment Income is the most directly comparable GAAP measure to Segment EBITDA.
24 Non-GAAP Measures: Credit Agreement EBITDA, Segment EBITDA and Total Funded Debt (as defined) “Credit Agreement EBITDA” is calculated in accordance with the definition of “EBITDA” contained in the Company’s Credit Agreement. Credit Agreement EBITDA is generally defined as Consolidated Net Income, on a pro forma basis giving effect to the Smurfit-Stone Acquisition, plus: consolidated interest expense; consolidated tax expenses; depreciation and amortization expenses; charges and expenses for financing fees and expenses and write-offs of deferred financing fees and expenses, remaining portions of OID on prepayment of indebtedness, premiums due in respect of prepayment of indebtedness, and commitment fees in respect of financing commitments; various charges and expenses related to, or incurred in connection with, the Smurfit-Stone acquisition; costs and expenses relating to the integration of Smurfit-Stone and the achievement of synergies relating to the Smurfit-Stone acquisition; certain run-rate synergies expected to be achieved due to the Smurfit-Stone acquisition; all non-cash charges; all cash charges and expenses for plant and other facility closures and other cash restructuring charges; labor disruption charges; officer payments associated with any permitted acquisitions; “black liquor” expenses; cash charges and expenses incurred in respect of the Chapter 11 bankruptcy proceeding and plan of reorganization of Smurfit-Stone; and all non-recurring cash expenses taken in respect of any multi-employer and defined benefit pension plan obligations that are related to plant and other facilities closures. For additional information on the calculation see our Credit Agreement, dated as of May 27, 2011, filed as Exhibit 10.1 to our Form 8-K, dated May 27, 2011.
“Segment EBITDA” is calculated as Segment Income plus segment depreciation and amortization. Segment EBITDA Margin is Segment EBITDA divided by segment sales. “Total Funded Debt” is calculated in accordance with the definition of “Total Funded Debt” contained in the Company’s Credit Agreement. Total Funded Debt is generally defined as aggregate debt obligations reflected in our balance sheet, less the hedge adjustments resulting from terminated and existing fair value interest rate derivatives or swaps, plus additional outstanding letters of credit not already reflected in debt, plus debt guarantees.
25 Non-GAAP Measures: Credit Agreement EBITDA, Segment EBITDA and Total Funded Debt Our management uses Credit Agreement EBITDA and Total Funded Debt to evaluate compliance with RockTenn’s debt covenants and borrowing capacity available under its Credit Agreement. Management also uses Credit Agreement EBITDA and Segment EBITDA as measures of our Company’s core operating performance. Management believes that investors also use these measures to evaluate the Company’s compliance with its debt covenants and available borrowing capacity. Management also believes that investors use Credit Agreement EBITDA and Segment EBITDA as measures of our Company’s core operating performance. Borrowing capacity is dependent upon, in addition to other measures, the “Total Funded Debt/EBITDA ratio” or the “Leverage Ratio,” which is defined as Total Funded Debt divided by Credit Agreement EBITDA.
26 Non-GAAP Measures: Net Debt We have defined the non-GAAP measure Net Debt to include the aggregate debt obligations reflected in our balance sheet, less the hedge adjustments resulting from terminated and existing fair value interest rate derivatives or swaps, the balance of our cash and cash equivalents, restricted cash (which includes the balance sheet line items restricted cash and restricted cash and marketable debt securities) and certain other investments that we consider to be readily available to satisfy such debt obligations. Our management uses Net Debt, along with other factors, to evaluate our financial condition. We believe that Net Debt is an appropriate supplemental measure of financial condition and may be useful to investors because it provides a more complete understanding of our financial condition before the impact of our decisions regarding the appropriate use of cash and liquid investments.
27 Non-GAAP Measures: Adjusted Net Income and Adjusted Earnings Per Diluted Share We also use the non-GAAP measures “adjusted net income” and “adjusted earnings per diluted share”. Management believes these non-GAAP financial measures provide our board of directors, investors, potential investors, securities analysts and others with useful information to evaluate the performance of the Company because it excludes restructuring and other costs, net, the alternative fuel mixture credit and cellulosic biofuel producer credit and other specific items that management believes are not indicative of the ongoing operating results of the business. The Company and the board of directors use this information to evaluate the Company’s performance relative to other periods.
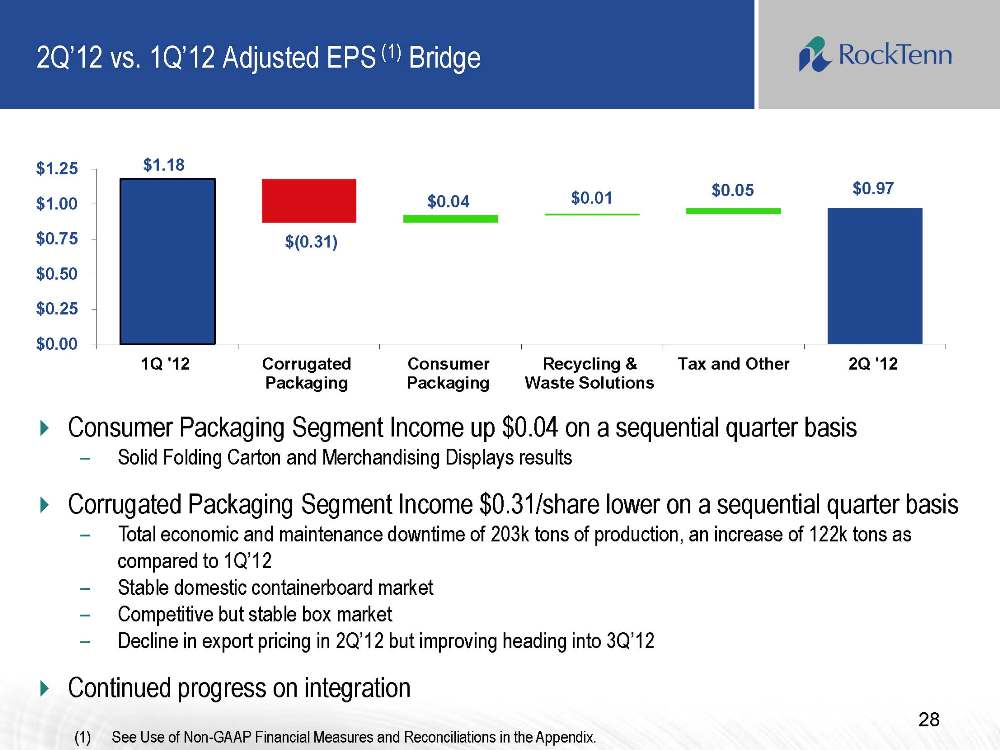
2Q’12 vs. 1Q’12 Adjusted EPS (1) Bridge 28 (1)See Use of Non-GAAP Financial Measures and Reconciliations in the Appendix. $1.18 $0.97 $0.04 $(0.31) $0.01 $0.05 $0.00 $0.25 $0.50 $0.75 $1.00 $1.25 1Q '12 Corrugated
Packaging Consumer Packaging Recycling & Waste Solutions Tax and Other 2Q '12 Consumer Packaging Segment Income up $0.04 on a sequential quarter basis Solid Folding Carton and Merchandising Displays results
Corrugated Packaging Segment Income $0.31/share lower on a sequential quarter basis Total economic and maintenance downtime of 203k tons of production, an increase of 122k tons as compared to 1Q’12 Stable domestic containerboard market Competitive but stable box market Decline in export pricing in 2Q’12 but improving heading into 3Q’12 Continued progress on integration
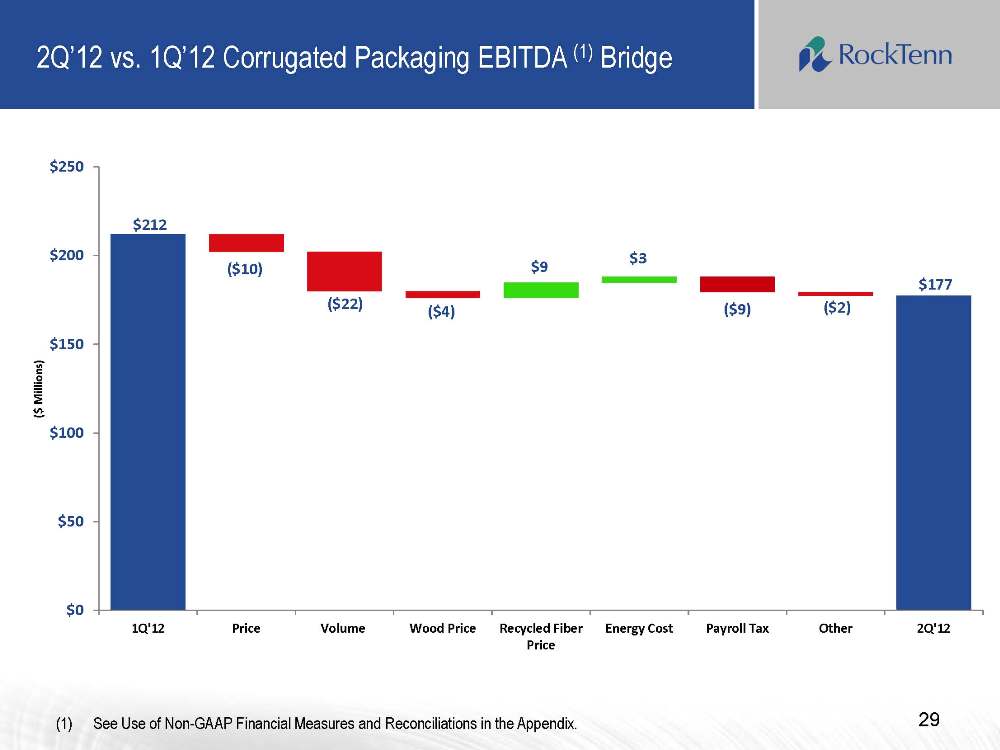
2Q’12 vs. 1Q’12 Corrugated Packaging EBITDA (1) Bridge 29 (1) See Use of Non-GAAP Financial Measures and Reconciliations in the Appendix. $212 ($10) ($22) ($4) $9 $3 ($9) ($2) $177 $0 $50 $100 $150 $200 $250 1Q'12 Price
Volume Wood Price Recycled Fiber Price Energy Cost Payroll Tax Other 2Q'12 ($ Millions)
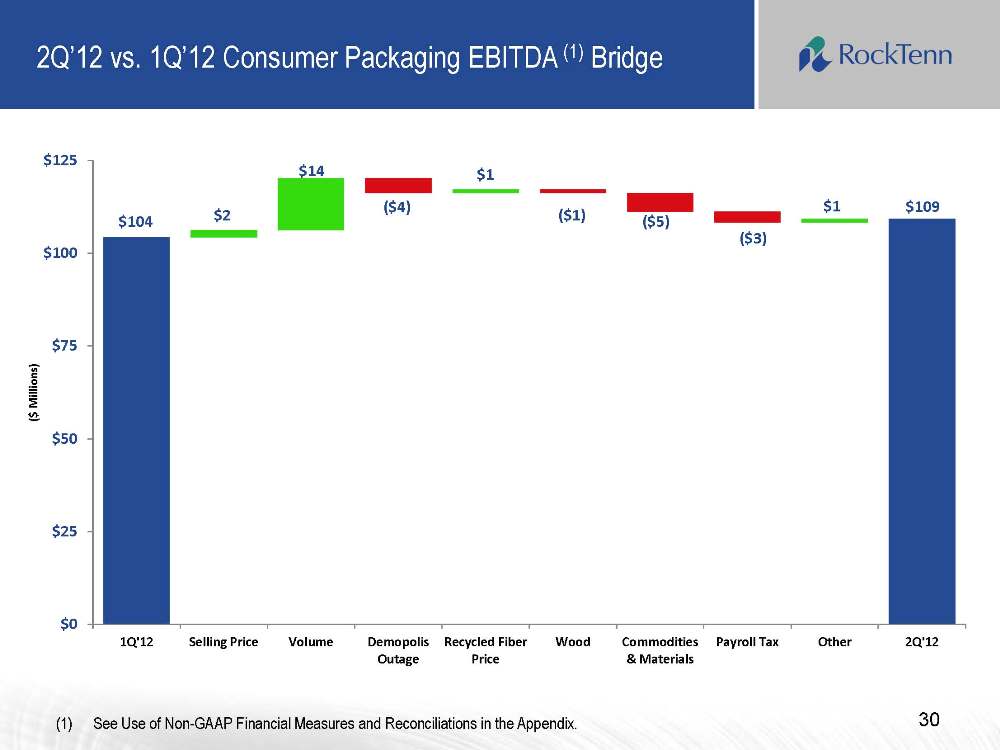
2Q’12 vs. 1Q’12 Consumer Packaging EBITDA (1) Bridge 30 (1) See Use of Non-GAAP Financial Measures and Reconciliations in the Appendix. $104 $2 $14 ($4) $1 ($1) ($5) $1 $109 ($3) $0 $25 $50 $75 $100 $125 1Q'12
Selling Price Volume Demopolis Outage Recycled Fiber Price Wood Commodities & Materials Payroll Tax Other 2Q'12 ($ Millions)
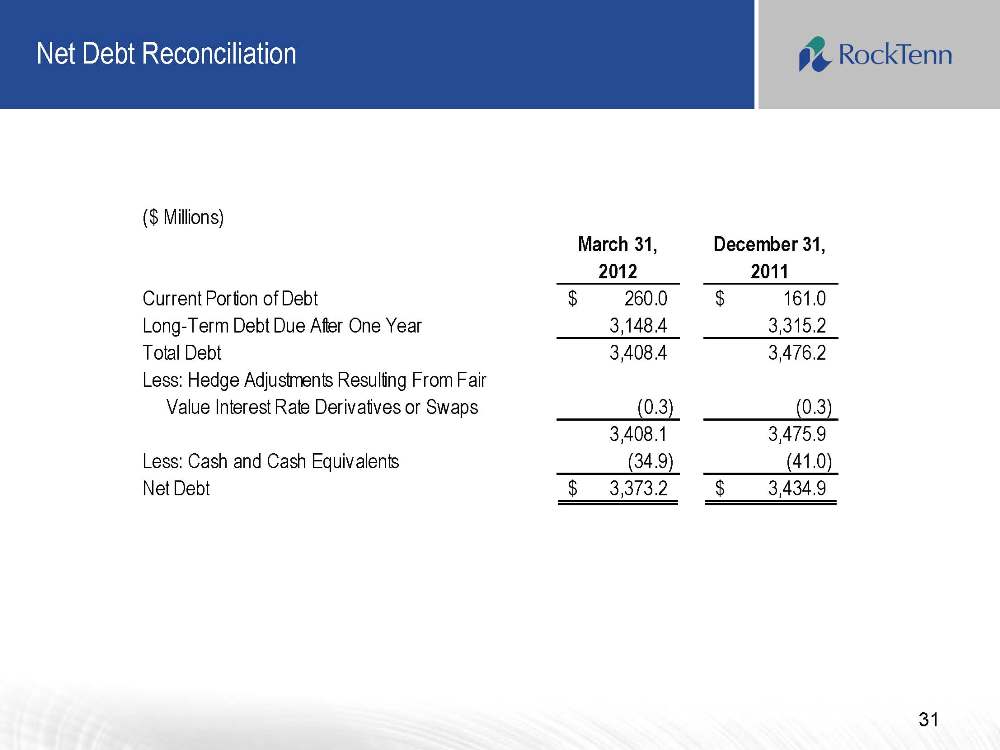
Net Debt Reconciliation 31
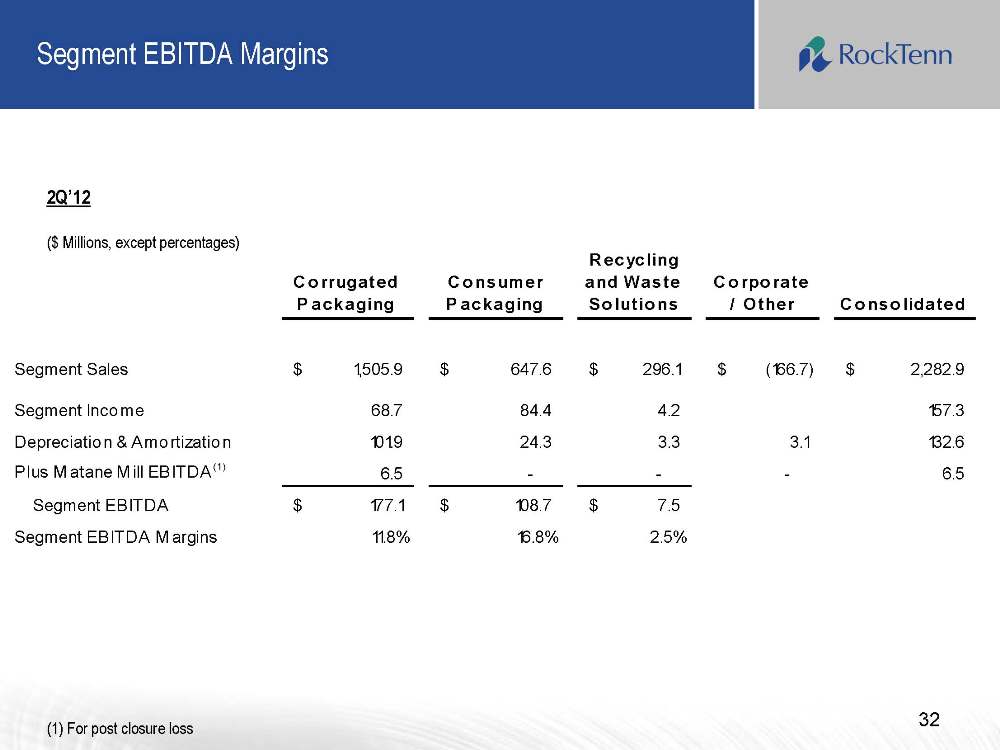
Segment EBITDA Margins 32 (1) For post closure loss 2Q’12 ($ Millions, except percentages)
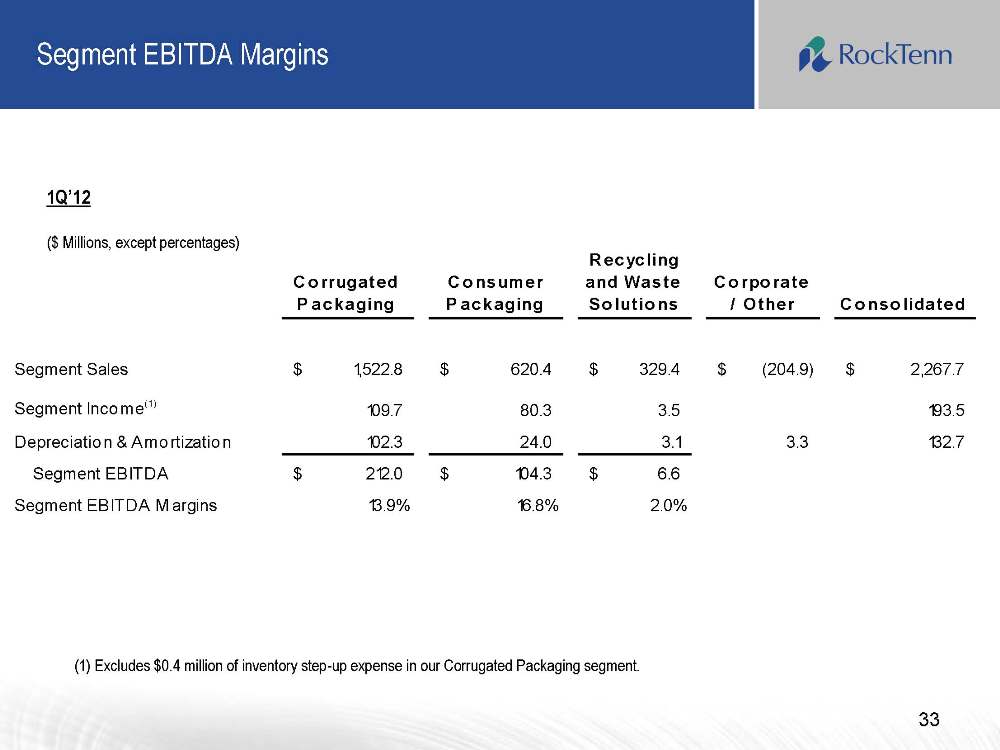
Segment EBITDA Margins 33 (1) Excludes $0.4 million of inventory step-up expense in our Corrugated Packaging segment. 1Q’12 ($ Millions, except percentages)
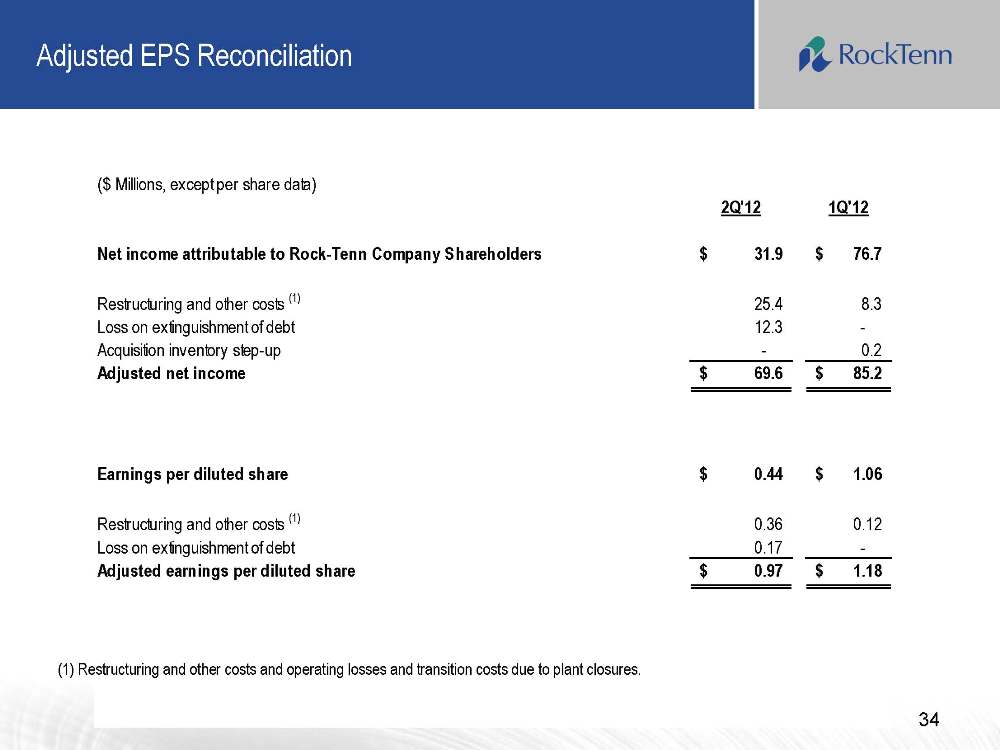
Adjusted EPS Reconciliation 34 (1) Restructuring and other costs and operating losses and transition costs due to plant closures.
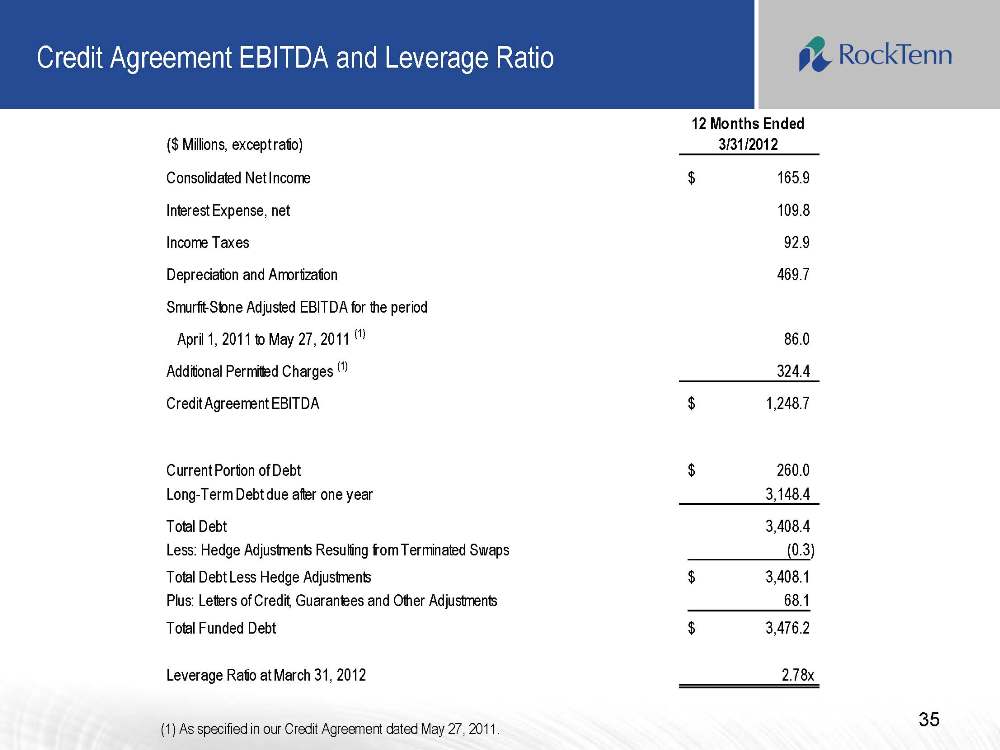
Credit Agreement EBITDA and Leverage Ratio 35 (1) As specified in our Credit Agreement dated May 27, 2011.
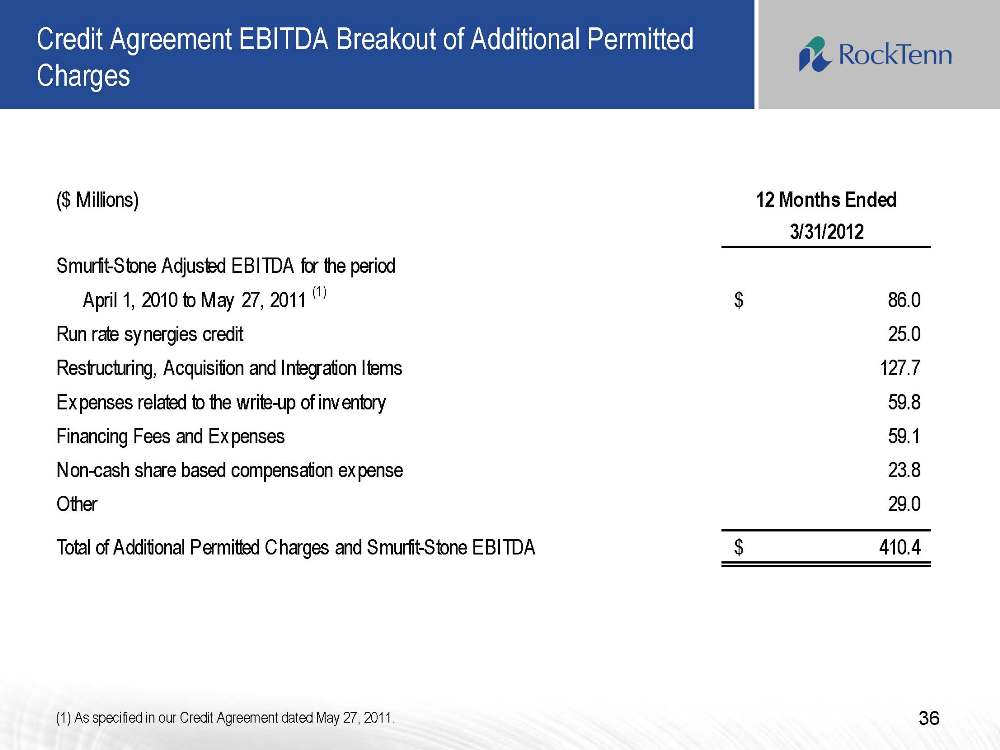
Credit Agreement EBITDA Breakout of Additional Permitted Charges 36 (1) As specified in our Credit Agreement dated May 27, 2011.
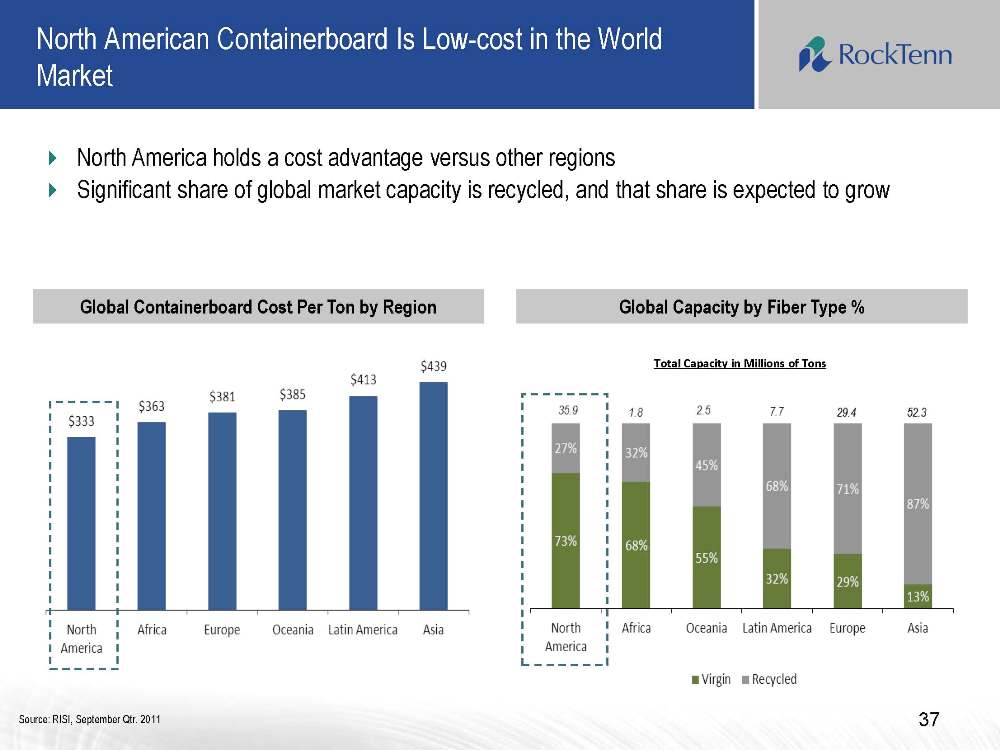
37 North American Containerboard Is Low-cost in the World Market North America holds a cost advantage versus other regions Significant share of global market capacity is recycled, and that share is expected to grow
Global Capacity by Fiber Type % Global Containerboard Cost Per Ton by Region Source: RISI, September Qtr. 2011 Total Capacity in Millions of Tons
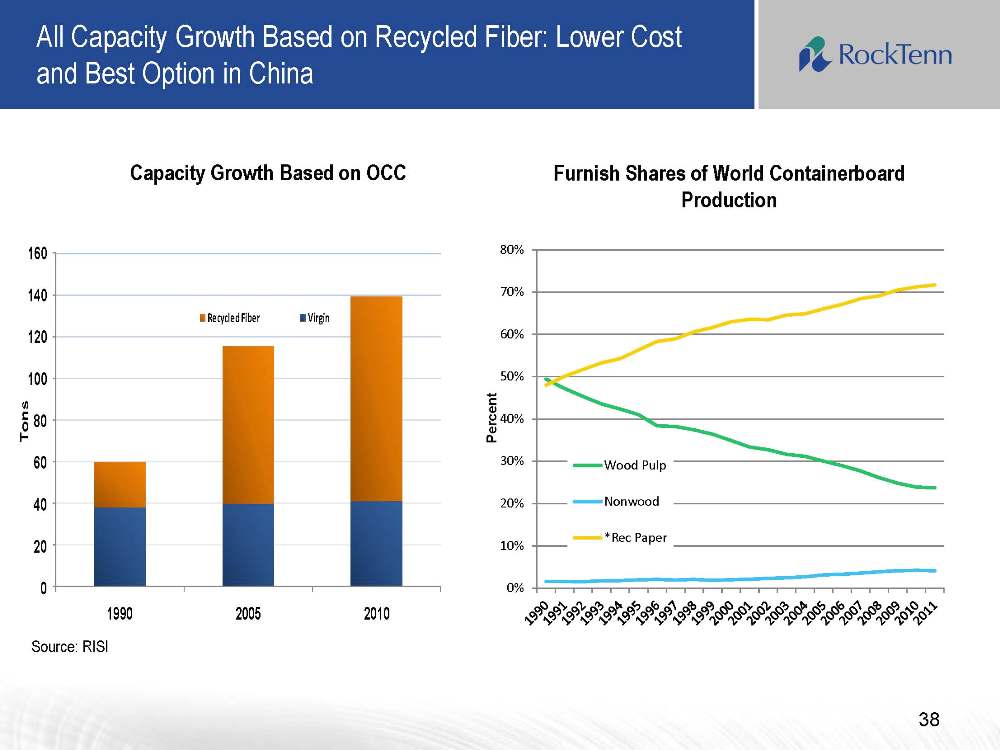
All Capacity Growth Based on Recycled Fiber: Lower Cost and Best Option in China Capacity Growth Based on OCC Furnish Shares of World Containerboard Production Source: RISI Percent 38 0% 10% 20% 30% 40% 50% 60%
70% 80% Wood Pulp Nonwood *Rec Paper
39 3Q’12 Outlook Demand stable Container and box demand continue to be stable SBS and CRB backlogs strengthen Scheduled major maintenance downtime 3Q’12: 142k tons; 4Q’12: none Lower total economic downtime
Drawdown of inventory build to meet maintenance outage needs Moderately improving export markets Higher pulp selling prices; lower SBS selling prices Higher recycled fiber costs Wood costs flat to slightly down with seasonal weather related improvement
Key Financial Statistics – FY12 Outlook ($ Millions) 40