Attached files
| file | filename |
|---|---|
| 8-K - FORM 8-K - Cornerstone Building Brands, Inc. | d363162d8k.htm |
 75
92
113
151
159
184
180
130
157
172
26.1%
25.1%
24.8%
24.1%
24.0%
25.6%
25.7%
23.3%
24.0%
25.0%
0
050
100
150
200
250
$300
03
04
05
06
07
08
09
10
11
LTM
3/31
0%
5%
10%
15%
20%
25%
30%
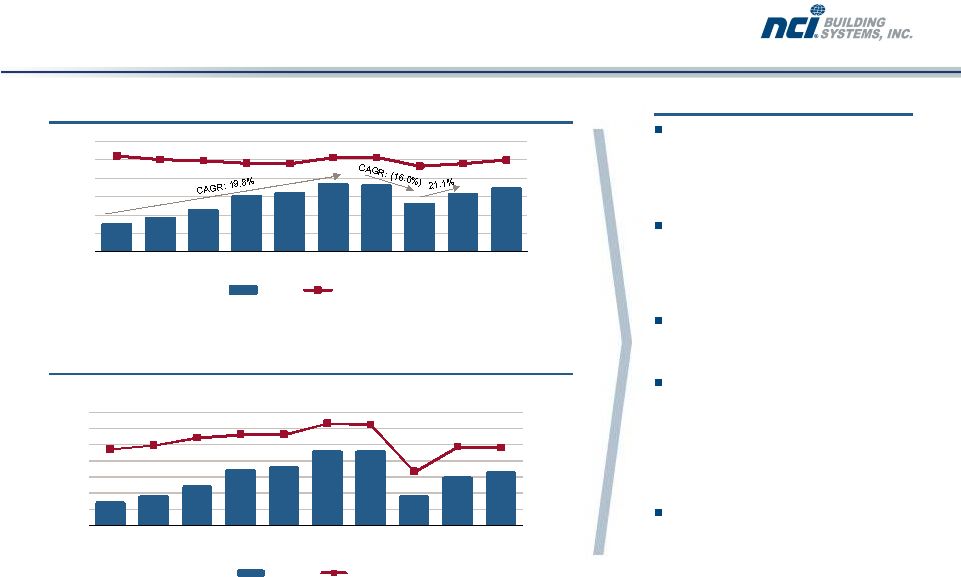
Sales
Contribution margin
Metl-Span's philosophy to be a high-
quality customer focused producer
has achieved excellent financial
results
Sales and EBITDA have grown at
9.8% and 10.0% CAGRs
respectively from FY 2003 to FY
2011
Remained profitable throughout the
economic downturn
Tight focus on project selection and
plant management has delivered
consistent contribution margins of
23–26% over the past 9 years,
including during the economic
downturn
EBITDA margins hurt in FY 2010 on
the back of lower volumes
7
9
12
17
18
23
23
9
15
17
9.5%
10.0%
10.9%
11.3%
11.3%
12.7%
12.5%
6.7%
9.8%
9.7%
0%
2%
4%
6%
8%
10%
12%
14%
0
5
10
15
20
25
30
$35
03
04
05
06
07
08
09
10
11
LTM
3/31
EBITDA
EBITDA margin
Note:
2003 –
2009 unaudited. 2010 –
2011 audited. Non-GAAP EBITDA reconciliation provided in the Appendix.
Source:
Metl-Span management accounts.
($ in millions)
($ in millions)
Demonstrated strong performance record
Exhibit 99.1
FYE June 30
Sales and contribution margin
EBITDA and EBITDA margin
Notes |
 Metl-Span historical financial overview
Note:
2007
–
2009
and
LTM
3/31/2012
unaudited.
2010
–
2011
audited.
Source:
Metl-Span management accounts.
(1)
Increase from 2008 relates to amortization on acquisition intangibles.
Historical figures
FYE June 30
2007
2008
2009
2010
2011
LTM 3/31/12
Revenue
$158.6
$183.9
$179.9
$129.9
$157.2
$171.5
% growth
5.2%
16.0%
(2.2%)
(27.8%)
21.1%
15.3%
Contribution margin
$38.0
$47.1
$46.1
$30.3
$37.7
$42.8
% of revenue
24.0%
25.6%
25.7%
23.3%
24.0%
25.0%
EBITDA
$18.0
$23.3
$22.5
$8.7
$15.4
$16.6
% margin
11.3%
12.7%
12.5%
6.7%
9.8%
9.7%
Less: Depreciation
$3.7
$4.0
$4.4
$4.4
$4.4
$4.5
EBITA
$14.3
$19.3
$18.1
$4.3
$11.0
$12.1
% margin
9.0%
10.5%
10.0%
3.3%
7.0%
7.1%
Less: Amortization
(1)
$0.2
$4.3
$3.5
$3.5
$3.4
$3.4
EBIT
$14.1
$15.0
$14.5
$0.8
$7.5
$8.7
% margin
8.9%
8.2%
8.1%
0.6%
4.8%
5.1%
Capital expenditures
$2.7
$14.8
$5.0
$3.6
$1.8
$3.4
% of sales
1.7%
8.0%
2.8%
2.8%
1.1%
2.0%
($ in millions) |
 Metl-Span EBITDA reconciliation
2007
2008
2009
2010
2011
LTM 3/31/12
Net income
$14.4
$16.7
$14.5
$0.5
$5.6
$6.5
Interest expense / (income)
(0.2)
(0.5)
0.0
–
(1.3)
(1.1)
Taxes
–
2.9
–
0.3
3.2
3.2
Depreciation
3.7
4.0
4.4
4.5
4.4
4.5
Amortization
0.2
0.2
3.5
3.4
3.4
3.4
EBITDA
$18.0
$23.3
$22.5
$8.7
$15.4
$16.6
($ in millions) |