Attached files
| file | filename |
|---|---|
| 8-K - FORM 8-K - HUDSON VALLEY HOLDING CORP | d363457d8k.htm |
| EX-99.2 - EX-99.2 - HUDSON VALLEY HOLDING CORP | d363457dex992.htm |
Exhibit 99.1

| Ticker: HVB www.hudsonvalleybank.com June 2012 |
| Safe Harbor Statement "Safe Harbor" Statement under the Private Securities Litigation Reform Act of 1995: This presentation contains various forward-looking statements with respect to earnings, credit quality and other financial and business matters within the meaning of the Private Securities Litigation Reform Act of 1995. These forward-statements can be identified by words such as "expects," "anticipates," "intends," "believes," "estimates," "predicts" and words of similar import. The Company cautions that these forward-looking statements are subject to numerous assumptions, risks and uncertainties, and that statements relating to future periods are subject to uncertainty because of the increased likelihood of changes in underlying factors and assumptions. Actual results could differ materially from forward-looking statements. Factors that may cause actual results to differ materially from those contemplated by such forward-looking statements, include, but are not limited to, statements regarding: (a) the Office of the Comptroller of the Currency (the "OCC") and other bank regulators may require us to further modify or change our mix of assets, including our concentration in certain types of loans, or require us to take further remedial actions as a result of our most recent regulatory examination; (b) the results of the investigation of A.R. Schmeidler & Co., Inc. by the Securities and Exchange Commission (the "SEC") and the possibility that our management's attention will be diverted to the SEC investigation and we will incur costs and further legal expenses; (c) the Company's intent and ability to pay quarterly cash dividends to stockholders in light of our earnings, the current and future economic environment, our capital plan requirements and Federal Reserve Board guidance; (d) regulatory limitations on dividends payable to the Company by Hudson Valley Bank under our OCC approved capital plan and by law; (e) the possibility that we may need to raise additional capital in the future and our ability to raise such capital on terms that are favorable to us; (f) unexpected increases in our non-performing loans and allowance for loan losses; (g) ineffectiveness in managing our commercial real estate portfolio; (h) lower than expected future performance of our investment portfolio; (i) a lack of opportunities for growth, plans for expansion (including opening new branches) and increased or unexpected competition in attracting and retaining customers; (j) continued poor economic conditions generally and in our market area in particular, which may adversely affect the ability of borrowers to repay their loans and the value of real property or other property held as collateral for such loans; (k) lower than expected demand for our products and services; (l) possible impairment of our goodwill and other intangible assets; (m) our inability to manage interest rate risk; (n) increased expense and burdens resulting from the regulatory environment in which we operate and our ability to comply with existing and future regulatory requirements; (o) our inability to maintain regulatory capital above the levels required by the OCC for Hudson Valley Bank and the levels required for us to be "well-capitalized", or such higher capital levels as may be required; (p) proposed legislative and regulatory action may adversely affect us and the financial services industry; (q) legislative and regulatory actions (including the impact of the Dodd-Frank Wall Street Reform and Consumer Protection Act and related regulations) may subject us to additional regulatory oversight which may result in increased compliance costs and/or require us to change our business model; (r) future increased Federal Deposit Insurance Corporation, or FDIC, special assessments or changes to regular assessments; (s) potential liabilities under federal and state environmental laws; and (u) the costs and effects of technological changes and initiatives, including our inability to effectively complete our core processing conversion. For a more detailed discussion of these factors, see the Risk Factors discussion in the Company's most recent Annual Report on Form 10-K, and subsequent Quarterly Reports on Form 10-Q. The forward-looking statements included in this presentation are made only as of the date hereof and the Company undertakes no obligation to update or revise any of its forward-looking statements. |
| NOT A TRADITIONAL RETAIL COMMUNITY BANK A "Community Business Bank" founded to focus on middle market commercial customers and their principals Focus on targeted niche businesses, entrepreneurs and professional service firms with high deposit transaction volume throughout the Metro New York area Low-cost, core deposits = foundation of customer relationships Strong commitment to relationship banking, not transactional-based banking WE LEND WHERE WE LIVE Providing prudent, well-collateralized loans in our home market Stable and deep management team has extensive in-market experience and is highly accessible to customers Differentiated Business Model |
| Adopting Best Practices BANK-WIDE FOCUS ON IMPLEMENTING INDUSTRY BEST PRACTICES Reduced loan concentration risks Enhanced procedures, policies, systems, programs, plans, training and resources Even longer term capital planning Even more robust enterprise risk management, credit risk management, internal audit capabilities New executive-level hires in these areas WE ARE NOW EVEN STRONGER, HEALTHIER, AND BETTER POSITIONED TO COMPETE WITH LARGER BANKS IN OUR MARKETS |
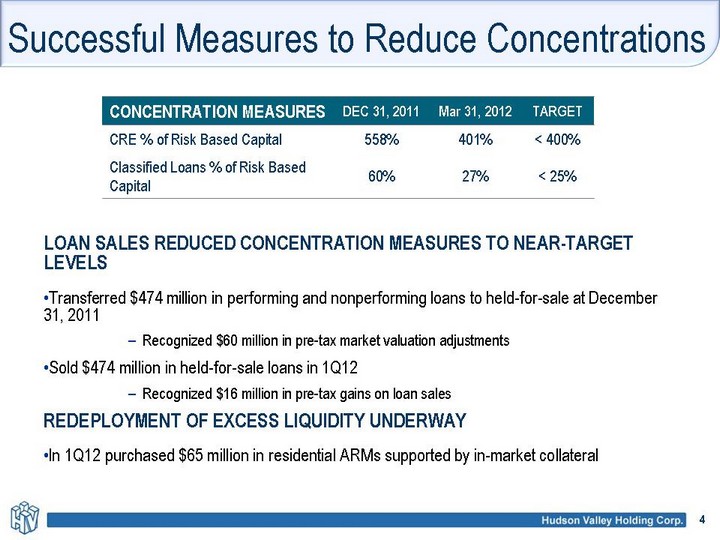
| Successful Measures to Reduce Concentrations LOAN SALES REDUCED CONCENTRATION MEASURES TO NEAR-TARGET LEVELS Transferred $474 million in performing and nonperforming loans to held-for-sale at December 31, 2011 Recognized $60 million in pre-tax market valuation adjustments Sold $474 million in held-for-sale loans in 1Q12 Recognized $16 million in pre-tax gains on loan sales CONCENTRATION MEASURES DEC 31, 2011 Mar 31, 2012 TARGET CRE % of Risk Based Capital 558% 401% < 400% Classified Loans % of Risk Based Capital 60% 27% < 25% REDEPLOYMENT OF EXCESS LIQUIDITY UNDERWAY In 1Q12 purchased $65 million in residential ARMs supported by in-market collateral |
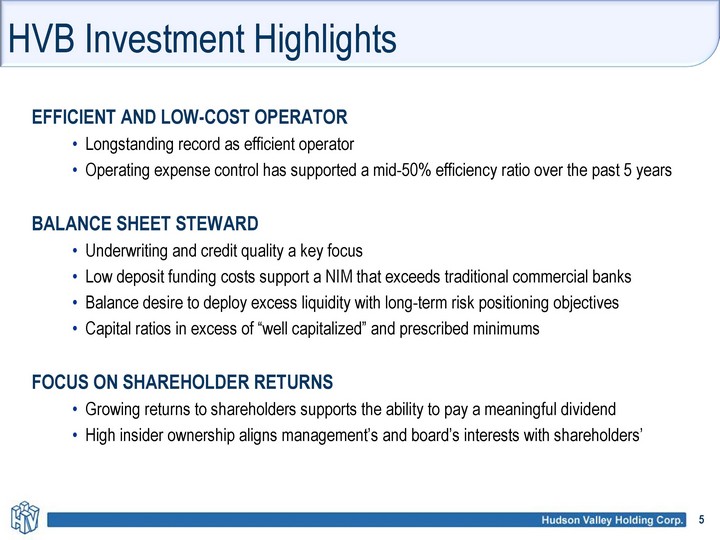
| HVB Investment Highlights EFFICIENT AND LOW-COST OPERATOR Longstanding record as efficient operator Operating expense control has supported a mid-50% efficiency ratio over the past 5 years BALANCE SHEET STEWARD Underwriting and credit quality a key focus Low deposit funding costs support a NIM that exceeds traditional commercial banks Balance desire to deploy excess liquidity with long-term risk positioning objectives Capital ratios in excess of "well capitalized" and prescribed minimums FOCUS ON SHAREHOLDER RETURNS Growing returns to shareholders supports the ability to pay a meaningful dividend High insider ownership aligns management's and board's interests with shareholders' |
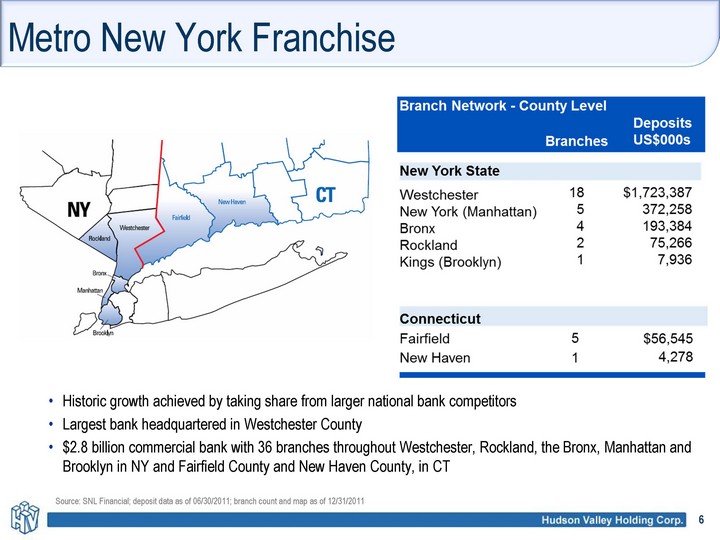
| Metro New York Franchise Historic growth achieved by taking share from larger national bank competitors Largest bank headquartered in Westchester County $2.8 billion commercial bank with 36 branches throughout Westchester, Rockland, the Bronx, Manhattan and Brooklyn in NY and Fairfield County and New Haven County, in CT Source: SNL Financial; deposit data as of 06/30/2011; branch count and map as of 12/31/2011 |
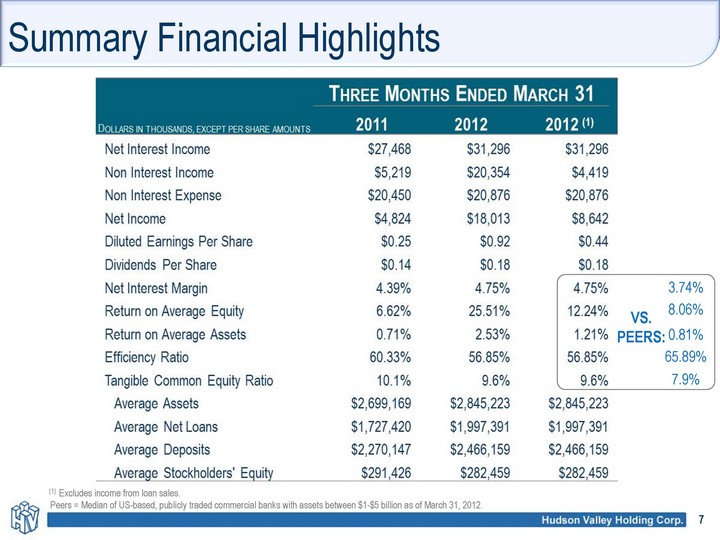
| Summary Financial Highlights 7 3.74% 65.89% 0.81% 8.06% 7.9% VS. PEERS: (1) Excludes income from loan sales. Peers = Median of US-based, publicly traded commercial banks with assets between $1-$5 billion as of March 31, 2012. |
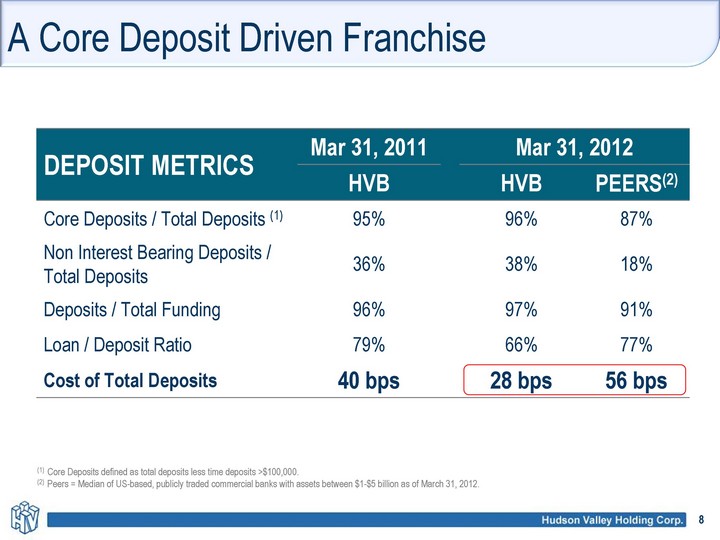
| DEPOSIT METRICS Mar 31, 2011 Mar 31, 2012 Mar 31, 2012 DEPOSIT METRICS HVB HVB PEERS(2) Core Deposits / Total Deposits (1) 95% 96% 87% Non Interest Bearing Deposits / Total Deposits 36% 38% 18% Deposits / Total Funding 96% 97% 91% Loan / Deposit Ratio 79% 66% 77% Cost of Total Deposits 40 bps 28 bps 56 bps A Core Deposit Driven Franchise (1) Core Deposits defined as total deposits less time deposits >$100,000. (2) Peers = Median of US-based, publicly traded commercial banks with assets between $1-$5 billion as of March 31, 2012. |
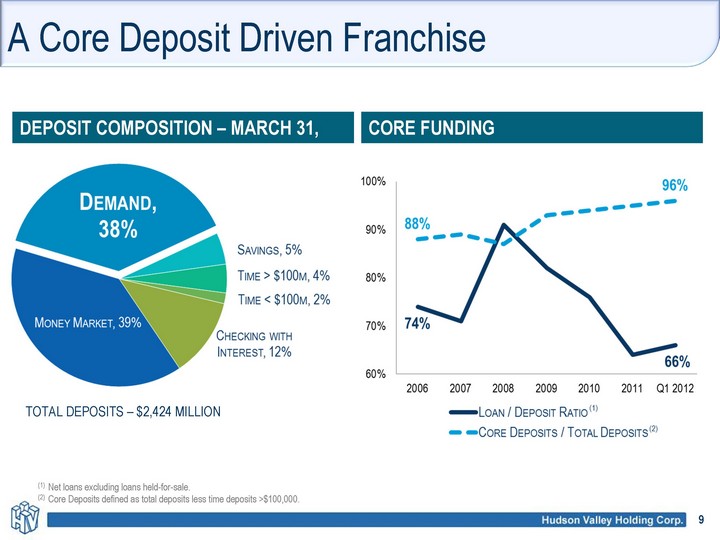
| A Core Deposit Driven Franchise DEPOSIT COMPOSITION - MARCH 31, 2012 CORE FUNDING (1) Net loans excluding loans held-for-sale. (2) Core Deposits defined as total deposits less time deposits >$100,000. TOTAL DEPOSITS - $2,424 MILLION |
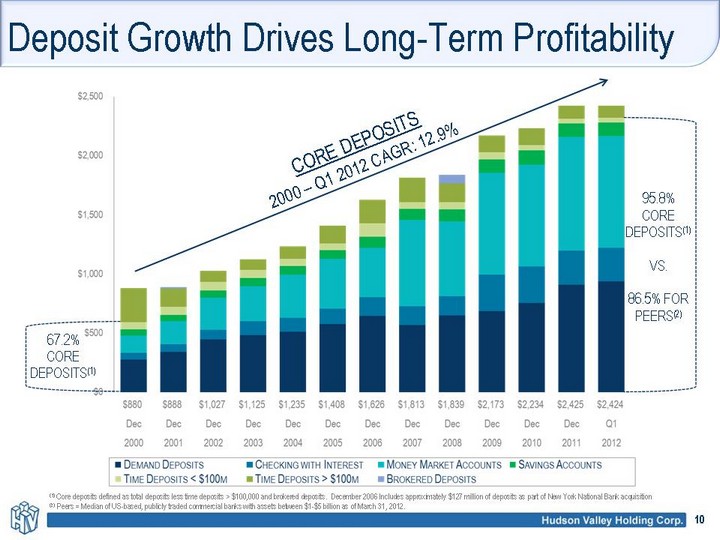
| Deposit Growth Drives Long-Term Profitability 67.2% CORE DEPOSITS(1 ) 95.8% CORE DEPOSIT S(1) VS. 86.5% FOR PEERS(2) CORE DEPOSITS 2000 - Q1 2012 CAGR: 12.9% (1) Core deposits defined as total deposits less time deposits > $100,000 and brokered deposits. December 2006 Includes approximately $127 million of deposits as part of New York National Bank acquisition (2) Peers = Median of US-based, publicly traded commercial banks with assets between $1-$5 billion as of March 31, 2012. |
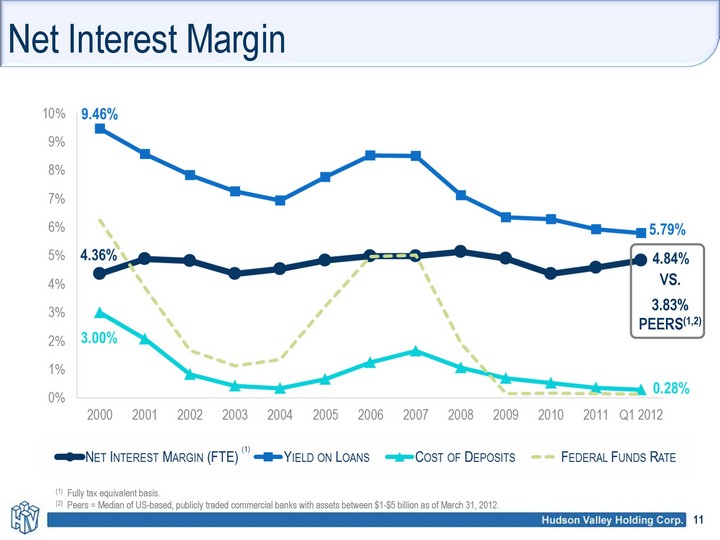
| Net Interest Margin (1) Fully tax equivalent basis. (2) Peers = Median of US-based, publicly traded commercial banks with assets between $1-$5 billion as of March 31, 2012. VS. 3.83% PEERS(1,2) |
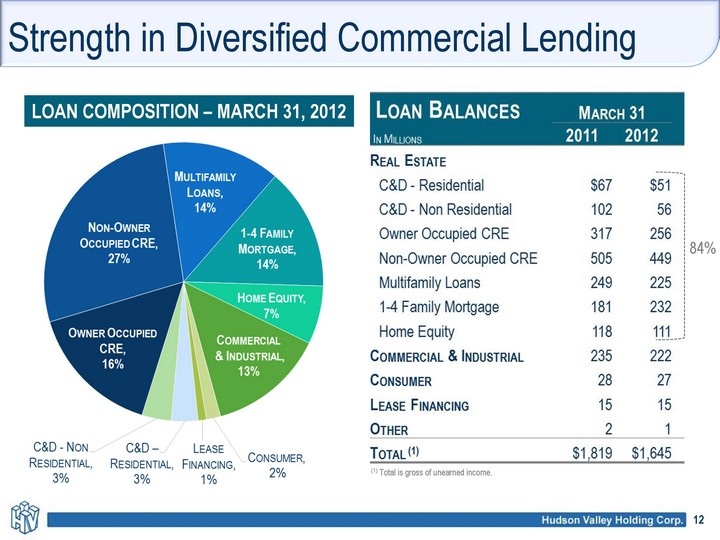
| Strength in Diversified Commercial Lending (1) Total is gross of unearned income. 84% LOAN COMPOSITION - MARCH 31, 2012 |
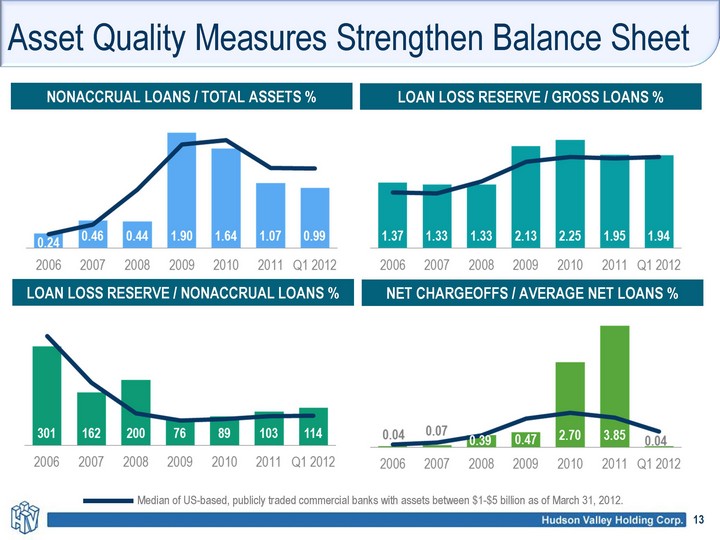
| Asset Quality Measures Strengthen Balance Sheet NONACCRUAL LOANS / TOTAL ASSETS % LOAN LOSS RESERVE / GROSS LOANS % LOAN LOSS RESERVE / NONACCRUAL LOANS % NET CHARGEOFFS / AVERAGE NET LOANS % Median of US-based, publicly traded commercial banks with assets between $1-$5 billion as of March 31, 2012. |
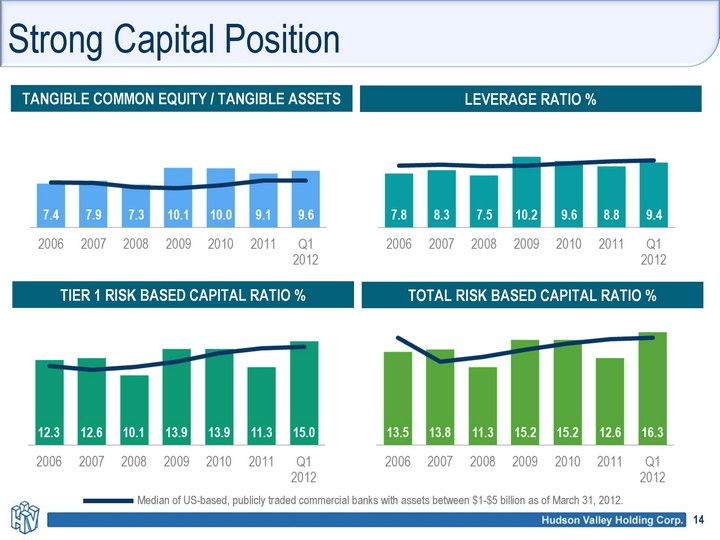
| Strong Capital Position TANGIBLE COMMON EQUITY / TANGIBLE ASSETS % LEVERAGE RATIO % TIER 1 RISK BASED CAPITAL RATIO % TOTAL RISK BASED CAPITAL RATIO % Median of US-based, publicly traded commercial banks with assets between $1-$5 billion as of March 31, 2012. |
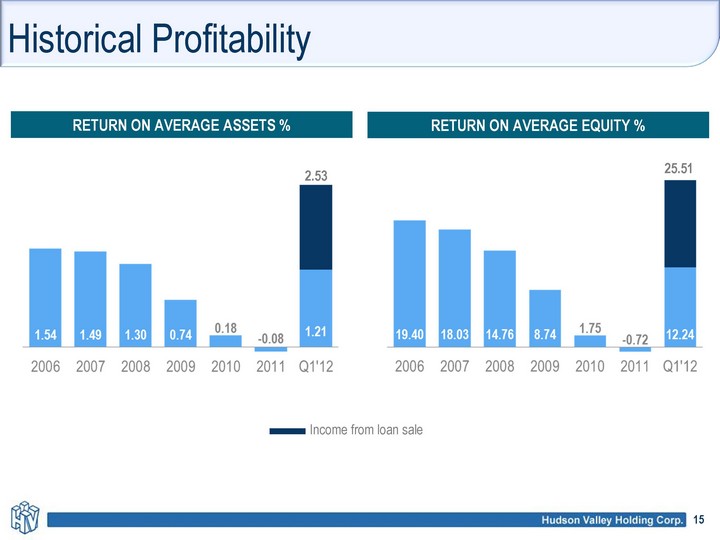
| Historical Profitability RETURN ON AVERAGE ASSETS % RETURN ON AVERAGE EQUITY % 2.53 25.51 Income from loan sale |
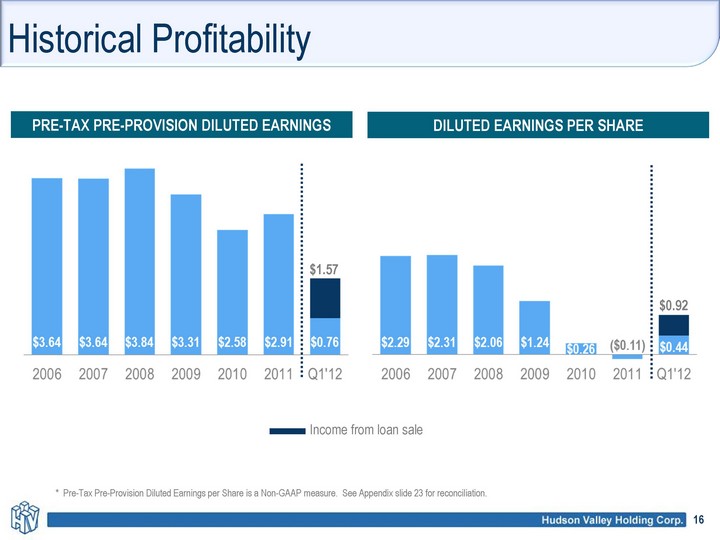
| Historical Profitability Income from loan sale PRE-TAX PRE-PROVISION DILUTED EARNINGS PER SHARE* DILUTED EARNINGS PER SHARE $1.57 $0.92 * Pre-Tax Pre-Provision Diluted Earnings per Share is a Non-GAAP measure. See Appendix slide 23 for reconciliation. |
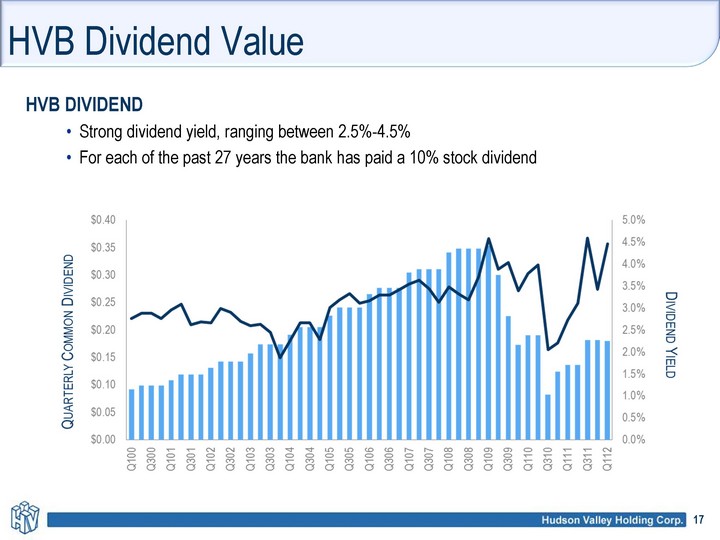
| HVB Dividend Value HVB DIVIDEND Strong dividend yield, ranging between 2.5%-4.5% For each of the past 27 years the bank has paid a 10% stock dividend |
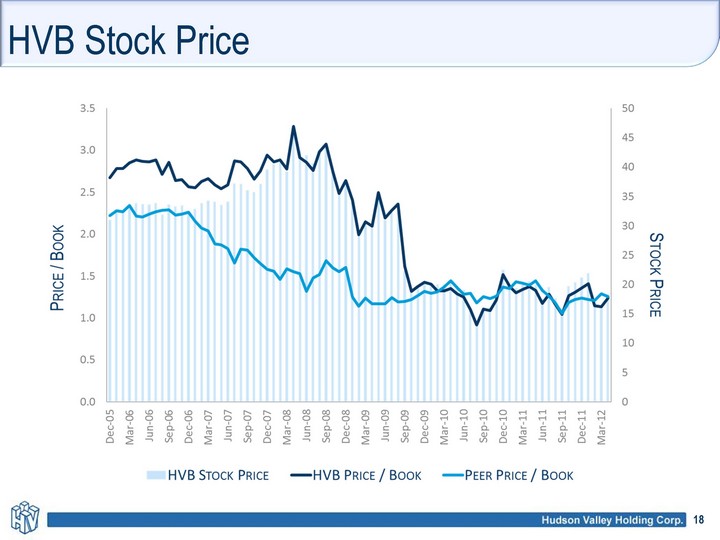
| HVB Stock Price |

| THANK YOU QUESTIONS |
| APPENDIX |
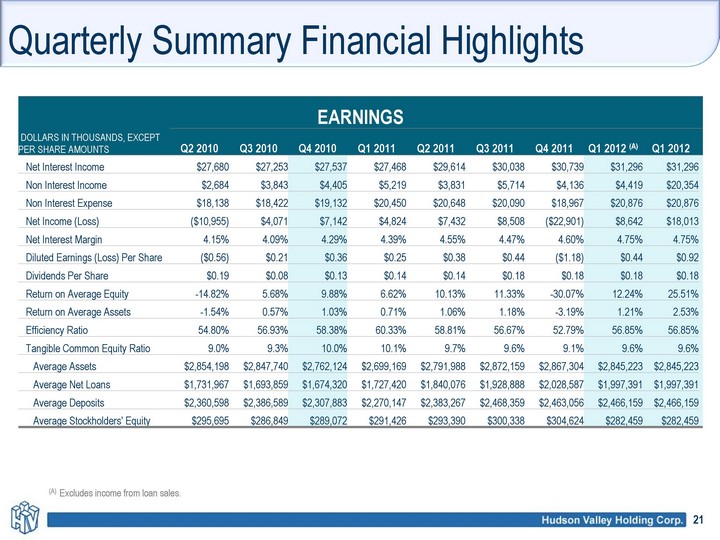
| Quarterly Summary Financial Highlights EARNINGS EARNINGS EARNINGS EARNINGS EARNINGS EARNINGS EARNINGS EARNINGS EARNINGS EARNINGS EARNINGS DOLLARS IN THOUSANDS, EXCEPT PER SHARE AMOUNTS Q2 2010 Q3 2010 Q4 2010 Q1 2011 Q2 2011 Q3 2011 Q4 2011 Q1 2012 (A) Q1 2012 Net Interest Income $27,680 $27,253 $27,537 $27,468 $29,614 $30,038 $30,739 $31,296 $31,296 Non Interest Income $2,684 $3,843 $4,405 $5,219 $3,831 $5,714 $4,136 $4,419 $20,354 Non Interest Expense $18,138 $18,422 $19,132 $20,450 $20,648 $20,090 $18,967 $20,876 $20,876 Net Income (Loss) ($10,955) $4,071 $7,142 $4,824 $7,432 $8,508 ($22,901) $8,642 $18,013 Net Interest Margin 4.15% 4.09% 4.29% 4.39% 4.55% 4.47% 4.60% 4.75% 4.75% Diluted Earnings (Loss) Per Share ($0.56) $0.21 $0.36 $0.25 $0.38 $0.44 ($1.18) $0.44 $0.92 Dividends Per Share $0.19 $0.08 $0.13 $0.14 $0.14 $0.18 $0.18 $0.18 $0.18 Return on Average Equity -14.82% 5.68% 9.88% 6.62% 10.13% 11.33% -30.07% 12.24% 25.51% Return on Average Assets -1.54% 0.57% 1.03% 0.71% 1.06% 1.18% -3.19% 1.21% 2.53% Efficiency Ratio 54.80% 56.93% 58.38% 60.33% 58.81% 56.67% 52.79% 56.85% 56.85% Tangible Common Equity Ratio 9.0% 9.3% 10.0% 10.1% 9.7% 9.6% 9.1% 9.6% 9.6% Average Assets $2,854,198 $2,847,740 $2,762,124 $2,699,169 $2,791,988 $2,872,159 $2,867,304 $2,845,223 $2,845,223 Average Net Loans $1,731,967 $1,693,859 $1,674,320 $1,727,420 $1,840,076 $1,928,888 $2,028,587 $1,997,391 $1,997,391 Average Deposits $2,360,598 $2,386,589 $2,307,883 $2,270,147 $2,383,267 $2,468,359 $2,463,056 $2,466,159 $2,466,159 Average Stockholders' Equity $295,695 $286,849 $289,072 $291,426 $293,390 $300,338 $304,624 $282,459 $282,459 (A) Excludes income from loan sales. |
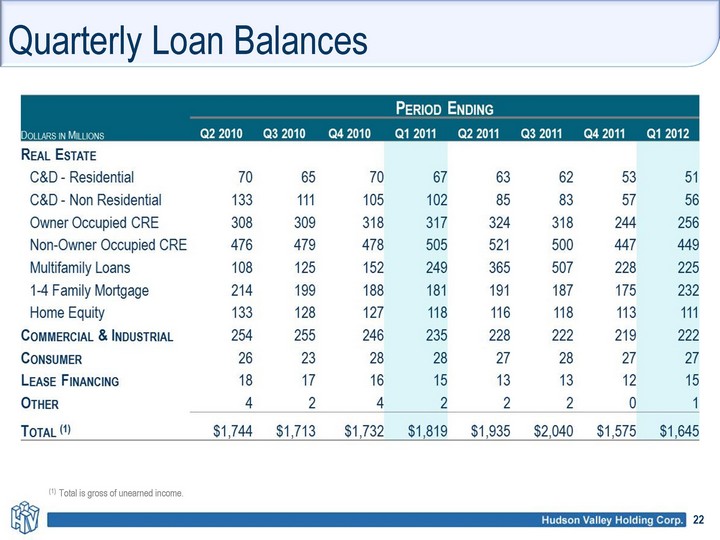
| Quarterly Loan Balances (1) Total is gross of unearned income. |
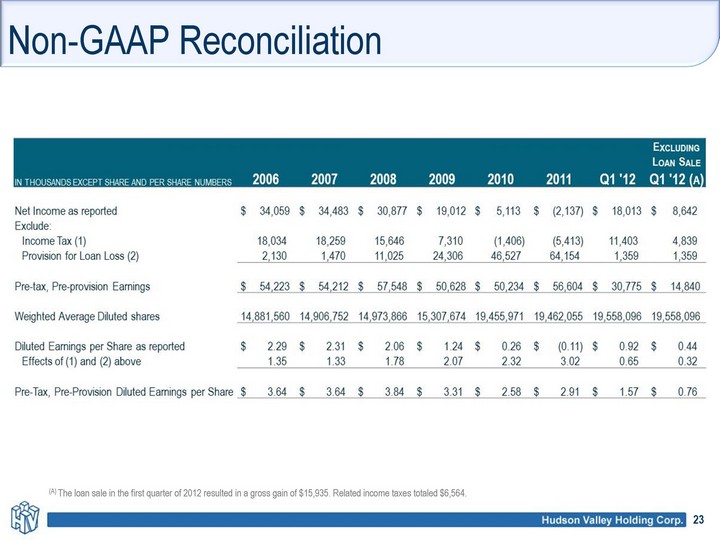
| Non-GAAP Reconciliation (A) The loan sale in the first quarter of 2012 resulted in a gross gain of $15,935. Related income taxes totaled $6,564. |