Attached files
| file | filename |
|---|---|
| 8-K - CURRENT REPORT - FIRST COMMUNITY BANKSHARES INC /VA/ | v315222_8k.htm |

June 5, 2012 www.fcbinc.com
Forward - Looking Disclosures This presentation may include forward - looking statements. These forward - looking statements are based on current expectations that involve risks, uncertainties and assumptions. Should one or more of these risks or uncertainties materialize or should underlying assumptions prove incorrect, actual results may differ materially. These risks include: changes in business or other market conditions; the timely development, production and acceptance of new products and services; the challenge of managing asset/liability levels; the management of credit risk and interest rate risk; the difficulty of keeping expense growth at modest levels while increasing revenues; and other risks detailed from time to time in the Company’s Securities and Exchange Commission reports, including but not limited to the Annual Report on Form 10 - K for the most recent year ended. Pursuant to the Private Securities Litigation Reform Act of 1995, the Company does not undertake to update forward - looking statements contained within this presentation. 2
First Community Bancshares 3
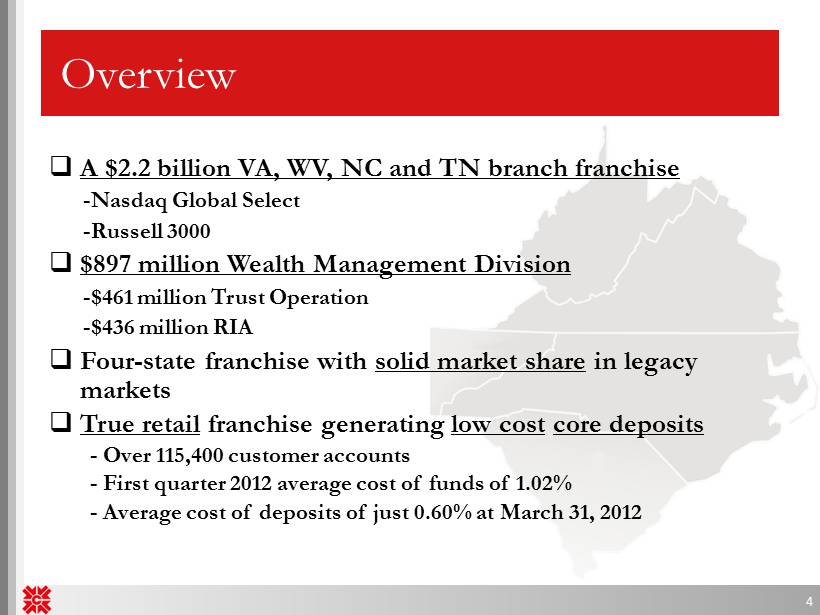
Overview □ A $2.2 billion VA, WV, NC and TN branch franchise - Nasdaq Global Select - Russell 3000 □ $897 million Wealth Management Division - $461 million Trust Operation - $436 million RIA □ Four - state franchise with solid market share in legacy markets □ True retail franchise generating low cost core deposits - Over 115,400 customer accounts - First quarter 2012 average cost of funds of 1.02% - Average cost of deposits of just 0.60% at March 31, 2012 4
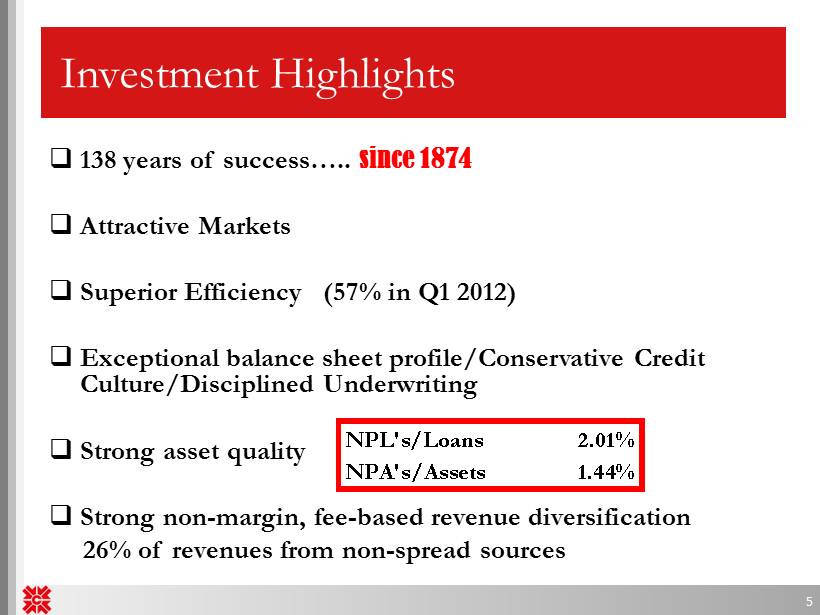
Investment Highlights □ 138 years of success….. since 1874 □ Attractive Markets □ Superior Efficiency (57% in Q1 2012) □ Exceptional balance sheet profile/Conservative Credit Culture/Disciplined Underwriting □ Strong asset quality □ Strong non - margin, fee - based revenue diversification 26% of revenues from non - spread sources 5 NPL's/Loans 2.01% NPA's/Assets 1.44%
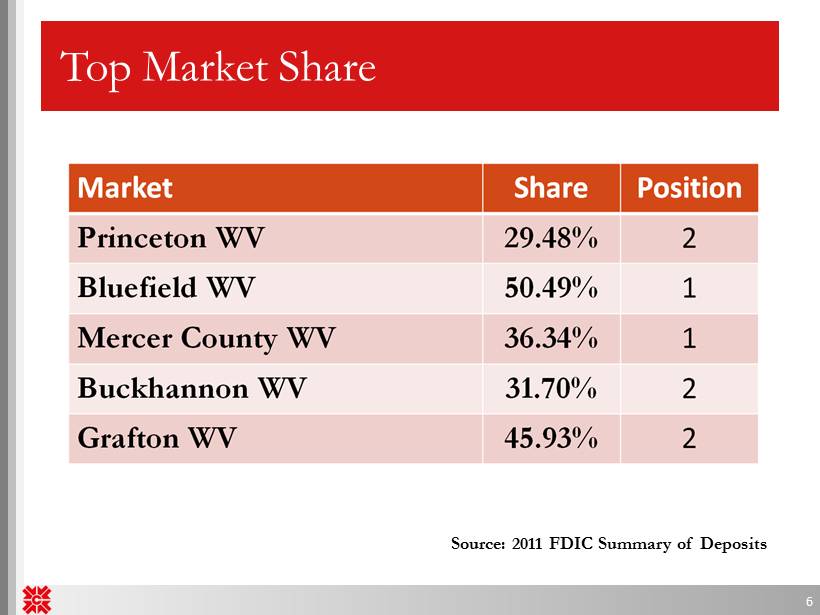
Top Market Share 6 Source: 2011 FDIC Summary of Deposits
Investment Highlights Stable, Low - Cost funding Strong Net Interest Margin Excess Capital Available No TARP or Capital Raise Overhang Loan Portfolio Performance – Highly granular – average loan balance of $57,800 – Virtually no A&D exposure – Well diversified – Total Delinquency of 2.69% – NPA’s/Total Assets of 1.44% 7
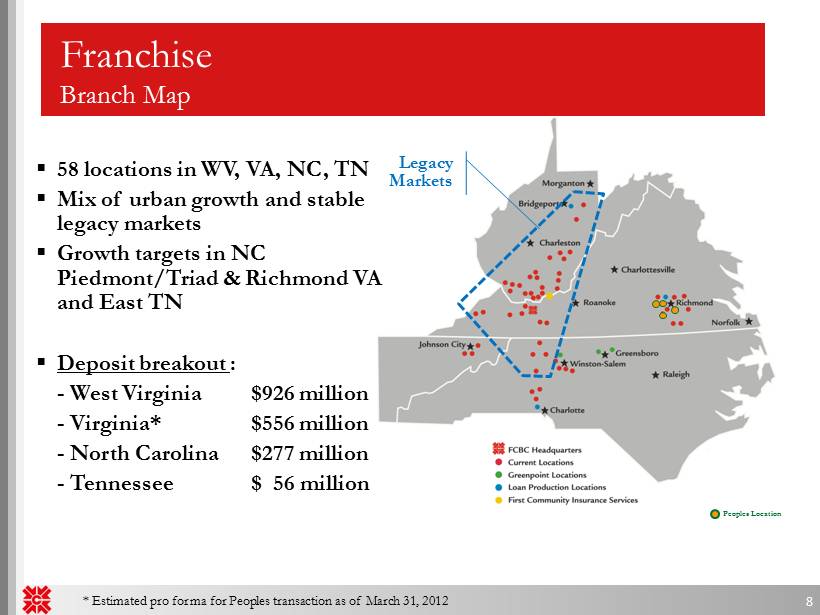
▪ 58 locations in WV, VA, NC, TN ▪ Mix of urban growth and stable legacy markets ▪ Growth targets in NC Piedmont/Triad & Richmond VA and East TN ▪ Deposit breakout : - West Virginia $926 million - Virginia* $556 million - North Carolina $277 million - Tennessee $ 56 million Franchise Branch Map Legacy Markets 8 * Estimated pro forma for Peoples transaction as of March 31, 2012 Peoples Location
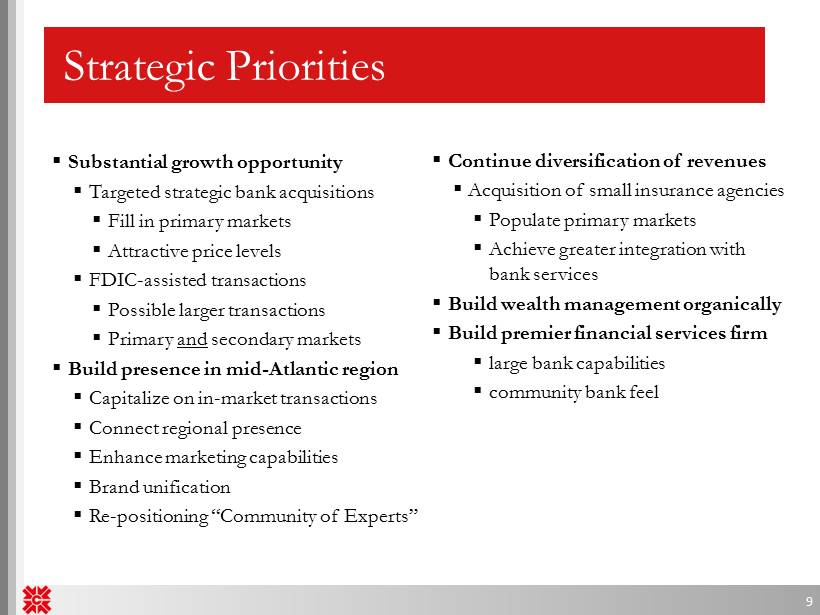
▪ Substantial growth opportunity ▪ Targeted strategic bank acquisitions ▪ Fill in primary markets ▪ Attractive price levels ▪ FDIC - assisted transactions ▪ Possible larger transactions ▪ Primary and secondary markets ▪ Build presence in mid - Atlantic region ▪ Capitalize on in - market transactions ▪ Connect regional presence ▪ Enhance marketing capabilities ▪ Brand unification ▪ Re - positioning “Community of Experts” ▪ Continue diversification of revenues ▪ Acquisition of small insurance agencies ▪ Populate primary markets ▪ Achieve greater integration with bank services ▪ Build wealth management organically ▪ Build premier financial services firm ▪ large bank capabilities ▪ community bank feel Strategic Priorities 9
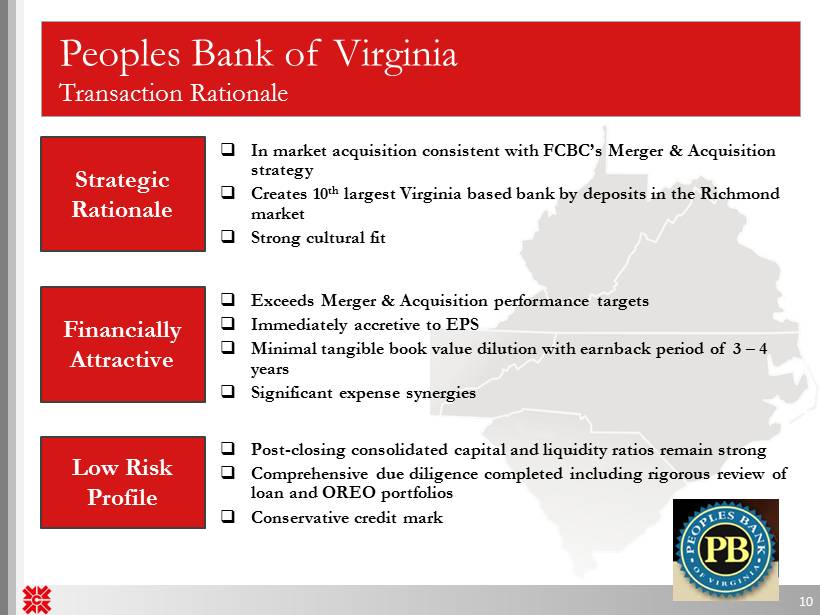
Peoples Bank of Virginia Transaction Rationale □ In market acquisition consistent with FCBC’s Merger & Acquisition strategy □ Creates 10 th largest Virginia based bank by deposits in the Richmond market □ Strong cultural fit 10 Strategic Rationale Financially Attractive Low Risk Profile □ Exceeds Merger & Acquisition performance targets □ Immediately accretive to EPS □ Minimal tangible book value dilution with earnback period of 3 – 4 years □ Significant expense synergies □ Post - closing consolidated capital and liquidity ratios remain strong □ Comprehensive due diligence completed including rigorous review of loan and OREO portfolios □ Conservative credit mark
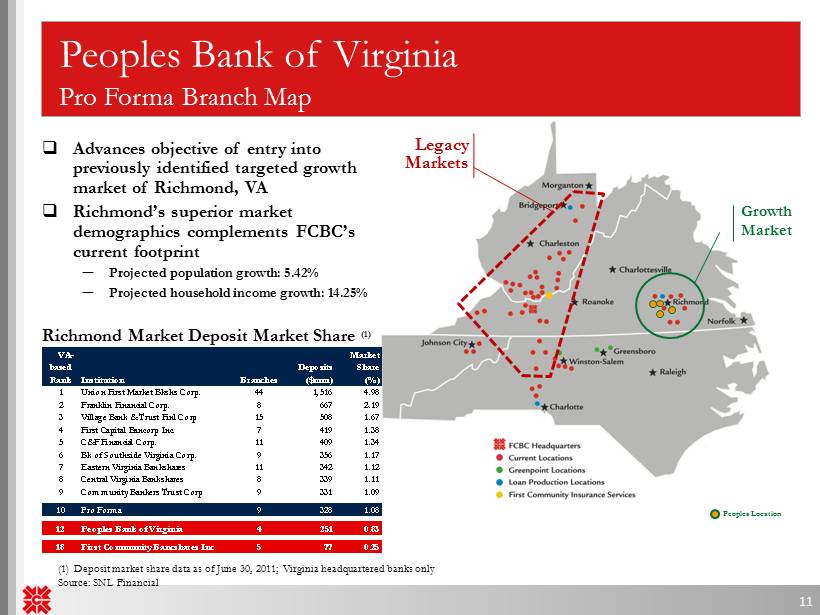
Peoples Bank of Virginia Pro Forma Branch Map Legacy Markets 11 Growth Market VA- based Rank Institution Branches Deposits ($mm) Market Share (%) 1 Union First Market Bkshs Corp. 44 1,516 4.98 2 Franklin Financial Corp. 8 667 2.19 3 Village Bank & Trust Finl Corp 15 508 1.67 4 First Capital Bancorp Inc. 7 419 1.38 5 C&F Financial Corp. 11 409 1.34 6 Bk of Southside Virginia Corp. 9 356 1.17 7 Eastern Virginia Bankshares 11 342 1.12 8 Central Virginia Bankshares 8 339 1.11 9 Community Bankers Trust Corp 9 331 1.09 10 Pro Forma 9 328 1.08 12 Peoples Bank of Virginia 4 251 0.83 18 First Community Bancshares Inc 5 77 0.25 Richmond Market Deposit Market Share (1) (1) Deposit market share data as of June 30, 2011; Virginia headquartered banks only Source: SNL Financial □ Advances objective of entry into previously identified targeted growth market of Richmond, VA □ Richmond’s superior market demographics complements FCBC’s current footprint ─ Projected population growth: 5.42% ─ Projected household income growth: 14.25% Peoples Location
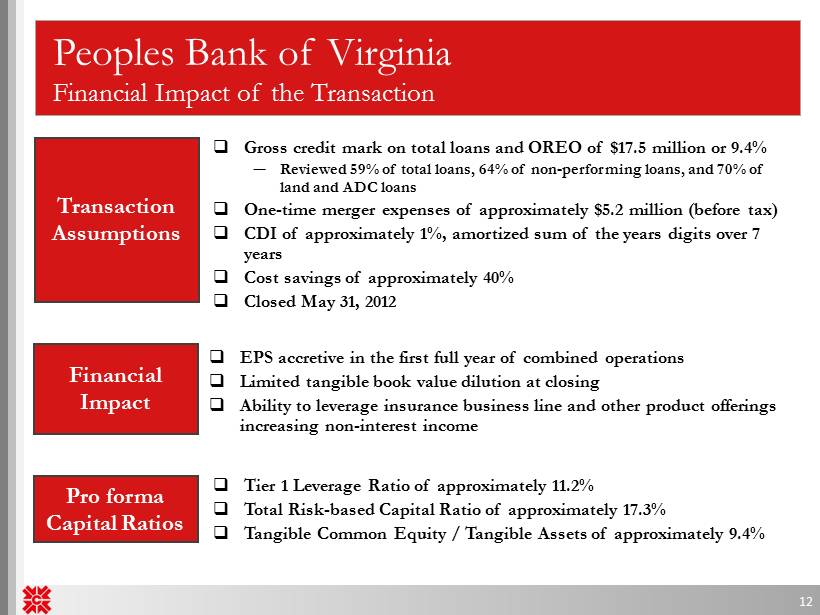
Peoples Bank of Virginia Financial Impact of the Transaction 12 Transaction Assumptions Financial Impact Pro forma Capital Ratios □ Tier 1 Leverage Ratio of approximately 11.2% □ Total Risk - based Capital Ratio of approximately 17.3% □ Tangible Common Equity / Tangible Assets of approximately 9.4% □ EPS accretive in the first full year of combined operations □ Limited tangible book value dilution at closing □ Ability to leverage insurance business line and other product offerings increasing non - interest income □ Gross credit mark on total loans and OREO of $17.5 million or 9.4% ─ Reviewed 59% of total loans, 64% of non - performing loans, and 70% of land and ADC loans □ One - time merger expenses of approximately $5.2 million (before tax ) □ CDI of approximately 1%, amortized sum of the years digits over 7 years □ Cost savings of approximately 40% □ Closed May 31, 2012
Peoples Bank of Virginia Summary 13 □ Transaction drives EPS growth and shareholder value for both FCBC and Peoples shareholders □ Manageable transaction size and strong pro forma capital ratios allow for future opportunities □ M&A pipeline and organic growth opportunities in targeted growth markets remain attractive □ Low risk structure □ Comprehensive due diligence □ Strong cultural fit □ Additional product capabilities
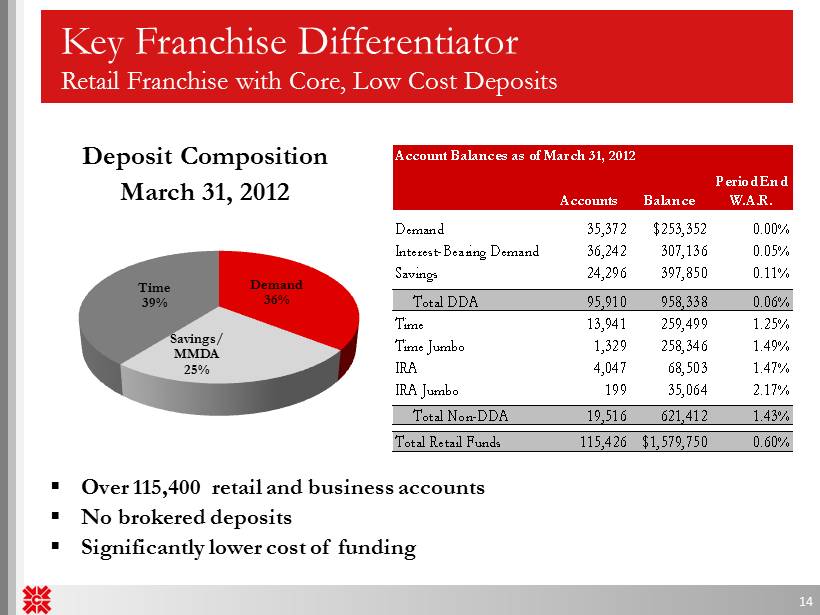
Deposit Composition March 31, 2012 Key Franchise Differentiator Retail Franchise with Core, Low Cost Deposits ▪ Over 115,400 retail and business accounts ▪ No brokered deposits ▪ Significantly lower cost of funding Account Balances as of March 31, 2012 Accounts Balance Period End W.A.R. Demand 35,372 $253,352 0.00% Interest-Bearing Demand 36,242 307,136 0.05% Savings 24,296 397,850 0.11% Total DDA 95,910 958,338 0.06% Time 13,941 259,499 1.25% Time Jumbo 1,329 258,346 1.49% IRA 4,047 68,503 1.47% IRA Jumbo 199 35,064 2.17% Total Non-DDA 19,516 621,412 1.43% Total Retail Funds 115,426 $1,579,750 0.60% 14 Demand 36% Savings/ MMDA 25% Time 39%
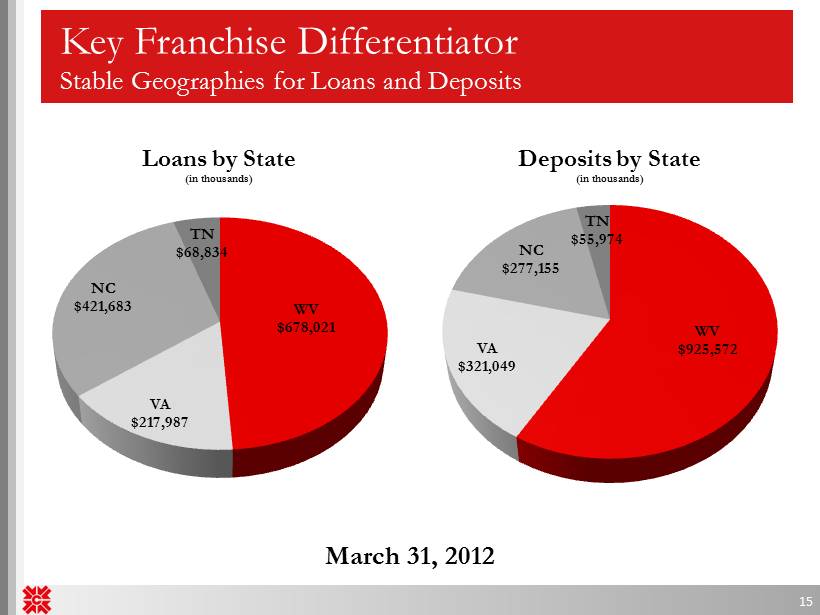
Key Franchise Differentiator Stable Geographies for Loans and Deposits 15 March 31, 2012 WV $925,572 VA $321,049 NC $277,155 TN $55,974 Deposits by State (in thousands) WV $678,021 VA $217,987 NC $421,683 TN $68,834 Loans by State (in thousands)
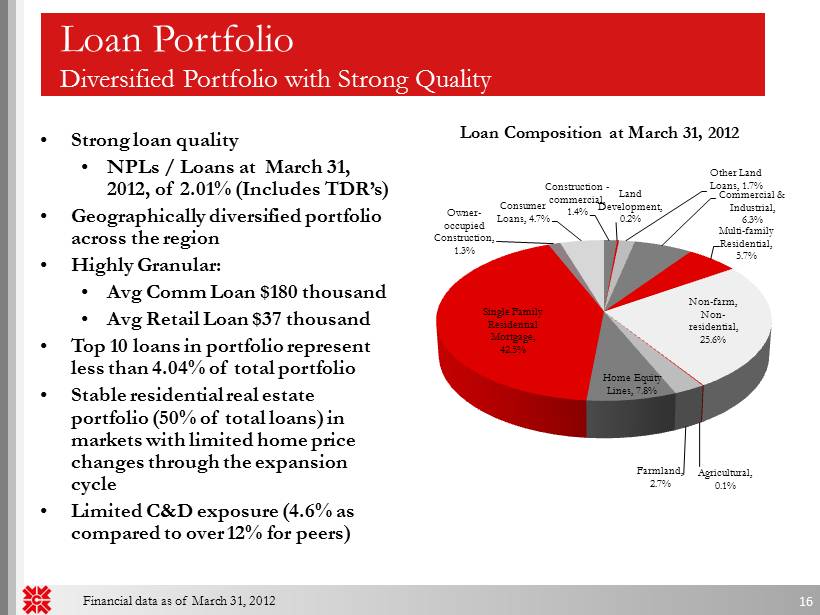
Loan Portfolio Diversified Portfolio with Strong Quality • Strong loan quality • NPLs / Loans at March 31, 2012, of 2.01% (Includes TDR’s) • Geographically diversified portfolio across the region • Highly Granular: • Avg Comm Loan $180 thousand • Avg Retail Loan $37 thousand • Top 10 loans in portfolio represent less than 4.04% of total portfolio • Stable residential real estate portfolio (50% of total loans) in markets with limited home price changes through the expansion cycle • Limited C&D exposure (4.6% as compared to over 12% for peers) Loan Composition at March 31, 2012 Financial data as of March 31, 2012 16 Construction - commercial, 1.4% Land Development, 0.2% Other Land Loans, 1.7% Commercial & Industrial, 6.3% Multi - family Residential, 5.7% Non - farm, Non - residential, 25.6% Agricultural, 0.1% Farmland, 2.7% Home Equity Lines, 7.8% Single Family Residential Mortgage, 42.5% Owner - occupied Construction, 1.3% Consumer Loans, 4.7%
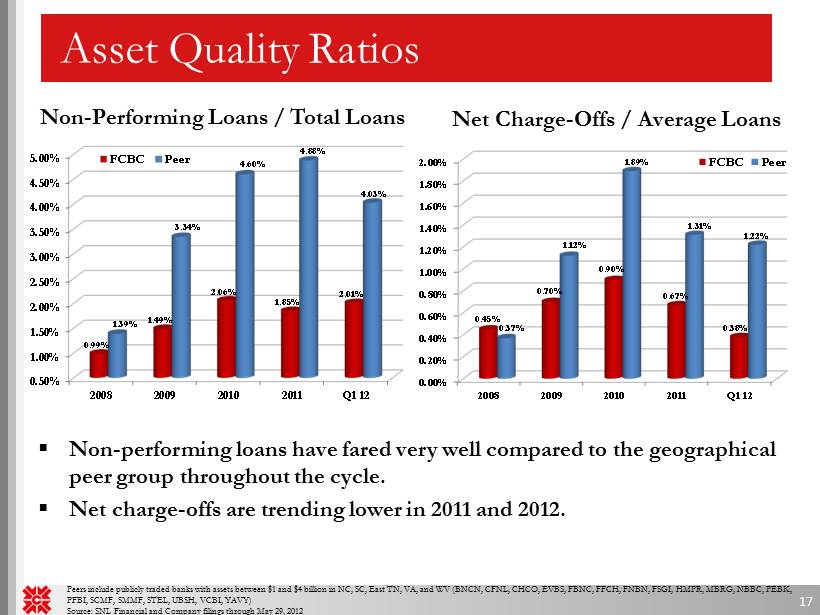
0.00% 0.20% 0.40% 0.60% 0.80% 1.00% 1.20% 1.40% 1.60% 1.80% 2.00% 2008 2009 2010 2011 Q1 12 0.45% 0.70% 0.90% 0.67% 0.38% 0.37% 1.12% 1.89% 1.31% 1.22% FCBC Peer 0.50% 1.00% 1.50% 2.00% 2.50% 3.00% 3.50% 4.00% 4.50% 5.00% 2008 2009 2010 2011 Q1 12 0.99% 1.49% 2.06% 1.85% 2.01% 1.39% 3.34% 4.60% 4.88% 4.03% FCBC Peer Asset Quality Ratios Non - Performing Loans / Total Loans Peers include publicly traded banks with assets between $1 and $4 billion in NC, SC, East TN, VA, and WV (BNCN, CFNL , CHCO, EVBS , FBNC, FFCH, FNBN, FSGI, HMPR , MBRG, NBBC , PEBK, PFBI , SCMF, SMMF, STEL , UBSH, VCBI, YAVY) Source: SNL Financial and Company filings through May 29, 2012 Net Charge - Offs / Average Loans 17 ▪ Non - performing loans have fared very well compared to the geographical peer group throughout the cycle. ▪ Net charge - offs are trending lower in 2011 and 2012.
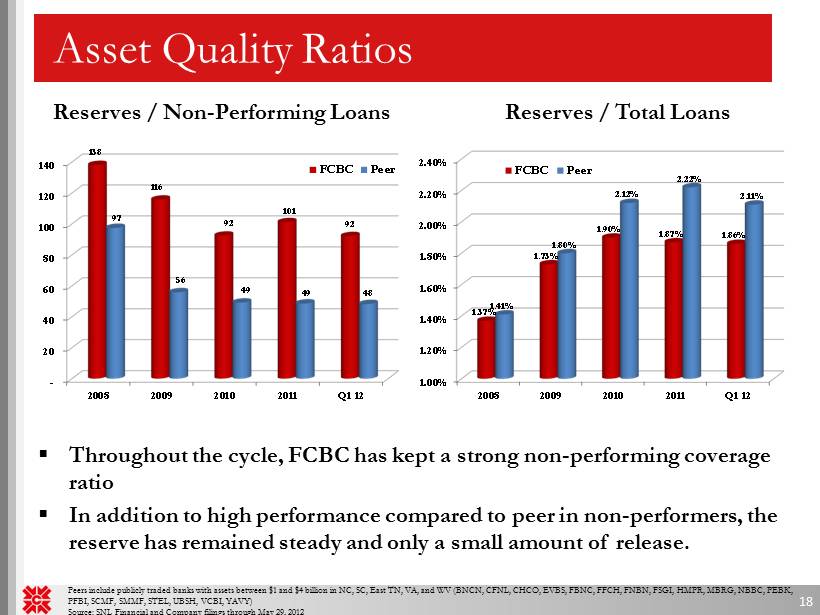
Asset Quality Ratios Reserves / Non - Performing Loans Reserves / Total Loans Peers include publicly traded banks with assets between $1 and $4 billion in NC, SC, East TN, VA, and WV (BNCN, CFNL , CHCO, EVBS , FBNC, FFCH, FNBN, FSGI, HMPR , MBRG, NBBC , PEBK, PFBI , SCMF, SMMF, STEL, UBSH , VCBI, YAVY) Source: SNL Financial and Company filings through May 29, 2012 - 20 40 60 80 100 120 140 2008 2009 2010 2011 Q1 12 138 116 92 101 92 97 56 49 49 48 FCBC Peer 18 1.00% 1.20% 1.40% 1.60% 1.80% 2.00% 2.20% 2.40% 2008 2009 2010 2011 Q1 12 1.37% 1.73% 1.90% 1.87% 1.86% 1.41% 1.80% 2.12% 2.22% 2.11% FCBC Peer ▪ Throughout the cycle, FCBC has kept a strong non - performing coverage ratio ▪ In addition to high performance compared to peer in non - performers, the reserve has remained steady and only a small amount of release.
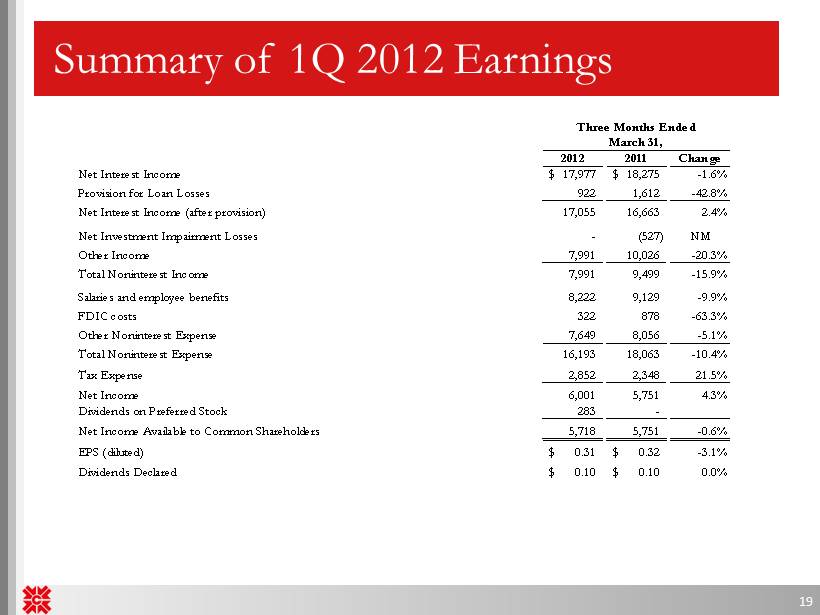
Summary of 1Q 2012 Earnings Three Months Ended March 31, 2012 2011 Change Net Interest Income 17,977$ 18,275$ -1.6% Provision for Loan Losses 922 1,612 -42.8% Net Interest Income (after provision) 17,055 16,663 2.4% Net Investment Impairment Losses - (527) NM Other Income 7,991 10,026 -20.3% Total Noninterest Income 7,991 9,499 -15.9% Salaries and employee benefits 8,222 9,129 -9.9% FDIC costs 322 878 -63.3% Other Noninterest Expense 7,649 8,056 -5.1% Total Noninterest Expense 16,193 18,063 -10.4% Tax Expense 2,852 2,348 21.5% Net Income 6,001 5,751 4.3% Dividends on Preferred Stock 283 - Net Income Available to Common Shareholders 5,718 5,751 -0.6% EPS (diluted) 0.31$ 0.32$ -3.1% Dividends Declared 0.10$ 0.10$ 0.0% 19
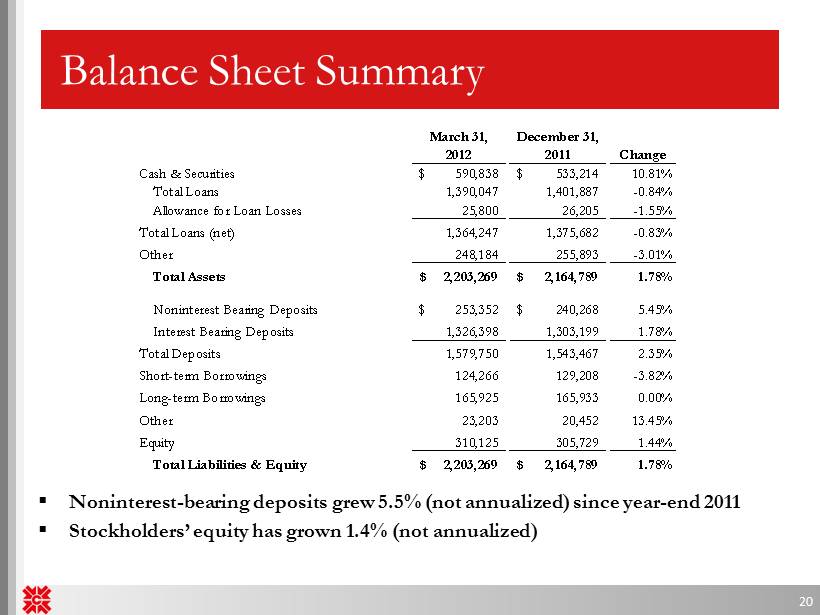
Balance Sheet Summary March 31, December 31, 2012 2011 Change Cash & Securities 590,838$ 533,214$ 10.81% Total Loans 1,390,047 1,401,887 -0.84% Allowance for Loan Losses 25,800 26,205 -1.55% Total Loans (net) 1,364,247 1,375,682 -0.83% Other 248,184 255,893 -3.01% Total Assets 2,203,269$ 2,164,789$ 1.78% Noninterest Bearing Deposits 253,352$ 240,268$ 5.45% Interest Bearing Deposits 1,326,398 1,303,199 1.78% Total Deposits 1,579,750 1,543,467 2.35% Short-term Borrowings 124,266 129,208 -3.82% Long-term Borrowings 165,925 165,933 0.00% Other 23,203 20,452 13.45% Equity 310,125 305,729 1.44% Total Liabilities & Equity 2,203,269$ 2,164,789$ 1.78% ▪ Noninterest - bearing deposits grew 5.5% (not annualized) since year - end 2011 ▪ Stockholders’ equity has grown 1.4 % (not annualized) 20
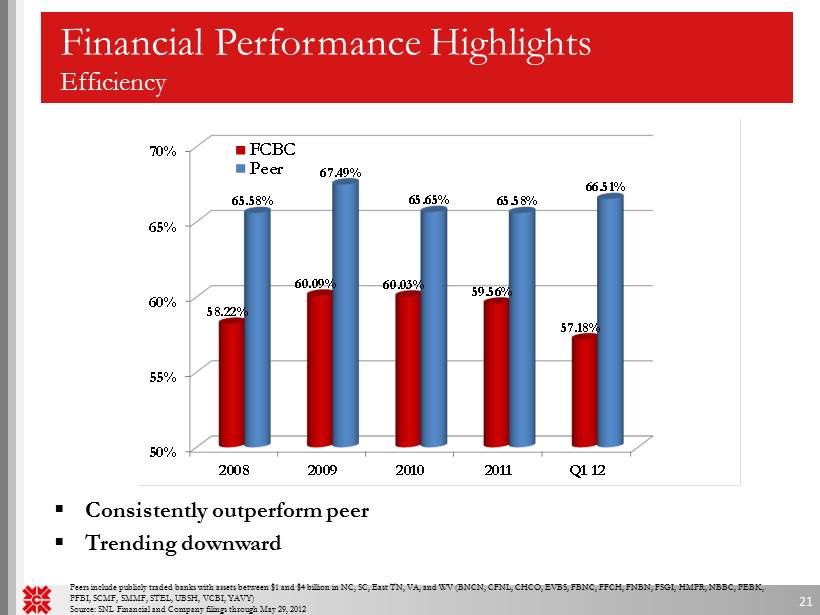
50% 55% 60% 65% 70% 2008 2009 2010 2011 Q1 12 58.22% 60.09% 60.03% 59.56% 57.18% 65.58% 67.49% 65.65% 65.58% 66.51% FCBC Peer Financial Performance Highlights Efficiency Peers include publicly traded banks with assets between $1 and $4 billion in NC, SC, East TN, VA, and WV (BNCN, CFNL , CHCO, EVBS , FBNC, FFCH, FNBN, FSGI, HMPR , NBBC, PEBK, PFBI, SCMF , SMMF, STEL, UBSH , VCBI, YAVY) Source: SNL Financial and Company filings through May 29, 2012 21 ▪ Consistently outperform peer ▪ Trending downward
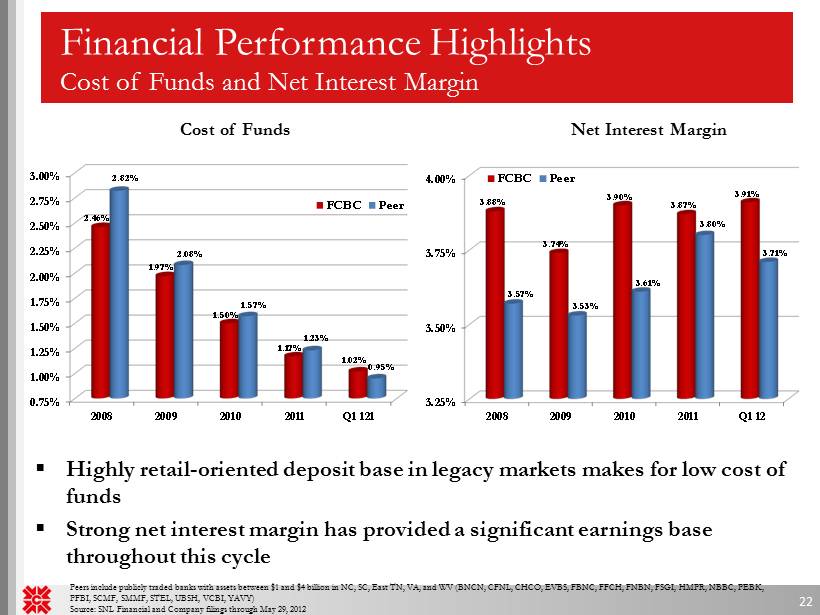
0.75% 1.00% 1.25% 1.50% 1.75% 2.00% 2.25% 2.50% 2.75% 3.00% 2008 2009 2010 2011 Q1 121 2.46% 1.97% 1.50% 1.17% 1.02% 2.82% 2.08% 1.57% 1.23% 0.95% FCBC Peer Financial Performance Highlights Cost of Funds and Net Interest Margin Peers include publicly traded banks with assets between $1 and $4 billion in NC, SC, East TN, VA, and WV (BNCN, CFNL , CHCO, EVBS , FBNC, FFCH, FNBN, FSGI, HMPR , NBBC, PEBK, PFBI, SCMF , SMMF, STEL, UBSH , VCBI, YAVY) Source: SNL Financial and Company filings through May 29, 2012 22 ▪ Highly retail - oriented deposit base in legacy markets makes for low cost of funds ▪ Strong net interest margin has provided a significant earnings base throughout this cycle 3.25% 3.50% 3.75% 4.00% 2008 2009 2010 2011 Q1 12 3.88% 3.74% 3.90% 3.87% 3.91% 3.57% 3.53% 3.61% 3.80% 3.71% FCBC Peer Cost of Funds Net Interest Margin
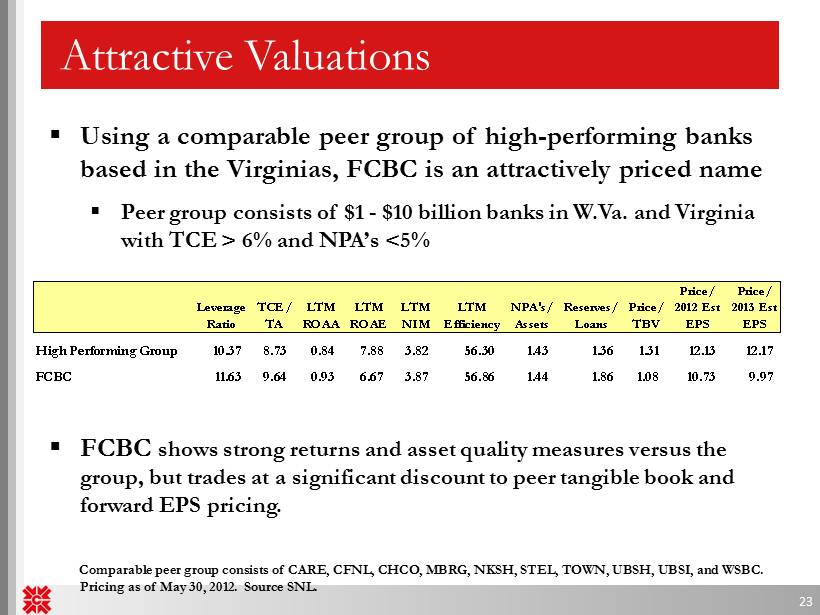
Attractive Valuations 23 ▪ Using a comparable peer group of high - performing banks based in the Virginias, FCBC is an attractively priced name ▪ Peer group consists of $1 - $10 billion banks in W.Va. and Virginia with TCE > 6% and NPA’s <5% ▪ FCBC shows strong returns and asset quality measures versus the group, but trades at a significant discount to peer tangible book and forward EPS pricing. Comparable peer group consists of CARE , CFNL, CHCO, MBRG, NKSH, STEL , TOWN, UBSH, UBSI, and WSBC. Pricing as of May 30, 2012. Source SNL. Price/ Price/ Leverage TCE/ LTM LTM LTM LTM NPA's/ Reserves/ Price/ 2012 Est 2013 Est Ratio TA ROAA ROAE NIM Efficiency Assets Loans TBV EPS EPS High Performing Group 10.37 8.73 0.84 7.88 3.82 56.30 1.43 1.36 1.31 12.13 12.17 FCBC 11.63 9.64 0.93 6.67 3.87 56.86 1.44 1.86 1.08 10.73 9.97
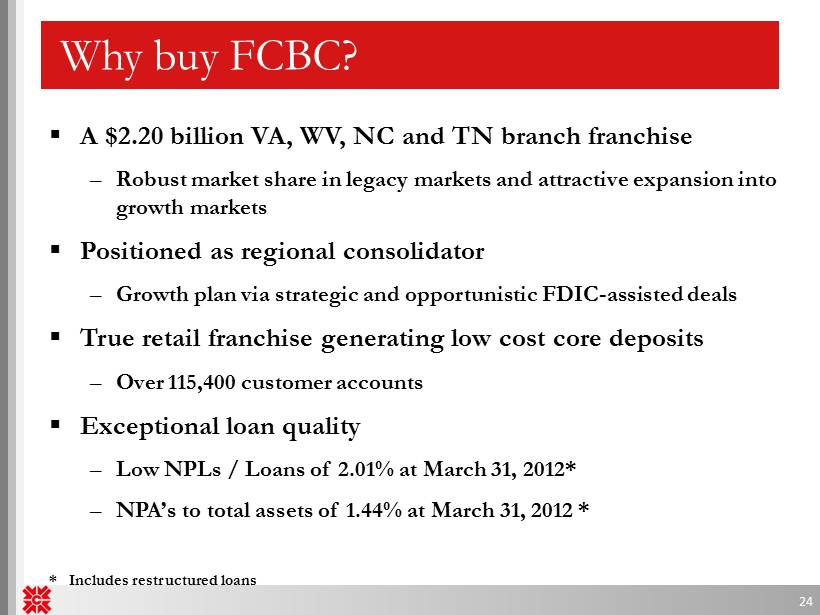
▪ A $ 2.20 billion VA, WV, NC and TN branch franchise – Robust market share in legacy markets and attractive expansion into growth markets ▪ Positioned as regional consolidator – Growth plan via strategic and opportunistic FDIC - assisted deals ▪ True retail franchise generating low cost core deposits – Over 115,400 customer accounts ▪ Exceptional loan quality – Low NPLs / Loans of 2.01% at March 31, 2012* – NPA’s to total assets of 1.44% at March 31, 2012 * * Includes restructured loans Why buy FCBC? 24
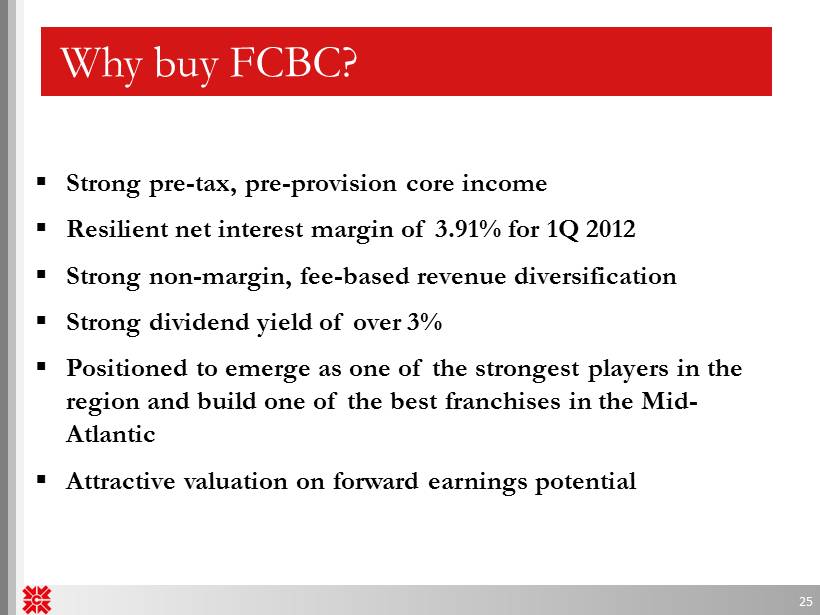
▪ Strong pre - tax, pre - provision core income ▪ Resilient net interest margin of 3.91% for 1Q 2012 ▪ Strong non - margin, fee - based revenue diversification ▪ Strong dividend yield of over 3% ▪ Positioned to emerge as one of the strongest players in the region and build one of the best franchises in the Mid - Atlantic ▪ Attractive valuation on forward earnings potential Why buy FCBC? 25

Supplemental Information 26
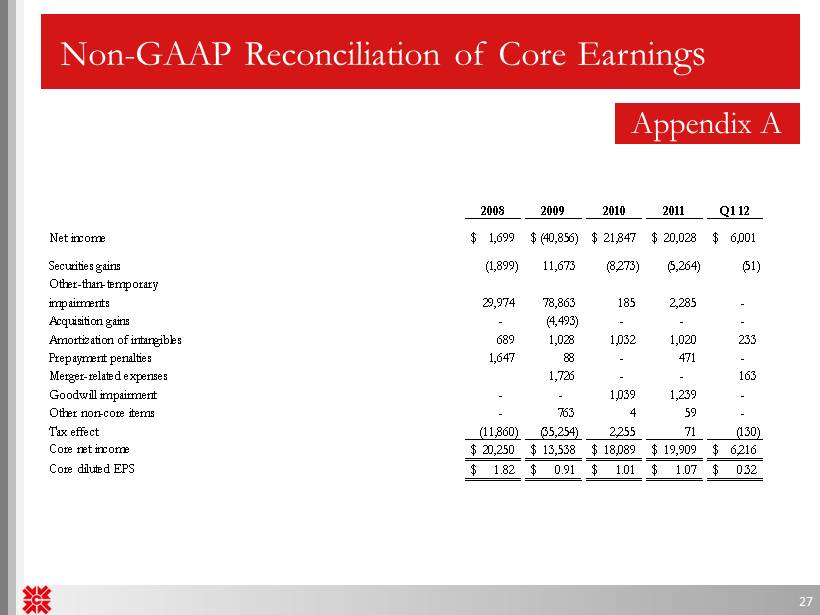
Appendix A 2008 2009 2010 2011 Q1 12 Net income 1,699$ (40,856)$ 21,847$ 20,028$ 6,001$ Securities gains (1,899) 11,673 (8,273) (5,264) (51) Other-than-temporary impairments 29,974 78,863 185 2,285 - Acquisition gains - (4,493) - - - Amortization of intangibles 689 1,028 1,032 1,020 233 Prepayment penalties 1,647 88 - 471 - Merger-related expenses 1,726 - - 163 Goodwill impairment - - 1,039 1,239 - Other non-core items - 763 4 59 - Tax effect (11,860) (35,254) 2,255 71 (130) Core net income 20,250$ 13,538$ 18,089$ 19,909$ 6,216$ Core diluted EPS 1.82$ 0.91$ 1.01$ 1.07$ 0.32$ Non - GAAP Reconciliation of Core Earnin gs 27
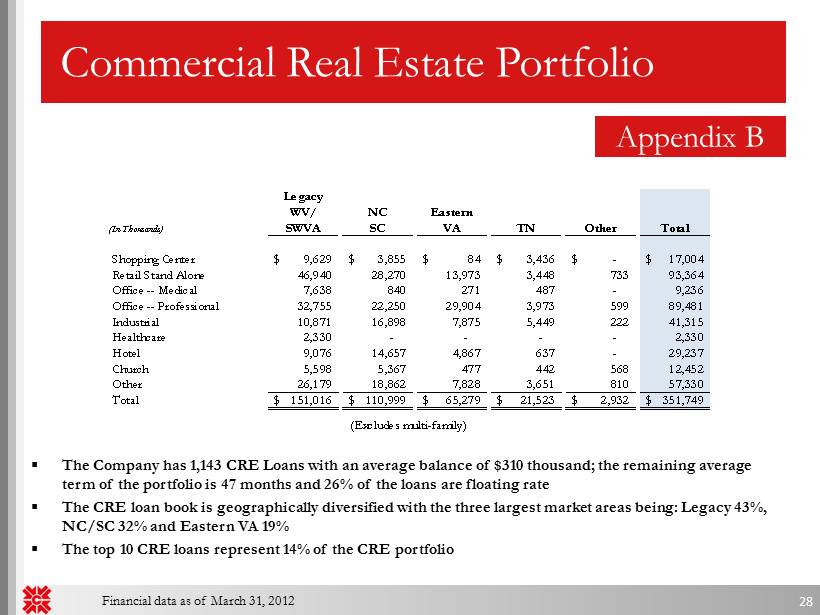
Commercial Real Estate Portfolio ▪ The Company has 1,143 CRE Loans with an average balance of $310 thousand; the remaining average term of the portfolio is 47 months and 26% of the loans are floating rate ▪ The CRE loan book is geographically diversified with the three largest market areas being: Legacy 43%, NC/SC 32% and Eastern VA 19% ▪ The top 10 CRE loans represent 14% of the CRE portfolio Financial data as of March 31, 2012 Legacy WV/ NC Eastern (In Thousands) SWVA SC VA TN Other Total Shopping Center 9,629$ 3,855$ 84$ 3,436$ -$ 17,004$ Retail Stand Alone 46,940 28,270 13,973 3,448 733 93,364 Office -- Medical 7,638 840 271 487 - 9,236 Office -- Professional 32,755 22,250 29,904 3,973 599 89,481 Industrial 10,871 16,898 7,875 5,449 222 41,315 Healthcare 2,330 - - - - 2,330 Hotel 9,076 14,657 4,867 637 - 29,237 Church 5,598 5,367 477 442 568 12,452 Other 26,179 18,862 7,828 3,651 810 57,330 Total 151,016$ 110,999$ 65,279$ 21,523$ 2,932$ 351,749$ (Excludes multi-family) 28 Appendix B
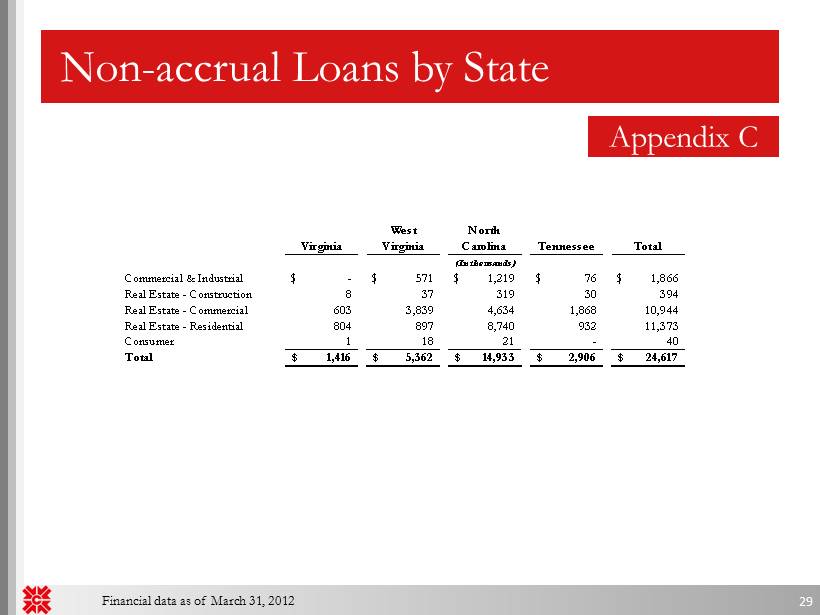
Non - accrual Loans by State Virginia West Virginia North Carolina Tennessee Total (In thousands) Commercial & Industrial -$ 571$ 1,219$ 76$ 1,866$ Real Estate - Construction 8 37 319 30 394 Real Estate - Commercial 603 3,839 4,634 1,868 10,944 Real Estate - Residential 804 897 8,740 932 11,373 Consumer 1 18 21 - 40 Total 1,416$ 5,362$ 14,933$ 2,906$ 24,617$ Appendix C 29 Financial data as of March 31, 2012

Contact Information First Community Bancshares, Inc. NASDAQ: FCBC One Community Place Bluefield, VA 24605 For More Information Contact: David D. Brown Chief Financial Officer First Community Bancshares, Inc. (276) 326 - 9000 30