Attached files
| file | filename |
|---|---|
| 8-K - FORM 8-K - CommunityOne Bancorp | d361629d8k.htm |
 FNB
United Corp. First Quarter 2012
June 1, 2012
Exhibit 99.1 |
 2
Presenters
Brian Simpson
Chief Executive Officer
David Nielsen
Executive Vice President and
Chief Financial Officer
David Lavoie
Executive Vice President and
Chief Risk Officer |
 3
Forward Looking Statements & Other Information
Forward Looking Statements
This presentation contains certain forward-looking statements within the safe
harbor rules of the federal securities laws. These
statements
generally
relate
to
FNB’s
financial
condition,
results
of
operations,
plans,
objectives,
future
performance
or
business.
They
usually
can
be
identified
by
the
use
of
forward-looking
terminology,
such
as
“believes,”
“expects,”
or
“are
expected to,”
“plans,”
“projects,”
“goals,”
“estimates,”
“may,”
“should,”
“could,”
“would,”
“intends to,”
“outlook”
or “anticipates,”
or variations of these and similar words, or by discussions of strategies that
involve risks and uncertainties. Forward looking statements
are
subject
to
risks
and
uncertainties,
including
but
not
limited
to,
those
risks
described
in
FNB’s
Annual
Report
on
Form
10-K
for
the
year
ended
December
31,
2011
under
the
section
entitled
“Item
1A,
Risk
Factors,”
and
in
other
reports
that have been filed by FNB with the Securities and Exchange Commission. You are
cautioned not to place undue reliance on these forward-looking
statements, which are subject to numerous assumptions, risks and uncertainties, and which change
over time. These forward-looking statements speak only as of the date of this
presentation. Actual results may differ materially from those
expressed in or implied by any forward looking statements contained in this presentation. We assume
no duty to revise or update any forward-looking statements, except as required
by applicable law. Non-GAAP Financial Measures
In
addition
to
the
results
of
operations
presented
in
accordance
with
Generally
Accepted
Accounting
Principles
(GAAP),
FNB
management uses and this presentation contains or references, certain non-GAAP
financial measures, such as pre-tax, pre- credit &
non-recurring net income (PPNR), recurring non-credit, non-interest expense, net interest income on a fully taxable
equivalent
basis
and
tangible
shareholders
equity.
FNB
believes
these
non-GAAP
financial
measures
provide
information
useful to investors in understanding our underlying operational performance and our
business and performance trends as they facilitate comparisons with the
performance of others in the financial services industry. Although FNB believes that these
non-GAAP
financial
measures
enhance
investors’
understanding
of
FNB’s
business
and
performance,
these
non-GAAP
financial measures should not be considered an alternative to GAAP. The
non-GAAP financial measures contained within this
presentation
should
be
read
in
conjunction
with
the
audited
financial
statements
and
analysis
as
presented
in
FNB’s
Annual
Report on Form 10-K as well as the unaudited financial statements and analyses
as presented in FNB’s Quarterly Reports on Forms 10-Q. A
reconciliation of non-GAAP measures to the most directly comparable GAAP measure is included
as an appendix to this presentation. |
 4
Key Accomplishments
—
Related to anticipated inclusion in Russell 3000
—
2 million shares authorized
—
Expect to complete by late June
Commenced ATM Capital Raise
Continued execution of our key
priorities
—
Reduced problem assets by $6.6 million or 3.0%
—
Completed regrading of Bank of Granite portfolio
—
Continued implementation of “Back to Business”
strategies:
—
Grew loan portfolio by $27 million or 2.3%
—
Originated $31 million in residential mortgage loans
—
Reduced high rate CDs resulting in improved deposit mix
—
Developed phased integration plan for the banks
—
Key product, vendor and network decisions are complete
—
Integration and consolidation to occur in stages, beginning in
late summer; legal entity merger will occur later in process
—
PPNR of $62 thousand in 1Q 2012 vs $(5.0) million in 4Q 2011
—
Increased NIM by 19 bps from 4Q 2011, to 2.82%
PPNR breakeven in 1Q 2012 |
 5
Quarterly Operating Highlights
1Q 2012 net loss from continuing
operations of $10.8 million, 64.6%
decline in net loss from 4Q 2011 and
a 72.9% decline in net loss from 1Q
2011
1Q 2012 net loss to common
shareholders of $10.9 million
compared to net income to common
shareholders of $17.1 million in 4Q
2011
Non-recurring gain on retirement
of preferred stock, net of $47.8
million in 4Q 2011
Net loss per share of $0.51 in 1Q
2012 compared to $1.05 net income
per share in 4Q 2011; 4Q 2011
included $2.93 per share of
nonrecurring gain on retirement of
preferred stock
1Q 2012 reflects first full quarter of
Granite results
PPNR net income of $0.1 million in
1Q 2012 as compared to PPNR net
loss of $5.0 million in 4Q 2011
Quarterly Performance Metrics
Dollars in thousands except per share data
1Q 2012
4Q 2011
1Q 2011
Net loss from continuing operations
(10,832)
$
(30,628)
$
(40,015)
$
Net (loss)/income to common shareholders
(10,859)
17,090
(44,728)
(0.51)
(1.88)
(350.25)
Net (loss)/income to common shareholders per share
(0.51)
1.05
(391.50)
Return on average assets
(1.82%)
(5.31%)
(8.49%)
Return on average equity
(34.26%)
(89.31%)
NM
Net loss from continuing operations per share
Dollars in thousands except per share data
1Q 2012
4Q 2011
1Q 2011
Net (loss)/income to common shareholders
(10,859)
$
17,090
$
(44,728)
$
Less taxes, credit costs and nonrecurring items:
Taxes
(77)
(111)
(128)
Gain on retirement of preferred stock, net
-
47,792
-
Gain on extinguishment of debt
-
1,625
-
Other real estate owned expense
(5,519)
(19,966)
(16,186)
Provision for loan losses
(3,067)
(6,418)
(20,183)
Prepayment penalty on borrowings
-
(577)
-
Loss on sale of loans held for sale
-
(1,241)
-
Merger related expense
(2,258)
971
-
PPNR
1
62
$
(4,985)
$
(8,231)
$
1
Non-GAAP measure. This table reconciles to GAAP presentation.
Pre-tax, Pre-credit & Nonrecurring Net Income (Loss) ("PPNR")
1 |
 6
Quarterly Operating Results
Net interest income in 1Q 2012
increased $1.8 million (13%) to $15.2
million compared to 4Q 2011
Average yield on loans
stable at
5.59%
Average loans (including LHFS)
increased $69.9 million (6%),
average earning assets increased
$141.7 million (7%)
Provision expense declined $3.4 million
(52%) to $3.1 million in 1Q 2012 on
improving asset quality
Noninterest income declined $1.1
million on nonrecurring $1.6 million
gain on debt extinguishment in 4Q 2011
Noninterest expense declined $15.8
million (37%) in 1Q 2012 on $14.4
million decrease in OREO expenses
from 4Q 2011
Net interest margin improved 19 bps
from 2.63% in 4Q 2011 to 2.82%
Improved funding mix resulted in 21
bp decline in cost of liabilities
Excess cash positions invested at
low rates continue to depress net
interest margin
Quarterly Results
Results of Operations
Dollars in thousands, except per share data
1Q 2012
4Q 2011
1Q 2011
Net interest income
15,180
$
13,417
$
9,207
$
Provision for loan losses
(3,067)
(6,418)
(20,183)
Noninterest income
3,826
4,908
3,697
Noninterest expense
(26,848)
(42,646)
(32,864)
Net loss from continuing operations, net of taxes
(10,832)
(30,628)
(40,015)
Net loss from discontinued operations, net of taxes
(27)
(74)
(3,693)
Preferred stock gain and dividends, net
-
47,792
(1,020)
Net loss to common shareholders
(10,859)
$
17,090
$
(44,728)
$
(0.51)
$
1.05
$
(359.18)
$
Net loss to common shareholders per share
(0.51)
$
1.05
$
(391.50)
$
Weighted average basic and diluted shares outstanding
21,102,465
16,311,834
114,247
Quarterly Results
Average Balances, Yields and Net Interest Margin
Dollars in thousands
1Q 2012
4Q 2011
1Q 2011
Average loans (includes loans held for sale)
1,224,349
$
1,154,424
$
1,263,976
$
Average yield
5.59%
5.59%
4.19%
Average earning assets
2,170,079
2,028,332
1,779,099
Average yield
3.71%
3.75%
3.56%
Average interest bearing liabilities
1,999,005
1,910,164
1,751,343
Average rate
0.97%
1.18%
1.45%
Net interest margin
2.82%
2.63%
2.13%
Net interest rate spread
2.74%
2.56%
2.11%
This table includes discontinued operations.
Net loss to common shareholders from
continuing operations per share |
 7
Noninterest Expense
Noninterest expense declined $15.8
million (37%) from 4Q 2011
—
Q1 2012 results reflect first full
quarter of Granite expenses
—
OREO expense declined $14.4
million (72%)
—
Personnel expense increased $1.4
million (17%) primarily on the
addition of full quarter of Granite
expenses
—
Merger-related expenses
increased $3.2 million, primarily
on contract termination and
branch closure expense accruals
and merger expense reclassed to
professional fees in 4Q 2011
—
Professional fees declined by $1.9
million (59%) on the reclass in 4Q
noted above
Excluding OREO and loss on sale of
loan credit costs and non-recurring
merger and prepayment penalty
expenses, noninterest expense
declined by $2.8 million (13%)
Quarterly Results
Noninterest Expense
Dollars in thousands
1Q 2012
4Q 2011
1Q 2011
Personnel expense
9,987
$
8,547
$
6,494
$
Net occupancy expense
1,553
1,450
1,186
Furniture, equipment and data processing expense
1,976
1,868
1,607
Professional fees
1,264
3,117
1,239
Stationery, printing and supplies
141
154
120
Advertising and marketing
129
139
140
Other real estate owned expense
5,519
19,966
16,186
Credit/debit card expense
410
421
392
FDIC insurance
598
1,807
1,863
Loan collection expense
746
1,161
1,000
Merger-related expense
2,258
(971)
-
Prepayment penalty on borrowings
-
577
-
Loss on sale of loans held for sale
-
1,241
-
Core deposit intangible amortization
352
301
199
Other expense
1,915
2,868
2,438
Total noninterest expense
26,848
$
42,646
$
32,864
$
Other information:
Other real estate owned expense
5,519
$
19,966
$
16,186
$
Merger-related expense
2,258
(971)
-
Prepayment penalty on borrowings
-
577
-
Loss on sale of loans held for sale
-
1,241
-
Recurring non-credit noninterest expense
¹ 19,071
$
21,833
$
16,678
$
FTE Employees
627
609
497
1
Non-GAAP measure. This table reconciles to GAAP presentation.
|
 8
Balance Sheet
Total assets decreased $21.2 million
(1%)
—
Cash and interest bearing bank
balances decreased $84.9 million
(15%) on securities and loan
purchases
—
Investment securities increased
$42.6 million on securities
purchases
—
Net loans increased $27.2 million
(2%) on new origination and loan
purchases, including the purchase
of a high quality, short duration,
seasoned $62 million residential
mortgage portfolio during 1Q 2012
—
OREO decreased $5.8 million (5%)
on continued resolution and write
down activity
Deposits declined $9.0 million (0%)
—
Improved mix change from time
deposits to lower rate deposit
products
Balance sheet excludes reserved
deferred tax assets of $169 million,
including $34 million relating to the
Bank of Granite
Balance Sheet
Dollars in thousands
1Q 2012
4Q 2011
1Q 2011
Cash and interest bearing bank balances
468,549
$
553,416
$
147,659
$
Investment securities
473,916
431,306
366,274
Loans and loans held for sale, net
1,209,902
1,182,704
1,120,175
Other real estate owned
104,193
110,009
67,331
Intangible assets
12,030
12,082
3,975
Other assets
119,356
119,346
109,834
Assets from discontinued operations
-
245
12,692
Total assets
2,387,946
$
2,409,108
$
1,827,940
$
Deposits
2,120,081
$
2,129,111
$
1,661,972
$
Borrowings
123,400
123,910
213,865
26,491
25,980
16,650
-
1,092
3,157
Equity
117,974
129,015
(67,704)
Total liabilities and equity
2,387,946
$
2,409,108
$
1,827,940
$
Other liabilities
Liabilities from discontinued operations
Tangible Shareholders' Equity Rollforward
1
Tangible shareholders' equity, December 31, 2011
116,933
$
Total comprehensive loss
(10,129)
Expense related to 2011 issuance of common stock
(913)
Decrease in intangible assets, net
52
Stock compensation expense
1
Tangible shareholders' equity, March 31, 2012
105,944
$
1
Non-GAAP measure. See Appendix for reconciliation to GAAP
presentation. |
 9
Deposits
Deposits decreased $9.0 million (0.4%)
Continued improved deposit mix
profile via management actions
Indeterminate term core now
represents 53% of deposits, up
from 51% at year end 2011
Time deposits (including brokered
deposits) as a percentage of total
deposits declined from 49% at 4Q
2011 to 47% at 1Q 2012
Increased core deposits from 76% at
4Q 2011 to 77% of the total at 1Q
2012
Continued decline in cost of deposits
from 1.00% in 4Q 2011 to 0.91% in 1Q
2012
Deposits
Dollars in thousands
1Q 2012
4Q 2011
1Q 2011
Noninterest-bearing demand
256,445
$
234,673
$
156,728
$
Interest-bearing demand
364,512
349,802
230,000
Savings
72,446
68,236
44,843
Money market
437,738
431,790
290,397
Brokered
107,047
112,066
139,290
Time deposits < $100,000
508,604
538,306
409,137
Time deposits > $100,000
373,289
394,238
391,577
Total deposits
2,120,081
$
2,129,111
$
1,661,972
$
Deposit Product Mix
Dollars in thousands
1Q 2012
4Q 2011
1Q 2011
Noninterest-bearing demand
12%
11%
9%
Interest-bearing demand
17%
16%
14%
Savings
3%
3%
3%
Money market
21%
20%
17%
Time deposits < $100,000
24%
25%
25%
Core
77%
76%
68%
Brokered
5%
5%
8%
Time deposits > $100,000
18%
19%
24%
Total deposits
100%
100%
100%
Memo: Total time deposits
47%
49%
57% |
 10
Capital and Liquidity
Capital ratios at both banks
are above the level defined
as “well capitalized”
under
applicable law
Both banks, however, are
designated as “adequately
capitalized”
by their
regulators because they
remain subject to regulatory
orders
CommunityOne Bank and
Bank of Granite leverage
ratios are currently below
the levels required in
their respective
regulatory orders
The loans to deposits ratio
improved from 57% at
December 31, 2011 to 59% at
March 31. 2012
Capital and Liquidity Ratios
Well
Regulatory
1Q 2012
4Q 2011
1Q 2011
Capitalized
Orders
FNB United Corp
Leverage
6.22%
6.70%
(4.28%)
5.00%
N/A
Tier 1 risk based capital
10.53%
11.71%
(6.13%)
6.00%
N/A
Total risk based capital
12.93%
13.81%
(6.13%)
10.00%
N/A
Tangible common equity/Tangible assets
4.46%
4.88%
(3.93%)
N/A
N/A
Loans to deposits
59%
57%
72%
N/A
N/A
CommunityOne Bank
Leverage
6.86%
7.39%
(1.41%)
5.00%
9.00%
Tier 1 risk based capital
11.78%
13.23%
(2.02%)
6.00%
N/A
Total risk based capital
13.07%
14.52%
(2.02%)
10.00%
12.00%
Bank of Granite
Leverage
7.64%
7.19%
1 5.00%
8.00%
Tier 1 risk based capital
12.86%
12.04%
1 6.00%
N/A
Total risk based capital
12.92%
12.04%
1 10.00%
12.00%
1
FNB United Corp purchased Bank of Granite Corp and its bank subsidiary Bank of Granite
on October 21, 2011 |
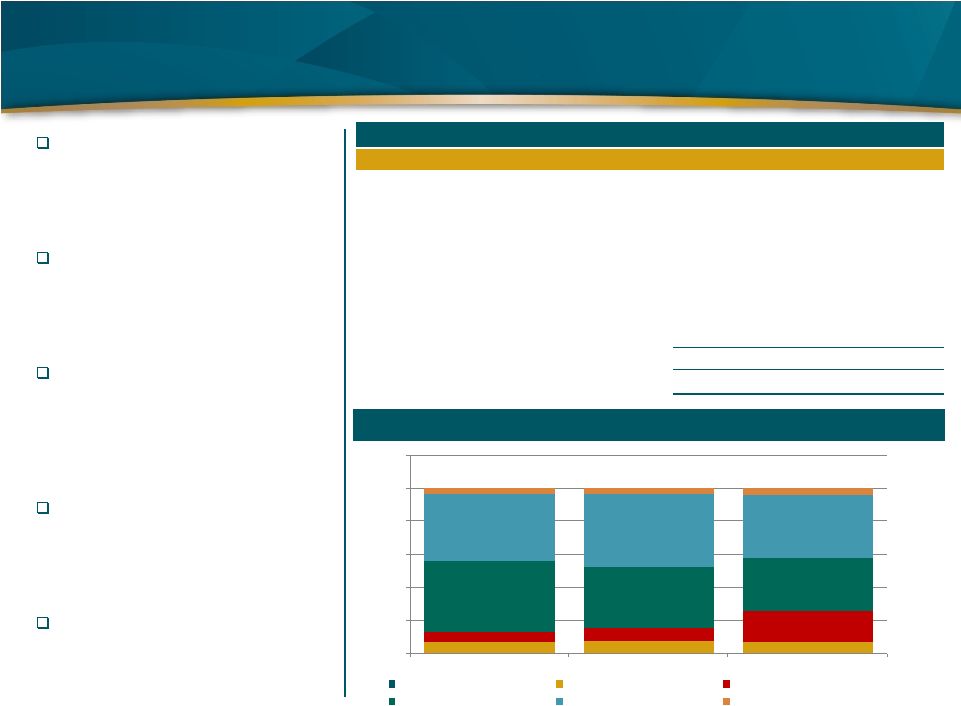 11
Loan Portfolio
Real Estate Construction loans have
been reduced 64% from last year and
15% during the quarter primarily due
to problem loan resolution
Bank of Granite loans were added in
the 4th quarter of 2011 and were
concentrated in Real Estate
Mortgage loans
Loan growth has been centered in
consumer residential mortgage
loans, including the purchase of a
high quality seasoned $62 million
portfolio during the first quarter
The company recorded net charge
offs of $2.6 million and OREO
expenses of $5.5 million during the
quarter
The company is staffed to address
$208 million of classified loans and
$104 million of OREO assets
Loan Portfolio Composition
Loan Portfolio
Dollars in thousands
1Q 2012
4Q 2011
1Q 2011
Loans held for sale
3,938
$
4,529
$
-
$
Loans held for investment:
Commercial and agricultural
85,475
95,089
84,869
Real estate-construction
79,122
92,806
222,284
Real estate-mortgage:
1-4 family residential
529,300
453,725
380,192
Commercial
508,067
531,383
453,690
Consumer
43,795
44,532
47,869
Total Loans held for investment
1,245,759
1,217,535
1,188,904
Total loans
1,249,697
$
1,222,064
$
1,188,904
$
7%
8%
7%
6%
8%
19%
42%
37%
32%
41%
43%
38%
0%
20%
40%
60%
80%
100%
120%
1Q 2012
4Q 2011
1Q 2011
Loans held for sale
Commercial and agricultural
Real estate-construction
1-4 family residential
CRE, OO and NOO
Consumer |
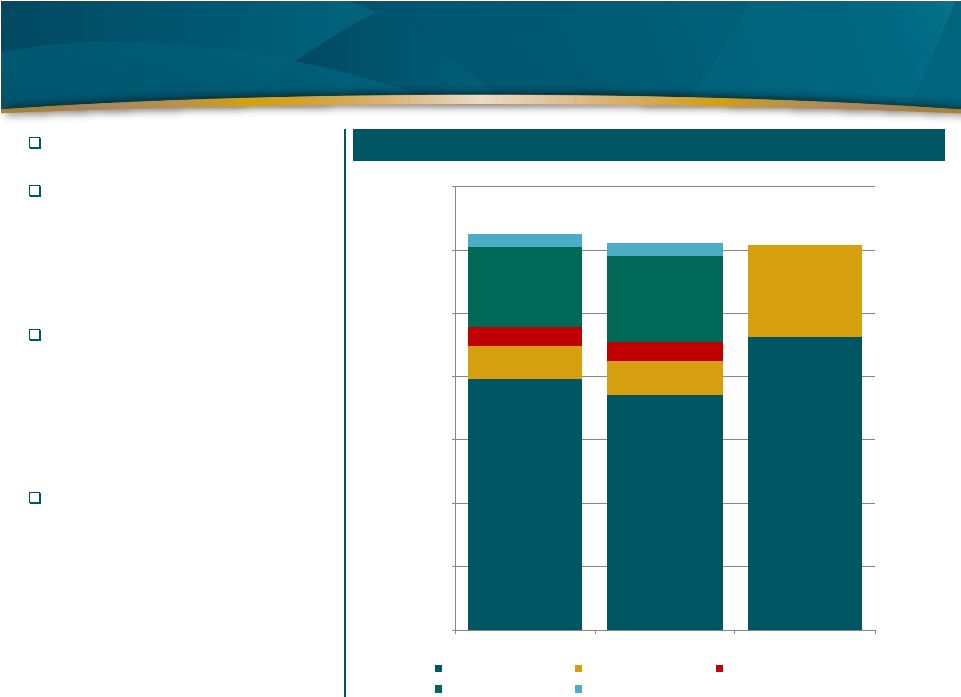 12
Allowance For Loan Losses
Nonperforming originated loans fell by
$0.6 million (0.6%) from 4Q 2011
Originated performing and
nonperforming loans are accounted for
under ASC 310-20
—
ALL established via provision, losses
recognized via charge-offs
—
1Q 2012 ALL of $39.8 million
Acquired performing loans are
accounted for under ASC 310-20
—
Subject to ALL as FV mark is
accreted
—
Recorded at FV at acquisition date,
unaccreted discount of $1.8 million
at March 31, 2012
Purchased loans, both performing and
impaired, are accounted for under ASC
310-30 (SOP-03-3)
—
Excluded from ALL; Deficit of
expected cash flows below carrying
value recorded as allowance and
may be charged off
—
Recorded at FV at acquisition date,
including $34.9 million non-
accretable difference
Loan Portfolio By ALL Methodology
$793
$742
$925
$105
$106
$293
$56
$63
$254
$269
$41
$41
$0
$200
$400
$600
$800
$1,000
$1,200
$1,400
1Q 2012
4Q 2011
1Q 2011
Originated
Originated nonperforming
Acquired impaired (PCI)
Acquired performing (PCI)
Acquired performing |
 13
Asset Quality
The allowance has been reduced over
the last year, from $69 million to just
under $40 million, reflecting an
improvement in asset quality
The remaining Day 1 fair value
adjustment on the acquired Granite
portfolio fell by $10 million as a result
of accretion and realization of
expected loss content
Non-performing loans have been
reduced to $105 million. Real Estate
Construction Loans remain the most
troubled category, but the level of
such loans has been substantially
reduced
Asset Quality
Dollars in thousands
1Q 2012
4Q 2011
1Q 2011
Allowance for Loan Losses (ALL)
39,795
$
39,360
$
68,729
$
Remaining Day 1 FV adjustment on Acquired Loans
20,661
30,642
-
Nonperforming loans/Total loans held for investment
8.5%
8.7%
24.6%
Nonperforming Assets/Total loans plus OREO
15.5%
16.3%
28.7%
Net charge-offs/Average loans
0.2%
1.0%
3.6%
ALL / Total loans
3.2%
3.2%
5.8%
ALL / Originated + Acquired Performing Loans
4.2%
4.4%
5.6%
Nonperforming Loans
NPL
% NPL
% of NPLs
Commercial and agricultural
4,259
$
5.0%
4%
Real estate - construction
23,383
29.6%
22%
Real estate - mortgage:
1-4 family residential
30,427
5.7%
29%
Commercial
46,825
9.2%
44%
Consumer
447
1.0%
0%
Total
105,341
$
8.5%
100% |
 14
Non-Performing Assets
Concentrations of non-performing
loans in the Real Estate Construction
and Commercial Real Estate Mortgage
loan categories have been largely
resolved
Many problem loans have been
migrated to OREO through
foreclosure. OREO peaked in 2011
but remains elevated
OREO dispositions have been
outpacing OREO additions
OREO assets are carried at fair value
less selling costs, and sometimes
adjusted further by management due
to age or other market criteria
As of March 31, $17 million of OREO
was under contract for sale and
carried at the net sales price
Nonperforming Loans
1Q 2012
4Q 2011
1Q 2011
Commercial and agricultural
4%
5%
4%
Real estate - construction
22%
32%
38%
Real estate - mortgage:
1-4 family residential
29%
25%
13%
Commercial
44%
38%
44%
Consumer
0%
0%
0%
Total
100%
100%
100%
Nonperforming Loans and OREO
Dollars in thousands
1Q 2012
4Q 2011
1Q 2011
Commercial and agricultural
4,259
$
4,941
$
10,970
$
Real estate - construction
23,383
34,051
112,345
Real estate - mortgage:
1-4 family residential
30,427
26,857
38,866
Commercial
46,825
39,874
129,978
Consumer
447
250
425
Total nonperforming loans
105,341
105,973
292,584
OREO, other foreclosed assets and disc ops assets
104,379
110,386
67,454
Total nonperforming assets
209,720
$
216,359
$
360,038
$ |
 Appendix |
 16
Non-GAAP Measures
Reconciles non-GAAP measures to
the most directly comparable GAAP
measure
Reconciliation of Non-GAAP Measures
Dollars in thousands
1Q 2012
4Q 2011
1Q 2011
Total shareholders' equity
117,974
$
129,015
$
(67,704)
$
Less:
Goodwill
(4,205)
(3,905)
-
Core deposit and other intangibles
(7,825)
(8,177)
(3,975)
Tangible shareholders' equity
105,944
$
116,933
$
(71,679)
$ |