Attached files
| file | filename |
|---|---|
| 8-K - FORM 8-K - Bausch Health Companies Inc. | d361306d8k.htm |
 Valeant Pharmaceuticals International, Inc.
Investor Presentation
May 2012
Exhibit 99.1 |
 Special Notice Regarding Publicly Available
Information
THE BORROWER HAS REPRESENTED AND WARRANTED TO THE ARRANGER THAT THE INFORMATION
IN THIS DOCUMENT DOES NOT CONSTITUTE OR CONTAIN ANY MATERIAL NON-PUBLIC
INFORMATION WITH RESPECT TO THE BORROWER OR THE TARGET OR ANY PARTY RELATED
THERETO (COLLECTIVELY, “PARTIES”) OR THEIR RESPECTIVE SECURITIES
FOR PURPOSES OF UNITED STATES FEDERAL AND STATE SECURITIES LAWS.
2
Note 1: The guidance in this presentation is only effective as of the date
given, May 3, 2012, and will not be updated or affirmed unless and until
the Company publicly announces updated or affirmed guidance.
|
 Forward-looking Statements
3
FORWARD-LOOKING STATEMENTS
CERTAIN STATEMENTS MADE IN THIS PRESENTATION MAY CONSTITUTE FORWARD-LOOKING STATEMENTS, INCLUDING,
BUT NOT LIMITED TO, STATEMENTS REGARDING THE CLOSING OF PENDING TRANSACTIONS, EXPECTED REVENUE AND
SYNERGIES, PRODUCT APPROVALS AND LAUNCHES AND FINANCIAL GUIDANCE FOR 2012. FORWARD-LOOKING
STATEMENTS MAY BE IDENTIFIED BY THE USE OF THE WORDS “ANTICIPATES,” “EXPECTS,” “INTENDS,” “PLANS,” “COULD,” “SHOULD,”
“WOULD,
” “MAY,”
“WILL,”
“BELIEVES,”
“ESTIMATES,”
“POTENTIAL,” OR
“CONTINUE” AND VARIATIONS
OR SIMILAR EXPRESSIONS. THESE STATEMENTS ARE BASED UPON THE CURRENT EXPECTATIONS AND
BELIEFS OF MANAGEMENT AND ARE SUBJECT TO CERTAIN RISKS AND UNCERTAINTIES THAT COULD CAUSE
ACTUAL RESULTS TO DIFFER MATERIALLY FROM THOSE DESCRIBED IN THE FORWARD-LOOKING STATEMENTS.
THESE RISKS AND UNCERTAINTIES INCLUDE, BUT ARE NOT LIMITED TO, RISKS AND UNCERTAINTIES
DISCUSSED IN THE COMPANY'S MOST RECENT ANNUAL OR QUARTERLY REPORT FILED WITH THE SECURITIES AND
EXCHANGE COMMISSION ("SEC") AND OTHER RISKS AND UNCERTAINTIES DETAILED FROM TIME TO
TIME IN THE COMPANY'S FILINGS WITH THE SEC AND THE CANADIAN SECURITIES ADMINISTRATORS
("CSA"), WHICH FACTORS ARE INCORPORATED HEREIN BY REFERENCE. READERS ARE CAUTIONED NOT
TO PLACE UNDUE RELIANCE ON ANY OF THESE FORWARD-LOOKING STATEMENTS. THE COMPANY UNDERTAKES NO
OBLIGATION TO UPDATE ANY OF THESE FORWARD-LOOKING STATEMENTS TO REFLECT EVENTS OR
CIRCUMSTANCES AFTER THE DATE OF THIS PRESENTATION OR TO REFLECT ACTUAL OUTCOMES.
NON-GAAP INFORMATION
TO SUPPLEMENT THE FINANCIAL MEASURES PREPARED IN ACCORDANCE WITH GENERALLY ACCEPTED
ACCOUNTING PRINCIPLES (GAAP), THE COMPANY USES NON-GAAP FINANCIAL MEASURES THAT EXCLUDE
CERTAIN ITEMS, SUCH AS AMORTIZATION OF INVENTORY STEP-UP, STOCK-BASED COMPENSATION
STEP-UP, RESTRUCTURING AND ACQUISITION- RELATED COSTSTBD, ACQUIRED IN-PROCESS
RESEARCH AND DEVELOPMENT ("IPR&D"), LEGAL SETTLEMENTS, AMORTIZATION AND OTHER
NON-CASH CHARGES, AMORTIZATION OF DEFERRED FINANCING COSTS, DEBT DISCOUNTS AND ASC
470-20 (FSP APB 14-1) INTEREST, LOSS ON EXTINGUISHMENT OF DEBT, AND (GAIN) LOSS ON INVESTMENTS, NET, AND
ADJUSTS TAX EXPENSE TO CASH TAXES. MANAGEMENT USES NON-GAAP FINANCIAL MEASURES INTERNALLY FOR
STRATEGIC DECISION MAKING, FORECASTING FUTURE RESULTS AND EVALUATING CURRENT PERFORMANCE. BY
DISCLOSING NON-GAAP FINANCIAL MEASURES, MANAGEMENT INTENDS TO PROVIDE INVESTORS WITH A
MEANINGFUL, CONSISTENT COMPARISON OF THE COMPANY’S CORE OPERATING RESULTS AND TRENDS FOR THE PERIODS PRESENTED.
NON-GAAP FINANCIAL MEASURES ARE NOT PREPARED IN ACCORDANCE WITH GAAP; THEREFORE, THE INFORMATION
IS NOT NECESSARILY COMPARABLE TO OTHER COMPANIES AND SHOULD BE CONSIDERED AS A SUPPLEMENT TO,
NOT A 2012
FIRST
QUARTER
FINANCIAL
RESULTS
FOR
2012,
WHICH
CAN
BE
FOUND
AT
www.valeant.com. SUBSTITUTE FOR,
OR SUPERIOR TO, THE CORRESPONDING MEASURES CALCULATED IN ACCORDANCE WITH GAAP.
FURTHER RECONCILIATIONS ARE ALSO AVAILABLE IN THE COMPANY’S PRESS RELEASE DATED MAY 3, 2012, REPORTING ITS
|
 Agenda
Executive Summary & Transaction Overview
Business Overview
Key Investment Considerations
Historical Financial Overview
Questions and Answers
4 |
 Transaction Overview |
 6
Transaction Overview
Valeant
Pharmaceuticals
International,
Inc.
(“Valeant”
or
the
“Company”)
is
a
multinational
specialty
pharmaceutical company with a diverse global product portfolio
Valeant has continued to demonstrate strong financial performance
For the LTM period ended March 31, 2012, the Company generated $2,755 million of
revenue and $1,876
million
of
adjusted
EBITDA
1
The
Company
expects
2012
revenue
of
$3.4
-
$3.6
billion
Low
effective
tax
rate
and
capex
resulted
in
free
cash
flow
of
$886
million
2
for
2011
and
$311
million
2
for the 3 months ended March 31, 2012
Valeant is planning to syndicate a new $500 million incremental Senior Secured
Term Loan B Facility (“Term Loan B”) to repay borrowings under
its revolving credit facility and for general corporate purposes, including
acquisitions This will allow Valeant to maintain adequate liquidity and
financial flexibility Pro
forma
senior
secured
leverage
will
be
1.7x
3
(synergy
adjusted)
and
total
leverage
will
be
3.9x
3
(synergy adjusted) based on LTM March 31, 2012 pro forma adjusted EBITDA of $1,876
million Shortly
after
the
funding
date
the
company
expects
to
complete
a
recently
commenced
restructuring of certain foreign subsidiary ownership.
Upon completion of the international
restructuring, substantially all of the IP rights will be held by newly-formed
Luxembourg, Ireland and Bermuda subsidiaries of VPII, each of which shall
become guarantors of the senior credit facilities and pledge all or
substantially all of their assets to secure those guarantees 6
¹
EBITDA adjusted for one-time items including acquired in-process R&D,
restructuring costs, legal settlements, acquisition-related costs, impairment costs, and other one-
time
items;
pro
forma
to
reflect
the
full
LTM,
synergized
impact
of
Elidel,
Dermik,
Sanitas,
Ortho
Dermatologics,
Afexa,
iNova,
Gerot
Lannach,
Probiotica,
Natur
Produkt,
University
Medical,
Atlantis,
Pedinol,
and
EyeTech
acquisitions.
Additional
details
on
pg.
37.
2
Not pro forma for the full LTM synergized impact of Elidel, Dermik, Sanitas, Ortho
Dermatologics, Afexa, iNova, Gerot Lannach, ProBiotica, Natur Produkt, University
Medical, Atlantis, Pedinol, and EyeTech acquisitions.
3
Net of $150 million in cash |
 7
Sources and Uses
($ in millions)
Sources
Incremental Term Loan B
$500
Total Sources
$500
Uses
Cash to Balance sheet for General Corporate
Purposes, Including Acquisitions
$230
Revolver Repayment
70
Natur Produkt Acquisition
180
OID, Fees and Expenses
20
Total Uses
$500 |
 8
¹
EBITDA adjusted for one-time items including acquired in-process R&D,
restructuring costs, legal settlements, acquisition-related costs, impairment costs, and other one-
time
items;
pro
forma
to
reflect
the
full
LTM,
synergized
impact
of
Elidel,
Dermik,
Sanitas,
Ortho
Dermatologics,
Afexa,
iNova,
Gerot
Lannach,
Probiotica,
Natur
Produkt,
University Medical, Atlantis, Pedinol, and EyeTech acquisitions.
2
Estimated cash balance as of May 2012 pro forma for the transaction.
3
Reflects repurchase activity between March 2012 and May 2012.
4
In the 3 month period ended March 31, 2012 the Company repurchased $1.1 million
principal amount of its 5.375% senior convertible notes due 2014 for a purchase price
of $4.0 million. Convertible debt balance inclusive of unamortized discount.
5
Based upon closing price on 22-May-2012.
Note: Leverage multiples are calculated based on total debt net of $150 million of
cash and cash equivalents per the credit agreement definition. Pro Forma
Capitalization ($ in millions)
03-31-2012
Amount
05-31-2012E
PF Amount
% of
Capitalization
x LTM
3/31/2012
PF EBITDA¹
Coupon
Maturity
Cash²
$330
$407
Revolver ($275 million)
0
0
L+275
April 20, 2016
Term Loan A
2,160
2,160
L+275
April 20, 2016
Term Loan B
591
591
L+275
February 13, 2019
New Term Loan B
500
TBD
February 13, 2019
Total Senior Secured Debt
$2,751
$3,251
15%
1.7x
6.500% Senior Unsecured Notes³
916
916
6.500%
2016
6.750% Senior Unsecured Notes
498
498
6.750%
2017
6.875% Senior Unsecured Notes³
939
939
6.875%
2018
7.000% Senior Unsecured Notes
686
686
7.000%
2020
6.750% Senior Unsecured Notes
650
650
6.750%
2021
7.250% Senior Unsecured Notes
541
541
7.250%
2022
5.375%
BVF
Convertible
Notes
18
18
5.375%
2014
Total Debt
$6,999
$7,498
34%
3.9x
Market
Capitalization
14,618
14,618
Total Capitalization
$21,614
$22,314
100%
3/31/2012 LTM Pro Forma Adjusted EBITDA¹
$1,876
4
5 |
 9
Key Transaction Highlights
Focused
R&D
Spend
with
Strong
Pipeline
of
Future
Products
Capital Structure with Significant Equity Value &
Modest Leverage
Diversified Specialty Pharmaceutical Company
Strong Management Team
Significant Free Cash Flow Generation
9
Uniquely Positioned Product Portfolio
Favorable Industry Dynamics
Successful Integration Track Record |
 Business Overview |
 11
Overview of Valeant
Headquartered in Montreal, Quebec, Valeant is a multinational specialty
pharmaceutical company with a diverse global product portfolio
The Company has over 900 products and over 5,800 SKUs, with no product
contributing more than 10% of total revenue
In September 2010, Valeant Pharmaceuticals International underwent a
transformative merger
with
Biovail,
creating
a
“New
Valeant”
(the
“Company”)
with
expanded
scale
and
global presence
For the LTM period ended March 31, 2012, the Company generated $2,754 million of
revenue and $1,876 million of adjusted EBITDA
1
The Company’s specialty pharmaceutical, branded generics and OTC
products are divided into four main business lines
2
:
U.S. Dermatology –
Branded pharmaceutical and OTC dermatology products
U.S. Neurology and Other –
Branded neurology products and OTC products
Canada and Australia –
Branded and generic Pharmaceutical and OTC products
Emerging
Markets
–
Branded
generic
pharmaceutical
products
historically
sold
primarily in Europe (Poland, Serbia, Hungary, Croatia and Russia), Latin America
(Mexico, Brazil and exports out of Mexico), South East Asia and South
Africa 11
¹
EBITDA adjusted for one-time items including acquired in-process R&D,
restructuring costs, legal settlements, acquisition-related costs, impairment costs, and other one-
time
items;
pro
forma
to
reflect
the
full
LTM,
synergized
impact
of
Elidel,
Dermik,
Sanitas,
Ortho
Dermatologics,
Afexa,
iNova,
Gerot
Lannach,
Probiotica,
Natur
Produkt,
University
Medical,
Atlantis,
Pedinol,
and
EyeTech
acquisitions.
Please
see
schedule
on
page
37.
2
New segment reporting effective the first quarter of 2012
|
 12
Valeant’s Operating Philosophy
Low cost operating structure
Minimal headquarters staff
All managers work in addition to manage, including CEO
True performance-based pay
Don’t bet on science,
bet on management
Avoid discovery
Litmus test all development efforts through partnering
Low cost, low risk programs –
singles and doubles, not home runs
Invest in branded, generic,
and OTC across select attractive
geographies
Not overly dependent on any one product or geography
Manage our risk -
avoid gambling on new chemical entities (NCEs)
Acquiring under managed companies with marketed products has
higher returns than traditional R&D
Avoid the big guys in the areas
where they are strong
Broad
indications
in
high
profile
therapeutics
areas
–
cardiovascular,
oncology, vaccines
Countries –
U.S., Western Europe, Japan, China
Primary care, building new diseases, blockbuster categories
Do not fall in love with your assets –
be willing to sell, partner, shut down
Big pharma overpays for scarce “strategic”
assets
Ultimate scorecard is shareholder return
If an asset is worth more to someone else, recognize it
12 |
 13
Valeant’s Operating Philosophy (cont.)
Be prudent about investing
ahead of need –
curse of the industry
Spending on future indications before drug is approved
Building sales force—which is a commodity—ahead of demand
Infrastructure
–
either
geographic,
corporate
Business Development is a
CEO and line responsibility
Deployment of capital is most important decision for CEO and Board
Line management should be involved and select, negotiate, own and
be held accountable for deals
Change is good –
management
change quickly in underperforming
units
Reinforces
accountability
–
both
in
and
beyond
unit
New ideas, new energy
Speed and lack of bureaucracy is the
greatest advantage for a small
company
Clear accountabilities, clear strategy
Clear performance metrics
No excuses culture
Embrace fact-based decision-making
Positional power if not accompanied by open-mindedness, smarts,
and track record is dangerous
Facts trump opinion
Meritocratic culture
13 |
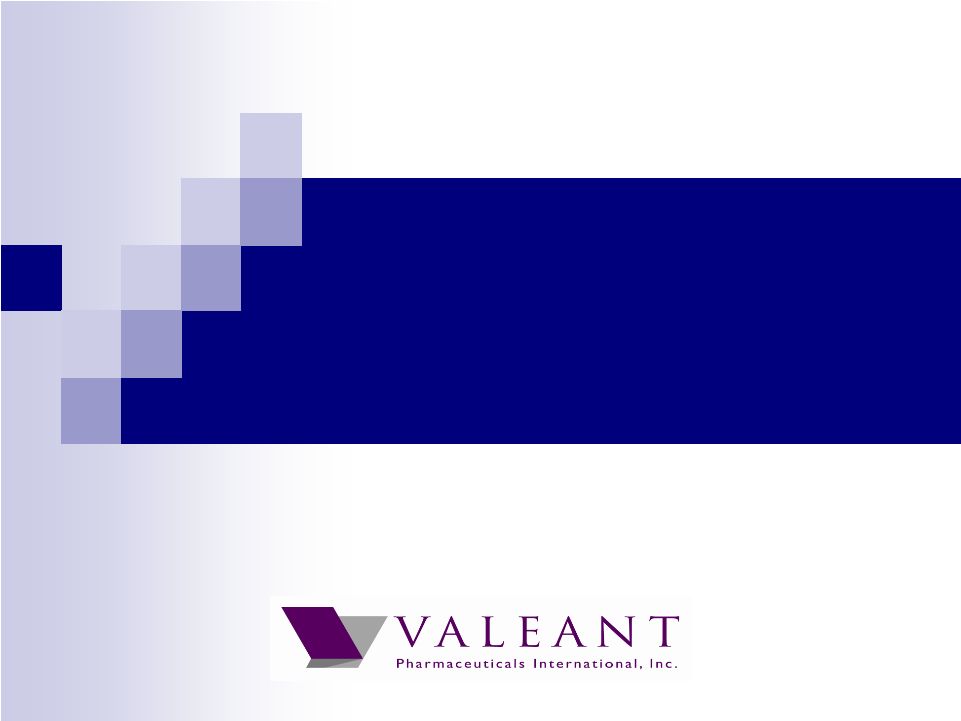
 14
Valeant’s Key Marketed Products
Dermatology
14
Products focused on patients suffering from actinic
keratoses, skin cancer, acne, psoriasis, skin-aging
and pigmentation
Platform has grown through the acquisitions of Vital
Science, Dermik, Ortho Dermatologic, Elidel and
Zovirax over the past several years
24% organic product sales growth in Q1 2012
Neurology
Targets neurological diseases such as epilepsy,
migraines, depression, chronic pain, Huntington’s
disease, Parkinson’s disease and orphan diseases
6% organic product sales growth in Q1 2012
(excluding Welbutrin XL, Cardizem CD and Ultram
ER)
Branded Generics in Emerging Markets
Branded generics business develops, markets and
manufactures products that are equivalent to their brand
name counterparts
Robust pipeline of over 250 new product launches
Emerging markets area of high focus, with 12% organic
growth in Q1 2012
Platform has grown through recent acquisitions of Natur
Produkt and Gerot Lannach in Russia, as well as
Probiotica in Brazil
Product Sales by Segment
1
Q1 2012
Q1 2011
¹
Q1 2012 total revenue of $856 million and Q1 2011 revenue of $565 million. The
percentages exclude dermatology divestiture in Q1 2012 of $66m and $36m in Q1 2011.
Canada
and
Australia
17%
Emerging
Markets
31%
U.S.
Dermatology
28%
U.S.
Neurology
24%
U.S.
Neurology
38%
Emerging
Markets
23%
U.S.
Dermatology
27%
Canada
and
Australia
12% |
 15
15
Geographic Diversity
Tailored Market Approach by Region
¹
Q1 2012 total revenue of $856 million and Q1 2011 revenue of $565 million. The
percentages exclude dermatology divestiture in Q1 2012 of $66m and $36m in
Q1 2011. Valeant Canada
Specialty Pharma
Valeant US
Specialty Pharma
Valeant Latin America
Branded Generics
Valeant Latin America
Branded Generics
Valeant South Africa
Specialty Pharma
Valeant Australia
Specialty Pharma
Valeant South East Asia
Specialty Pharma
Valeant Europe
Branded Generics |
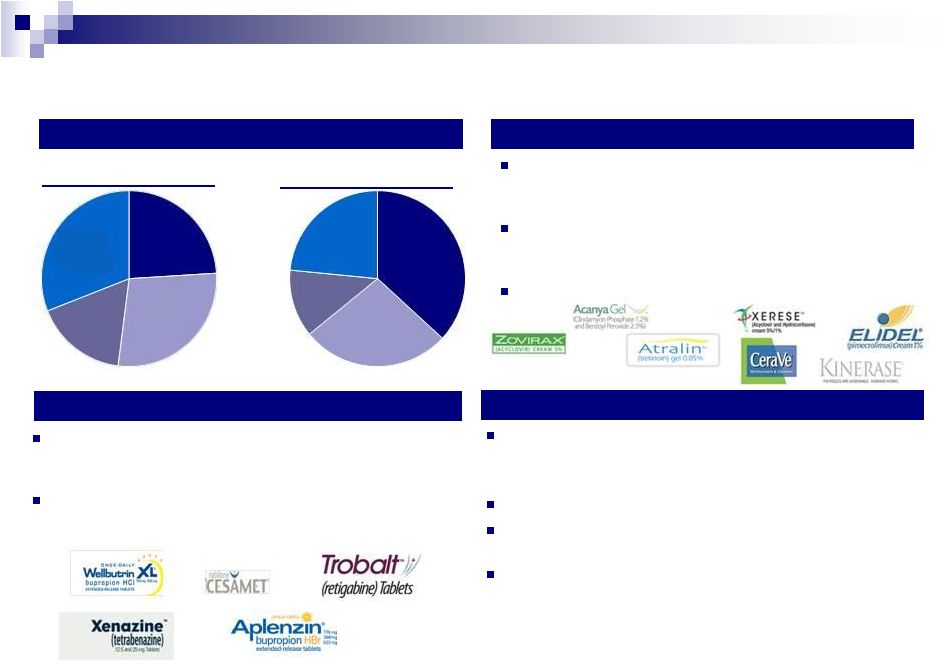
 16
Consistent Financial Performance
($ in millions)
Note: Historical financials for Valeant exclude certain pro forma run rate
adjustments for completed acquisitions for which financials have not been made publicly available.
¹
EBITDA adjusted for one-time items including acquired in-process R&D,
restructuring costs, legal settlements, acquisition-related costs, impairment costs and other one-
2
Adjusted for one-time items and stock-based compensation expense included
in SG&A. 16
Q1 2012 organic product growth of 11%
Strong organic growth across key dermatology brands
$157
$143
$336
$1,125
$1,326
$1,535
$690
$657
$830
$1,928
$2,463
$2,755
FY 2007A
FY 2008A
FY 2009A
FY 2010A
FY 2011A
LTM 31-Mar-2012
EBITDA
Revenue
R&D (% of Revenue)
Feb-08: Mr. Michael Pearson hired
as CEO of Legacy Valeant
Sep-2010: Transformative merger
of Legacy Valeant with Biovail
time items.
SG&A
(%
of
Revenue)
EBITDA
Margin
1
2
58%
14%
42%
13%
42%
5%
31%
6%
23%
3%
23%
3%
22%
56%
54%
40%
22%
23% |
 2012
YTD Achievements Successful acquisition agenda
Announced 9 transactions year to date
~$625 million in total purchase price; averaged <2.0x sales
Expanded growth platforms in Russia and Brazil
Multiple integrations completed and ongoing
Several underway: Europe, US Dermatology and Australia
R&D productivity and product launches
Late stage successes: IDP-108
Robust regional programs
100+ new OTC and Branded Generics products approved/launched in ex-US
markets Working Capital Improvement
Improved from 35% of LTM revenue in Q4 11 to 30% of LTM revenue in Q1 12
Inventory increased vs Q4 due to stock build related to tech transfers (Brazil,
U.S.)
Securities Repurchase Program
Repurchased over 5.26 million common shares for an aggregate purchase price
of $281 million; 316 million fully diluted share count as of March 31, 2012
17 |
 New
Product Pipeline Geography
Key Pipeline Highlights
US/Global
•
IDP 108: Onychomychosis (PIII)
•
IDP 107: Oral acne (PII)
•
IDP 118: Psoriasis (PI)
•
Multiple life cycle management
Canada
•
Opana: Pain
•
Multiple OTC programs
Australia
•
Opana: Pain
•
Ziana: Acne
•
Multiple OTC programs
•
iNova pipeline: Rx, OTC, Branded Generics
Central and Eastern Europe
•
200+ Branded Gx and OTC products
•
25+ representation products
Latin America
•
50+ branded Generics and OTC products
South East Asia / South Africa
•
iNova pipeline: Rx, OTC, Branded Generics
18 |
 Acquisition Updates
Announced YTD 2012
Swiss Herbal Remedies (Canada) –
(Expected to close by June)
Probiotica (Brazil) –
Closed
EyeTech (U.S.) –
Closed
Pele Nova (Brazil) –
Closed
Pedinol (U.S.) –
Closed
Natur Produkt (Russia) –
(Expected to close mid-year)
Gerot Lannach (Russia) –
Closed
Atlantis (Mexico) –
Closed
AcneFree (U.S.) –
Closed
Other Transactions
Divested Bioskin
Acquired assets –
Ortho Dermatologics –
Canada
Acquired assets –
Ortho Dermatologics –
Brazil
19
Total Purchase Price =
~$625 million
Expected 2012 Revenue Run Rate =
~$280 million
Sales Multiple Paid =
<2.0x
As part of our business strategy, we pursue acquisitions as opportunities arise.
We are actively evaluating and engaging in discussions concerning potential
acquisition targets, some of which could occur in the near term and/or could
be material |
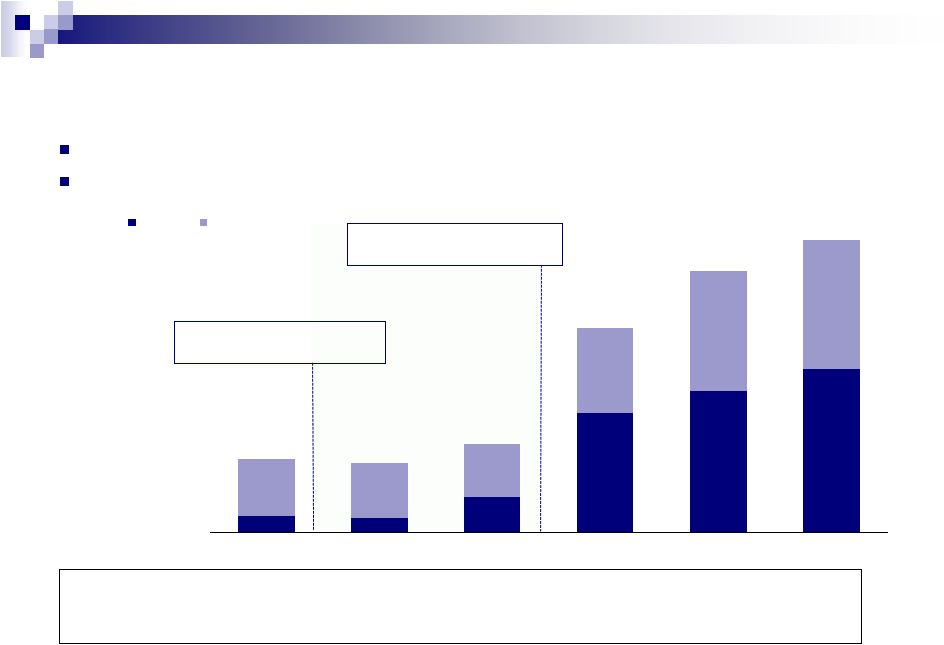
 Progress on 2012 Synergy Program
20
Run rate
expected by mid-
year
Run Rate
May 3, 2012
$200 million
$165 million
Run Rate
Feb 23, 2012
$135 million
Run rate
expected by Year-
end
$230+ million*
* Includes acquisitions announced and closed in 2012 |
 Annual Financial Guidance for 2012
21
Previous Guidance
Revenue $3.1 -
$3.4 billion
$3.95 -
$4.20 Adjusted Cash
EPS
> $1.2 billion in Adjusted
Cash Flow from Operations
As of May 3, 2012*
Revenue > $3.4 -
3.6 billion
$4.45 -
$4.70 Adjusted Cash
EPS
> $1.4 billion in Adjusted
Cash Flow from Operations
*
Earnings
guidance
as
of
the
given
date
of
May
3
,
2012
only.
Please
see
Note
1.
rd |
 Investment Considerations |
 23
Key Transaction Highlights
Focused
R&D
Spend
with
Strong
Pipeline
of
Future
Products
Capital Structure with Significant Equity Value &
Modest Leverage
Diversified Specialty Pharmaceutical Company
Strong Management Team
Significant Free Cash Flow Generation
23
Uniquely Positioned Product Portfolio
Favorable Industry Dynamics
Successful Integration Track Record |
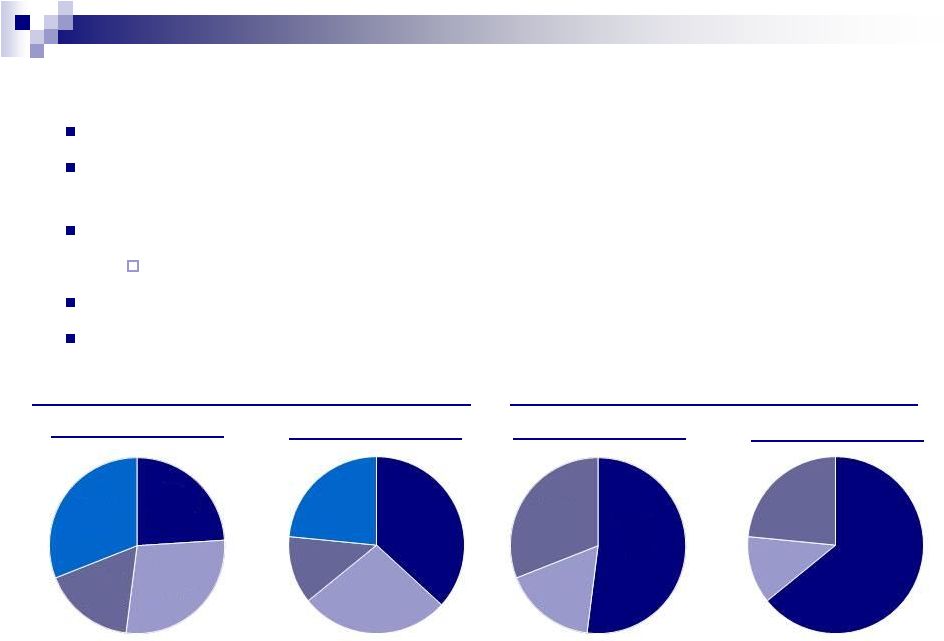 Q1
2011 Diversified Specialty Pharmaceutical Company
More than 900 products marketed with over 5,800 SKUs
Vast array of therapeutic categories including neurology, dermatology, and a broad
generics business
Highly diversified revenue stream
No product contributing more than 10% of total revenue
Limited near term patent and U.S. healthcare reform risk
Broad geographic distribution further enhanced by recent acquisitions
24
Product
Sales
by
Segment
1
Product
Sales
by
Geography
1
Q1 2012
Q1 2011
Q1 2012
¹
Q1 2012 total revenue of $856 million and Q1 2011 revenue of $565 million. The
percentages exclude dermatology divestiture in Q1 2012 of $66m and $36m in Q1
2011.
Canada
and
Australia
17%
Emerging
Markets
31%
U.S.
Dermatology
28%
U.S.
Neurology
24%
United
States
52%
Canada
and
Australia
17%
Emerging
Markets
31%
U.S.
Neurology
38%
Emerging
Markets
23%
U.S.
Dermatology
27%
Canada
and
Australia
12%
Emerging
Markets
23%
United
States
65%
Canada
and
Australia
12% |
 Uniquely Positioned Product Portfolio
Product portfolio contains few products that necessitate large R&D or
promotional spend Existing marketed products and sizeable generics business
mitigate the risk of market share erosion due to generic competition
25
Product Segment
Comments
Emerging Markets
Central Europe
Latin America
South Africa
Southeast Asia
Highly diversified product mix with >500 products
No patent expiry risk
Robust pipeline of >250 new product launches
Dermatology
Zovirax
Topical cream and ointment for the treatment of herpes
Off
patent
since
1997
and
still
retains
a
majority
of
the
market
share
for
the
treatment
of
topical
herpes
As a topical, it is difficult to demonstrate bioequivalence, hindering the
development of a competing generic product Neurology
Wellbutrin XL
Antidepressant drug which has been off patent for several years yet still retains
strong market position in the U.S. Ability to stay ahead of the generic
erosion curve has been attributed in part to concerns about generics having potentially differing
efficacy to the branded version
Considerable brand loyalty among physicians has developed as it tends to be a
3rd/4th line treatment for depression Xenazine
Approved
in
the
U.S.
for
the
treatment
of
chorea
associated
with
Huntington’s
disease;
Only
approved
treatment
in
the
U.S.
-
commands premium pricing and extended IP leverage through its orphan drug
designation Sold in the U.S. through Lundbeck and in Canada (brand name
Nitoman, where it is also approved for other indications) OTC and Other
CeraVe
OTC skin care line continues to see significant growth; CeraVe grew 52% YoY in
2011 versus 2010 Frequently ranked as the most recommended skin care product
by dermatology nurses (over 70% of the time) 2012
2013
2014
2015
2016
Products
1) Benzaclin
None
1) Atralin
1) Xenazine
2) Acanya
1) Retin-A Micro
2) Elidel
Total 2011
Revenue
~$76 million
$0
~$25 million
~$140 million
~$150 million
US Patent Exposure |
 26
Favorable Industry Dynamics
Large and growing market
2010 Global pharmaceutical market sales of $875 billion
Market
expected
to
grow
at
a
3
-
6%
compound
rate
to
~$1.1
trillion
by
2015
Aging demographics will continue to drive global healthcare spend
Near-term opportunities for generic and specialty pharmaceutical
companies Branded Generics / OTC
Global
generic
spend
is
expected
to
grow
at
a
13.1%
CAGR
through
2015,
driven
by
both
emerging
markets
and
developed
markets
working
to
reduce
healthcare expenditure
Selected Specialty Areas (ex. Dermatology, Oncology and Pain)
Emerging Markets
Pharmaceutical sales in key emerging markets are expected to nearly double
in sales, adding $150 billion by 2015
Limited patent risk
26
Source: IMS Health and Wall Street Research
1
Inclusive of anti-depressants and mood stabilizers.
|
 27
Focused R&D Spend with Targeted Pipeline of
Future Products
Valeant’s
“Leveraged
R&D”
allows
the
company
to
progress
development
programs
while
limiting
R&D
spend
and
increasing
the
probability
of
success
and effectiveness
for the compounds in its pipeline
The Company strategically partners and in-licenses products, annual R&D
expenditure ~3% of sales
Valeant has a strong history of effective partnerships and in-licensing
Potiga / Trobalt
1
partnership with GSK
Licensing agreements with Meda on Elidel, Xerese, etc
¹
Trobalt is now referred to as Potiga in the United States; Trobalt remains the
brand name for territories outside the United States. 27
|
 28
Successful
Integration Track
Record
Proven integration process drives significant synergies and improved
organic growth
The senior management team has significant experience managing
integrations, having completed ~30 product and / or company acquisitions of
various sizes over the past 4 years, including:
Most notably, Valeant’s merger with Biovail which closed in September
2010 demonstrated synergy realization well ahead of schedule
AcneFree
Atlantis
Aton Pharma
Delta
Biovail / Valeant Merger
Bunker
Coria Labs
Dermatech
Dermik Laboratories
Dow Pharmaceutical Sciences
EMO-FARM
EyeTech
Gerot Lannach
iNova
Laboratoire Dr. Renaud
Natur Produkt
Ortho Dermatologics
Pedinol
Pele Nova (minority stake)
PFI
PharmaSwiss
Probiotica
Sanitas
Swiss Herbal Assets
Tecnofarma
Vital Science
Zovirax
Nov-2010 Estimate
Jan-2011 Estimate
Current Estimate
Full Year Run Rate
$300 million
$300 million
$350 million
Time to Achieve
End of 2012
End of 2012
End of 2012
2011 P&L Impact
$200 million +
$250 million +
$300 million + |
 Significant Free Cash Flow Generation
Valeant’s top-line growth, high operating
margins, modest capital expenditures and
working capital requirements result in
significant free cash flow generation
2011 Free Cash Flow of $866 million
(excluding synergies)
Pro forma free cash flow supported by
efficient corporate structure (low corporate
cash tax rate < 10%)
Limited capital needs
2011 capital expenditures of ~$48
million
Note: Historical financials for Valeant exclude certain pro forma run rate
adjustments for completed acquisitions for which financials have not been made publicly available.
1
Free
Cash
Flow
defined
as
operating
cash
flow
less
capital
expenditures.
Not
pro
forma
for
the
full
LTM
synergized
impact
of
Elidel,
Dermik,
Sanitas,
Ortho
Dermatologics,
Afexa, iNova, Gerot Lannach, ProBiotica, Natur Produkt, University Medical,
Atlantis, Pedinol, and EyeTech acquisitions. 29
Ability to Generate Cash
Valeant’s ability to generate cash will enable it to pay down debt while
providing the financial flexibility to continue to invest in its
business $482
$434
$740
$1,103
$1,268
$1,487
$64
$39
$27
$22
$59
$48
FY 2007A
FY 2008A
FY 2009A
FY 2010A
FY 2011A
LTM 31-
Mar-
2012
EBITDA-CapEx
CapEx
1 |
 $21,709
$3,251
$7,498
Enterprise Value
Debt
Secured Debt
Total Debt
Capital Structure with Significant Equity Value
and Modest Leverage
($ in millions)
Conservatively capitalized with total debt to capitalization of 34%
Pro Forma Senior Secured Leverage of 1.7x and Total Leverage of 3.9x
1
Market capitalization as of 22-May-2012.
2
Debt balances pro forma for proposed $500 million capital raise
30
Specialty Pharma Landscape
Significant Enterprise Value Coverage
~6.7x
Coverage
~2.9x
Coverage
$28,091
$16,624
$14,618
$9,404
$9,075
$8,768
$5,169
$4,073
Allergan
Shire
Valeant
Mylan
Watson
Forest
Warner
Chilcott
Endo
1
2 |
 31
Experienced Management Team
31
Valeant has a strong management team with substantial industry experience
Valeant is led by Chairman and Chief Executive Officer J. Michael Pearson
Pearson previously served as Head of the Global Pharmaceutical Practice and head
of the Mid- Atlantic region of McKinsey & Company
Over
a
23-year
career,
he
has
worked
with
leading
Chief
Executive
Officers
and
was
an
integral
driver of major turnarounds, acquisitions and corporate strategy
J. Michael Pearson
Chairman of the Board and Chief
Executive Officer
Appointed Chairman and CEO of Legacy Valeant in February 2008
Prior to joining, Mr. Pearson was a Director at McKinsey & Company
Prior
McKinsey
positions
include:
McKinsey's
Board
of
Directors,
head
of
the
global
Pharmaceutical
Practice and head of McKinsey's mid-Atlantic region
Howard Schiller
Executive Vice President and Chief
Financial Officer
Mr. Schiller joined Valeant in December 2011
Prior to joining, Mr. Schiller was Chief Operating Officer for the Investment
Banking Division at Goldman Sachs, responsible for the management and
strategy of the business During his 24 years at Goldman Sachs, Howard
advised large multinational companies on strategic transactions,
financings, restructurings, and leveraged buyouts Rajiv De Silva
President and Chief Operating Officer of
Specialty Pharmaceuticals
Mr. De Silva joined Legacy Valeant in January 2009
Previously, Mr. De Silva held various leadership positions with Novartis AG
including President, Novartis Vaccines USA and Head, Vaccines of the
Americas Mr. De Silva was previously a partner at McKinsey, focused on the
pharmaceutical industry Robert Chai-Onn
Executive Vice President, General
Counsel & Corporate Secretary
Mr. Chai-Onn joined Legacy Valeant in 2004 as Vice President, Assistant
General Counsel Prior to joining Valeant, he was a corporate lawyer at the
law firm of Gibson, Dunn & Crutcher LLP Brian Stolz
Executive Vice President &
Chief Human Capital Officer
Mr. Stolz joined Valeant in July 2011
Prior to joining Valeant, he was a Principal at ghSMART and a consultant at
McKinsey & Co. |
 Historical Financial Overview |
 Adjusted
EBITDA
–
CAPEX
1
33
33
Pro Forma Financial Review
($ in millions)
Revenue
Adjusted EBITDA
1
Source: Public Company Filings
Note: Historical financials for Valeant exclude certain pro forma run rate
adjustments for completed acquisitions for which financials have not been made publicly available.
1
EBITDA adjusted for one-time items including acquired in-process R&D,
restructuring costs, legal settlements, acquisition-related costs, impairment costs, and other one-
time items; Not pro forma to reflect the full LTM, synergized impact of Elidel,
Dermik, Sanitas, Ortho Dermatologics, Afexa, iNova, Gerot Lannach, ProBiotica, Natur
Produkt, University Medical, Atlantis, Pedinol, and EyeTech acquisitions. $48
million of 3/31/2012 LTM Capital Expenditures. 2
Free
Cash
Flow
defined
as
operating
cash
flow
less
capital
expenditures,
excludes
expected
synergies.
Not
pro
forma
for
the
full
LTM
synergized
impact
of
Elidel,
Dermik,
Sanitas,
Ortho
Dermatologics,
Afexa,
iNova,
Gerot
Lannach,
ProBiotica,
Natur
Produkt,
University
Medical,
Atlantis,
Pedinol,
and
EyeTech
acquisitions.
Free
Cash
Flow
2
Valeant
Biovail
Synergies |
 $452
$495
$464
$515
$565
609
$601
$688
$856
Q1
Q2
Q3
Q4
34
Quarterly Revenue Trends
($ in millions)
34
Note: Includes out-license of Cloderm in Q1’2011 and divestiture of
dermatology products in Q1’12 Consistent quarter over quarter
performance Pro Forma 2010
2011A
2012A |
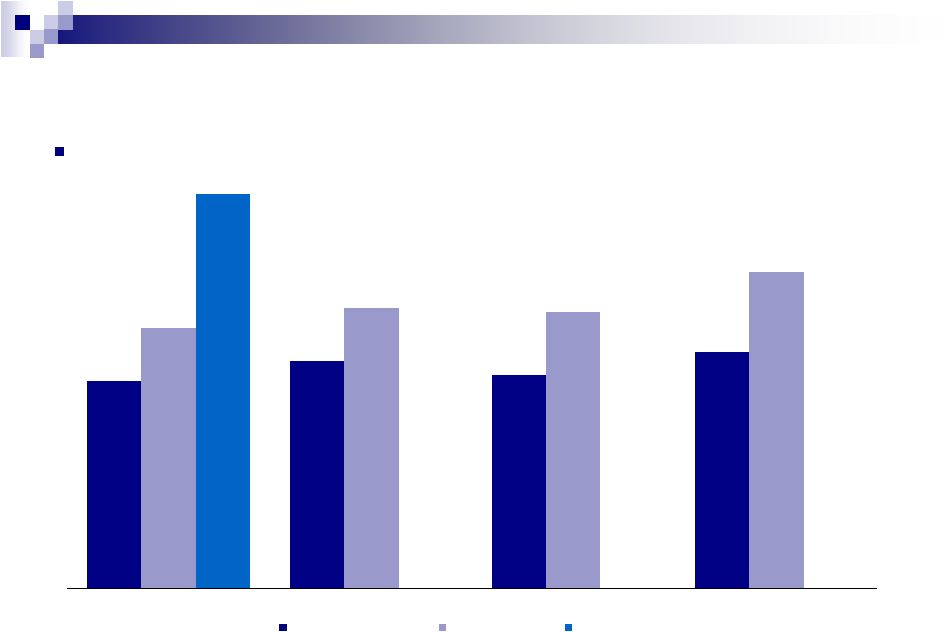
 First
Quarter Performance ($ in millions)
35
11% organic revenue growth in 1Q 2012 (excluding
the impact of foreign exchange and acquired sales)
Strong volume increases across all segments outside
of U.S. Neurology
74% gross profit margin in Q1 2012
$113 million spend in Q1 2012 under the new $1.5
billion securities repurchase program approved in
November 2011
~$172 million spend in Q2 2012, bringing total
program spend to $443 million since November 2011
$565
$856
1Q 2011
1Q 2012
Total Revenue
Adjusted Cash Flow from Operations
$204
$322
1Q 2011
1Q 2012
–
Increased Canada contract manufacturing
–
Product mix (U.S. & Europe)
–
Unfavorable exchange rates (Europe)
–
Delayed plant construction
—
Sequential increases in cost of goods sold: |
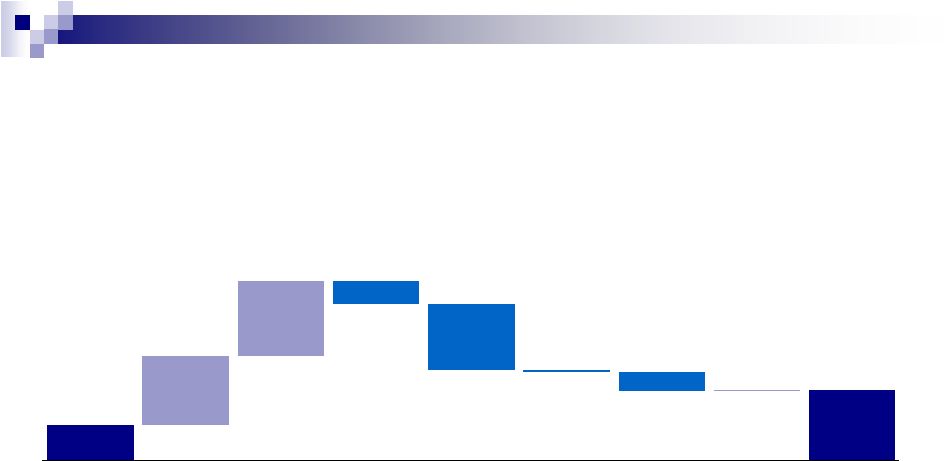 Q1
2012 Cash Flow Bridge ($ in millions)
36
$164
$322
$350
$113
$302
$11
$87
$8
$330
Cash
December
2011
Securities
Repurchases
Acquisitions
CapEx
Restructuring/
Integration/
Legal
Settlements
Other²
Cash
March
2012
Net Issuance
LT Debt
Net
Cash Flow
Generated¹
¹ Includes impact of divestiture of IDP-111 and 5FU 2
Includes payment of withholding tax upon vesting of share based awards, one-time
working capital adjustments, proceeds from the exercise of stock options and other
miscellaneous cash outflows |
 37
Pro Forma EBITDA Reconciliation
37
March 31, 2012 LTM EBITDA ($ millions)
GAAP Operating Income
$287
+ Restructuring and Other Acquisition Related Costs¹
180
+ Acquired In-Process R&D
107
+ Legal Settlements
15
+ Purchase Price Step-Ups²
164
+ Stock-Based Compensation Expense
33
+ Depreciation and Amortization and Other Non-Cash Charges
701
+ Other one-time Adjustments³
48
LTM 31-March-2012 Adjusted EBITDA
$1,535
+ EBITDA
and
Synergy
Adjustments
for
Announced
and
Completed
Acquisitions
4
341
LTM 31-March-2012 Pro Forma Adjusted EBITDA
$1,876
1
Restructuring and other acquisition related costs include R&D cancellation and wind-down
costs, employee severance, accelerated equity compensation, facility closures, and
other restructuring costs. 2
Adjustments from purchase price step-ups from acquisitions including inventory, PP&E, and
stock-based compensation. 3
Includes one-time FX adjustments.
4
Includes LTM EBITDA and synergy contribution from completed acquisitions of Elidel, Sanitas, Dermik,
Ortho Dermatologics, Afexa, iNova, Gerot Lannach, Probiotica, University Medical,
Atlantis, Pedinol and EyeTech and LTM EBITDA and synergy contribution from announced but not yet completed acquisitions of Natur Produkt for
the twelve month period ended March 31, 2012.
|
 Questions and Answers |