Attached files
| file | filename |
|---|---|
| EXCEL - IDEA: XBRL DOCUMENT - RealD Inc. | Financial_Report.xls |
| EX-23.1 - EX-23.1 - RealD Inc. | a2209785zex-23_1.htm |
| EX-31.1 - EX-31.1 - RealD Inc. | a2209785zex-31_1.htm |
| EX-32.1 - EX-32.1 - RealD Inc. | a2209785zex-32_1.htm |
| EX-31.2 - EX-31.2 - RealD Inc. | a2209785zex-31_2.htm |
| EX-21.1 - EX-21.1 - RealD Inc. | a2209785zex-21_1.htm |
| EX-32.2 - EX-32.2 - RealD Inc. | a2209785zex-32_2.htm |
Use these links to rapidly review the document
TABLE OF CONTENTS
Item 8. Financial statements and supplementary data
UNITED STATES
SECURITIES AND EXCHANGE COMMISSION
Washington, DC 20549
FORM 10-K
ý |
ANNUAL REPORT PURSUANT TO SECTION 13 OR 15(d) OF THE SECURITIES EXCHANGE ACT OF 1934 |
|
FOR THE FISCAL YEAR ENDED MARCH 23, 2012 |
||
OR |
||
o |
TRANSITION REPORT PURSUANT TO SECTION 13 OR 15(d) OF THE SECURITIES EXCHANGE ACT OF 1934 |
|
For the transition period from to |
||
Commission file number: 001-34818
RealD Inc.
(Exact Name of Registrant as Specified in Its Charter)
| Delaware (State or Other Jurisdiction of Incorporation or Organization) |
77-0620426 (I.R.S. Employer Identification No.) |
|
100 N. Crescent Drive, Suite 200 Beverly Hills, California 90210 (Address of Principal Executive Offices, Zip code) |
||
(310) 385-4000
(Registrant's telephone number, including area code)
Securities registered pursuant to Section 12(b) of the Act:
| Common stock, par value $0.0001 per share |
New York Stock Exchange |
|
|---|---|---|
| (Title of each class) | (Name of each exchange on which registered) |
Securities registered pursuant to Section 12(g) of the Act: None
Indicate by check mark if the Registrant is a well-known seasoned issuer, as defined in Rule 405 of the Securities Act. Yes o No ý
Indicate by check mark if the Registrant is not required to file reports pursuant to Section 13 or Section 15(d) of the Act. Yes o No ý
Indicate by check mark whether the registrant: (1) has filed all reports required to be filed by Section 13 or 15(d) of the Securities Exchange Act of 1934 during the preceding 12 months (or for such shorter period that the registrant was required to file such reports), and (2) has been subject to such filing requirements for the past 90 days. Yes ý No o
Indicate by check mark whether the registrant has submitted electronically and posted on its corporate Web site, if any, every Interactive Data File required to be submitted and posted pursuant to Rule 405 of Regulation S-T during the preceding 12 months (or for such shorter period that the registrant was required to submit and post such files). Yes ý No o
Indicate by check mark if disclosure of delinquent filers pursuant to Item 405 of Regulation S-K is not contained herein, and will not be contained, to the best of the registrant's knowledge, in definitive proxy or information statements incorporated by reference in Part III of this Form 10-K or any amendment to this Form 10-K. ý
Indicate by check mark whether the Registrant is a large accelerated filer, an accelerated filer, a non-accelerated filer, or a smaller reporting company. See the definitions of "large accelerated filer", "accelerated filer" and "smaller reporting company" in Rule 12b-2 of the Exchange Act. (Check one):
| Large accelerated filer o | Accelerated filer ý | Non-accelerated filer o (Do not check if a smaller reporting company) |
Smaller reporting company o |
Indicate by check mark whether the registrant is a shell company (as defined in Exchange Act Rule 12b-2). Yes o No ý
The aggregate market value of the common stock held by non-affiliates of the registrant was $475,617,338.10 based on the last reported sale price of the registrant's common stock on September 23, 2011 (the last business day of the registrant's most recently completed second fiscal quarter) as reported by the New York Stock Exchange ($10.86 per share). As of May 29, 2012, there were 54,629,717 shares of common stock outstanding.
DOCUMENTS INCORPORATED BY REFERENCE
Part III incorporates certain information by reference from the registrant's Proxy Statement for its 2012 Annual Meeting of Stockholders, which is expected to be filed on or about June 15, 2012. With the exception of the sections of the registrant's 2012 Proxy Statement specifically incorporated herein by reference, the registrant's Proxy Statement for its 2012 Annual Meeting of Stockholders is not deemed to be filed as part of this Form 10-K.
RealD Inc.
ANNUAL REPORT ON FORM 10-K
FOR THE FISCAL YEAR ENDED
March 23, 2012
TABLE OF CONTENTS
2
SPECIAL NOTE REGARDING FORWARD-LOOKING STATEMENTS AND
OTHER INDUSTRY DATA
This Annual Report on Form 10-K and the documents incorporated herein by reference contain forward-looking statements, within the meaning of Section 21E of the Securities Exchange Act of 1934, as amended, and Section 27A of the Securities Act of 1933, as amended, about our future expectations, plans or prospects and our business. All statements contained in this Annual Report on Form 10-K, other than statements of historical fact, are forward-looking statements. In some cases, you can identify forward-looking statements by terminology such as "may," "will," "should," "expects," "plans," "anticipates," "believes," "estimates," "predicts," "potential," "continue" or the negative of these terms or other comparable terminology, but the absence of these words does not necessarily mean that a statement is not forward-looking. Forward-looking statements include, among other things, statements concerning anticipated future financial and operating performance; our expectations regarding demand and acceptance for our technologies; RealD's ability to continue to derive substantial revenue from the licensing of RealD's 3D technologies for use in the motion picture industry, as well as our relationships with consumer electronics panel manufacturers and our ability to generate substantial revenue from the licensing of RealD's 3D technologies for use in 3D consumer electronics; 3D motion picture releases and conversions scheduled for fiscal 2013 ending March 2013 and beyond, their commercial success and consumer preferences; our ability to increase the number of RealD-enabled screens in domestic and international markets and market share; our ability to supply our solutions to our customers on a timely basis; our relationships with exhibitor and studio partners and the business model for 3D eyewear in North America; the progress, timing and amount of expenses associated with RealD's research and development activities; market and industry trends, including growth in 3D content; our plans, strategies and expected opportunities; the deployment of and demand for our products and products incorporating our technologies; and competitive pressures in domestic and international cinema markets impacting licensing and product revenues; and RealD's projected operating results.
Actual results may differ materially from those discussed in these forward-looking statements due to a number of factors, including the risks set forth in the section entitled "Risk factors" in Part I, Item 1A of this Annual Report on Form 10-K and elsewhere in this filing. Although we believe that the expectations reflected in the forward-looking statements are reasonable, we cannot guarantee future results, levels of activity, performance or achievements. Moreover, neither we nor any other person assumes responsibility for the accuracy and completeness of these forward-looking statements. We are under no duty to update any of the forward-looking statements after the date of this Annual Report on Form 10-K to conform our prior statements to actual results.
This Annual Report on Form 10-K also contains estimates and other information concerning our industry, including business segment and growth rates, that we obtained from industry publications, surveys and forecasts. Unless we otherwise specify, industry and market data is given on a calendar year basis and is current as of December 31, 2011. This information involves a number of assumptions and limitations, and you are cautioned not to give undue weight to these estimates. Although we believe the information in these industry publications, surveys and forecasts is reliable, we have not independently verified the accuracy or completeness of the information. The industry in which we operate is subject to a high degree of uncertainty and risk due to a variety of factors, including those described in the section entitled "Risk factors" in Part I, Item 1A of this Annual Report on Form 10-K.
RealD and the RealD logo are trademarks of RealD Inc. All other trademarks and service marks appearing in this Annual Report on Form 10-K are the property of their respective holders. All rights reserved. The absence of a trademark or service mark or logo from this Annual Report on Form 10-K does not constitute a waiver of trademark or other intellectual property rights of RealD Inc., its affiliates and/or licensors.
3
Overview
We are a leading global licensor of 3D technologies. Our extensive intellectual property portfolio is used in applications that enable a premium 3D viewing experience in the theater, the home and elsewhere. We license our RealD Cinema Systems to motion picture exhibitors that show 3D motion pictures and alternative 3D content. We also provide our RealD Display, active and passive eyewear and RealD Format technologies to consumer electronics manufacturers and content providers and distributors to enable the delivery and viewing of 3D content. Our cutting-edge 3D technologies have been used for applications such as piloting the Mars Rover.
Competitive strengths
Our competitive strengths include the following:
Innovative technology
Our technical expertise has allowed us to develop new and innovative technologies for viewing 3D content in the motion picture industry, the home and elsewhere. Working with Disney to release Chicken Little in 3D in 2005, we became the first company to commercially enable 3D theater screens using digital projection. Our patented RealD Cinema Systems deliver superior light output, providing for a high quality, brighter image and enabling display on larger theater screens than most competing technologies. Many of our licensees, including American Multi-Cinema, Inc., or AMC, Cinemark USA, Inc., or Cinemark, Regal Cinemas, Inc., or Regal, Carmike Cinemas, Inc., or Carmike, and Cineplex Theatres, or Cineplex, deploy our RealD Cinema Systems on their own premium-branded large-screen auditoriums. Our RealD Display, active and passive eyewear and RealD Format technologies provide our consumer electronics licensees the ability to display high quality 3D content that can be delivered through the current cable, satellite and broadcast infrastructure. We continually develop next generation 3D display technology for televisions, personal computers, laptops and mobile devices. Our extensive intellectual property portfolio, which is based on years of research and development, contains approximately 150 individual issued patents and approximately 264 pending patent applications in approximately 15 jurisdictions worldwide. Content producers use our technologies to enhance and accelerate their production of 3D content. Our research, development and engineering teams have expertise in many disciplines, including:
- •
- polarization control (the manipulation of light);
- •
- photonics (the application of electromagnetic energy, incorporating laser technology, electrical engineering, materials
science and information storage and processing);
- •
- optics (the branch of physics that deals with light and vision);
- •
- liquid crystal physics (the application of elements at the border between the solid and liquid phase to the creation of
nanoscale devices); and
- •
- digital image processing (the use of computer algorithms to perform image processing on digital images).
Global leader in 3D-enabled theater screens
As of March 23, 2012, our RealD Cinema Systems were deployed on approximately 20,200 theater screens in 68 countries, which we believe are more 3D screens than all of our competitors combined. 15 of the world's top 17 motion picture exhibition groups utilize RealD Cinema Systems in their
4
theaters, including Regal, AMC, Cinemark, Carmike, Cinepolis, Cineplex, ODEON, Cineworld and EuroPalaces. Our licensees include approximately 900 motion picture exhibitors. Domestic box office on RealD-enabled screens represented over 80% of total domestic 3D box office during our fiscal year ended March 23, 2012. As of March 23, 2012, we were working with our motion picture exhibitor licensees to deploy our RealD Cinema Systems on up to approximately 2,700 additional screens under our existing agreements with them, and we are actively engaged with other motion picture exhibitors regarding potential new license agreements.
Pioneer in emerging 3D consumer electronics technologies
We believe that the success of major 3D motion pictures is leading to the creation and distribution of 3D content and products for 3D consumer electronics. Although 3D consumer electronics technologies are new and developing, we have already entered into agreements to provide our RealD Display, active and passive eyewear and RealD Format technologies to leading consumer electronics manufacturers, including Victor Company of Japan, Limited, or JVC, Panasonic Corporation, or Panasonic, Samsung Electronics Company Limited, or Samsung, Sony Electronics, Inc., or Sony Electronics, Toshiba Corporation, or Toshiba and VIZIO, Inc., or VIZIO. Our licensees also include content distributors, including cable television services such as Cablevision Systems Corp., or Cablevision and satellite television services such as DirecTV Enterprises, LLC, or DirecTV.
Premium brand
We believe our brand is well-recognized among licensees and consumers as a result of motion picture studios and exhibitors co-branding with us and moviegoers having worn our branded RealD eyewear more than 725 million times. We believe the prominence of our brand in the motion picture industry will enhance our marketing efforts of 3D consumer electronics technologies.
Scalable licensing model
We license our 3D technologies under a highly scalable business model with recurring revenue from those licensees. As an example, our multi-year (typically five years or longer), generally exclusive agreements with motion picture exhibitors generate revenue on a per-admission, periodic fixed-fee or per-motion picture basis at limited incremental direct cost to us. We believe motion picture exhibitors prefer our licensing model, which includes technological upgrades and maintenance, because it reduces their capital expenditures and the risk they may purchase equipment that will become obsolete. We believe our motion picture exhibitor licensees also prefer our low-cost RealD eyewear because it requires less personnel (no active collecting or washing by motion picture exhibitors) and reduces motion picture exhibitors' loss from theft and breakage. Although we have not yet generated material revenue licensing 3D consumer electronics technologies, we anticipate that our relationships with consumer electronics manufacturers and others will generate future license fees on 3D consumer electronics technologies on a per unit basis.
Extensive industry relationships and strong technical expertise
Our experienced management team, including Michael V. Lewis, our Chairman and Chief Executive Officer, Joseph Peixoto, President of Worldwide Cinema, and Leo Bannon, Executive Vice President of Global Operations, have extensive, long-term relationships with content producers and distributors, major motion picture studios and exhibitors, and consumer electronics manufacturers that help us drive the proliferation of 3D content, delivery and viewing in theaters, the home and elsewhere. Our research and development team, based in Boulder, Colorado, is comprised of leaders in the invention, development and commercialization of innovative 3D technologies.
5
Strategy
Key elements of our strategy include:
Continue to innovate and develop new technologies
We continue to develop proprietary technologies to perfect the visual image and create additional revenue opportunities. We endeavor to improve our RealD Cinema Systems to deliver an even better and more immersive 3D viewing experience to consumers in theaters. For 3D consumer electronics, we are working to enhance our RealD Display, active and passive eyewear and RealD Format technologies to enable consumers to enjoy 3D at home and elsewhere. We have patented technologies that we believe will in the future enable consumers to enjoy 3D content without eyewear. We believe our licensing of 3D technologies for professional applications will continue to provide a strong foundation for our development of new 3D technologies for viewing 3D content at motion picture theaters, on consumer electronics and other applications. We also selectively pursue technology acquisitions to expand and enhance our intellectual property portfolio in areas that complement our existing and new market opportunities and to supplement our internal research and development efforts.
Increase our leading global share in 3D-enabled theater screens
We continue to work with our existing motion picture exhibitor licensees to deploy additional RealD Cinema Systems. We also plan to enter into agreements with new motion picture exhibitor licensees to increase the number of deployed RealD Cinema Systems worldwide. We believe there is a significant opportunity for us to continue to expand our business internationally and to license our 3D technologies to international motion picture exhibitors based on a licensing model that is similar to our domestic model.
Expand our emerging 3D consumer electronics business
We continue to work with consumer electronics manufacturers and content producers and distributors to enable a premium 3D viewing experience in the home and elsewhere using our technologies. We endeavor to incorporate our RealD Display, active and passive eyewear and RealD Format technologies in plasma and LCD televisions, set-top boxes, digital video recorders, interactive gaming consoles, laptop computers, desktop computers and mobile devices, and to enable the delivery of 3D content via cable, satellite, broadcast, packaged media and the Internet.
Build upon the strength of our RealD brand
It is our goal to make RealD the best known 3D technology brand in the world, associated with delivering the highest quality 3D viewing experience. We will further leverage the strength of our brand to generate stronger licensee and consumer preference for a RealD experience in 3D consumer electronics and other applications. We continue to actively encourage motion picture studios and exhibitors to prominently feature our brand in their motion picture advertising and marketing, at theater locations, online and on consumer electronics products and packaging. We will also continue our advertising efforts to strengthen our brand in the theatrical and consumer electronics industries. We plan to use our brand to drive the continued adoption of our 3D technologies in existing and new applications.
Industry
History of 3D
First used commercially in a public theater in 1922, 3D technology has been used by content producers in an effort to enhance the viewing experience. 3D imagery is created using stereoscopic
6
photography, which is a process that creates the illusion of 3D by using a pair of 2D images. Each image represents a different perspective of the same object, emulating the different perspectives that binocular vision captures. When the two images are viewed by each eye, the brain fuses the two images to form a single picture, creating the illusion of 3D. 3D technology has a wide range of applications including entertainment, research and development, scientific exploration and manufacturing.
Innovation in 3D technology has centered on optimizing the projection of stereoscopic images as well as the filtering of the image intended for each eye. Early 3D exhibition required the use of two projectors, one to project the reel for each eye to create the stereoscopic image, which required synchronization that was difficult to achieve due to the manual operation of projectors. To view a stereoscopic image, audiences utilized 3D eyewear that employed different filters that did not maintain the quality of a standard motion picture image and caused discomfort including eye strain and headaches.
Benefiting from the continuing adoption of digital projection, the newest wave of 3D projection uses digital technologies that address many of the limitations of previous methods of 3D projection. The use of high definition digital projectors, advances in the construction of silver screens and the use of polarization filters and polarized lenses have broadened the color spectrum, and reduced eyestrain and synchronization issues that caused headaches, which greatly improves the 3D viewing experience.
The launch of modern 3D digital projection for motion pictures was marked by the presentation of Chicken Little by Disney in November 2005, which debuted on approximately 100 RealD-enabled screens. Since the debut of Chicken Little in 2005 through March 23, 2012, more than 90 major 3D motion pictures have been released on RealD-enabled screens including six of the top 10 grossing films of all time. In addition, seven of the 10 highest grossing motion pictures released in 2011 were exhibited in RealD 3D.
Cutting-edge 3D technology has also been deployed in other applications including scientific research. For example, NASA has utilized 3D technology to analyze damage to the Space Shuttle and to navigate the Mars Rover. Industrial applications for 3D technology include the use of 3D visualization by biotech firms for the development of pharmaceuticals, by aircraft and motor vehicle manufacturers like McDonnell Douglas Corp., Caterpillar Inc. and Harley Davidson, Inc. for the design of new prototypes and by major energy companies such as Chevron that utilize 3D technology to reduce the cost and environmental impact of exploration by analyzing oil and gas fields in virtual 3D environments.
Market opportunity
Our 3D technologies can be used in many different applications and businesses, including entertainment, consumer electronics, education, aerospace, defense and healthcare. Our 3D technologies are primarily used in motion pictures, consumer electronics and professional applications.
The shift in the motion picture industry from analog to digital over the past decade has created an opportunity for new and transformative 3D technologies. With the commercial success of recent 3D motion pictures, adoption of 3D digital cinema is positioned for continued growth as we believe many of the approximately 61,000 worldwide non-digital theater screens as of the end of December 31, 2011 may convert to digital projection. As of December 31, 2011, only approximately 64,000 digital theater screens were deployed worldwide, representing approximately 50% of the worldwide installed base. Certain major film studios have stated that they will stop making available analog versions of their motion pictures within the next few years, which should contribute to further migration of cinema screens with digital projectors. RealD's Cinema Systems function as an enhancement to digital projectors and, therefore, require cinemas to be equipped with a digital projector prior to installation.
7
The following chart illustrates, as of December 31, 2011, the approximate total number of theater screens worldwide, the approximate number of theater screens that have been converted to digital and the approximate number of digital theater screens that are 3D-enabled.
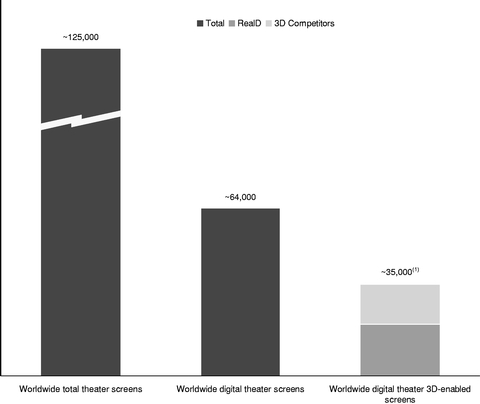
- (1)
- Of the estimated 35,000 worldwide digital theater 3D-enabled screens as of December 31, 2011 (per Screen Digest), 19,700 were RealD-enabled screens, representing a greater than 50% share. As of March 23, 2012, RealD had deployed approximately 20,200 screens worldwide.
The growth in 3D screens worldwide combined with growth in the number of 3D motion pictures has led to an increase in the worldwide box office generated by 3D screens in recent years. In 2011, 3D-enabled screens generated an estimated $6.9 billion in worldwide 3D box office (according to provisional figures from Screen Digest), representing 21% of the $32.6 billion in total worldwide box office in 2011. Seven of the top 10 grossing films worldwide in 2011 were exhibited in RealD 3D. We anticipate that continued growth in the number of 3D films and the number of 3D-enabled screens will lead to further growth in the worldwide 3D box office. We anticipate that approximately 37 3D motion pictures will be released worldwide in our fiscal year 2013, including sequels to successful major motion picture franchises, such as Men In Black, Madagascar, Spider-Man and Ice Age, as well as highly-anticipated original content such as The Avengers, Prometheus, Brave and The Hobbit.
In addition to creating original 3D motion pictures, content providers are converting classic 2D motion pictures to 3D in order to re-release films in theaters for display using 3D technologies. The 3D re-releases of the classic films The Lion King, Beauty and the Beast, Star Wars: The Phantom Menace, and Titanic have generated more than $650 million in global box office on a combined basis. Several additional 2D classic films are scheduled to be re-released in 3D in theaters including Star Wars, Jurassic Park, Finding Nemo, Monsters Inc., and The Little Mermaid.
8
The following table shows the major 3D motion pictures released or scheduled for release on 3D-enabled screens for the fiscal year 2013 ending on March 22, 2013, the motion picture studios and the release dates for those motion pictures (announced as of May 29, 2012).
Title
|
Motion Picture Studios | Release Date | ||
|---|---|---|---|---|
Wrath of the Titans |
Warner Bros. | 3/30/2012 | ||
Titanic 3D (re-release) |
Fox | 4/4/2012 | ||
The Pirates! Band of Misfits |
Sony / Aardman | 4/27/2012 | ||
The Avengers 3D |
Disney | 5/4/2012 | ||
Men in Black III |
Sony | 5/25/2012 | ||
Piranha 3DD |
Weinstein/Dimension | 6/1/2012 | ||
Madagascar 3: Europe's Most Wanted |
Dreamworks | 6/8/2012 | ||
Prometheus |
Fox | 6/8/2012 | ||
Brave |
Disney/Pixar | 6/22/2012 | ||
Abraham Lincoln: Vampire Hunter |
Fox | 6/22/2012 | ||
The Amazing Spider-Man |
Sony | 7/3/2012 | ||
Katy Perry: Part of Me |
Paramount | 7/5/2012 | ||
Ice Age: Continental Drift |
Fox | 7/13/2012 | ||
Step Up Revolution |
Summit | 7/27/2012 | ||
Nitro Circus the Movie 3D |
ARC | 8/10/2012 | ||
ParaNorman |
Focus/Laika | 8/17/2012 | ||
Resident Evil: Retribution |
Sony/Screen Gems | 9/14/2012 | ||
Finding Nemo (re-release) |
Disney/Pixar | 9/14/2012 | ||
Hotel Transylvania |
Sony | 9/21/2012 | ||
Dredd |
Lionsgate | 9/21/2012 | ||
Frankenweenie |
Disney | 10/5/2012 | ||
Silent Hill: Revelation 3D |
Open Road | 10/26/2012 | ||
Wreck-It Ralph |
Disney | 11/2/2012 | ||
Rise of the Guardians |
Paramount/Dreamworks | 11/21/2012 | ||
Life of Pi |
Fox | 11/21/2012 | ||
The Hobbit: An Unexpected Journey |
Warner Bros. | 12/14/2012 | ||
Cirque du Soleil: Worlds Away |
Paramount/Cameron-Pace | 12/21/2012 | ||
The Great Gatsby |
Warner Bros. | 12/25/2012 | ||
The Texas Chainsaw Massacre 3D |
Lionsgate | 1/4/2013 | ||
Hansel and Gretel: Witch Hunters |
MGM/Paramount | 1/11/2013 | ||
Monsters, Inc. (re-release) |
Disney/Pixar | 1/18/2013 | ||
Battle of the Year: The Dream Team |
Sony/Screen Gems | 1/25/2013 | ||
47 Ronin |
Universal | 2/8/2013 | ||
Escape from Planet Earth |
Weinstein | 2/14/2013 | ||
Oz: The Great & Powerful |
Disney | 3/8/2013 | ||
The Croods |
Dreamworks | 3/22/2013 | ||
Jack the Giant Killer |
Warner Bros. | 3/22/2013 |
We believe that more 3D-enabled theater screens will be needed in the future, particularly in international markets, to accommodate the expected growth in the number of 3D motion pictures being released and to provide the necessary capacity to fully capitalize on commercially successful 3D motion pictures.
We believe that the success of major 3D motion pictures will further stimulate the production and distribution of new and alternative 3D content for digital cinema. In particular, we anticipate that there will be more live broadcast events in 3D, including sporting events, concerts, cultural and other live events similar to a number of recent experiences. Live 3D events broadcast in RealD cinemas to date
9
have included Wimbledon tennis, FIFA World Cup soccer, Ultimate Fighting Championship (UFC) matches, and music concerts. In addition, in March 2012, we released Madam Butterfly 3D, a co-production with the Royal Opera House, to our participating exhibitor partners around the world.
We believe that the recent success of 3D motion pictures is also leading to the production and distribution of new 3D content for consumer electronics applications. There are currently a growing number of 3D channels available worldwide including linear broadcast channels and VOD systems on major broadcast services including DirecTV, Virgin Media, Sky, Foxtel and Comcast. 3D channels are currently being programmed from major content brands including ESPN (ESPN3D), British Sky Broadcasting (Sky 3D), and Discovery Communications (3net). Market researcher Insight Media expects the number of 3D TV channels worldwide to grow to more than 100 by 2014. Examples of major sporting events broadcast live in 3D include The Masters golf tournament, Premier League soccer, NCAA football, NCAA men's basketball Final Four games, the NBA Finals and boxing.
The proliferation of high definition televisions, laptops and other displays represents a new market opportunity for revenue arising from the release of 3D-enabled consumer electronics products. For example, market researcher DisplaySearch estimates that the number of 3D-enabled televisions shipped worldwide will more than double from an estimated 24 million in 2011 to approximately 50 million in 2012. We believe growth in the installed base of 3D-enabled TVs and other consumer displays gives film studios even more incentive to create a 3D version of their major film releases in order to take advantage of the downstream revenue opportunity to display the film's 3D version in the home.
Key applications
We believe that we possess innovative technology, a significant market presence, a premium brand and a scalable licensing model in our key applications.
Cinema
We design, manufacture, license and market our RealD Cinema Systems that enable digital cinema projectors to show 3D motion pictures and alternative 3D content to consumers wearing our RealD eyewear.
Technology. We believe our patented 3D digital projection technology delivers double the amount of light output compared to any other 3D digital projection technology on the market, which is the most significant factor in producing a high quality 3D image. We believe we are able to reach larger screens with our RealD digital projection technology than the majority of other 3D digital projection technology providers for use in motion picture theaters. For example, using a single digital DLP projector and the same lamp and lamp power as a 2D presentation, our RealD XL Cinema System, using our polarizing technology, can deliver crisp, clear 3D content to screens. Our RealD Cinema Systems:
- •
- are relatively inexpensive to deploy and include maintenance and free upgrades at no additional charge to the exhibitor;
- •
- produce full color, unlike stereoscopic/spectral 3D that relies on eyewear with red and green color filters that cause a
substantial loss of available colors;
- •
- reduce most "ghost images" caused by the left eye seeing a small portion of the right-eye frames and vice
versa;
- •
- can be viewed with our circular polarized passive RealD eyewear, which allow consumers to move around with reduced image distortion.
Market presence. Our RealD Cinema Systems are the world's most widely deployed digital 3D cinema technology based on the number of theater screens installed worldwide. As of March 23, 2012,
10
our RealD Cinema Systems were deployed on approximately 20,200 theater screens in 68 countries worldwide. We are working with our motion picture exhibitor licensees to deploy our RealD Cinema Systems on up to approximately 2,700 additional screens under our existing agreements with them, of which approximately 1,100 screens are domestic and approximately 1,600 are international. As of December 31, 2011, our RealD Cinema Systems accounted for over 80% of the estimated domestic 3D-enabled theater screens and over 50% of the 3D-enabled theater screens deployed worldwide. Domestic box office on RealD-enabled screens represented over 80% of total domestic 3D box office during our fiscal year ended March 23, 2012. We expect to continue to grow our cinema business based on an increasing number of theater screens becoming RealD-enabled and an increasing number of RealD-compatible 3D motion pictures being released.
The following chart illustrates the number of theater locations with RealD-enabled screens and the total number of RealD-enabled screens:
| |
Year ended | |||||||||
|---|---|---|---|---|---|---|---|---|---|---|
(approximate numbers)
|
March 23, 2012 |
March 25, 2011 |
March 26, 2010 |
|||||||
Number of RealD enabled screens (at period end) |
||||||||||
Total domestic RealD enabled screens |
11,700 | 8,700 | 3,400 | |||||||
Total international RealD enabled screens |
8,500 | 6,300 | 1,900 | |||||||
Total RealD enabled screens |
20,200 | 15,000 | 5,300 | |||||||
Number of locations with RealD enabled screens (at period end) |
||||||||||
Total domestic locations with RealD enabled screens |
2,600 | 2,300 | 1,800 | |||||||
Total international locations with RealD enabled screens |
2,500 | 2,200 | 1,200 | |||||||
Total locations with RealD enabled screens |
5,100 | 4,500 | 3,000 | |||||||
Number of 3D motion pictures (released during period) |
36 | 26 | 13 | |||||||
At most RealD theater locations, there are multiple RealD-enabled screens. We believe that having more RealD-enabled screens per location will allow us to accommodate the increasing number of 3D motion pictures being released simultaneously and provide the necessary capacity to fully capitalize on commercially successful 3D motion pictures. We believe the commercial success of 3D motion pictures will facilitate the conversion of theater screens to digital and 3D. After motion picture exhibitors convert their projectors to digital cinema, they must install a silver screen and our RealD Cinema Systems in order to display motion pictures in RealD 3D.
Content. The following table shows the major motion pictures released on RealD-enabled screens in fiscal year 2012, including the motion picture studios, the release dates, the domestic box office for those motion pictures on RealD-enabled screens, the RealD domestic box office as a percentage of
11
total domestic 3D box office, and the RealD domestic box office as a percentage of the total domestic 2D and 3D box office (all data through March 23, 2012).
Title
|
Motion Picture Studio | Release Date | Domestic Box Office on RealD-Enabled Screens |
RealD Percent of Domestic 3D Box Office |
RealD Percent of Total (2D+3D) Dom. Box Office |
|||||||||
|---|---|---|---|---|---|---|---|---|---|---|---|---|---|---|
Rio |
Fox | 4/15/2011 | $ | 58,977,206 | 91 | % | 44 | % | ||||||
Hoodwinked Too! Hood vs Evil |
The Weinstein Company | 4/29/2011 | $ | 5,119,946 | 90 | % | 59 | % | ||||||
Thor |
Paramount | 5/6/2011 | $ | 70,021,536 | 78 | % | 41 | % | ||||||
Priest |
Sony | 5/13/2011 | $ | 13,659,273 | 92 | % | 49 | % | ||||||
Pirates of the Caribbean: On Stranger Tides |
Disney | 5/20/2011 | $ | 70,269,762 | 73 | % | 30 | % | ||||||
Kung Fu Panda 2 |
Paramount | 5/26/2011 | $ | 55,745,016 | 88 | % | 35 | % | ||||||
Green Lantern |
Warner Bros | 6/17/2011 | $ | 41,191,082 | 89 | % | 37 | % | ||||||
Cars 2 |
Disney | 6/24/2011 | $ | 48,307,076 | 84 | % | 26 | % | ||||||
Transformers: Dark Of The Moon |
Paramount | 6/29/2011 | $ | 145,003,098 | 78 | % | 43 | % | ||||||
Harry Potter And The Deathly Hallows II |
Warner Bros | 7/15/2011 | $ | 96,530,758 | 64 | % | 26 | % | ||||||
Captain America: The First Avenger |
Paramount | 7/22/2011 | $ | 51,168,046 | 90 | % | 30 | % | ||||||
The Smurfs |
Sony | 7/29/2011 | $ | 46,663,040 | 93 | % | 34 | % | ||||||
Glee The 3D Concert Movie |
Fox | 8/12/2011 | $ | 10,592,165 | 92 | % | 92 | % | ||||||
Final Destination 5 |
Warner Bros | 8/12/2011 | $ | 24,189,940 | 81 | % | 62 | % | ||||||
Spy Kids: All The Time In The World |
The Weinstein Company | 8/19/2011 | $ | 15,548,279 | 95 | % | 43 | % | ||||||
Conan The Barbarian |
Lionsgate | 8/19/2011 | $ | 11,037,339 | 90 | % | 55 | % | ||||||
Fright Night |
Disney | 8/19/2011 | $ | 8,942,837 | 91 | % | 52 | % | ||||||
Shark Night 3D |
Relativity Media | 9/2/2011 | $ | 12,980,598 | 88 | % | 74 | % | ||||||
The Lion King 3D |
Disney | 9/16/2011 | $ | 75,243,499 | 89 | % | 83 | % | ||||||
Dolphin Tale |
Warner Bros | 9/23/2011 | $ | 24,963,188 | 84 | % | 36 | % | ||||||
The Three Musketeers |
Summit | 10/21/2011 | $ | 8,758,361 | 88 | % | 45 | % | ||||||
Puss In Boots |
Paramount | 10/28/2011 | $ | 46,954,170 | 76 | % | 33 | % | ||||||
A Very Harold & Kumar 3D Christmas |
Warner Bros | 11/4/2011 | $ | 27,525,095 | 91 | % | 82 | % | ||||||
Immortals |
Relativity Media | 11/11/2011 | $ | 46,758,674 | 93 | % | 58 | % | ||||||
Happy Feet 2 |
Warner Bros | 11/18/2011 | $ | 17,953,801 | 68 | % | 30 | % | ||||||
Hugo |
Paramount | 11/23/2011 | $ | 46,914,325 | 88 | % | 67 | % | ||||||
Arthur Christmas |
Sony | 11/23/2011 | $ | 14,940,856 | 88 | % | 33 | % | ||||||
The Adventures Of Tintin |
Paramount | 12/21/2011 | $ | 40,884,877 | 83 | % | 58 | % | ||||||
The Darkest Hour |
Summit | 12/25/2011 | $ | 12,023,748 | 90 | % | 58 | % | ||||||
Beauty And The Beast (3D) |
Disney | 1/13/2012 | $ | 38,886,857 | 90 | % | 86 | % | ||||||
Underworld Awakening |
Sony | 1/20/2012 | $ | 34,109,976 | 74 | % | 56 | % | ||||||
Journey 2: The Mysterious Island |
Warner Bros | 2/9/2012 | $ | 42,277,683 | 69 | % | 47 | % | ||||||
Star Wars: Episode I—Phantom Menace (in 3D) |
Fox | 2/10/2012 | $ | 36,853,913 | 88 | % | 88 | % | ||||||
Ghost Rider: Spirit of Vengeance |
Sony | 2/17/2012 | $ | 29,192,814 | 90 | % | 61 | % | ||||||
Dr. Seuss' The Lorax |
Universal | 3/2/2012 | $ | 56,986,747 | 80 | % | 37 | % | ||||||
John Carter |
Disney | 3/9/2012 | $ | 21,105,811 | 66 | % | 41 | % | ||||||
Note: As of March 23, 2012
Source: Rentrak
The number of 3D films exhibited on our RealD cinema systems has grown significantly in recent years, from 26 major motion pictures in our fiscal year 2011 to 36 major motion pictures in our fiscal year 2012. As of May 31, 2012, we expect approximately 37 3D motion pictures to be released during our fiscal year 2013 which ends on March 22, 2013, all of which we expect will be exhibited using our RealD Cinema Systems.
We believe that the recent success of major 3D motion pictures will drive the creation and theatrical distribution of more alternative content and live broadcast events in 3D. To facilitate the display of alternative content, we introduced RealD LIVE, which enables live event 3D broadcast
12
capabilities in theaters. RealD-enabled screens and the RealD Format have been used to exhibit other new and alternative 3D content, including sporting events, concerts, cultural and other live events. In addition, in March 2012, we released Madam Butterfly 3D, a co-production with London's Royal Opera House, to our participating exhibitor partners around the world.
Brand. Motion picture studios often co-brand RealD in motion picture marketing and advertising. Motion picture exhibitors display our brand at theaters, on-screen and online. Moviegoers have worn our branded RealD eyewear more than 725 million times. Our in-theater branding includes signage at the box office where tickets are purchased, signage in the lobby and in poster cases in and around the theater, branded recycling bins located at each auditorium entrance and exit, an on-screen animated 3D preview informing consumers when to put on their eyewear and reminding them to recycle their eyewear after the motion picture and a promotional trailer that plays immediately before the motion picture. Our brand also appears on major online ticketing websites aligned with show times at theaters equipped with our RealD technology. We believe our branded 3D experience will lead to increased admissions as consumers recognize our brand as the leading choice for 3D viewing, prompting motion picture exhibitors to select us as their 3D technology licensor.
Licensing model. We license our RealD Cinema Systems to motion picture exhibitors under multi-year (typically five years or longer) agreements that are generally exclusive and from which we generally receive license fees on a per-admission basis. We believe our agreements with motion picture exhibitors provide us with recurring revenue as 3D motion pictures are exhibited using our 3D technologies. Based on the number of deployed RealD-enabled screens, the number of additional RealD Cinema Systems that we will work with our existing motion picture exhibitor licensees to deploy, our market presence and the number of 3D motion pictures slated for future release, we believe our cinema business will continue to grow.
We license and market systems to motion picture exhibitors based on the type of digital projector installed and theater configuration: our RealD Cinema System, RealD XL Cinema System, RealD XLS Cinema System, and the RealD XLW Cinema System, which is designed specifically for premium large screen auditoriums with stadium seating configurations. Our RealD XL Cinema System can be displayed on screens of up to 82 feet wide, and our RealD Cinema Systems will be scalable to larger formats as projector technology evolves. The RealD XLW Cinema System, introduced in January 2011, can accommodate a throw ratio as wide as 1.0 (projection distance divided by screen width), and is designed for use in premium large screen motion picture auditoriums, theme parks and specialty theaters with stadium seating. We also recently introduced a RealD Cinema System for dual projector installations that is capable of delivering twice the light of other dual-projector 3D systems. Based on our actual experience, we believe we can upgrade almost any theater that has an existing digital cinema projector with our RealD Cinema Systems within a few hours. Under our agreements with motion picture exhibitors, we provide technological upgrades and maintenance on our RealD Cinema Systems at no additional charge to the exhibitor.
We believe our RealD Cinema Systems are a compelling and scalable technology for the motion picture industry. Motion picture producers can tell their stories in more creative and compelling ways through the use of 3D technology. As evidenced by the record-setting performance of The Avengers in May 2012, releasing content on RealD-enabled screens can result in increased ticket sales at premium prices, enhanced monetization of a motion picture's initial release and, as a result, can provide a more attractive return on investment to motion picture producers and distributors. Motion picture exhibitors share in the benefit of increased motion picture ticket sales at premium prices, and they can also generate new revenue opportunities through alternative 3D content, including 3D showings of sporting events, concerts, cultural and other live events. We also believe consumers benefit from a superior 3D entertainment experience.
13
Consumer electronics
We make our RealD Display, active and passive eyewear and RealD Format technologies available to consumer electronics manufacturers, content producers and content distributors to bring 3D to the home and elsewhere.
Technology. We continue our development efforts of next-generation 3D display technologies. The majority of 3D-enabled televisions sold today utilize active shuttering 3D eyewear. To address this opportunity, we have developed technology to create active 3D eyewear, which are compatible with 3D-enabled televisions from many major consumer electronics brands.
Our RealD Format is based on multiplexing technology (which packs two images in a single space) to deliver and display high definition 3D content via today's existing infrastructure for cable, satellite, broadcast, packaged media and the Internet. Our technology can grow with the content distribution infrastructure to deliver the highest quality, premium 3D viewing experience across a variety of distribution systems and consumer electronics products. Our 3D technologies can also be used for 3D-enabled interactive gaming by game developers and publishers. Our technologies for interactive gaming include those that adjust viewing angles in a game, assure 3D across depth of field and enable in-frame 3D effects.
We believe that 3D consumer electronics will continue to evolve towards an enhanced 3D entertainment experience and we intend to actively seek to have our technologies incorporated in new 3D-enabled consumer electronics products. We continue to develop, maintain, and strengthen our relationships within the broad spectrum of consumer electronics participants to guide the development of 3D in the home and elsewhere. We believe our active eyewear is adaptable to most consumer electronics applications and our patented high brightness, passive display could be used with high definition displays without significantly degrading image resolution.
In January 2011, together with Samsung Electronics LCD Business, we announced the joint development of a new 3D display technology called RDZ™ that offers full resolution high definition 3D video and is compatible with the same 3D eyewear used in RealD 3D-equipped motion picture theatres around the world. Unlike patterned retarder based 3D display technologies that cut resolution in half or diminish brightness, our RDZ™ 3D display technology is designed to deliver full resolution high definition 3D images by adopting active shutter technology on the display. Based on RealD technology used in many of the world's 3D-equipped motion picture theatres today, RDZ™ displays are also 2D compatible, resulting in no reduction of image quality in 2D mode. After having jointly announced with Samsung a license agreement in May 2011 which we had expected to lead to the incorporation of our RDZ™ 3D display technology into LCD panels manufactured by Samsung, Samsung's initiative to manufacture panels under the license agreement with us is no longer being pursued. We continue to explore other potential licensee relationships for our RDZ™ 3D display technology for LCD panels.
Competitive presence. Our 3D technologies can be deployed across the entire range of consumer electronics. We have recently made available our RealD Display, active and passive eyewear and RealD Format technologies to consumer electronics manufacturers, content producers and distributors to enable high definition televisions, laptops and other displays to be viewed in 3D in the home and elsewhere. Although we have not yet generated material revenue licensing our consumer electronics technologies, we have agreements in place with a wide range of leading consumer electronics manufacturers and content providers.
Content. Building on the recent success of major 3D motion pictures released in theaters, we believe consumers' desire for 3D consumer electronics will be stimulated with the creation and distribution of new motion pictures and other forms of 3D content. We anticipate that the demand for live broadcast events in 3D, including sporting events, concerts, cultural and other live events, for 3D
14
interactive games, as well as other new and alternative 3D content for the home and elsewhere, will further stimulate the demand for RealD-enabled consumer electronics products.
Brand. We believe the strength of our brand in the motion picture industry will assist us in the 3D consumer electronics space. We are working with our licensees to incorporate RealD branding in their consumer electronics product advertising, marketing and packaging and to have our brand featured prominently on our patented RealD eyewear used in the 3D consumer electronics application.
Licensing model. We have entered into multi-year licensing agreements with participants in the consumer electronics industry to further integrate our RealD Format and other technologies into their products. Although we have not yet generated material revenue from our current agreements in the consumer electronics industry, and may never generate material revenue from those agreements, we believe there will be future revenue opportunities for licensing our 3D technologies to consumer electronics manufacturers, component and accessories manufacturers, eyewear manufacturers, mobile device companies and others as the 3D consumer electronics opportunity continues to develop.
Professional
Our professional 3D technologies are utilized by Fortune 500 companies, government, academic institutions, and research and development organizations for applications such as piloting the Mars Rover. Our professional 3D technologies have also been used for theme park installations, including at LEGOLAND®.
Our history
RealD was founded in 2003 with the goal of bringing a premium 3D viewing experience to audiences everywhere. In 2005, we acquired Stereographics Corporation, or Stereographics, a company founded in 1980 and one of the largest providers of 3D technologies at the time of the acquisition. In 2007, we acquired ColorLink Inc., or ColorLink, a polarization control, photonics and optics company with an extensive patent portfolio. ColorLink, which was founded in 1995, had played an instrumental role collaborating with RealD to develop our first cinema system. In March 2005, we demonstrated our initial RealD Cinema System to motion picture exhibitors and studios. In November 2005, Disney released Chicken Little in 3D on approximately 100 RealD-enabled screens. In 2008, we established a RealD sales and operating presence in Europe and also entered 3D consumer electronics with a number of 3D technologies for the home and elsewhere. In December 2009, Fox released Avatar worldwide, including on approximately 4,200 RealD-enabled screens. In 2012, RealD surpassed 20,000 3D-equipped cinema screens worldwide.
Licensees
Cinema
In our cinema business, our primary licensees are motion picture exhibitors that use our RealD Cinema Systems, including 15 of the top 17 motion picture exhibition groups in the world. As of March 23, 2012, we had multi-year (typically five years or longer) agreements that are generally exclusive with our motion picture exhibitor licensees in both the domestic and international markets. However, our license agreements typically do not obligate motion picture exhibitors to deploy a specific number of our RealD Cinema Systems according to a specific timeline. License revenue from AMC, Cinemark and Regal together comprised approximately 24% of our gross license revenue in the year ended March 23, 2012, 23% in the year ended March 25, 2011 and 30% in the year ended March 26, 2010. No licensee accounted for more than 10% of our gross license revenue in fiscal 2012, 2011 or 2010.
15
Consumer electronics
In our consumer electronics business, our primary licensees are consumer electronics manufacturers, including JVC, Panasonic, Sony Electronics, Toshiba and Vizio. We currently have agreements in place with these consumer electronics manufacturers for the use of our 3D technologies in various consumer electronics products. Our customers also include content distributors, including cable providers, satellite television services company DirecTV and content producers. In May 2011, we announced the entry into a license agreement with Samsung Electronics LCD Business to make available to consumer electronics manufacturers panels featuring our RDZ™ 3D display technology, which delivers full resolution 3D images to each eye utilizing RealD 3D cinema glasses, Samsung's initiative to manufacture panels under the license agreement with us is no longer being pursued. We continue to explore other potential licensee relationships for our RDZ™ 3D display technology for LCD panels. Our customers also include content distributors, including cable providers, satellite television services company DirecTV, and content producers.
Professional
In our professional business, our primary customers are Fortune 500 companies, government agencies, academic institutions and research and development organizations.
Sales and marketing
We market and license our technologies throughout the 3D motion picture, 3D consumer electronics and professional industries through an internal sales team. We maintain sales offices in the United States, the United Kingdom, Japan, Hong Kong and China.
We focus our marketing efforts on motion picture studios and exhibitors, consumer electronics manufacturers, interactive game companies, content producers and content distributors. We reach these customers primarily through industry trade shows, public relations, our website and studio events.
Research and development
We believe we must continue to develop innovative technologies on a regular basis to maintain our competitive edge. We monitor trends in the 3D motion picture, 3D consumer electronics and professional industries to stay abreast of new developments. We further monitor relevant intellectual property and other public domain information. Our research and development is focused on building and testing licensed products that could potentially incorporate our 3D technologies. Once the proof of concepts are built and tested, our 3D technologies are licensed to motion picture exhibitors and consumer electronics manufacturers.
Our research and development expenses were $16.5 million for the year ended March 23, 2012, $15.6 million for the year ended March 25, 2011 and $11.0 million for the year ended March 26, 2010. In addition, we have made significant investments in intellectual property through acquisitions, including our acquisitions of Stereographics and ColorLink.
Manufacturing and supply
Cinema
RealD Cinema Systems. We purchase optical and mechanical components for our RealD Cinema Systems from multiple suppliers. We have also entered into a large number of license and deployment agreements with digital cinema projector and server companies that grant them a limited, royalty-free license related to the use of RealD technology into digital cinema projection systems.
16
RealD eyewear. Our RealD eyewear is an integral part of our RealD Cinema Systems. Our circular polarized passive RealD eyewear allows consumers to move around with reduced image distortion and is comfortable and sanitary, which we believe provides convenience to consumers. We have entered into non-exclusive agreements with several manufacturers to produce RealD eyewear. We manage worldwide manufacturing and distribution of RealD eyewear. Domestically, we operate a recycling program for our RealD eyewear. Domestically, we provide our RealD eyewear free of charge to motion picture exhibitors and then receive a fee from the motion picture studios for the usage of that RealD eyewear by the motion picture exhibitors' consumers. Most international motion picture exhibitors purchase RealD eyewear directly from us and sell them to consumers as part of their admission or as a concession item. As a result, we are one of the world's largest distributors of passive 3D eyewear. Our recyclable eyewear is designed to fit comfortably on most viewers from ages three and up and easily over prescription eyewear. We also make available kids size RealD 3D eyewear. With the growth of 3D motion picture productions and releases, we anticipate that a market for personal and customized RealD eyewear will emerge.
RealD installation, repair and maintenance services. We hire independent contractors to perform installation, repair and maintenance services related to our RealD Cinema Systems.
Consumer electronics
Our RealD Display, RealD Format, and technologies for use in high definition televisions, laptops and other displays, as well as our active and passive eyewear, are fully tested by our engineering team before they are delivered to consumer electronics manufacturers.
Professional
We use ColorLink Japan and other manufacturing suppliers for components of many of our professional products. We complete assembly, testing and inspection in our Boulder, Colorado facilities.
Competition
The market for 3D visual display technologies is highly competitive.
Our primary competitors for our RealD Cinema Systems include Dolby Laboratories, Inc., or Dolby, X6D Limited, or Xpand, MasterImage 3D, LLC, or MasterImage, Sony Electronics, or Sony, and IMAX Corporation, or IMAX. As of December 31, 2011, these and other competitors had enabled approximately 15,300 worldwide theater screens, collectively, as compared to our approximately 19,700 RealD-enabled worldwide theater screens (which subsequently increased to approximately 20,200 screens as of March 23, 2012). Consumers may be more familiar with some of our competitors' brands in the motion picture industry. However, we believe we differentiate ourselves from our competitors in the motion picture industry for reasons that include the following:
- •
- we provide premium 3D technologies that are highly regarded by licensees and others in the motion picture industry;
- •
- our RealD Cinema Systems deliver superior light output providing for a high quality image and enabling display on larger
theater screens with one projector than most competing technologies;
- •
- we offer motion picture exhibitors a licensing model that includes technological upgrades and maintenance at no additional
charge and reduces their capital expenditures and the risk that they may purchase equipment that will become obsolete;
- •
- compared to most of our competitors' eyewear in the motion picture industry, our circular polarized passive RealD eyewear allows consumers to move around with reduced image distortion; and
17
- •
- our RealD eyewear model requires less personnel (no active collecting or washing by motion picture exhibitors) and reduces motion picture exhibitors' loss from theft and breakage.
Our primary competitors in 3D consumer electronics technologies include those who are developing 3D displays, including LG and active 3D eyewear manufacturers including Xpand. While the 3D consumer electronics industry is new and rapidly developing, we must compete with companies that enjoy competitive advantages in the consumer electronics industry.
We believe that the principal competitive factors include some or all of the following:
- •
- quality and reliability of technologies;
- •
- technology performance, flexibility and range of application;
- •
- timeliness and relevance of new product introductions;
- •
- relationships with key participants in the motion picture and consumer electronics industries;
- •
- inclusion in explicit or de facto industry standards;
- •
- brand recognition and reputation;
- •
- availability of 3D compatible, high quality content; and
- •
- price.
We believe we compete favorably with respect to many of these factors.
Intellectual property
We have a substantial base of intellectual property assets, including patents, trademarks, copyrights, trade secrets and know-how.
We have multiple patents covering unique aspects and improvements for many of our technologies. As of March 23, 2012, we had over 216 patent families comprising approximately 150 individual issued patents and approximately 264 pending patent applications in approximately 15 jurisdictions worldwide. Our issued patents are scheduled to expire at various times between May 2012 and November 2036. Of these, four patents expired in 2011, two patents are scheduled to expire in 2012, six patents are scheduled to expire in 2013, and five patents are scheduled to expire in 2014. We believe the expiration of these patents will not adversely affect our business. Our patents are used in the areas of algorithms, autostereo, eyewear, projection, format, direct view, retarder stack filters, polarization switches, eyewear protection, color switching and other areas. We currently derive our license revenue principally from our RealD Cinema Systems. Patents relating to our RealD Cinema Systems generally expire between 2012 and 2036. We pursue a general practice of filing patent applications for our technology in the United States and outside of the United States where our licensees manufacture, distribute or sell licensed products and where our competitors manufacture, distribute or sell competing products. We actively pursue new applications to expand our patent portfolio to address new technology innovations.
We have approximately 42 trademark and service mark registrations and pending applications worldwide for a variety of word marks, logos and slogans. Our registered and common law trademarks are an integral part of our licensing program and licensees typically elect to place our trademarks on their products to inform consumers that their products incorporate our technology and meet our quality specifications.
Employees
As of March 23, 2012, we had 129 employees located in the United States, Canada, the United Kingdom, Japan, Hong Kong, and China. Approximately 30 are engaged in research and development, approximately 31 are in operations, and approximately 68 are in sales and general and administrative functions. None of our employees are represented by a labor union, and we consider our employee relations to be good.
18
The risks described below could have a material adverse impact on our financial position, results of operations, liquidity and cash flows. Although it is not possible to predict or identify all such risks and uncertainties, they may include, but are not limited to, the factors discussed below. Our business operations could also be affected by additional factors that are not presently known to us or that we currently consider not to be material to our operations. You should not consider this list to be a complete statement of all risks and uncertainties.
Risks relating to our business
If motion pictures that can be viewed with RealD Cinema Systems are not made or are not commercially successful, our revenue will decline.
Almost all of our revenue is currently dependent upon both the number of 3D motion pictures released and the commercial success of those 3D motion pictures. Although we have produced alternative content in 3D, such as the production of Carmen in 3D with London's Royal Opera House, we are not actively developing 3D motion pictures or our own 3D content, other than the current production of Madam Butterfly 3D, and therefore, we rely on motion picture studios producing and releasing 3D motion pictures compatible with our RealD Cinema Systems. There is no guarantee an increasing number of 3D motion pictures will be released or that motion picture studios will continue to produce 3D motion pictures at all. Motion picture studios may refrain from producing and releasing 3D motion pictures for any number of reasons, including their lack of commercial success, consumer preferences, the lower-cost to produce 2D motion pictures or the availability of other entertainment options. The commercial success of a 3D motion picture depends on a number of factors that are outside of our control, including whether it achieves critical acclaim, timing of the release, cost, marketing efforts and promotional support for the release. In the past, consumer interest in 3D motion pictures was episodic and motion picture studios tended to use 3D motion pictures as a gimmick rather than as an artistic tool to enhance the viewing experience. If consumers' recent renewed interest in the 3D viewing experience fails to grow or it declines for any reason, box office performance may suffer and motion picture studios may reduce the number of 3D motion pictures they produce. Poor box office performance of 3D motion pictures, disruption or reduction in 3D motion picture production or conversion of two-dimensional motion pictures into 3D motion pictures, changes in release schedules, cancellations of motion picture releases in 3D versions, a reduction in marketing efforts for 3D motion pictures by motion picture studios or a lack of consumer demand for 3D motion pictures could result in lower 3D motion picture attendance, which would substantially reduce our revenue. For example, the fact that Warner Brothers was unable to convert Harry Potter and the Deathly Hallows Part 1 from 2D into 3D in time for a 2010 release in 3D negatively impacted 3D motion picture attendance and, we believe, the box office for that motion picture and our revenue in the period in which that motion picture was released.
If motion picture exhibitors do not continue to use our RealD Cinema Systems or experience financial difficulties, our growth and results of operations could be adversely affected.
Our primary licensees in the motion picture industry are motion picture exhibitors. Our license agreements with motion picture exhibitors do not obligate these licensees to deploy a specific number of our RealD Cinema Systems. We cannot predict whether any of our existing motion picture exhibitor licensees will continue to perform under their license agreements with us, whether they will renew their license agreements with us at the end of their term or whether we may now or in the future be in breach of those agreements. If motion picture exhibitors reduce or eliminate the number of 3D motion pictures that are exhibited in theaters, then motion picture studios may not produce and release 3D motion pictures and our revenue could be materially and adversely affected.
19
In addition, license revenue from AMC, Cinemark and Regal together comprised approximately 24% of our gross license revenue in the year ended March 23, 2012, 23% in the year ended March 25, 2011 and 30% in the year ended March 26, 2010. Any inability or failure by motion picture exhibitors to pay us amounts due in a timely fashion or at all could substantially reduce our cash flow and could materially and adversely impact our financial condition and results of operations.
A deterioration in our relationships with the major motion picture studios could adversely affect our business.
The six major motion picture studios accounted for approximately 82% of domestic box office revenue and all 10 of the top 10 grossing 3D motion pictures in calendar year 2011. Such 3D motion pictures are also released internationally. In addition, for our domestic operations, these major motion picture studios pay us a per use fee for our RealD eyewear. To the extent that our relationship with any of these major motion picture studios deteriorates or any of these studios stop making motion pictures that can be viewed at RealD-enabled theater screens, refuse to co-brand with us, stop using or paying for the use of or reduce the amounts paid for our RealD eyewear in domestic markets, our costs could increase and our revenue could decline, which would adversely affect our business and results of operations. We understand that at least one motion picture studio is seeking a change to the 3D eyewear business model in North America to resemble the international model. While we support multiple business models for our RealD eyewear around the world, the uncertainty and any potential dispute with a motion picture studio over the domestic eyewear business model could adversely affect our results of operations, financial condition, business and prospects.
If motion picture exhibitors do not continue converting analog theaters to digital or the pace of conversions slows, our future prospects could be limited and our business could be adversely affected.
Our RealD Cinema Systems only work in theaters equipped with digital cinema projection systems, which enable 3D motion pictures to be delivered, stored and projected electronically, and our systems are not compatible with analog motion picture projectors. Motion picture exhibitors have been converting projectors to digital cinema over the last several years, giving us the opportunity to deploy our RealD Cinema Systems. After motion picture exhibitors convert their projectors to digital cinema, they must install a silver screen and our RealD Cinema System in order to display motion pictures in RealD 3D. The conversion by motion picture exhibitors of their projectors and screens from analog to digital cinema requires significant expense. As of December 31, 2011, approximately 65% of domestic theater screens had converted to digital and approximately 45% of the international theater screens had been converted. If the market for digital cinema develops more slowly than expected, or if the motion picture exhibitors we have agreements with delay or abandon the conversion of their theaters, our ability to grow our revenue and our business could be adversely affected. While DCIP and Cinedigm financing provided funding for the digital conversion of domestic theater screens operated by many of our licensees, there has not been a similar effort to organize digital conversion in certain geographies outside North America. If the pace of digital conversion outside of the United States does not follow that which occurred inside the United States, our revenue may not grow and our business could be adversely affected.
If the deployment of our RealD Cinema Systems is delayed or not realized, our future prospects could be limited and our business could be adversely affected.
We have license agreements with motion picture exhibitors that give us the right, subject to certain exceptions, to deploy our RealD Cinema Systems if a location under contract is already equipped with our systems and they choose to install additional 3D digital projector systems. As of March 23, 2012, we were working with our motion picture exhibitor licensees to deploy our RealD Cinema Systems on up to approximately 2,700 additional screens under our existing agreements with them. However, our license agreements do not obligate our licensees to deploy a specific number of our RealD Cinema
20
Systems. Numerous factors beyond our control could influence when and whether our RealD Cinema Systems will be deployed, including motion picture exhibitors' ability to fund capital expenditures, or their decision to delay or abandon the conversion of their theaters to digital projection or reduce the number of 3D motion pictures exhibited in their theaters, and our ability to secure adequate supplies of components comprising our RealD Cinema System in any given period. If motion picture exhibitors delay, postpone or decide not to deploy RealD Cinema Systems at the number of screens they have announced, or we are unable to deploy our RealD Cinema Systems in a timely manner, our future prospects could be limited and our business could be adversely affected.
Any inability to protect our intellectual property rights could reduce the value of our 3D technologies and brand, which could adversely affect our financial condition, results of operations and business.
Our business is dependent upon our patents, trademarks, trade secrets, copyrights and other intellectual property rights. Effective intellectual property rights protection, however, may not be available under the laws of every country in which we and our licensees operate, such as China. The efforts we have taken to protect our proprietary rights may not be sufficient or effective. Any significant impairment of our intellectual property rights could harm our business or our ability to compete. In addition, protecting our intellectual property rights is costly and time consuming. It may not be practicable or cost effective for us to fully protect our intellectual property rights in some countries or jurisdictions. If we are unable to successfully identify and stop unauthorized use of our intellectual property, we could lose potential revenue and experience increased operational and enforcement costs, which could adversely affect our financial condition, results of operations and business.
It is possible that some of our 3D technologies may not be protectable by patents. In addition, given the costs of obtaining patent protection, we may choose not to protect particular innovations that later turn out to be important. Even where we do have patent protection, the scope of such protection may be insufficient to prevent third parties from designing around our particular patent claims or otherwise avoiding infringement. Furthermore, there is always the possibility that an issued patent may later be found to be invalid or unenforceable, or a competitor may attempt to engineer around our issued patent. Additionally, patents only offer a limited term of protection. Moreover, the intellectual property we maintain as trade secrets could be compromised by third parties, or intentionally or accidentally by our employees, which would cause us to lose the competitive advantage resulting from them.
We may in the future be subject to intellectual property rights disputes that are costly to defend, could require us to pay damages and could limit our ability to use particular 3D technologies in the future.
We may be exposed to, or threatened with, future litigation or any other disputes by other parties alleging that our 3D technologies infringe their intellectual property rights. Any intellectual property disputes, regardless of their merit, could be time consuming, expensive to litigate or settle and could divert management resources and attention. An adverse determination in any intellectual property dispute could require us to pay damages and/or stop using our 3D technologies, trademarks, copyrighted works and other material found to be in violation of another party's rights and could prevent us from licensing our 3D technologies to others. In order to avoid these restrictions and resolve the dispute, we may have to pay for a license. This license may not be available on reasonable terms, could require us to pay significant license fees and may significantly increase our operating expenses. A license also may not be available to us at all. As a result, we may be required to use and/or develop non-infringing alternatives, which could require significant effort and expense, or which may not be possible. If we cannot obtain a license or develop alternatives for any infringing aspects of our business, we may be forced to limit our 3D technologies and may be unable to compete effectively. In certain instances, we have contractually agreed to provide indemnification to licensees relating to our
21
intellectual property. This may require us to defend or hold harmless motion picture exhibitors, consumer electronics manufacturers or other licensees. We have from time to time corresponded with one or more third parties regarding patent enforcement issues and in-bound and out-bound patent licensing opportunities. In addition, from time to time we may be engaged in disputes regarding the licensing of our intellectual property rights, including matters related to our license fee rates and other terms of our licensing arrangements. These types of disputes can be asserted by our licensees or prospective licensees or by other third parties as part of negotiations with us or in private actions seeking monetary damages or injunctive relief or in regulatory actions. Requests for monetary and injunctive remedies asserted in claims like these could be material and could have a significant impact on our business. Any disputes with our licensees, potential licensees or other third parties could materially and adversely affect our business, results of operations and prospects.
Our RealD Cinema Systems and other technologies are generally designed for use with third-party technologies and hardware, and if we are unable to maintain the ability of our RealD Cinema Systems and other technologies to work with these third-party technologies and hardware, our business and operating results could be adversely affected.
Our RealD Cinema Systems and other technologies are generally designed for use with third-party technologies and hardware, such as Christie projectors, Doremi servers, Harkness Hall screens and Sony Electronics 4K SXRD® digital cinema projectors. Third-party technologies and hardware may be modified, re-engineered or removed altogether from the marketplace. In addition, third-party technologies used to interact with our RealD Cinema Systems, RealD Format and other 3D technologies can change without prior notice to us, which could result in increased costs or our inability to provide our 3D technologies to our licensees. If we are unable to maintain the ability of our RealD Cinema Systems, RealD Format and other 3D technologies to work with these third-party technologies and hardware, our business and operating results could be adversely affected.
If we are unable to maintain our brand and reputation for providing high quality 3D technologies, our business, results of operations and prospects could be materially harmed.
Our business, results of operations and prospects depend, in part, on maintaining and strengthening our brand and reputation for providing high quality 3D technologies. If problems with our 3D technologies cause motion picture exhibitors, consumer electronics manufacturers or other licensees to experience operational disruption or failure or delays in the delivery of their products and services to their customers, our brand and reputation could be diminished. Maintaining and strengthening our brand and reputation may be particularly challenging as we enter business segments in which we have limited experience, such as 3D consumer electronics. If we fail to promote and maintain our brand and reputation successfully, our business, results of operations and prospects could be materially harmed.
Competition from other providers of 3D technologies to the motion picture industry could adversely affect our business.
The motion picture industry is highly competitive, particularly among providers of 3D technologies. Our primary competitors include Dolby, Sony, IMAX, MasterImage and Xpand. In addition, other companies, including motion picture exhibitors and studios, may develop their own 3D technologies in the future. Consumers may also perceive the quality of 3D technologies delivered by some of our competitors to be equivalent or superior to our 3D technologies. In addition, some of our current or future competitors may have significantly greater financial, technical, marketing and other resources than we do or may have more experience or advantages in the business segments in which we compete that will allow them to offer lower prices or higher quality technologies, products or services. If we do not successfully compete with these providers of 3D technologies, we could lose market share and our
22
business could be materially and adversely affected. In addition, competition could force us to decrease prices and cause our margins to decline, which could adversely affect our business. Pricing pressures in both domestic and international motion picture exhibitor markets continue, and no assurance can be given that our margins in future periods will increase.
We face potential competition from companies with greater brand recognition and resources in the consumer electronics industry.
3D consumer electronics technologies are new and rapidly developing, and we must compete with companies that enjoy competitive advantages, including:
- •
- more developed distribution channels and deeper relationships with consumer electronics manufacturers;
- •
- a more extensive customer base;
- •
- technologies that may be better suited for 3D consumer electronics products;
- •
- broader technology, product and service offerings; and
- •
- greater resources for competitive activities, such as research and development, strategic acquisitions, alliances, joint ventures, sales and marketing, and lobbying for changes in industry and government standards.
As a result, these current and potential competitors may be able to respond more quickly and effectively than we can to new or changing opportunities, products, technologies or standards in 3D consumer electronics.
We also face competition where existing licensees relying on our RealD Cinema Systems in the motion picture industry may become current or potential competitors in 3D consumer electronics, or vice versa. For example, Sony Pictures Entertainment, Inc., or Sony Pictures, is a major motion picture studio, but certain of its affiliates also design, manufacture and market consumer electronics products and components and are marketing 3D consumer electronics. To the extent that our other licensees choose to utilize competing 3D technologies that they have developed or in which they have an interest, rather than use our 3D technologies, our growth prospects could be adversely affected.
The introduction of new 3D technologies and changes in the way that our competitors operate could harm our business. If we fail to keep up with rapidly changing 3D technologies or the growth of new and existing opportunities, our 3D technologies could become less competitive or obsolete.
The motion picture and consumer electronics industries in general are undergoing significant changes. Due to technological advances and changing consumer tastes, numerous companies have developed, and are expected to continue to develop, new 3D technologies that may compete directly with or render our 3D technologies less competitive or obsolete. We believe that original equipment manufacturers may be working to develop laser-based projection technologies, which may compete with, be incompatible with or render our RealD Cinema Systems obsolete. Competitors may develop alternative 3D technologies that are more attractive to consumers, content producers and distributors, motion picture exhibitors, consumer electronics manufacturers and others, or more cost effective than our technologies, and compete with or render our 3D technologies less competitive or obsolete. As a result of this competition, we could lose market share, which could harm our business and operating results. We expect to continue to expend considerable resources on research and development in response to changes in the motion picture and consumer electronics industries. However, we may not be able to develop and effectively market new 3D technologies that adequately or competitively address the needs of these changing industries, which could have a material and adverse effect on our business, results of operations and prospects.
23
If our 3D technologies fail to be widely adopted by or are not compatible with the needs of our licensees, our business prospects could be limited and our operating results could be adversely affected.
Our motion picture and consumer electronics licensees depend upon our 3D technologies being compatible with a wide variety of motion picture and consumer electronics systems, products and infrastructure. We make significant efforts to design our 3D technologies to address capability, quality and cost considerations so that they either meet or, where possible, exceed the needs of our licensees in the motion picture and consumer electronics industries. To have our 3D technologies widely adopted in the motion picture and consumer electronics industries, we must convince a broad spectrum of professional organizations worldwide, as well as motion picture studios and exhibitors and consumer electronics manufacturers who are members of such organizations, to adopt them and to ensure that our 3D technologies are compatible with their systems, products and infrastructure.
If our 3D technologies are not widely adopted or retained or if we fail to conform our 3D technologies to the expectations of, or standards set by, industry participants, they may not be compatible with other products and our business, operating results and prospects could be adversely affected. We expect that meeting and maintaining the needs of our licensees for compatibility with them will be significant to our business in the future. In addition, the market for broadcast technologies has traditionally been heavily regulated by governments or other regulatory bodies, and we expect this to continue to be the case in the future. If our 3D technologies are not compatible with the broadcasting infrastructure or governmental or regulatory requirements in particular geographic areas, our ability to compete in these markets could be adversely affected.
Other forms of entertainment may be more attractive to consumers than those using our 3D technologies, which could harm our growth and operating results.
We face competition for consumer attention from other forms of entertainment that may drive down motion picture box office, license revenue from motion picture exhibitors, and license revenue from 3D-enabled consumer electronic devices. We compete with a number of alternative motion picture distribution channels, such as cable, satellite, broadcast, packaged media and the Internet. There are also other forms of entertainment competing for consumers' leisure time and disposable income such as concerts, amusement parks and sporting events. A significant increase in the popularity of these alternative motion picture channels and competing forms of entertainment could reduce the demand for theatrical exhibition of 3D motion pictures, including those viewed with our RealD Cinema Systems, or the use of 3D-enabled consumer electronics devices, any of which would have an adverse effect on our business and operating results.
Our limited operating history in 3D consumer electronics presents risk to our ability to achieve success in this area.
Our 3D technologies have only recently been made available to consumer electronics manufacturers, including JVC, Panasonic, Samsung, Sony Electronics, Toshiba and Vizio, as well as electronics component suppliers such as Broadcom, to enable 3D viewing on high definition televisions, laptops and other displays. After having jointly announced with Samsung a license agreement in May 2011 which we had expected to lead to the incorporation of our RDZ™ 3D display technology into LCD panels manufactured by Samsung, we subsequently learned that Samsung's initiative to manufacture panels under the license agreement with us is no longer being pursued. To date, we have not generated revenue of any material significance from our arrangements with these and other consumer electronics manufacturers. 3D consumer electronics technologies are rapidly developing, as manufacturers are working to set standards and content producers and distributors are working on increasing the availability of new 3D content. However, the demand for our 3D technologies and the income potential from 3D consumer electronics is unproven. In addition, because 3D consumer electronics technologies are new and quickly evolving, we have limited insight into trends that may
24
emerge and affect our business. We may make errors in predicting and reacting to relevant business trends. We also may not be able to successfully address these risks on a timely basis or at all.
If consumer electronics manufacturers limit, delay or cease their use of our 3D technologies in high definition televisions, laptops and other displays or such products are not accepted by consumers, our potential growth will be significantly reduced.
We are dependent on consumer electronics manufacturers to use our RealD Display, active and passive eyewear and RealD Format technologies with their high definition televisions, laptops and other displays, and for content distributors to deliver 3D content via cable, satellite, broadcast, packaged media and the Internet. While we have entered into agreements with some consumer electronics manufacturers regarding the use of our 3D technologies in various consumer electronics products, these agreements are not exclusive, and we can give no assurances that these consumer electronics manufacturers will utilize our 3D technologies or that there will be sufficient consumer demand for 3D electronics products. In addition, since 3D consumer electronics technologies are still emerging, it is unclear if consumers will widely adopt viewing 3D content in the home and elsewhere as an attractive alternative to the 2D viewing experience. After having jointly announced with Samsung a license agreement in May 2011 which we had expected to lead to the incorporation of our RDZ™ 3D display technology into LCD panels manufactured by Samsung, Samsung's initiative to manufacture panels under the license agreement with us is no longer being pursued. The cost or lack of consumer interest in 3D technologies may cause consumer electronics manufacturers to limit, delay or cease their use of our 3D technologies. In addition, our competitors in 3D consumer electronics technologies may offer consumers superior technology or lower prices which may reduce the demand for our RealD 3D-enabled consumer electronic devices. As a result, our future prospects could be adversely affected if consumer electronics manufacturers choose not to use our 3D technologies in their devices.
Acquisition activities could result in operating difficulties, dilution to our stockholders and other harmful consequences.
We have built our business, in part, through acquisitions of intellectual property and other assets, including Stereographics in 2005 and ColorLink in 2007. We intend to selectively pursue strategic acquisitions in the future. Future acquisitions could divert management's time and focus from operating our business. In addition, integrating an acquired company, business or technology is risky and may result in unforeseen operating difficulties and expenditures. Foreign acquisitions also involve unique risks related to integration of operations across different cultures and languages, currency risks and the particular economic, political and regulatory risks associated with specific countries.
We may not accurately assess the value or prospects of acquisition candidates, and the anticipated benefits from our future acquisitions may not materialize. In addition, future acquisitions or dispositions could result in potentially dilutive issuances of our equity securities, including our common stock, the incurrence of additional debt, contingent liabilities or amortization expenses, or write-offs of goodwill, any of which could materially harm our financial condition.
Our growth may place a strain on our resources, and we may continue to borrow money as our business grows.
We have experienced significant growth since we acquired ColorLink in 2007. The growth that we have experienced in the past, as well as any further growth that we experience, may place a significant strain on our resources and increase demands on our management, our information and reporting systems and our internal controls over financial reporting. Upon becoming a public company in July 2010, we began incurring additional general and administrative expenses to comply with the U.S. Securities and Exchange Commission, or SEC, reporting requirements, the listing standards of the New York Stock Exchange, or NYSE, and provisions of the Sarbanes-Oxley Act of 2002 and the Dodd-Frank
25
Wall Street Reform and Consumer Protection Act of 2010, and will continue to incur additional research and development expenses. If we are unable to manage our growth effectively while maintaining appropriate internal controls, we may experience operating inefficiencies that could increase our costs or otherwise materially and adversely affect our financial position. In addition, as our business grows, we may borrow money to fund various growth initiatives, including accelerated research and product development, acquisitions, capital expenditures or stock repurchases, which will result in debt service payment obligations and will require us to comply with certain financial and operating covenants. For example, we recently entered into a secured credit facility agreement with City National Bank, or City National, to increase our borrowing capacity to an aggregate of $125 million. We may draw on our secured credit facility in order to fund growth initiatives and repurchase our common stock. In the event we breach any of the covenants under our credit agreements or are unable to pay our obligations to City National or other lenders as they become due, we may become in default under our credit agreements which will have a material and adverse effect on our business, results of operations and financial condition.
Our level of indebtedness reduces our financial flexibility and could impede our ability to operate.
We recently entered into a secured credit facility agreement with City National to provide the Company with:
- •
- a revolving credit facility (including a letter of credit sub-facility) in a maximum amount not to exceed
$75,000,000 (the "Revolving Facility"); and
- •
- a delayed-draw term loan facility in a maximum amount not to exceed $50,000,000 (the "Term Loan Facility").
The Revolving Facility and the Term Loan Facility replaced pre-existing revolving and term loan facilities provided under our pre-existing credit and security agreement with City National, which had been most recently amended on December 6, 2011.
Our obligations under our secured credit facility are secured by a first priority security interest in substantially all of our tangible and intangible assets and are fully and unconditionally guaranteed by our subsidiaries, ColorLink Inc., a Delaware corporation ("ColorLink"), and Stereographics Corporation, a California corporation ("Stereographics").
We intend to borrow additional amounts under our secured credit facility to fund various growth initiatives, including accelerated research and product development, acquisitions, capital expenditures and stock repurchases. We expect that we will maintain a significant amount of indebtedness on an ongoing basis. Our Revolving Facility matures on April 17, 2015, and the Term Loan Facility matures the last day of the twelfth (12th) full fiscal quarter after the earlier of October 18, 2013 or the date that aggregate term loan commitments have been drawn in full, which maturity dates may, in each case, be accelerated in certain circumstances.
There is no assurance that we will be able to refinance our outstanding indebtedness, or if refinancing is available, that it can be obtained on terms we can afford. The capital markets have recently experienced a high degree of volatility. To the extent that volatility in the capital markets continues, our access to capital may become limited and its borrowing costs may materially increase.
Our credit facilities require us to pay a variable rate of interest, which will increase or decrease based on variations in certain financial indexes, and fluctuations in interest rates can significantly decrease our profits. We do not have any hedge or similar contracts that would protect us against changes in interest rates.
26
The amount of our indebtedness could have important consequences for you, including the following:
- •
- requiring us to dedicate a substantial portion of our cash flow from operations to make payments on our debt, thereby
reducing funds available for operations, future business opportunities and other purposes;
- •
- limiting our flexibility in planning for, or reacting to, changes in our business and the industry in which we operate;
- •
- making it more difficult for us to satisfy our debt obligations, and any failure to comply with such obligations,
including financial and other restrictive covenants, could result in an event of default under the agreements governing such indebtedness, which could lead to, among other things, an acceleration of
our indebtedness or foreclosure on the assets securing our indebtedness, which could have a material adverse effect on our business or financial condition;
- •
- limiting our ability to borrow additional funds, or to sell assets to raise funds, if needed, for working capital, capital
expenditures, acquisitions or other purposes; and
- •
- increasing our vulnerability to general adverse economic and industry conditions, including changes in interest rates.
Our indebtedness was $25 million as of March 23, 2012. We may not generate sufficient cash flow from operations to service and repay our debt and related obligations and have sufficient funds left over to achieve or sustain profitability in our operations, meet our working capital and capital expenditure needs or compete successfully in our industry, particularly if we access our increased Revolving Facility and Term Loan Facility.
Our credit facilities impose, and the terms of any future indebtedness may impose, significant operating, financial and other restrictions on us and our subsidiaries.
Restrictions imposed by our credit facilities will limit or prohibit, among other things, our ability to:
- •
- incur additional debt
- •
- make certain investments or acquisitions
- •
- enter into certain merger and consolidation transactions, and
- •
- sell our assets other than in the ordinary course of business.
We are also required to maintain compliance with certain financial covenants, including a minimum fixed charge coverage ratio and a maximum leverage ratio. If we fail to comply with any of the covenants or if any other event of default, as defined in our credit facilities, should occur, the lenders could elect to prevent us from borrowing and declare the indebtedness to be immediately due and payable.
These restrictions could adversely affect our ability to finance our future operations or capital needs and pursue available business opportunities. A breach of any of these restrictions, including breach of financial covenants, could result in a default in respect of the related indebtedness. If a default occurs, the relevant lenders could elect to declare the indebtedness, together with accrued interest and fees, to be immediately due and payable and proceed against any collateral securing that indebtedness, which will constitute substantially all of our assets.
27
We may incur future asset impairment charges.
An asset impairment charge may result from the occurrence of unexpected adverse events or management decisions that impact our estimates of expected cash flows generated from our long-lived assets. We review our long-lived assets for impairment, when events or changes in circumstances indicate the carrying value of an asset may not be recoverable. We may be required to recognize asset impairment charges in the future as a result of reductions in demand for specific technologies, a weak economic environment, challenging market conditions, events related to particular customers or asset type, or as a result of asset or portfolio sale decisions by management.
We face risks from doing business internationally that could harm our business, financial condition and results of operations.
We are dependent on international business for a significant portion of our total revenue. International gross revenue accounted for approximately 49% in fiscal 2012, 55% in fiscal 2011 and 46% in fiscal 2010. We expect that our international business will continue to represent a significant portion of our total revenue for the foreseeable future. This future revenue will depend to a large extent on the continued use and expansion of our 3D technologies in the motion picture and consumer electronics industries worldwide. As a result, our business is subject to certain risks inherent in international business operations, many of which are beyond our control. These risks include:
- •
- competitive and pricing pressures that vary from market-to-market and
place-to-place;
- •
- fluctuating foreign exchange rates and systems;
- •
- laws and policies affecting trade, investment and taxes, including laws and policies relating to customs, duties, the
repatriation of funds and withholding taxes and changes in these laws and our compliance with the foregoing;
- •
- changes in local regulatory requirements, including restrictions on content;
- •
- differing cultural tastes and attitudes;
- •
- differing degrees of protection for intellectual property;
- •
- the need to adapt our business model to local requirements;
- •
- the instability of foreign economies and governments; and
- •
- political instability, natural disaster, war or acts of terrorism.
Events or developments related to these and other risks associated with our international business operations could adversely affect our revenue from such operations, which could have a material and adverse effect on our business, financial condition and results of operations.
Our operating results may fluctuate substantially from quarter to quarter, which may be different from analysts' expectations and adversely affect our stock price.
Our operating results may fluctuate from quarter to quarter. Factors that have affected our operating results in the past, and are likely to affect our operating results in the future, include, among other things:
- •
- the timing of when a 3D motion picture is released which tends to be based on specific consumer entertainment dynamics,
which results in seasonal patterns, with the largest number of motion pictures being released in summer and early winter;
- •
- the rate of installations of new RealD Cinema Systems, which we expect to decrease with the passage of time;
28
- •
- the timing of capital expenditures and expenses, including depreciation expense of our RealD Cinema Systems deployed at a
motion picture exhibitor's premises (we expect capital expenditures to decrease, and depreciation expense to increase, as our RealD Cinema Systems business matures), digital projector depreciation
expenses, RealD eyewear costs (including shipping, handling and recycling costs), field service and support costs, and occupancy costs, which may increase significantly, even in quarters when we do
not experience a similar growth in revenue;
- •
- the timing and accuracy of license fee reports which often include positive or negative corrective or retroactive license
fees that cover extended periods of time; and
- •
- competitive and pricing pressures that vary from market-to-market and place-to-place.
In addition, variances in our operating results from analysts' expectations could adversely affect our stock price. See also "Part II, Item 7: Management's discussion and analysis of financial condition and results of operations—Seasonality and Quarterly Performance."
Our RealD eyewear may, in the future, be regulated by the Food and Drug Administration, or FDA, or by other state or foreign governmental or regulatory agencies, which could increase our costs and materially and adversely impact our profitability.
Currently, polarized 3D eyewear, including our RealD eyewear, is not regulated by the FDA, or by state or foreign governmental and regulatory agencies. However, certain eyewear, such as non-prescription reading glasses and sunglasses, are considered to be medical devices by the FDA and are subject to regulations imposed by the FDA and various state and foreign governmental and regulatory agencies. With the rising popularity of polarized 3D eyewear, there has been an increasing level of public scrutiny examining its potential health risks. Polarized 3D eyewear, including our RealD eyewear, may at some point be subject to federal, state or foreign regulations that could potentially restrict how our RealD eyewear is produced, used or marketed, and the cost of complying with those regulations may adversely affect our profitability.
If 3D viewing with active or passive eyewear is found to cause health risks or consumers believe that it does, demand for the 3D viewing experience may decrease or we may become subject to liability, any of which could adversely affect our results of operations, financial condition, business and prospects.
Research conducted by institutions unrelated to us has suggested that 3D viewing with active or passive eyewear may cause vision fatigue, eye strain, discomfort, headaches, motion sickness, dizziness, nausea, epileptic seizures, strokes, disorientation, perceptual after-effects, decreased postural stability or other health risks in some consumers. If these potential health risks are substantiated or consumers believe in their validity, demand for the 3D viewing experience in the theater, the home and elsewhere may decline. As a result, major motion picture studios and other content producers and distributors may refrain from developing 3D content, motion picture exhibitors may reduce the number of 3D-enabled screens (including RealD-enabled screens) they currently deploy or plan to deploy, or they may reduce the number of 3D motion pictures exhibited in their theaters, which would adversely affect our results of operations, financial condition and prospects. A decline in consumer demand may also lead consumer electronics manufacturers and content distributors to reduce or abandon the production of 3D products, which could adversely affect our prospects and financial condition.
In addition, if health risks associated with our RealD eyewear materialize, we may become subject to governmental regulation or product liability claims, including claims for personal injury. Successful assertion against us of one or a series of large claims could materially harm our business. Also, if our RealD eyewear is found to be defective, we may be required to recall it, which may result in substantial expense and adverse publicity that could adversely impact our sales, operating results and reputation. Potential product liability claims may exceed the amount of our insurance coverage or may be excluded
29
under the terms of the policy, which could adversely affect our financial condition. In addition, we may also be required to pay higher premiums and accept higher deductibles in order to secure adequate insurance coverage in the future, which could materially and adversely affect our results of operations, financial condition and business. Even meritless product liability claims could be expensive to resolve and may divert our management's attention.
Our agreements with motion picture studios domestically and motion picture exhibitors internationally require us to manage the supply chain of our RealD eyewear, and any interruption to the supply chain for our RealD eyewear components could adversely affect our results of operations, financial condition, business and prospects.
Our RealD eyewear is an integral part of our RealD Cinema Systems. We have entered into non-exclusive agreements with several manufacturers to produce RealD eyewear. We manage manufacturing, distribution and recycling of RealD eyewear for motion picture studios and exhibitors worldwide. Domestically, we generally provide our RealD eyewear free of charge to motion picture exhibitors and then receive a fee from the motion picture studios for the usage of that RealD eyewear by the motion picture exhibitors' customers. Most international motion picture exhibitors and some domestic motion picture exhibitors purchase RealD eyewear directly from us and sell them to consumers as part of their admission or as a concession item. Any interruption in the supply of RealD eyewear from manufacturers, increase in shipping cost, logistics or recycling interruption, other disruption to our global supply chain or competitive pricing pressures could adversely affect our results of operations, financial condition, business and prospects. For example, in connection with recent major 3D motion picture releases and increased consumer demand, we have in the past exhausted our inventory of RealD eyewear and incurred increased shipping costs to accelerate delivery.
Our RealD 3D eyewear business model in North America relies on fees from motion picture studios for the usage of RealD eyewear by motion picture exhibitors' customers, the uncertainty and any potential dispute between motion picture studios and exhibitors could adversely affect our results of operations, financial condition, business and prospects.
Our RealD eyewear is an integral part of our RealD Cinema Systems. Domestically, we provide our RealD eyewear free of charge to motion picture exhibitors and then receive a fee from the motion picture studios for the usage of that RealD eyewear by the motion picture exhibitors' customers. Most international motion picture exhibitors purchase RealD eyewear directly from us and sell them to customers as part of their admission or as a concession. We understand that at least one major motion picture studio is seeking a change to the 3D eyewear business model in North America to resemble the international model. While we support multiple business models for our RealD eyewear around the world, the uncertainty and any potential dispute between motion picture studios and exhibitors over the domestic eyewear business model could adversely affect our results of operations, financial condition, business and prospects. In addition, we expect that current profitability in our RealD eyewear business may not be sustainable, as motion picture studios with whom we do business seek to recover our cost savings and efficiencies in the form of reduced prices for eyewear.
Economic conditions beyond our control could reduce consumer demand for motion pictures and consumer electronics using our 3D technologies and, as a result, could materially and adversely affect our business, revenue and growth prospects.
The global economic environment since late 2008 has been volatile and continues to pose risks. The economy could remain significantly challenged for an indeterminate period of time. Present economic conditions could lead to a decrease in discretionary consumer spending, resulting in lower motion picture box office revenue. In the event of declining box office revenue, motion picture studios may be less willing to release 3D motion pictures and motion picture exhibitors may be less willing to
30
license our RealD Cinema Systems. Further, a decrease in discretionary consumer spending may adversely affect future demand for 3D consumer electronics products that may use our 3D technologies and consumer electronics manufacturers may decide to limit, delay or cease their use of our 3D technologies, any of which could cause our business, revenue and growth prospects to suffer.
The loss of members of our management or research and development teams could substantially disrupt our business operations.
Our success depends to a significant degree upon the continued individual and collective contributions of our management and research and development teams. A limited number of individuals have primary responsibility for managing our business, including our relationships with motion picture studios and exhibitors and consumer electronics manufacturers and the research and development of our 3D technologies. The loss of any of these individuals, including Michael V. Lewis, our Chairman and Chief Executive Officer, or our failure to attract and retain other qualified and experienced personnel on acceptable terms, could impair our ability to sustain and grow our business. In addition, because we operate in a highly competitive industry, our hiring of qualified executives, scientists, engineers or other personnel may cause us or those persons to be subject to lawsuits alleging misappropriation of trade secrets, improper solicitation of employees, breach of contract or other claims.
Our ability to use our net operating loss carryforwards could be subject to additional limitation if our ownership has changed or will change by more than 50%, which could potentially result in increased future tax liability.
While currently subject to certain valuation allowances for purposes of preparing our consolidated financial statements (see the discussion under the heading "Management's discussion and analysis of financial condition and results of operations—Critical accounting policies and estimates—Deferred tax asset valuation and tax exposures" in Part II, Item 7 of this Annual Report on Form 10-K), we intend to use our U.S. net operating loss carryforwards to reduce any future U.S. corporate income tax liability associated with our operations. Section 382 of the U.S. Internal Revenue Code of 1986, as amended, generally imposes an annual limitation on the amount of net operating loss carryforwards that may be used to offset taxable income when a corporation has undergone significant changes in stock ownership. We have not determined whether such ownership change has previously occurred. It is possible that our initial public offering, or IPO, either on a standalone basis or when combined with past or future transactions (including, but not limited to, significant increases during the applicable testing period in the percentage of our stock owned directly or constructively by (i) any stockholder who owns 5% or more of our stock or (ii) some or all of the group of stockholders who individually own less than 5% of our stock), will cause us to undergo one or more ownership changes. In that event, our ability to use our net operating loss carryforwards could be adversely affected. To the extent our use of net operating loss carryforwards is significantly limited under the rules of Section 382 (as a result of our IPO or otherwise), our income could be subject to U.S. corporate income tax earlier than it would if we were able to use net operating loss carryforwards, which could result in lower profits.
Prior to the fiscal year ended March 23, 2012, we had a history of net losses and may suffer losses in the future.
While we were profitable in the fiscal year ended March 23, 2012, we incurred net losses in our fiscal years ended 2011, 2010, 2009 and 2008. If we cannot maintain profitability, our financial condition will deteriorate, and we may be unable to achieve our business objectives.
31
Risks related to owning our common stock
The price of our common stock may fluctuate significantly, and you could lose all or part of your investment.
Shares of our common stock were sold in our IPO in July 2010 at a price of $16.00 per share, and, as of May 29, 2012, our common stock has subsequently traded as high as $35.60 and as low as $7.85. An active, liquid and orderly market for our common stock may not be sustained, which could depress the trading price of our common stock.
Volatility in the market price of our common stock may prevent you from being able to sell your shares at or above the price you paid for your shares or at all. The market price of our common stock could fluctuate significantly for various reasons, which include:
- •
- our quarterly or annual earnings or those of our competitors;
- •
- the public's reaction to our press releases, our other public announcements and our filings with the SEC;
- •
- changes in earnings estimates or recommendations by research analysts who track our common stock or the stock of our
competitors;
- •
- new laws or regulations or new interpretations of laws or regulations applicable to our business;
- •
- changes in accounting standards, policies, guidance, interpretations or principles;
- •
- changes in general conditions in the domestic and global economies or financial markets, including those resulting from
war, incidents of terrorism or responses to such events;
- •
- litigation involving our company or investigations or audits by regulators into the operations of our company or our
competitors;
- •
- strategic action by our competitors; and
- •
- sales of common stock by our directors, executive officers and significant stockholders.
In addition, the stock market in general, and the market for technology and media companies in particular, has experienced extreme price and volume fluctuations that have often been unrelated or disproportionate to the operating performance of those companies. Broad market and industry factors may seriously affect the market price of our common stock, regardless of actual operating performance. In addition, in the past, following periods of volatility in the overall market and the market price of a particular company's securities, securities class action litigation has often been instituted against these companies. If litigation is instituted against us, it could result in substantial costs and a diversion of our management's attention and resources even if such litigation is without merit.
Sales of outstanding shares of our common stock (or shares of our common stock issued upon exercise of stock options) into the market in the future could cause the market price of our stock to drop significantly, even if our business is doing well.
As of May 29, 2012, we had 54,629,717 shares of common stock outstanding which are freely tradable, subject to prior registration or qualification for an exemption from registration, including, in the case of shares held by affiliates, compliance with the volume, manner of sale, notice and availability of public information provisions of Rule 144 under the Securities Act of 1933, as amended, or the Securities Act. Our co-founders and certain other pre-IPO stockholders also have registration rights which enable them to cause us to register for sale shares held by them in the public markets. If our existing security holders sell, or indicate an intention to sell, substantial amounts of our common stock in the public market, the trading price of our common stock could decline.
32
In addition, as of March 23, 2012, there are 8,492,456 shares underlying options and restricted stock units and we have an aggregate of 3,077,247 shares of common stock reserved for future issuance under our equity incentive plan and employee stock purchase plan. These shares will become eligible for sale in the public market to the extent permitted by the provisions of various option and warrant agreements, maintenance of applicable registration statements and Rules 144 and 701 under the Securities Act. If additional shares are sold, or if it is perceived that they will be sold in the public market, the trading price of our stock could decline.
Our co-founders, directors, executive officers and principal stockholders have substantial control over us and could delay or prevent a change in corporate control.
As of March 23, 2012, our directors and executive officers, together with their affiliates, beneficially owned approximately 18.88% of our outstanding common stock. Of this 18.88%, approximately 10.15% was beneficially owned by Michael V. Lewis, our chairman and chief executive officer, and approximately 4.31% was beneficially owned by Joshua Greer, our co-founder and member of our board of directors.
These stockholders, acting together, have the ability to control, or have significant influence over, the outcome of matters submitted to our stockholders for approval, including the election of directors and any merger, consolidation or sale of all or substantially all of our assets. In addition, these stockholders, acting together, have the ability to control, or have significant influence over, the management and affairs of our company. Accordingly, this concentration of ownership might harm the market price of our common stock by:
- •
- delaying, deferring or preventing a change in corporate control;
- •
- impeding a merger, consolidation, takeover or other business combination involving us; or
- •
- discouraging a potential acquirer from making a tender offer or otherwise attempting to obtain control of us.
As a public company, we are required to assess our internal control over financial reporting on an annual basis, and any future adverse results from such assessment could result in a loss of investor confidence in our financial reports and have an adverse effect on our stock price.
As a public company, the Sarbanes-Oxley Act requires, among other things, that we maintain effective internal control over financial reporting and disclosure controls and procedures. In particular, we need to perform system and process evaluation and testing of our internal control over financial reporting to allow management and our independent registered public accounting firm to report on the effectiveness of our internal control over financial reporting, as required by Section 404 of the Sarbanes-Oxley Act. Our testing, or the subsequent testing by our independent registered public accounting firm, may reveal deficiencies in our internal control over financial reporting that are deemed to be material weaknesses. Our compliance with Section 404 requires that we expend significant management time on compliance-related issues. Moreover, if we are not able to comply with the requirements of Section 404 in a timely manner, or if we or our independent registered public accounting firm identify deficiencies in our internal control over financial reporting that are deemed to be material weaknesses, the market price of our common stock could decline and we could be subject to sanctions or investigations by the SEC or other regulatory authorities, which could require additional financial and management resources.
33
Your percentage ownership in us may be diluted by future issuances of capital stock, which could reduce your influence over matters on which stockholders vote.
Our board of directors has the authority, without action or vote of our stockholders, to issue all or any part of our authorized but unissued shares of common stock, including shares issuable upon the exercise of options, shares that may be issued to satisfy our obligations under our equity incentive plans, shares that may be issued in connection with our acquisition of other companies, assets or technology, or shares of our authorized but unissued preferred stock. Issuances of common stock or preferred voting stock could reduce your influence over matters on which our stockholders vote and, in the case of issuances of preferred stock, likely could result in your interest in us being subject to the prior rights of holders of that preferred stock. In addition, any future issuance of capital stock by us will dilute your economic interest in our company.
We currently do not intend to pay dividends on our common stock and, consequently, your only opportunity to achieve a return on your investment is if the price of our common stock appreciates.
We do not expect to pay dividends on shares of our common stock in the foreseeable future, and we intend to use cash generated from operations to continue to grow our business. Consequently, your only opportunity to achieve a positive return on your investment in us will be if the market price of our common stock appreciates.
If securities or industry analysts cease to publish research or publish inaccurate or unfavorable research about our business, our stock price and trading volume could decline.
The trading market for our common stock depends in part on the research and reports that securities or industry analysts publish about us or our business. If one or more of the analysts who cover us downgrade our stock or publish inaccurate or unfavorable research about our business, our stock price would likely decline. If one or more of these analysts cease coverage of our company or fail to publish reports on us regularly, demand for our stock could decrease, which might cause our stock price and trading volume to decline.
Provisions in our certificate of incorporation and bylaws and Delaware law may discourage, delay or prevent a change of control of our company or changes in our management and, therefore, may depress the trading price of our stock.
Our certificate of incorporation and bylaws contain provisions that could depress the trading price of our stock by acting to discourage, delay or prevent a change of control of our company or changes in our management that some of the stockholders of our company may deem advantageous. Some of these provisions:
- •
- authorize the issuance of "blank check" preferred stock that our board of directors could issue to increase the number of
outstanding shares to discourage a takeover attempt;
- •
- provide for a classified board of directors (three classes) where only one-third of our board of directors is
up for re-election at the annual stockholders meeting each year;
- •
- provide that stockholders may only remove directors for cause;
- •
- provide that stockholders may only remove directors prior to the expiration of their term upon a supermajority vote of at
least 80% of our outstanding common stock;
- •
- provide that any vacancy on our board of directors, including a vacancy resulting from an increase in the size of the board, may only be filled by the affirmative vote of a majority of our directors then in office, even if less than a quorum;
34
- •
- provide that a special meeting of stockholders may only be called by our board of directors or by our chief executive
officer;
- •
- provide that action by written consent of the stockholders may be taken only if the board of directors first approves such
action; provided that, notwithstanding the foregoing, we will hold an annual meeting of stockholders in accordance with NYSE rules, for so long as our shares are listed on NYSE, and as otherwise
required by the bylaws;
- •
- provide that the board of directors is expressly authorized to make, alter or repeal our bylaws; and
- •
- establish advance notice requirements for nominations for elections to our board of directors or for proposing matters that can be acted upon by stockholders at stockholder meetings.
We may also adopt a "poison pill" stockholder rights plan at any time in response to a potentially hostile bid or for any or no reason due to our available "blank check" preferred stock. Additionally, we are subject to Section 203 of the Delaware General Corporation Law, which generally prohibits a Delaware corporation from engaging in any of a broad range of business combinations with any "interested" stockholder for a period of three years following the date on which the stockholder became an "interested" stockholder.
Item 1B. Unresolved staff comments
None.
Our principal properties as of March 23, 2012 are set forth below:
Our corporate headquarters and principal operations are located in Beverly Hills, California, where we lease and occupy approximately 43,500 square feet. The term of our lease for our Beverly Hills corporate headquarters expires in August 2021, with an option for us to extend the term of the lease for one additional five-year period.
We also have three facilities in Boulder, Colorado, where we lease and occupy a total of approximately 46,300 square feet. The terms of these leases expire in May 2012, October 2012 and August 2016.
We also have offices outside London in Hemel Hempstead and Oxford, United Kingdom where we lease and occupy a total of approximately 7,400 square feet. The terms of these leases expire in January 2020 and May 2013, respectively.
We also have offices in Tokyo, Japan where we lease and occupy approximately 1,400 square feet. The term of this lease expires in December 2013.
We also have offices in Shanghai, China where we lease and occupy approximately 1,000 square feet. The term of these leases expire in July 2012 and September 2016.
We also have offices in Beijing, China where we lease and occupy approximately 500 square feet. The term of this lease expires in June 2012.
We also have offices in Wan Chai, Hong Kong where we lease and occupy approximately 200 square feet. The term of this lease expires in July 2013.
We believe that our facilities are in good condition and generally suitable and adequate for our needs for the foreseeable future. However, we will continue to seek additional space as needed to satisfy our growth.
35
We are involved in various legal proceedings from time to time arising from the normal course of business activities, including claims related to alleged infringement of intellectual property rights, commercial, antitrust, employment and other matters. Our management believes that losses in excess of the amounts accrued arising from such lawsuits are remote, but that litigation is necessarily uncertain and there is the potential for a material adverse effect on our financial statements if one or more matters are resolved in a particular period in an amount in excess of that anticipated by management.
Item 4. Mine Safety Disclosures
Not applicable.
Item 5. Market for registrant's common equity, related stockholder matters and issuer purchases of equity securities
Market information and holders
Our common stock is traded on the New York Stock Exchange under the symbol "RLD." The following table shows, for the periods indicated, the high and low per share sale prices of our common stock, as reported by the New York Stock Exchange.
| |
Prices | ||||||
|---|---|---|---|---|---|---|---|
| |
High | Low | |||||
Fiscal year ended March 23, 2012: |
|||||||
First quarter |
$ | 35.60 | $ | 19.51 | |||
Second quarter |
$ | 24.89 | $ | 9.47 | |||
Third quarter |
$ | 13.30 | $ | 7.85 | |||
Fourth quarter |
$ | 13.18 | $ | 7.89 | |||
Fiscal year ended March 25, 2011: |
|||||||
First quarter(1) |
N/A | N/A | |||||
Second quarter |
$ | 21.00 | $ | 15.63 | |||
Third quarter |
$ | 30.68 | $ | 16.00 | |||
Fourth quarter |
$ | 28.50 | $ | 21.12 | |||
- (1)
- On July 21, 2010, we completed the initial public offering of our common stock in which we sold and issued 6 million shares of common stock at an issue price of $16.00 per share.
On May 29, 2012, the last reported sales price of our common stock on the New York Stock Exchange was $11.86 per share. According to the records of our transfer agent, we had 54,629,717 stockholders of record of our common stock on May 29, 2012. Because brokers and other institutions hold many of our shares on behalf of stockholders, we are unable to estimate the total number of stockholders represented by these record holders.
Dividends
We currently intend to retain any future earnings and do not expect to pay any dividends in the foreseeable future. Instead, we expect that all of our earnings in the foreseeable future will be used for the operation and growth of our business. Any future determination to pay dividends on our common stock will be at the discretion of our board of directors and will depend upon various factors, including our financial condition, results of operations, capital requirements, any restrictions that may be imposed
36
by applicable law and our contracts and such other factors as are deemed relevant by our board of directors.
Equity compensation plan information
The following table summarizes our equity compensation plans as of March 23, 2012:
| |
Number of Securities to be Issued Upon Exercise of Outstanding Options and Rights |
Weighted-average Exercise Price of Outstanding Options and Rights |
Number of Securities Remaining Available for Future Issuance Under Equity Compensation Plans (Excluding Securities Reflected in Column (a)) |
|||||||
|---|---|---|---|---|---|---|---|---|---|---|
| |
(a) |
(b) |
(c) |
|||||||
Equity compensation plans approved by security holders(1) |
8,492,456 | $ | 12.78 | 3,077,247 | ||||||
Equity compensation plans not approved by security holders |
— | — | — | |||||||
Total |
8,472,431 | $ | 12.78 | 3,077,247 | ||||||
- (1)
- The weighted average exercise price under column (b) with respect to equity compensation plans does not include shares issuable upon the vesting of outstanding restricted stock units which have no exercise price.
37
Performance graph
This performance graph shall not be deemed "soliciting material" or to be "filed" with the SEC for purposes of Section 18 of the Securities Exchange Act of 1934, as amended, or otherwise subject to the liabilities under that Section, and shall not be deemed to be incorporated by reference into any filing of RealD Inc. under the Securities Act of 1933, as amended.
The following graph compares the cumulative total return for the period from July 16, 2010, the date of our IPO, to March 23, 2012 provided stockholders on RealD Inc.'s common stock relative to the cumulative total returns of the NYSE Composite Index, the Russell 2000 Index and the Bloomberg Hollywood Reporter Index.
Comparison of Cumulative Total Return*
Among the NYSE Composite Index, the Russell 2000 Index
and the Bloomberg Hollywood Reporter Index
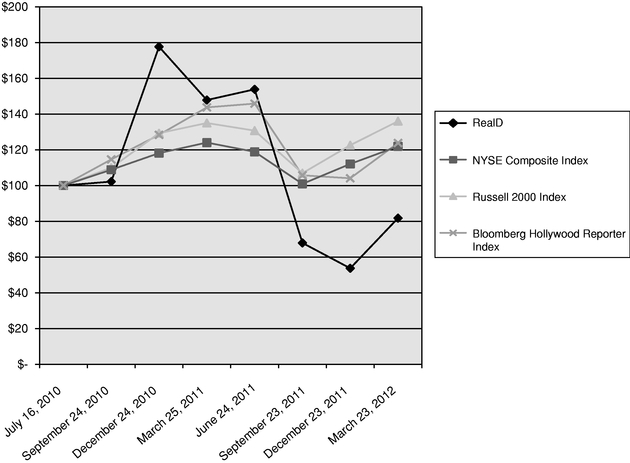
| |
July 16, 2010 |
September 24, 2010 |
December 24, 2010(1) |
March 25, 2011 |
June 24, 2011 |
September 23, 2011 |
December 23, 2011 |
March 23, 2012 |
|||||||||||||||||
|---|---|---|---|---|---|---|---|---|---|---|---|---|---|---|---|---|---|---|---|---|---|---|---|---|---|
RealD |
$ | 100.00 | $ | 102.19 | $ | 177.63 | $ | 147.81 | $ | 153.81 | $ | 67.88 | $ | 53.69 | $ | 81.75 | |||||||||
NYSE Composite Index |
$ | 100.00 | $ | 108.82 | $ | 118.12 | $ | 124.03 | $ | 118.86 | $ | 100.91 | $ | 112.06 | $ | 121.92 | |||||||||
Russell 2000 Index |
$ | 100.00 | $ | 109.93 | $ | 129.26 | $ | 134.97 | $ | 130.70 | $ | 106.89 | $ | 122.54 | $ | 135.98 | |||||||||
Bloomberg Hollywood Reporter Index |
$ | 100.00 | $ | 114.59 | $ | 128.35 | $ | 143.71 | $ | 145.83 | $ | 105.71 | $ | 104.05 | $ | 123.79 | |||||||||
- *
- Assumes that $100.00 was invested in RealD common stock at our IPO offering price of $16.00 and in each index at market closing prices on July 16, 2010 and that all dividends were reinvested. No cash dividends have been declared on our common stock. Stockholder returns over the indicated period should not be considered indicative of future stockholder returns.
38
- (1)
- Cumulative total return for the quarter ended December 24, 2010 is based on the closing price of the respective stock or index on December 23, 2010, the last trading day of the quarter ended December 24, 2010.
Issuer purchases of equity securities
On April 20, 2012, we announced that our board of directors had approved an authorization for the Company to repurchase up to $50 million of RealD common stock. The number of shares to be repurchased and the timing of any potential repurchases will depend on factors such as the Company's stock price, economic and market conditions, alternative uses of capital, and corporate and regulatory requirements. Repurchases of common stock may be made under a Rule 10b5-1 plan, which would permit common stock to be repurchased when RealD might otherwise be precluded from doing so under insider trading laws, and a variety of other methods, including open market purchases, privately negotiated transactions, block trades, accelerated share repurchase transactions, or by any combination of such methods. The repurchase program may be suspended or discontinued at any time.
Item 6. Selected financial data
The selected financial data set forth below should be read in conjunction with our consolidated financial statements and related notes and "Management's discussion and analysis of financial condition and results of operations" in Part II, Item 7 appearing elsewhere in this Annual Report on Form 10-K.
The selected consolidated statement of operations data for the years ended March 23, 2012, March 25, 2011 and March 26, 2010 and the selected consolidated balance sheet data as of March 23, 2012 and March 25, 2011, have been derived from our audited consolidated financial statements included elsewhere in this Annual Report on Form 10-K. The selected consolidated statement of operations data for the years ended March 27, 2009 and March 31, 2008 and the selected consolidated balance sheet data as of March 26, 2010, March 27, 2009 and March 31, 2008 have been derived from our audited consolidated financial statements, which are not included in this Annual Report on
39
Form 10-K. Historical results are not necessarily indicative of the results to be expected for future periods.
| |
Year ended | |||||||||||||||
|---|---|---|---|---|---|---|---|---|---|---|---|---|---|---|---|---|
(in thousands, except per share data)
|
March 23, 2012 |
March 25, 2011 |
March 26, 2010 |
March 27, 2009 |
March 31, 2008 |
|||||||||||
Consolidated Statement of Operations Data: |
||||||||||||||||
Net revenue |
$ | 246,628 | $ | 246,136 | $ | 149,846 | $ | 39,675 | $ | 23,378 | ||||||
Cost of revenue |
117,938 | 178,396 | 140,603 | 27,107 | 13,500 | |||||||||||
Gross margin |
128,690 | 67,740 | 9,243 | 12,568 | 9,878 | |||||||||||
Operating expenses: |
||||||||||||||||
Research and development |
16,500 | 15,582 | 11,021 | 8,915 | 11,166 | |||||||||||
Selling and marketing |
27,682 | 24,139 | 16,811 | 11,009 | 7,311 | |||||||||||
General and administrative |
42,189 | 35,835 | 15,638 | 7,940 | 8,006 | |||||||||||
Total operating expenses |
86,371 | 75,556 | 43,470 | 27,864 | 26,483 | |||||||||||
Operating income (loss) |
42,319 | (7,816 | ) | (34,227 | ) | (15,296 | ) | (16,605 | ) | |||||||
Interest expense |
(971 | ) | (919 | ) | (1,730 | ) | (949 | ) | (1,257 | ) | ||||||
Other income (loss) |
782 | 6,182 | (1,112 | ) | 100 | (7 | ) | |||||||||
Income tax expense |
5,105 | 4,272 | 2,680 | 219 | 20 | |||||||||||
Net income (loss) |
37,025 | (6,825 | ) | (39,749 | ) | (16,364 | ) | (29,685 | ) | |||||||
Accretion of preferred stock |
— | (4,934 | ) | (12,372 | ) | (9,826 | ) | (8,001 | ) | |||||||
Net income (loss) attributable to RealD Inc. common stockholders |
$ | 36,869 | $ | (12,289 | ) | $ | (51,225 | ) | $ | (25,463 | ) | $ | (37,265 | ) | ||
Basic earnings (loss) per share of common stock(1) |
$ | 0.68 | $ | (0.29 | ) | $ | (2.09 | ) | $ | (1.06 | ) | $ | (1.57 | ) | ||
Diluted earnings (loss) per share of common stock(1) |
$ | 0.65 | $ | (0.29 | ) | $ | (2.09 | ) | $ | (1.06 | ) | $ | (1.57 | ) | ||
Shares used in computing basic earnings (loss) per share of common stock(1) |
54,352 | 41,933 | 24,500 | 24,027 | 23,713 | |||||||||||
Shares used in computing diluted earnings (loss) per share of common stock(1) |
56,852 | 41,933 | 24,500 | 24,027 | 23,713 | |||||||||||
| |
Year ended | |||||||||||||||
|---|---|---|---|---|---|---|---|---|---|---|---|---|---|---|---|---|
(in thousands)
|
March 23, 2012 |
March 25, 2011 |
March 26, 2010 |
March 27, 2009 |
March 31, 2008 |
|||||||||||
Consolidated Balance Sheet Data: |
||||||||||||||||
Cash and cash equivalents |
$ | 24,894 | $ | 16,936 | $ | 13,134 | $ | 15,704 | $ | 9,448 | ||||||
Total assets |
302,175 | 280,147 | 162,146 | 96,548 | 70,811 | |||||||||||
Total indebtedness (including short-term indebtedness) |
25,000 | 2,310 | 31,396 | 14,863 | 7,966 | |||||||||||
Mandatorily redeemable convertible preferred stock |
— | — | 62,831 | 50,459 | 40,633 | |||||||||||
Total equity (deficit) |
$ | 197,606 | $ | 145,100 | $ | (41,886 | ) | $ | (31,945 | ) | $ | (14,565 | ) | |||
40
| |
Year ended | |||||||||||||||
|---|---|---|---|---|---|---|---|---|---|---|---|---|---|---|---|---|
(in thousands)
|
March 23, 2012 |
March 25, 2011 |
March 26, 2010 |
March 27, 2009 |
March 31, 2008 |
|||||||||||
Consolidated Other Data: |
||||||||||||||||
Capital expenditures |
$ | 61,468 | $ | 102,643 | $ | 30,161 | $ | 12,072 | $ | 12,898 | ||||||
Depreciation and amortization |
28,266 | 15,737 | 7,952 | 5,598 | 5,296 | |||||||||||
Adjusted EBITDA(2) |
$ | 104,395 | $ | 62,195 | $ | 22,727 | $ | 1,072 | $ | (3,768 | ) | |||||
Cash flows provided by (used in): |
||||||||||||||||
Operating activities |
$ | 43,001 | $ | 35,098 | $ | 15,135 | $ | 10,134 | $ | (1,583 | ) | |||||
Investing activities |
(57,469 | ) | (87,031 | ) | (29,636 | ) | (12,107 | ) | (9,988 | ) | ||||||
Financing activities |
$ | 22,426 | $ | 55,735 | $ | 11,931 | $ | 8,229 | $ | 13,391 | ||||||
| |
Year ended | |||||||||||||||
|---|---|---|---|---|---|---|---|---|---|---|---|---|---|---|---|---|
(approximate numbers)
|
March 23, 2012 |
March 25, 2011 |
March 26, 2010 |
March 27, 2009 |
March 31, 2008 |
|||||||||||
Number of RealD-enabled screens (at period end): |
||||||||||||||||
Total domestic RealD-enabled screens |
11,700 | 8,700 | 3,400 | 1,700 | 1,000 | |||||||||||
Total international RealD-enabled screens |
8,500 | 6,300 | 1,900 | 400 | 150 | |||||||||||
Total RealD-enabled screens |
20,200 | 15,000 | 5,300 | 2,100 | 1,150 | |||||||||||
Number of locations with RealD-enabled screens (at period end): |
||||||||||||||||
Total locations with domestic RealD-enabled screens |
2,600 | 2,300 | 1,800 | 1,100 | 650 | |||||||||||
Total locations with international RealD-enabled screens |
2,500 | 2,200 | 1,200 | 400 | 150 | |||||||||||
Total locations with RealD-enabled screens |
5,100 | 4,500 | 3,000 | 1,500 | 800 | |||||||||||
- (1)
- All
basic and diluted loss per share of common stock and average shares outstanding information for all periods presented have been adjusted to reflect the
June 28, 2010 one-for-one and one-half (1 for 1.5) forward split of our common stock described in Note 1, "Business and basis of presentation", to our
consolidated financial statements in Item 8 below. For more information regarding loss per share calculations, see Note 2, "Net income (loss) per share of common stock," to our
consolidated financial statements and our consolidated financial statements.
- (2)
- Adjusted EBITDA is a Non-U.S. GAAP financial measure. Adjusted EBITDA is a supplemental measure of our performance. However, Adjusted EBITDA is not a recognized measurement under U.S. GAAP. We define Adjusted EBITDA as net income (loss), plus net interest expense, income and other taxes, depreciation and amortization, share-based compensation expense and exhibitor option expense, as further adjusted to eliminate the impact of certain other items that we do not consider indicative of our core operating performance. Management considers our core operating performance to be that which can be affected by our managers in any particular period through their management of the resources that affect our underlying revenue and profit generating operations for that period. Non-U.S. GAAP adjustments to our results prepared in accordance with U.S. GAAP are itemized below. You are encouraged to evaluate these adjustments and the reasons we consider them appropriate for supplemental analysis. In evaluating Adjusted EBITDA, you should be aware that in the future we may incur expenses that are the same as or similar to some of the adjustments in this presentation. Our presentation of Adjusted EBITDA should not be construed as an inference that our future results will be unaffected by unusual or non-recurring items.
41
Set forth below is a reconciliation of Adjusted EBITDA to net income (loss) for the following periods indicated:
| |
Year ended | |||||||||
|---|---|---|---|---|---|---|---|---|---|---|
(in thousands)
|
March 23, 2012 |
March 25, 2011 |
March 26, 2010 |
|||||||
Net income (loss) |
$ | 37,025 | $ | (6,825 | ) | $ | (39,749 | ) | ||
Add (deduct): |
||||||||||
Interest expense |
971 | 919 | 1,730 | |||||||
Income tax expense |
5,105 | 4,272 | 2,680 | |||||||
Depreciation and amortization |
28,266 | 15,737 | 7,952 | |||||||
Other (income) loss(1) |
(782 | ) | (6,182 | ) | 1,112 | |||||
Share-based compensation expense(2) |
15,744 | 8,950 | 2,909 | |||||||
Exhibitor option expense(3) |
— | 36,447 | 39,234 | |||||||
Impairment of assets and intangibles(4) |
10,269 | 1,128 | 426 | |||||||
Sales and use tax(5) |
6,363 | 6,484 | 5,478 | |||||||
Property tax(6) |
1,434 | 1,090 | 605 | |||||||
Management fee(7) |
— | 175 | 350 | |||||||
Adjusted EBITDA |
$ | 104,395 | $ | 62,195 | $ | 22,727 | ||||
- (1)
- Includes
amortization of debt issue costs and unrealized foreign currency exchange gains and losses and gain on sale of digital projectors.
- (2)
- Represents
share-based compensation expense of nonstatutory and incentive stock options and restricted stock units to employees, officers, directors and
consultants.
- (3)
- Represents
stock options granted to some of our motion picture exhibitor licensees. The amounts are recorded as contra revenue in the consolidated financial
statements.
- (4)
- Represents
impairment of long-lived assets, such as fixed assets, theatrical equipment and identifiable intangibles.
- (5)
- Represents
taxes incurred by us for cinema license and product revenue.
- (6)
- Represents
property taxes on RealD Cinema Systems and digital projectors.
- (7)
- Represents payment of management fees to our Series C mandatorily redeemable convertible preferred stockholder (included in general and administrative expense), which were terminated upon the completion of our IPO.
We present Adjusted EBITDA because we believe it assists investors and analysts in comparing our performance across reporting periods on a consistent basis by excluding items that we do not believe are indicative of our core operating performance. In addition, we use Adjusted EBITDA in developing our internal budgets, forecasts and strategic plan, in analyzing the effectiveness of our business strategies in evaluating potential acquisitions; in making compensation decisions and in communications with our board of directors concerning our financial performance. Adjusted EBITDA has limitations as an analytical tool which include, among others, the following:
- •
- Adjusted EBITDA does not reflect our cash expenditures, or future requirements, for capital expenditures or contractual
commitments;
- •
- Adjusted EBITDA does not reflect changes in, or cash requirements for, our working capital needs;
42
- •
- Adjusted EBITDA does not reflect the significant interest expense, or the cash requirements necessary to service interest
or principal payments, on our debts;
- •
- although depreciation and amortization are non-cash charges, the assets being depreciated and amortized will
often have to be replaced in the future, and Adjusted EBITDA does not reflect any cash requirements for such replacements;
- •
- non-cash compensation is and will remain a key element of our overall long-term incentive
compensation package, although we exclude it as an expense when evaluating our ongoing operating performance for a particular period;
- •
- Adjusted EBITDA does not reflect the impact of certain cash charges resulting from matters we consider not to be
indicative of our ongoing operations;
- •
- Adjusted EBITDA also differs from the amounts calculated under the similarly titled definition in our credit agreement,
which is further adjusted to reflect certain other cash and non-cash charges and is used to determine compliance with financial covenants and our ability to engage in certain activities,
such as incurring additional debt and making certain restricted payments; and
- •
- other companies in our industry may calculate Adjusted EBITDA differently than we do, limiting its usefulness as a comparative measure.
Because of these limitations, Adjusted EBITDA should not be considered in isolation or as a substitute for performance measures calculated in accordance with U.S. GAAP. We compensate for these limitations by relying primarily on our U.S. GAAP results and using Adjusted EBITDA only as a supplement. Our consolidated financial statements and the notes to those statements included elsewhere are prepared in accordance with U.S. GAAP. See also "Part II, Item 7: Management's discussion and analysis of financial condition and results of operations—Non-U.S. GAAP discussion" and "—Seasonality and quarterly performance."
43
Item 7. Management's discussion and analysis of financial condition and results of operations
The following discussion should be read together with our consolidated financial statements and accompanying notes, which are included elsewhere in this Annual Report on Form 10-K. In addition to historical information, this discussion includes forward-looking information that involves risks and assumptions which could cause actual results to differ materially from management's expectations. See "Part I, Item 1A: Risk factors" and "Special note regarding forward-looking statements and other industry data" included elsewhere in this Annual Report on Form 10-K.
Overview
We are a leading global licensor of 3D technologies. Our extensive intellectual property portfolio is used in applications that enable a premium 3D viewing experience in the theater, the home and elsewhere. We license our RealD Cinema Systems to motion picture exhibitors that show 3D motion pictures and alternative 3D content. We also provide our RealD Display, active and passive eyewear, RealD Format technologies to consumer electronics manufacturers and content providers and distributors to enable the delivery and viewing of 3D content on high definition televisions, laptops and other displays. Our cutting-edge 3D technologies have been used for applications such as piloting the Mars Rover.
For financial reporting purposes, we currently have one reportable segment. We have three operating segments: cinema, consumer electronics and professional within which we market our various applications. Operating segments are defined as components of an enterprise about which separate financial information is available that is evaluated regularly by the chief operating decision maker, or decision-making group, in deciding how to allocate resources and in assessing performance. Our chief operating decision maker is our Chief Executive Officer. We aggregate our three operating segments into one reportable segment based on qualitative factors, including similar economic characteristics and the nature of the products and services. Our product portfolio is used in applications that enable a premium 3D viewing experience across these segments. We currently generate substantially all of our revenue from the license of our RealD Cinema Systems and the use and sale of our eyewear.
Key business metrics
Our management regularly reviews a number of business metrics, including the following key metrics to evaluate our business, monitor the performance of our business model, identify trends affecting our business, determine the allocation of resources, make decisions regarding corporate strategies and evaluate forward-looking projections. The measures that we believe are the primary indicators of our quarterly and annual performance are as follows:
- •
- Number of
screens. Domestic screens are motion picture theater screens in the United States or Canada enabled with our RealD Cinema Systems.
International screens are motion picture theater screens outside the United States and Canada enabled with our RealD Cinema Systems.
- •
- Number of
locations. Domestic locations are motion picture exhibition complexes in the United States or Canada with one or more screens enabled
with our RealD Cinema Systems. International locations are motion picture exhibition complexes outside the United States and Canada with one or more screens enabled with our RealD Cinema Systems.
- •
- Number of 3D motion
pictures. Total 3D motion pictures are the number of 3D motion pictures that are exhibited for more than three showings per day and for
a period in excess of one week and for which we receive a license fee from the motion picture exhibitor during the relevant period.
- •
- Adjusted EBITDA. We use Adjusted EBITDA as a supplemental measure of our performance. We define Adjusted EBITDA as net income (loss), plus net interest expense, income and other
44
taxes, depreciation and amortization, share-based compensation expense and exhibitor option expense, as further adjusted to eliminate the impact of certain other items that we do not consider indicative of our core operating performance. We consider our core operating performance to be that which can be affected by our managers in any particular period through their management of the resources that affect our underlying revenue and profit generating operations for that period. However, Adjusted EBITDA is not a recognized measurement under U.S. GAAP and should not be considered in isolation or as a substitute for performance measures calculated in accordance with U.S. GAAP. For a reconciliation of Adjusted EBITDA to U.S. GAAP net income (loss) and for further discussion regarding Adjusted EBITDA, see "—Non-U.S. GAAP discussion."
The following table sets forth additional performance highlights of key business metrics for the periods presented (approximate numbers):
| |
Year ended | |||||||||
|---|---|---|---|---|---|---|---|---|---|---|
(approximate numbers)
|
March 23, 2012 |
March 25, 2011 |
March 26, 2010 |
|||||||
Number of RealD enabled screens (at period end) |
||||||||||
Total domestic RealD enabled screens |
11,700 | 8,700 | 3,400 | |||||||
Total international RealD enabled screens |
8,500 | 6,300 | 1,900 | |||||||
Total RealD enabled screens |
20,200 | 15,000 | 5,300 | |||||||
Number of locations with RealD enabled screens (at period end) |
||||||||||
Total domestic locations with RealD enabled screens |
2,600 | 2,300 | 1,800 | |||||||
Total international locations with RealD enabled screens |
2,500 | 2,200 | 1,200 | |||||||
Total locations with RealD enabled screens |
5,100 | 4,500 | 3,000 | |||||||
Number of 3D motion pictures (released during period) |
36 | 26 | 13 | |||||||
Performance highlights for Adjusted EBITDA, another key business metric and a Non-U.S. GAAP financial measure, are presented below under the caption "Non-U.S. GAAP discussion."
If we are successful in expanding our business with consumer electronics manufacturers and content producers and distributors to incorporate our RealD Format and display technologies into their products and platforms, our key business metrics in future periods may include the number of units of 3D-enabled plasma and LCD televisions, interactive gaming consoles and laptop computers shipped in that period. To date, we have not generated significant revenue in our consumer electronics business.
Opportunities, trends and factors affecting comparability
We have rapidly evolved and expanded our business since we acquired ColorLink in March 2007. This expansion has included hiring most of our senior management team, acquiring and growing our research and development facilities in Boulder, Colorado, and building infrastructure to support our business. These investments in and changes to our business have allowed us to significantly increase our revenue and key business metrics. We expect to continue to invest for the foreseeable future in expanding our business as we increase our direct sales and marketing presence in the United States, Europe, Asia and other geographic regions, enhance and expand our technology and product offerings and pursue strategic acquisitions.
Cinema
The shift in the motion picture industry from analog to digital over the past decade has created an opportunity for new and transformative 3D technologies. The growth in 3D screens worldwide combined with growth in the number of 3D motion pictures has led to an increase in the worldwide box office generated by 3D screens in recent years. In 2011, 3D-enabled screens generated an
45
estimated $6.9 billion in worldwide 3D box office (according to provisional figures from Screen Digest), representing 21% of the $32.6 billion in total worldwide box office in 2011. Seven of the top 10 grossing films worldwide in 2011 were exhibited in RealD 3D. As of March 23, 2012, there were approximately 20,200 RealD-enabled screens worldwide as compared to approximately 15,000 RealD-enabled screens worldwide as of March 25, 2011, an increase of 5,200 RealD-enabled screens or 35%. Based on the slate announcements by motion picture studios, we anticipate that approximately 37 3D motion pictures will be released worldwide in our fiscal year 2013, including sequels to successful major motion picture franchises, such as Men In Black, Madagascar, Spider-Man, and Ice Age, as well as highly-anticipated original content such as The Avengers, Prometheus, Brave and The Hobbit.
Consumer electronics
We make available our RealD Display, active and passive eyewear, RealD Format technologies to consumer electronics manufacturers and content distributors to enable 3D in high definition televisions, laptops and other displays in the home and elsewhere. We believe that the recent success of major 3D motion pictures, including Transformers: Dark of the Moon, Harry Potter and the Deathly Hallows: Part II, Pirates of the Caribbean 4, Thor, Kung Fu Panda 2 and The Avengers is leading to the creation and distribution of 3D content for consumer electronics. The development of these technologies represents a significant opportunity for new revenue.
Motion picture exhibitor stock options
We have incurred variability in our license revenue and operating results in the past and during the period covered by this Annual Report on Form 10-K in connection with stock options issued to some of our motion picture exhibitor licensees that vest upon the achievement of screen installation targets. All of these screen installation targets have been achieved, all associated reduction of revenue has been recognized and the motion picture exhibitor stock options have vested in full as of March 25, 2011. For further discussion regarding exhibitor stock options, see "Key components of our results of operations—Revenue—Motion picture exhibitor stock options" and "Critical accounting policies and estimates."
Key components of our results of operations
Revenue
We derive substantially all of our revenue from the license of our RealD Cinema Systems and the use and sale of our RealD eyewear.
We license our RealD Cinema Systems in multi-year (typically five years or longer) agreements that are generally exclusive with our motion picture exhibitor licensees in both the domestic and international markets. Our license agreements for our RealD Cinema Systems are typically structured on a per-admission, periodic fixed-fee, or per-motion picture basis. Currently, our license revenue is derived principally on a per-admission basis.
We generate product revenue from the distribution of RealD eyewear to motion picture studios and exhibitors worldwide. Domestically, we provide our RealD eyewear free of charge to motion picture exhibitors and then receive a fee from the motion picture studios for the usage of that RealD eyewear by the motion picture exhibitors' consumers. Most international motion picture exhibitors purchase RealD eyewear directly from us and sell them to consumers as part of their admission or as a concession item. Product revenue is principally derived from the use and sale of RealD eyewear. International revenue is primarily earned in Europe, Central and Latin America, Asia and Australia.
46
Our cinema business is strongly tied to the release of 3D motion pictures. These motion pictures tend to be released based on specific consumer entertainment dynamics, which results in seasonal patterns, with the largest number of motion pictures typically being released in the summer and early winter. Although we have not yet generated material revenue licensing 3D consumer electronics technologies, we expect to derive revenue from the licensing of our RealD Display, active and passive eyewear, RealD Format and technologies to consumer electronics manufacturers and content producers and distributors. As a result, we expect a portion of our revenue growth in the future to be affected by consumer electronics, including the impact of supply chain timelines of the major consumer electronics manufacturers.
We record revenue net of motion picture exhibitor stock options, as discussed more fully immediately below, and estimated revenue allowances.
Upfront payments for the purchase of RealD eyewear and license fees associated with certain motion picture exhibitor license agreements are recorded as deferred revenue until the applicable revenue recognition criteria are met.
Motion picture exhibitor stock options. In connection with some of our motion picture exhibitor license agreements, we issued to three motion picture exhibitors 10-year options to purchase an aggregate of 3,668,340 shares of our common stock at an exercise price of approximately $0.00667 per share. The stock options vested upon the achievement of screen installation targets, which have all been achieved. The stock options do not have net cash settlement features. Motion picture exhibitor stock options are valued at the underlying stock price during each reporting period. As of March 25, 2011, all 3,668,340 motion picture exhibitor stock options had vested and all associated reduction of revenue has been recognized. Amounts recorded as revenue reduction totaled $36.4 million and $39.2 million for the years ended March 25, 2011 and March 26, 2010, respectively. There were no amounts recorded as revenue reduction related to exhibitor options for the year ended March 23, 2012.
Cost of revenue and operating expenses
Cost of revenue principally consists of depreciation expense of our RealD Cinema Systems deployed at a motion picture exhibitor's premises, digital projector depreciation expenses, RealD eyewear costs (including shipping, handling and recycling costs), field service and support costs and occupancy costs.
We classify our operating expenses into three categories: research and development, selling and marketing and general and administrative. Personnel costs include salaries, bonuses, benefits and share-based compensation. We allocate share-based compensation expense resulting from the amortization of the fair value of stock options granted based on how we categorize the department in which the stock option holder works.
Research and development. Research and development costs principally consist of personnel costs related to our research and development staff, depreciation and amortization of research and development assets, prototype and materials costs, the cost of third-party service providers supporting our research and development efforts and occupancy costs.
Selling and marketing. Selling and marketing costs principally consist of personnel costs related to our selling and marketing staff, advertising costs, including promotional events and other brand building initiatives and product marketing expenses, corporate communications, professional fees, occupancy costs and travel expenses.
General and administrative. General and administrative costs principally consist of personnel costs related to our executive, legal, finance, and human resources staff, professional fees including legal and accounting costs, occupancy costs, bad debt expense and public company costs. Additionally, general
47
and administrative costs include sales, use, goods and services tax, and property taxes and management fees payable to a stockholder, which terminated upon consummation of our IPO. For our U.S. cinema license and product revenue, we absorb the majority of sales and use taxes and do not pass such costs on to our customers.
Results of operations
The following table sets forth our consolidated statements of operations and other data for each of the periods indicated:
| |
Year ended | |||||||||
|---|---|---|---|---|---|---|---|---|---|---|
(in thousands)
|
March 23, 2012 |
March 25, 2011 |
March 26, 2010 |
|||||||
Consolidated statements of operations data: |
||||||||||
Gross revenue |
$ | 246,628 | $ | 282,583 | $ | 189,080 | ||||
Motion picture exhibitor options |
— | (36,447 | ) | (39,234 | ) | |||||
Net revenue |
246,628 | 246,136 | 149,846 | |||||||
Cost of revenue |
117,938 | 178,396 | 140,603 | |||||||
Gross margin |
128,690 | 67,740 | 9,243 | |||||||
Operating expenses: |
||||||||||
Research and development |
16,500 | 15,582 | 11,021 | |||||||
Selling and marketing |
27,682 | 24,139 | 16,811 | |||||||
General and administrative |
42,189 | 35,835 | 15,638 | |||||||
Total operating expenses |
86,371 | 75,556 | 43,470 | |||||||
Operating income (loss) |
42,319 | (7,816 | ) | (34,227 | ) | |||||
Interest expense |
(971 | ) | (919 | ) | (1,730 | ) | ||||
Other income (loss) |
782 | 6,182 | (1,112 | ) | ||||||
Income (loss) before income taxes |
42,130 | (2,553 | ) | (37,069 | ) | |||||
Income tax expense |
5,105 | 4,272 | 2,680 | |||||||
Net income (loss) |
37,025 | (6,825 | ) | (39,749 | ) | |||||
Net (income) loss attributable to noncontrolling interest |
(156 | ) | (530 | ) | 896 | |||||
Accretion of preferred stock |
— | (4,934 | ) | (12,372 | ) | |||||
Net income (loss) attributable to RealD Inc. common stockholders |
$ | 36,869 | $ | (12,289 | ) | $ | (51,225 | ) | ||
Other data: |
||||||||||
Adjusted EBITDA(1) |
$ | 104,395 | $ | 62,195 | $ | 22,727 | ||||
- (1)
- Adjusted EBITDA is not a recognized measurement under U.S. GAAP. For a definition of Adjusted EBITDA and reconciliation to net income (loss), the comparable U.S. GAAP item, see "—Non-U.S. GAAP discussion."
48
The following table sets forth our consolidated statements of operations and other data as a percentage of net revenue for each of the periods indicated:
| |
Year ended | |||||||||
|---|---|---|---|---|---|---|---|---|---|---|
| |
March 23, 2012 |
March 25, 2011 |
March 26, 2010 |
|||||||
Net revenue |
100 | % | 100 | % | 100 | % | ||||
Cost of revenue |
47.8 | 72.5 | 93.8 | |||||||
Gross margin |
52.2 | 27.5 | 6.2 | |||||||
Operating expenses: |
||||||||||
Research and development |
6.7 | 6.3 | 7.4 | |||||||
Selling and marketing |
11.2 | 9.8 | 11.2 | |||||||
General and administrative |
17.1 | 14.6 | 10.4 | |||||||
Total operating expenses |
35.0 | 30.7 | 29.0 | |||||||
Operating income (loss) |
17.2 | (3.2 | ) | (22.8 | ) | |||||
Interest expense |
(0.4 | ) | (0.4 | ) | (1.2 | ) | ||||
Other income (loss) |
0.3 | 2.5 | (0.7 | ) | ||||||
Income (loss) before income taxes |
17.1 | (1.0 | ) | (24.7 | ) | |||||
Income tax expense |
2.1 | 1.7 | 1.8 | |||||||
Net income (loss) |
15.0 | (2.8 | ) | (26.5 | ) | |||||
Net (income) loss attributable to noncontrolling interest |
(0.1 | ) | (0.2 | ) | 0.6 | |||||
Accretion of preferred stock |
— | (2.0 | ) | (8.3 | ) | |||||
Net income (loss) attributable to RealD Inc. common stockholders |
14.9 | % | (5.0 | )% | (34.2 | )% | ||||
Other data: |
||||||||||
Adjusted EBITDA(1) |
42.3 | % | 25.3 | % | 15.2 | % | ||||
- (1)
- For a definition of Adjusted EBITDA and reconciliation to net income (loss), the most comparable U.S. GAAP item, see "—Non-U.S. GAAP discussion."
The following table sets forth share-based compensation and depreciation and amortization included in the above line items:
| |
Year ended | |||||||||
|---|---|---|---|---|---|---|---|---|---|---|
(in thousands)
|
March 23, 2012 |
March 25, 2011 |
March 26, 2010 |
|||||||
Share-based compensation |
||||||||||
Cost of revenue |
$ | 458 | $ | 160 | $ | 60 | ||||
Research and development |
2,604 | 1,470 | 985 | |||||||
Selling and marketing |
4,776 | 2,937 | 1,589 | |||||||
General and administrative |
7,906 | 4,383 | 275 | |||||||
Total |
$ | 15,744 | $ | 8,950 | $ | 2,909 | ||||
49
| |
Year Ended | |||||||||
|---|---|---|---|---|---|---|---|---|---|---|
(in thousands)
|
March 23, 2012 |
March 25, 2011 |
March 26, 2010 |
|||||||
Depreciation and amortization |
||||||||||
Cost of revenue |
$ | 25,948 | $ | 14,971 | $ | 7,426 | ||||
Research and development |
1,350 | 481 | 452 | |||||||
Selling and marketing |
229 | 84 | — | |||||||
General and administrative |
739 | 201 | 74 | |||||||
Total |
$ | 28,266 | $ | 15,737 | $ | 7,952 | ||||
In the period to period comparative discussion below, we describe our net revenue, license revenue (composed principally of revenue from our RealD Cinema Systems), and product and other revenue (principally composed of our RealD eyewear and, to a much lesser extent, professional product revenue and other revenue).
Fiscal year ended March 23, 2012 compared to fiscal year ended March 25, 2011
Revenue
For the fiscal year ended March 23, 2012, net revenue increased $0.5 million to $246.6 million compared to $246.1 million for the fiscal year ended March 25, 2011.
| |
Year ended | |
|
||||||||||
|---|---|---|---|---|---|---|---|---|---|---|---|---|---|
(in thousands)
|
March 23, 2012 |
March 25, 2011 |
Amount change |
Percentage change |
|||||||||
Revenue: |
|||||||||||||
Gross license |
$ | 147,801 | $ | 137,970 | $ | 9,831 | 7 | % | |||||
Motion picture exhibitor options |
— | (36,447 | ) | 36,447 | (100 | )% | |||||||
Net license |
147,801 | 101,523 | 46,278 | 46 | % | ||||||||
Product and other |
98,827 | 144,613 | (45,786 | ) | -32 | % | |||||||
Total net revenue |
$ | 246,628 | $ | 246,136 | $ | 492 | 0 | % | |||||
Other data: |
|||||||||||||
Number of RealD enabled screens (at period end) |
|||||||||||||
Total domestic RealD enabled screens |
11,700 | 8,700 | 3,000 | 34 | % | ||||||||
Total international RealD enabled screens |
8,500 | 6,300 | 2,200 | 35 | % | ||||||||
Total RealD-enabled screens |
20,200 | 15,000 | 5,200 | 35 | % | ||||||||
Number of locations with RealD enabled screens (at period end) |
|||||||||||||
Total domestic locations with RealD enabled screens |
2,500 | 2,300 | 200 | 9 | % | ||||||||
Total international locations with RealD enabled screens |
2,600 | 2,200 | 400 | 18 | % | ||||||||
Total locations with RealD enabled screens |
5,100 | 4,500 | 600 | 13 | % | ||||||||
Number of 3D motion pictures (released during period) |
36 | 26 | 10 | 38 | % | ||||||||
The increase in net revenue during the fiscal year ended March 23, 2012 compared to the fiscal year ended March 25, 2011 was primarily due to an increase in the number of RealD-enabled screens, an increase in the number of 3D motion pictures released and the resulting increase in the box office of 3D motion pictures on RealD-enabled screens offset by a decrease of the usage of our eyewear. Our international markets comprised approximately 49% of gross revenue for the fiscal year ended March 23, 2012.
50
For the fiscal year ended March 23, 2012, there were 27 motion pictures that contributed greater than $1.0 million of admission-based fees to net license revenue. The top 10 motion pictures that contributed greater than $1.0 million of admission-based fees to net license revenue for the fiscal year ended March 23, 2012 included the following: Transformers: Dark of the Moon ($11.3 million), Harry Potter and the Deathly Hallows Part 2 ($10.9 million), Pirates of the Caribbean: On Stranger Tides ($9.3 million), Thor ($5.8 million), Kung Fu Panda 2 ($5.8 million), Puss in Boots ($5.6 million), The Smurfs ($5.4 million), Rio ($5.3 million), Cars 2 ($4.9 million) and The Adventures of Tintin ($4.7 million). For the fiscal year ended March 25, 2011, there were 25 motion pictures that contributed greater than $1.0 million of admission-based fees to net license revenue. The top 10 motion pictures that contributed greater than $1.0 million of admission-based fees to net license revenue for the fiscal year ended March 25, 2011 included the following: Toy Story 3 ($14.4 million), Shrek Forever After ($9.2 million), Despicable Me ($6.9 million), How to Train Your Dragon ($6.1 million), Tangled ($5.7 million), Alice in Wonderland ($5.5 million), Tron: Legacy ($5.1 million), Clash of the Titans ($4.8 million), The Chronicles of Narnia: The Voyage of the Dawn Treader ($4.7 million) and Megamind ($4.3 million). Our net license revenue has increased on a year-over-year basis, primarily internationally, as a result of the increased number of RealD-enabled screens and the box office generated by those 3D motion picture releases. As of March 25, 2011, all 3,668,340 motion picture exhibitor stock options had vested and all associated reduction of revenue had been recognized. As a result, there was no motion picture exhibitor option expense for the year ended March 23, 2012.
Net license revenues comprised 60% and 41% of total revenues for the fiscal years ended March 23, 2012 and March 25, 2011, respectively. International license revenues comprised 56% and 54% of our gross license revenues for the fiscal years ended March 23, 2012 and March 25, 2011, respectively.
The decrease in our net product revenue in the fiscal year ended March 23, 2012, as compared to the fiscal year ended March 25, 2011, was primarily a result of a decrease in eyewear sold to our international markets. The decrease in RealD eyewear volume internationally compared to the prior period resulted from a growing trend among consumers to reuse RealD eyewear for multiple viewings, as well as the inventory build by non-U.S. motion picture exhibitors in prior periods. International product and other revenues comprised 38% and 56% of total product and other revenues for the fiscal years ended March 23, 2012 and March 25, 2011, respectively.
We expect our future revenue, particularly in our license business, will be driven by the number of RealD-enabled screens and motion pictures released in 3D. As the volume of RealD eyewear usage changes as a result of an expanding 3D motion picture slate and box office, we may experience additional price pressure from our customers. As a result, our net revenues may increase at a slower rate or decline in future periods.
Cost of revenue
| |
Year ended | |
|
||||||||||
|---|---|---|---|---|---|---|---|---|---|---|---|---|---|
(in thousands)
|
March 23, 2012 |
March 25, 2011 |
Amount change |
Percentage change |
|||||||||
Revenue |
$ | 246,628 | $ | 246,136 | $ | 492 | 0 | % | |||||
Cost of revenue: |
|||||||||||||
License |
39,801 | 17,994 | 21,807 | 121 | % | ||||||||
Product and other |
78,137 | 160,402 | (82,265 | ) | (51 | )% | |||||||
Total cost of revenue |
$ | 117,938 | $ | 178,396 | $ | (60,458 | ) | (34 | )% | ||||
Gross profit |
$ | 128,690 | $ | 67,740 | $ | 60,950 | 90 | % | |||||
Gross margin |
52 | % | 28 | % | |||||||||
51
For the fiscal year ended March 23, 2012, our cost of revenue decreased primarily due to decreased RealD eyewear sales and the increased usage of recycled RealD eyewear. Cost of revenue decreased, as a percentage of revenue, to 48% for the fiscal year ended March 23, 2012, as compared to 72% for the fiscal year ended March 25, 2011. Contributing to the improvement in gross margin was an increase in license revenues, a decrease in RealD eyewear sales and the increased usage of recycled eyewear, which generates higher gross margin. The percentage of usage of recycled eyewear may decrease in future periods resulting in lower gross profit and gross margin.
For the fiscal year ended March 25, 2011, the reduction to revenue resulting from motion picture exhibitor stock options directly contributed to a $36.4 million decrease in gross profit. Excluding the impact of motion picture exhibitor stock options of $36.4 million, gross profit would have been $104.2 million for the fiscal year ended March 25, 2011, and gross margin would have been 37%. The motion picture exhibitor stock options have vested in full as of March 25, 2011 and as a result, there was no motion picture exhibitor option expense for the fiscal year ended March 23, 2012.
License cost of revenue increased $21.8 million to $39.8 million for the fiscal period ended March 23, 2012 compared to $18.0 million for the fiscal period ended March 25, 2011 primarily as a result of a $9.1 million increase in impairment expense and a $10.7 million increase in depreciation expense resulting from an increase in RealD-enabled screens. Included in license cost of sales is depreciation expense of $25.3 million and $14.6 million for the fiscal years ended March 23, 2012 and March 25, 2011, respectively. Depreciation expense as a percentage of gross license revenue increased to 17% for the fiscal year ended March 23, 2012 from 11% for the fiscal year ended March 25, 2011
During the three months ended September 23, 2011, we determined that certain of our cinema systems were not recoverable and that the carrying value of the assets exceeded fair value, primarily due to the number of certain of our cinema system assets on hand, including related outstanding purchase commitments and the continuing shift in the mix in the deployment of cinema systems based on the type of digital projectors installed and theater configuration. The fair value was primarily determined by evaluating the discounted future cash flows expected to be generated from the cinema systems. The impairment charged during the three months ended September 23, 2011 to cost of revenue for certain of the cinema systems totaled $6.8 million. Impairment expense for all our Cinema Systems totaled $10.3 million for the year ended March 23, 2012.
We had a product and other gross profit of $20.7 million for the fiscal year ended March 23, 2012 as compared to a negative product and other gross profit of $15.8 million for the fiscal year ended March 25, 2011, primarily due to RealD eyewear. The decrease in our cost of product and other revenue was a result of the decrease in the volume of RealD eyewear, the increased usage of recycled eyewear and a decrease in freight related expenses. Product and other gross margin improved to 21% for the fiscal year ended March 23, 2012 as compared to negative 11% for the fiscal year ended March 25, 2011. Freight related expense decreased by an aggregate of $10.2 million as a result of the decreased volume of RealD eyewear as well as a reduction in expedited freight charges.
Film amortization costs included in product and other cost of revenue related to Carmen 3D and Madam Butterfly in 3D was $2.8 million for the year ended March 23, 2012.
Costs associated with our eyewear recycling program have been expensed in the period incurred. Recycling costs totaled $5.5 million for the fiscal year ended March 23, 2012 and $8.1 million for the fiscal year ended March 25, 2011, and included the cost to transport RealD eyewear between theaters and the recycling production facility and costs to process the RealD eyewear for reuse.
Our cost of revenue as a percentage of net revenue, as well as our gross profit and gross margin, will be affected in the future by the relative mix of net license and net product revenue, the mix of domestic and international product revenues, the relative mix of products and any new revenue sources, impairment charges and the percentage of usage of recycled eyewear. Impairment charges in future
52
periods may increase as a result of system upgrades and replacements as well as changes in product offerings and new technology. As the number of RealD-enabled screens and the number of 3D motion pictures and attendance increase, our total cost of revenue may continue to increase.
Operating expenses
| |
Year ended | |
|
||||||||||
|---|---|---|---|---|---|---|---|---|---|---|---|---|---|
(in thousands)
|
March 23, 2012 |
March 25, 2011 |
Amount change |
Percentage change |
|||||||||
Research and development |
$ | 16,500 | $ | 15,582 | $ | 918 | 6 | % | |||||
Selling and marketing |
27,682 | 24,139 | 3,543 | 15 | % | ||||||||
General and administrative |
42,189 | 35,835 | 6,354 | 18 | % | ||||||||
Total operating expenses |
$ | 86,371 | $ | 75,556 | $ | 10,815 | 14 | % | |||||
Research and development. Our research and development expenses increased primarily due to a $0.8 million increase of depreciation expense, $0.7 million in engineering and prototype expenses and $0.2 million in consultant and professional fees in the fiscal year ended March 23, 2012 compared to the fiscal year ended March 25, 2011. These increases were offset by a decrease of $0.2 million in personnel costs, $0.3 million in occupancy costs and $0.2 million in travel and entertainment expenses. The change in personnel costs includes an increase of $1.1 million of share-based compensation expense offset by decreases of $0.8 million in salaries and benefits and $0.5 million in discretionary and contractual bonuses as the number of research and development personnel decreased to 30 as of March 23, 2012 from 37 as of March 25, 2011. We expect to increase our research and development expenses to support our anticipated growth in consumer electronics projects and initiatives, primarily for additional personnel, consultants and prototype and materials costs, as well as for continued investment in our cinema business.
Selling and marketing. Our selling and marketing expenses increased primarily due to a $2.5 million increase in personnel costs. The change in personnel costs includes an increase of $1.2 million of salaries and benefits and $1.8 million of share-based compensation expense related to the increase in the number of selling and marketing personnel to 31 at March 23, 2012 from 21 at March 25, 2011, partially offset by a decrease of $0.5 million of discretionary and contractual bonuses. Selling and marketing expense also increased from the incurrence of additional advertising and marketing initiatives of $2.4 million, occupancy costs of $0.5 million, public relations expenses of $0.3 million, travel and entertainment expenses of $0.2 million, depreciation expense of $0.1 million, partially offset by decreases in professional fees of $0.7 million and outside services of $0.5 million in the fiscal year ended March 23, 2012. Selling and marketing expense for RealD co-produced feature films decreased $1.4 million related to the selling and marketing costs related to the feature films, Madam Butterfly in 3D, which we co-produced with London's Royal Opera House and was released in March 2012 and Carmen 3D, which we also co-produced with London's Royal Opera House and was released in March 2011. Personnel costs and advertising and marketing spending are expected to continue to increase in order to drive revenue growth. We expect to incur additional selling and marketing expenses in fiscal year 2013 and beyond as we increase our international marketing efforts, particularly in Asia and Latin America, build our consumer electronics business worldwide and market future 3D films.
General and administrative. Our general and administrative expenses increased primarily due to a $5.0 million increase in personnel costs. The increase in personnel costs includes an increase in salaries and benefits of $2.3 million as the number of general and administrative employees increased to 37 at March 23, 2012 from 30 at March 25, 2011 to support our overall growth, including the requirements of being a public company. Also included in personnel costs is an increase of $3.5 million related to
53
share-based compensation expense, partially offset by a decrease of $0.8 million related to discretionary and contractual bonuses. We incurred increases in legal and professional fees of $3.1 million, occupancy costs of $1.1 million, depreciation expenses of $0.5 million, travel and entertainment expenses of $0.4 million and foreign business tax related expense of $0.6 million to support the growth in our operations. These increases were partially offset by decreases in bad debt expense of $3.8 million and public company related expenses of $0.6 million, which include listing, registration and issuance costs, as well as investor relations and compliance fees. We expect to incur additional general and administrative expenses to support the general growth in operations, as well as to comply with SEC reporting requirements, stock exchange listing standards and the provisions of the Sarbanes-Oxley Act of 2002 and the Dodd-Frank Wall Street Reform and Consumer Protection Act of 2010.
Other
Interest expense. Interest expense for the fiscal years ended March 23, 2012 and March 25, 2011 was $1.0 million and $0.9 million, respectively. Our interest expense increased primarily due to the interest rates related to the borrowings under our Credit Agreement.
Other income (loss). Other income (loss) was $0.8 million for the year ended March 23, 2012 as compared to $6.2 million for the year ended March 25, 2011. Other income (loss) decreased primarily due to a decrease of $5.0 million in gain from the sale of digital projectors during the year ended March 23, 2012 as compared to the year ended March 25, 2011.
Income tax. Our income tax expense for the fiscal year ended March 23, 2012 was $5.1 million, primarily due to an increase in our foreign tax expense. We have net operating losses that may potentially be offset against future earnings. We expect to incur an increasing amount of income tax expenses that relate to federal and state income tax and international operations. We file federal income tax returns and income tax returns in various state and foreign jurisdictions. Due to the net operating loss carryforwards, our United States federal and state returns are open to examination by the Internal Revenue Service and state jurisdictions for all years since inception.
Noncontrolling interest. Noncontrolling interest represents a 44.4% interest in our subsidiary, Digital Link II, LLC, or Digital Link II. Digital Link II was formed for purposes of funding the deployment of digital projector systems and servers to our motion picture exhibitor licensees. The decrease in the net income attributable to noncontrolling interest was primarily due to a decrease in gain from the sale of digital projectors for the year ended March 23, 2012 as compared to the year ended March 25, 2011.
54
Fiscal year ended March 25, 2011 compared to fiscal year ended March 26, 2010
Revenue
For the fiscal year ended March 25, 2011, net revenue increased $96.3 million to $246.1 million compared to $149.8 million for the fiscal year ended March 26, 2010.
| |
Year ended | |
|
||||||||||
|---|---|---|---|---|---|---|---|---|---|---|---|---|---|
(in thousands)
|
March 25, 2011 |
March 26, 2010 |
Amount change |
Percentage change |
|||||||||
Revenue: |
|||||||||||||
Gross license |
$ | 137,970 | $ | 80,148 | $ | 57,822 | 72 | % | |||||
Motion picture exhibitor options |
(36,447 | ) | (39,234 | ) | 2,787 | (7 | )% | ||||||
Net license |
101,523 | 40,914 | 60,609 | 148 | % | ||||||||
Product and other |
144,613 | 108,932 | 35,681 | 33 | % | ||||||||
Total net revenue |
$ | 246,136 | $ | 149,846 | $ | 96,290 | 64 | % | |||||
Other data: |
|||||||||||||
Number of RealD enabled screens (at period end) |
|||||||||||||
Total domestic RealD enabled screens |
8,700 | 3,400 | 5,300 | 156 | % | ||||||||
Total international RealD enabled screens |
6,300 | 1,900 | 4,400 | 232 | % | ||||||||
Total RealD-enabled screens |
15,000 | 5,300 | 9,700 | 183 | % | ||||||||
Number of locations with RealD enabled screens (at period end) |
|||||||||||||
Total domestic locations with RealD enabled screens |
2,300 | 1,800 | 500 | 28 | % | ||||||||
Total international locations with RealD enabled screens |
2,200 | 1,200 | 1,000 | 83 | % | ||||||||
Total locations with RealD enabled screens |
4,500 | 3,000 | 1,500 | 50 | % | ||||||||
Number of 3D motion pictures (released during period) |
26 | 13 | 13 | 100 | % | ||||||||
The significant increase in net revenue recorded during the fiscal year ended March 25, 2011 compared to the fiscal year ended March 26, 2010 was primarily due to an increase in the number of RealD-enabled screens, an increase in the number of 3D motion pictures released and the resulting increase in the box office of 3D motion pictures on RealD-enabled screens. Our international markets comprised approximately 55% of gross revenue for the fiscal year ended March 25, 2011.
For the fiscal year ended March 25, 2011, there were 25 motion pictures that contributed greater than $1.0 million of admission-based fees to net license revenue. The top 10 motion pictures that contributed greater than $1.0 million of admission-based fees to net license revenue for the fiscal year ended March 25, 2011 included the following: Toy Story 3 ($14.4 million), Shrek Forever After ($9.2 million), Despicable Me ($6.9 million), How to Train Your Dragon ($6.1 million), Tangled ($5.7 million), Alice in Wonderland ($5.5 million), Tron: Legacy ($5.1 million), Clash of the Titans ($4.8 million), The Chronicles of Narnia: The Voyage of the Dawn Treader ($4.7 million) and Megamind ($4.3 million). For the fiscal year ended March 26, 2010, there were seven motion pictures which contributed greater than $1.0 million of admission-based fees to net license revenue. Net license revenue for the fiscal year ended March 26, 2010 included admission-based fees related to the following motion pictures: Avatar ($27.9 million), Up ($8.5 million), Alice in Wonderland ($7.2 million), Monsters vs. Aliens ($4.9 million), Ice Age 3 ($6.2 million), GForce ($3.7 million) and Christmas Carol ($4.2 million). Both domestically and internationally, our net license revenue has increased on a year-over-year basis as a result of the increased number of RealD-enabled screens and the number of 3D motion pictures increasing the box office. The reduction to revenue resulting from motion picture exhibitor stock options decreased $2.8 million based upon changes in the price of our common stock and screen installation targets. Motion picture exhibitor stock options are valued at the underlying
55
stock price during each reporting period. As of March 25, 2011, all 3,668,340 motion picture exhibitor stock options had vested and all associated reduction of revenue had been recognized.
Net license revenues comprised 41% and 27% of total revenues for each of the fiscal years ended March 25, 2011 and March 26, 2010, respectively. International license revenues comprised 54% of our gross license revenues in the fiscal year ended March 25, 2011.
The increase in our net product revenue in the fiscal year ended March 25, 2011, as compared to the fiscal year ended March 26, 2010, was primarily a result of an increase in the number of consumers attending 3D motion pictures using our RealD eyewear. International product and other revenues comprised 56% of total product and other revenues in the fiscal year ended March 25, 2011.
We expect our future revenue, particularly in our license business, will be driven by the number of RealD-enabled screens and motion pictures released in 3D. As the volume of RealD eyewear usage increases as a result of an expanding 3D motion picture slate and box office, we may experience additional price pressure from our customers. As a result, our net revenues may increase at a slower rate or decline in future periods.
Cost of revenue
| |
Year ended | |
|
||||||||||
|---|---|---|---|---|---|---|---|---|---|---|---|---|---|
(in thousands)
|
March 25, 2011 |
March 26, 2010 |
Amount change |
Percentage change |
|||||||||
Revenue |
$ | 246,136 | $ | 149,846 | $ | 96,290 | 64 | % | |||||
Cost of revenue: |
|||||||||||||
License |
17,994 | 9,452 | 8,542 | 90 | % | ||||||||
Product and other |
160,402 | 131,151 | 29,251 | 22 | % | ||||||||
Total cost of revenue |
$ | 178,396 | $ | 140,603 | $ | 37,793 | 27 | % | |||||
Gross profit |
$ | 67,740 | $ | 9,243 | $ | 58,497 | 633 | % | |||||
Gross margin |
28 | % | 6 | % | |||||||||
For the fiscal year ended March 25, 2011, our cost of revenue increased primarily due to increased RealD eyewear sales. Cost of revenue decreased, as a percentage of revenue, to 72% for the fiscal year ended March 25, 2011, as compared to 94% for the fiscal year ended March 26, 2010. The increase in gross margin was primarily due to an increase in license revenues which was partially offset by the increased use of RealD eyewear which generates lower gross margin. For the fiscal year ended March 25, 2011, the reduction to revenue resulting from motion picture exhibitor stock options directly contributed to a $36.4 million decrease in gross profit. The motion picture exhibitor stock options have vested in full as of March 25, 2011 and we do not expect an impact on gross profit in fiscal year 2012 or beyond due to such stock options.
Excluding the impact of motion picture exhibitor stock options of $36.4 million, gross profit would have been $104.2 million for the fiscal year ended March 25, 2011, and gross margin would have been 37%. Excluding the impact of motion picture exhibitor stock options of $39.2 million, gross profit would have been $48.5 million for the fiscal year ended March 26, 2010, and gross margin would have been 26%.
License gross margin improved to 82% for the fiscal year ended March 25, 2011 from 77% for the fiscal year ended March 26, 2010. Excluding the impact of motion picture exhibitor stock options of $36.4 million for the fiscal year ended March 25, 2011 and $39.2 million for the fiscal year ended March 26, 2010, gross profit for license revenue increased to $120.0 million from $70.7 million primarily due to economies of scale and the increase in the number of 3D motion pictures released and the resulting increase in the box office of 3D motion pictures on RealD-enabled screens. Excluding the impact of motion picture exhibitor stock options, gross margin declined from 88% for the fiscal year ended March 26, 2010 to 87% for the fiscal period ended March 25, 2011 primarily due to a $7.8 million, or 108%, increase in depreciation expense. Depreciation expense as a percentage of gross license revenue increased from 9% to 11%.
56
We had a negative product and other gross profit of $15.8 million and $22.2 million for the fiscal year ended March 25, 2011 and March 26, 2010, respectively, primarily due to RealD eyewear. The increase in our cost of product and other revenue was a result of the increase in the volume of RealD eyewear. Product and other gross margin was negative 11% for the fiscal year ended March 25, 2011 as compared to negative 20% for the fiscal year ended March 26, 2010. The increase in gross margin was due to the lower cost of glasses related to improved recycling efforts and a decrease in expedited freight costs of $6.0 million. In addition, there was an increased usage of RealD eyewear internationally for the fiscal year ended March 25, 2011, which generates greater gross margin compared to the usage of RealD eyewear domestically. Film amortization costs included in cost of revenue related to Carmen in 3D were $0.8 million.
Costs associated with our eyewear recycling program have been expensed in the period incurred. Recycling costs totaled $8.1 million for the fiscal year ended March 25, 2011 and $6.6 million for the fiscal year ended March 26, 2010, and included the cost to transport RealD eyewear between theaters and the recycling production facility and costs to process the RealD eyewear for reuse.
Our cost of revenue as a percentage of net revenue will be affected in the future by the relative mix of net license and net product revenue, the mix of domestic and international product revenues, the relative mix of products and any new revenue sources. As the number of RealD-enabled screens and the number of 3D motion pictures and attendance increase, our total cost of revenue may continue to increase.
Operating expenses
Operating expenses
| |
Year ended | |
|
||||||||||
|---|---|---|---|---|---|---|---|---|---|---|---|---|---|
(in thousands)
|
March 25, 2011 |
March 26, 2010 |
Amount change |
Percentage change |
|||||||||
Research and development |
$ | 15,582 | $ | 11,021 | $ | 4,561 | 41 | % | |||||
Selling and marketing |
24,139 | 16,811 | 7,328 | 44 | % | ||||||||
General and administrative |
35,835 | 15,638 | 20,197 | 129 | % | ||||||||
Total operating expenses |
$ | 75,556 | $ | 43,470 | $ | 32,086 | 74 | % | |||||
Research and development. Our research and development expenses increased primarily due to a $3.1 million increase in personnel costs as we increased the number of research and development personnel to 37 at March 25, 2011 from 25 at March 26, 2010 to increase our product development and engineering capabilities as well as an increase in discretionary and contractual bonuses of $0.9 million. We also increased spending on consultants of $0.4 million in the fiscal year ended March 25, 2011 compared to the fiscal year ended March 26, 2010. We expect to increase our research and development expenses to support our anticipated growth in consumer electronics projects and initiatives, primarily for additional personnel, consultants and prototype and materials costs, as well as for continued investment in our cinema business.
Selling and marketing. Our selling and marketing expenses increased primarily due to a $3.0 million increase in personnel costs. The change in personnel costs includes $1.6 million related to the increase in the number of selling and marketing personnel to 21 at March 25, 2011 from 18 at March 26, 2010 and a $1.3 million increase in share-based compensation expense. Selling and marketing expense includes $2.7 million of selling and marketing costs related to the feature film, Carmen in 3D which we co-produced with London's Royal Opera House and which was released on March 5, 2011. Selling and marketing expense also increased from the incurrence of additional advertising and marketing initiatives of $1.0 million in the fiscal year ended March 25, 2011. Personnel
57
costs and advertising and marketing spending are expected to continue to increase in order to drive revenue growth. We expect to incur additional selling and marketing expenses in fiscal year 2012 and beyond as we increase our international marketing efforts, particularly in Asia and Latin America, build our consumer electronics business worldwide and market future 3D films.
General and administrative. Our general and administrative expenses increased primarily due to a $7.5 million increase in personnel costs as well as a $1.0 million increase in sales and use taxes. The increase in personnel costs includes an increase in salaries and benefits of $2.0 million as we increased the number of general and administrative employees to 30 at March 25, 2011 from 15 at March 26, 2010 to support our overall growth, including the requirements of being a public company. Also included in personnel costs is an increase of $4.1 million related to share-based compensation expense and an increase of $1.3 million related to discretionary and contractual bonuses. Sales and use taxes increased due to the increase in domestic revenues. We absorb the majority of all sales and use taxes in the United States and do not pass such costs on to our customers. Legal expenses and professional fees increased $5.0 million to support the growth in our operations. Public company related expenses of $1.7 million were incurred in the fiscal year ended March 25, 2011 and include listing, registration and issuance costs, as well as investor relations and compliance fees. We expect to incur additional general and administrative expenses for sales and use taxes as our revenue in the United States grows, as well as to comply with SEC reporting requirements, stock exchange listing standards and the provisions of the Sarbanes-Oxley Act of 2002 and the Dodd-Frank Wall Street Reform and Consumer Protection Act of 2010.
Other
Interest expense. Interest expense for the fiscal years ended March 25, 2011 and March 26, 2010 was $0.9 million and $1.7 million, respectively. Our interest expense decreased primarily due to reductions in borrowings as we repaid $25.1 million under our previous revolving credit facility on July 21, 2010 out of the proceeds we received in connection with our IPO. As of March 25, 2011, there were no borrowings outstanding under the Credit Agreement as described below.
Income tax. Our income tax expense for the fiscal year ended March 25, 2011 was $4.3 million, primarily due to an increase in our foreign tax expense. We have net operating losses that may potentially be offset against future earnings. We expect to incur an increasing amount of income tax expenses that relate to federal and state income tax and international operations. We file federal income tax returns and income tax returns in various state and foreign jurisdictions. Due to the net operating loss carryforwards, our United States federal and state returns are open to examination by the Internal Revenue Service and state jurisdictions for all years since inception.
Noncontrolling interest. Noncontrolling interest represents a 44.4% interest in our subsidiary, Digital Link II, LLC, or Digital Link II. Digital Link II was formed for purposes of funding the deployment of digital projector systems and servers to our motion picture exhibitor licensees. The increase in the net income attributable to noncontrolling interest was primarily due to the gain from the sale of digital projectors for the year ended March 25, 2011.
Seasonality and quarterly performance
Our operations are generally subject to seasonal trends based on the number of 3D motion pictures released and the box office of those 3D motion pictures. As is the case with other participants in the motion picture exhibition industry, we expect that our fiscal quarters during the summer and early winter holiday periods generally will tend to show stronger box office performance and higher revenues due to the summer and holiday movie-going seasons, when many of the largest grossing films in any given year are typically released. By comparison, the quarter ending in March traditionally does not benefit from the same box office performance due to the number and nature of the motion
58
pictures released in those seasonal periods. We expect to experience seasonal fluctuations in results of operations as a result of these trends. Our quarterly financial results have fluctuated in the past and may continue to fluctuate in the future based on a number of factors, many of which are beyond our control. Factors that may cause our operating results to vary or fluctuate include those discussed in Part I, Item 1A below under the caption "Risk factors."
Liquidity and capital resources
Since our inception and through March 23, 2012, we have financed our operations through the proceeds we received in connection with our IPO, the sale of redeemable convertible preferred stock, borrowings under our previous credit facility agreement with City National Bank, a national banking association, or City National, and through the issuance of notes payable to stockholders and vendors, and net cash provided by operating activities. Our cash flow from operating activities has historically been significantly impacted by the contractual payment terms and patterns related to the license of our RealD Cinema Systems and use and sale of our RealD eyewear, as well as significant investments in research, development, selling and marketing activities and corporate infrastructure. Prior to fiscal 2010, many of our licensing and product sale contracts included terms that required upfront payments. Since a majority of our revenue recognized under our motion picture exhibitor licenses results in admission and usage fees being paid to us subsequent to such consumer attendance, we expect our deferred revenue balances to continue to decline over the next several years.
Cash provided by operating activities is expected to be a primary recurring source of funds in future periods and will be driven by our expected increased revenue generated from the growing number of 3D motion pictures exhibited on our RealD Cinema Systems and an increase in the number of RealD-enabled screens, partially offset by increased working capital requirements associated with installing new RealD Cinema Systems, logistics and recycling costs for our RealD eyewear. Depending on our operating performance in any given period and the installation rate of additional RealD Cinema Systems, we expect to supplement our liquidity needs primarily with borrowings under our secured credit facility.
We recently entered into a secured credit facility agreement with City National to provide us with:
- •
- a revolving credit facility (including a letter of credit sub-facility) in a maximum amount not to exceed
$75,000,000 (the "Revolving Facility"); and
- •
- a delayed-draw term loan facility in a maximum amount not to exceed $50,000,000 (the "Term Loan Facility")
The Revolving Facility and the Term Loan Facility replace existing revolving and term loan facilities provided under our pre-existing credit and security agreement with City National, which had been most recently amended on December 6, 2011.
Our obligations under our secured credit facility are secured by a first priority security interest in substantially all of our tangible and intangible assets and are fully and unconditionally guaranteed by our subsidiaries, ColorLink Inc., a Delaware corporation ("ColorLink"), and Stereographics Corporation, a California corporation ("Stereographics").
We intend to borrow additional amounts under our secured credit facility to fund various growth initiatives, including accelerated research and product development, acquisitions, capital expenditures and stock repurchases. We expect that we will maintain a significant amount of indebtedness on an ongoing basis. Our Revolving Facility matures on April 17, 2015, and the Term Loan Facility matures the last day of the twelfth (12th) full fiscal quarter after the earlier of October 18, 2013 or the date that aggregate term loan commitments have been drawn in full, which maturity dates may, in each case, be accelerated in certain circumstances.
59
On December 6, 2011, we entered into a second amendment to the Credit Agreement to provide that the aggregate principal amount outstanding at any one time under our revolving credit loans shall remain $50 million after December 31, 2011 and to extend the maturity date of the revolving credit loans under the Credit Agreement to December 31, 2013. As of March 23, 2012, our primary sources of liquidity were our cash and cash equivalents of $24.9 million and our Credit Agreement providing for a revolving credit facility of up to $50.0 million through December 31, 2013, $25.0 million of which was available for borrowing.
During the year ended March 23, 2012, we received $4.0 million in cash and had $2.5 million of accounts receivable from motion picture exhibitors from the sale of digital projectors, resulting in a gain of $1.7 million in other income (loss).
On July 21, 2010, we completed the initial public offering of our common stock, or our IPO, in which we sold and issued 6 million shares of common stock at an issue price of $16.00 per share. A total of approximately $96 million in gross proceeds were raised from our IPO, or $81.9 million in net proceeds after deducting underwriting discounts and commissions of approximately $6.7 million and other offering costs of approximately $7.4 million.
On July 21, 2010, we repaid $25.1 million under our previous credit facility agreement.
On July 23, 2010, 407,593 shares were issued pursuant to the exercise of motion picture exhibitor stock options.
On December 6, 2010, we completed a secondary follow-on public offering in which certain selling stockholders sold 7,815,001 shares of our common stock at a price of $27.75 per share. We did not sell any shares in this follow-on public offering and we received no proceeds in connection with this offering.
On December 17, 2010, 1,222,780 shares were issued pursuant to the exercise of motion picture exhibitor stock options.
On January 31, 2011 1,110,284 shares were issued pursuant to the exercise of motion picture exhibitor stock options.
On March 9, 2011 407,594 shares were issued pursuant to the exercise of motion picture exhibitor stock options.
On March 16, 2011 112,496 shares were issued pursuant to the exercise of motion picture exhibitor stock options.
On May 9, 2011 407,593 shares were issued pursuant to the exercise of motion picture exhibitor stock options.
All 3,668,340 motion pictures exhibitor stock options have been exercised as of May 9, 2011.
See "Part I, Item 1A: "Risk Factors—Risks related to owning our common stock—Sales of outstanding shares of our common stock (or shares of our common stock issued upon exercise of stock options) into the market in the future could cause the market price of our stock to drop significantly, even if our business is doing well."
Based on our current operations and anticipated growth, we believe that the proceeds from the Credit Agreement (as subsequently replaced as disclosed below), our cash inflow from operating activities, existing cash and cash equivalents and our ability to borrow on acceptable terms will provide adequate funds for ongoing operations, planned capital expenditures and working capital requirements for at least the next 12 months.
60
The following table sets forth our major sources and (uses) of cash for the periods indicated:
| |
Year ended | |||||||||
|---|---|---|---|---|---|---|---|---|---|---|
(in thousands)
|
March 23, 2012 |
March 25, 2011 |
March 26, 2010 |
|||||||
Operating activities |
$ | 43,001 | $ | 35,098 | $ | 15,135 | ||||
Investing activities |
(57,469 | ) | (87,031 | ) | (29,636 | ) | ||||
Financing activities |
$ | 22,426 | $ | 55,735 | $ | 11,931 | ||||
Cash flow from operating activities
Net cash inflows from operating activities during the fiscal year ended March 23, 2012 primarily resulted from improved operating performance as RealD Cinema System installations and related licensing revenues driven by admissions increased. Net cash inflows from operating activities also benefited from decreased glasses inventories.
Net cash inflows from operating activities during the fiscal year ended March 25, 2011 primarily resulted from improved operating performance as RealD Cinema System installations and related licensing revenues driven by admissions increased. Net cash inflows from operating activities also benefited from increases in accounts payable and accrued expenses, partially offset by an increase in glasses inventories. Increases in accounts payable and accrued expenses were due to increased business activities, resulting in significant amounts due to vendors and compensation payable to employees. Glasses inventories grew in anticipation of the summer 2011 3D film slate and in order to support an increase in RealD Cinema System installations and admissions.
Net cash inflows from operating activities during the fiscal year ended March 26, 2010 primarily resulted from improved operating performance as RealD Cinema System installations and admissions increased. Net cash inflows from operating activities also benefited from increases in accounts payable and accrued expenses, partially offset by an increase in accounts receivable. Increases in accounts payable and accrued expenses were due to increased business activities at fiscal year end, resulting in significant amounts due to vendors and compensation payable to employees that were not paid until after the fiscal year end. Accounts receivable increased as a result of an increase in revenue.
Cash flow from investing activities and capital resources
For fiscal years 2010, 2011 and 2012, cash outflow for investing activities is primarily related to the establishment of our initial infrastructure and for the purchase of component parts for our RealD Cinema Systems, digital projectors, and other property, equipment and leasehold improvements. Capital expenditures were $61.5 million for the fiscal year ended March 23, 2012, $102.6 million for the fiscal year ended March 25, 2011 and $30.2 million for the fiscal year ended March 26, 2010. In the future, we will continue to invest in our business to grow sales and develop new products and support the related increasing employee headcount. We expect capital expenditures to represent a decreasing percentage of net revenue in the future.
In the fiscal year ended March 23, 2012, we received proceeds of $4.0 million as a result of the sale of digital projectors to certain of our motion picture exhibitors. In the fiscal year ended March 25, 2011, we purchased and sold available-for-sale securities of $6.8 million. Additionally, in the fiscal year ended March 25, 2011, we received proceeds of $15.6 million as a result of the sale of digital projectors to certain of our motion picture exhibitors. In the fiscal year ended March 26, 2010, we received proceeds of $0.5 million as a result of the sale of digital projectors to certain of our motion picture exhibitors.
In April 2012, we received proceeds of $2.5 million for the sale of digital projectors which we sold to certain of our motion picture exhibitors in March 2012.
61
Cash flow from financing activities
Net cash inflows from financing activities for the year ended March 23, 2012 primarily resulted from proceeds from the Credit Agreement of $30.0 million partially offset by $5.0 million of repayments on the Credit Agreement.
Net cash inflows from financing activities for the fiscal year ended March 25, 2011 primarily resulted from the proceeds from the completion of our IPO in which we sold and issued 6 million shares of common stock at an issue price of $16.00 per share. A total of approximately $96 million in gross proceeds were raised from our IPO, or $81.9 million in net proceeds after deducting underwriting discounts and commissions of approximately $6.7 million and other offering costs of approximately $7.4 million. We used the net proceeds from our IPO to repay $25.1 million of amounts outstanding under our previous credit facility agreement. In the fiscal year ended March 25, 2011, repayments of long-term debt of $9.7 million and a noncontrolling interest distribution of $0.9 million offset proceeds from our previous credit facility agreement of $5.0 million.
From time to time, we enter into equipment purchase agreements with certain of our vendors for the purchase of digital projectors, digital servers, lenses and accessories. We pay a portion of the cost of the equipment upon delivery and finance a portion of the purchase price by issuing notes payable. Certain of these notes payable are non-interest bearing. In those cases, we record the net present value of the notes payable assuming an implied annual interest rate which is approximately 8.4%. Interest expense is based on annual interest rates ranging from 7.0% to 8.4%. The notes are secured by the underlying equipment. Notes payable totaled $2.3 million as of March 25, 2011 and $11.3 million as of March 26, 2010. There was no notes payable outstanding as of March 23, 2012.
Prior to July 21, 2010, the date of our IPO, we had $25.1 million of borrowings outstanding pursuant to our previous credit facility agreement with City National Bank that provides for a maximum amount of borrowing under a revolving credit facility of $25 million and a term loan of $10 million. All amounts outstanding under our previous credit facility agreement became due and were repaid upon the closing of our IPO on July 21, 2010.
As of March 25, 2011, there were no borrowings outstanding under our credit and security agreement with City National, dated as of June 24, 2010 (the "Credit Agreement") providing for a revolving credit facility of up to $15.0 million. In the future, we may continue to utilize commercial financing, lines of credit and term loans for general corporate purposes, including investing in technology.
We have entered into the Credit Agreement with City National, which was dated as of June 24, 2010 and amended on April 5, 2011, to provide that the aggregate principal amount outstanding at any one time under our revolving credit loans may be (i) up to $50.0 million through December 31, 2011 and (ii) up to $25.0 million thereafter and which will mature on June 30, 2012. On December 6, 2011, we further amended the Credit Agreement to provide that the aggregate principal amount outstanding at any one time under our revolving credit loans shall remain up to $50 million and to extend the maturity date of the revolving credit loans under the Credit Agreement to December 31, 2013. The Credit Agreement and the revolving credit facility provided thereunder became effective on July 21, 2010. Our obligations under the Credit Agreement are secured by a first priority security interest in substantially all of our tangible and intangible assets in favor of City National Bank and are fully and unconditionally guaranteed by our subsidiaries, ColorLink and Stereographics.
Under the Credit Agreement, our business will be subject to certain limitations, including limitations on our ability to incur additional debt, make certain investments or acquisitions, enter into certain merger and consolidation transactions, and sell our assets other than in the ordinary course of business. We are also required to maintain compliance with certain financial covenants, including a minimum fixed charge coverage ratio and a maximum leverage ratio. As of March 23, 2012, we were in
62
compliance with all financial covenants in the Credit Agreement. If we fail to comply with any of the covenants or if any other event of default, as defined in the agreement, should occur, the bank could elect to prevent us from borrowing and declare the indebtedness to be immediately due and payable.
On December 6, 2011, we entered into a second amendment to the Credit Agreement to provide that the aggregate principal amount outstanding at any one time under our revolving credit loans shall remain $50 million after December 31, 2011 and to extend the maturity date of the revolving credit loans under the Credit Agreement to December 31, 2013. As of March 23, 2012, there was $25.0 million outstanding under the Credit Agreement and there was $25.0 million available to borrow under the Credit Agreement.
We recently entered into a secured credit facility agreement with City National to provide us with:
- •
- a revolving credit facility (including a letter of credit sub-facility) in a maximum amount not to exceed
$75,000,000 (the "Revolving Facility"); and
- •
- a delayed-draw term loan facility in a maximum amount not to exceed $50,000,000 (the "Term Loan Facility")
The Revolving Facility and the Term Loan Facility replace existing revolving and term loan facilities provided under our pre-existing credit and security agreement with City National, which had been most recently amended on December 6, 2011.
Our obligations under our secured credit facility are secured by a first priority security interest in substantially all of our tangible and intangible assets and are fully and unconditionally guaranteed by our subsidiaries, ColorLink Inc., a Delaware corporation ("ColorLink"), and Stereographics Corporation, a California corporation ("Stereographics").
We intend to borrow additional amounts under our secured credit facility to fund various growth initiatives, including accelerated research and product development, acquisitions, capital expenditures and stock repurchases. We expect that we will maintain a significant amount of indebtedness on an ongoing basis. Our Revolving Facility matures on April 17, 2015, and the Term Loan Facility matures the last day of the twelfth (12th) full fiscal quarter after the earlier of October 18, 2013 or the date that aggregate term loan commitments have been drawn in full, which maturity dates may, in each case, be accelerated in certain circumstances.
Non-controlling interest partner capital contributions for the years ended March 23, 2012, March 25, 2011 and March 26, 2010 were not significant.
From time to time, we expect to receive cash from the exercise of employee stock options and warrants in our common stock. Proceeds from the exercise of employee stock options and warrants outstanding will vary from period to period based upon, among other factors, fluctuations in the market value of our common stock relative to the exercise price of such stock options and warrants. Proceeds from employee stock option exercises were $1.0 million and $3.9 million for the years ended March 23, 2012 and March 25, 2011, respectively. Proceeds from employee stock option exercises for the year ended March 26, 2010 were not significant. Proceeds from the exercise of warrants in our common stock were $0.3 million and $0.6 million for the years ended March 23, 2012 and March 25, 2011, respectively. Proceeds from the exercise of warrants in our common stock for the year ended March 26, 2010 were not significant.
During the fiscal year ended March 25, 2011, 3,260,747 shares were issued pursuant to the exercise of motion picture exhibitor stock options described elsewhere in this Annual Report on Form 10-K.
All 3,668,340 motion pictures exhibitor stock options have been exercised as of May 9, 2011.
See "Part I, Item 1A: "Risk factors—Risks related to owning our common stock—Sales of outstanding shares of our common stock (or shares of our common stock issued upon exercise of stock
63
options) into the market in the future could cause the market price of our stock to drop significantly, even if our business is doing well."
Contractual obligations and commitments
The following table sets forth our contractual obligations and commitments as of March 23, 2012 (in thousands):
| |
Payments due by period | |||||||||||||||
|---|---|---|---|---|---|---|---|---|---|---|---|---|---|---|---|---|
| |
Total | Less than 1 Year |
Years 2 - 3 |
Years 4 - 5 |
More than 5 Years |
|||||||||||
Secured credit facilities(1) |
$ | 25,000 | $ | — | $ | — | $ | 25,000 | $ | — | ||||||
Operating lease obligations(2) |
$ | 28,922 | 3,221 | 5,963 | 6,015 | 13,723 | ||||||||||
Purchase obligations(3) |
8,708 | 8,708 | — | — | — | |||||||||||
Total |
$ | 62,630 | $ | 11,929 | $ | 5,963 | $ | 31,015 | $ | 13,723 | ||||||
- (1)
- See
Note 6, "Borrowings" and Note 14, "Subsequent events (unaudited)" to our consolidated financial statements, which are included elsewhere
in this this Annual Report on Form 10-K.
- (2)
- See
Note 7, "Commitments and contingencies," to our consolidated financial statements, which are included elsewhere in this Annual Report on
Form 10-K.
- (3)
- Consists of contractual purchase obligations with certain of our vendors including some revolving 90-day supply commitments.
Off-balance sheet arrangements
We do not have any relationships with unconsolidated entities or financial partnerships, such as entities often referred to as structured finance or special purpose entities, that would have been established for the purpose of facilitating off-balance sheet arrangements or other contractually narrow or limited purposes. As such, we are not exposed to any financing, liquidity, market or credit risk that could arise if we had engaged in those types of relationships. We enter into guarantees in the ordinary course of business related to the guarantee of our own performance and the performance of our subsidiaries.
Non-U.S. GAAP discussion
In addition to our U.S. GAAP results, we present Adjusted EBITDA as a supplemental measure of our performance. However, Adjusted EBITDA is not a recognized measurement under U.S. GAAP. We define Adjusted EBITDA as net income (loss), plus net interest expense, income and other taxes, depreciation and amortization, share-based compensation expense and exhibitor option expense, as further adjusted to eliminate the impact of certain other items that we do not consider indicative of our core operating performance. Management considers our core operating performance to be that which can be affected by our managers in any particular period through their management of the resources that affect our underlying revenue and profit generating operations that period. Non-U.S. GAAP adjustments to our results prepared in accordance with U.S. GAAP are itemized below. You are encouraged to evaluate these adjustments and the reasons we consider them appropriate for supplemental analysis. In evaluating Adjusted EBITDA, you should be aware that in the future we may incur expenses that are the same as or similar to some of the adjustments in this presentation. Our presentation of Adjusted EBITDA should not be construed as an inference that our future results will be unaffected by unusual or non-recurring items.
64
Set forth below is a reconciliation of Adjusted EBITDA to net income (loss) for the following periods indicated:
| |
Year ended | |||||||||
|---|---|---|---|---|---|---|---|---|---|---|
(in thousands)
|
March 23, 2012 |
March 25, 2011 |
March 26, 2010 |
|||||||
Net income (loss) |
$ | 37,025 | $ | (6,825 | ) | $ | (39,749 | ) | ||
Add (deduct): |
||||||||||
Interest expense |
971 | 919 | 1,730 | |||||||
Income tax expense |
5,105 | 4,272 | 2,680 | |||||||
Depreciation and amortization |
28,266 | 15,737 | 7,952 | |||||||
Other (income) loss(1) |
(782 | ) | (6,182 | ) | 1,112 | |||||
Share-based compensation expense(2) |
15,744 | 8,950 | 2,909 | |||||||
Exhibitor option expense(3) |
— | 36,447 | 39,234 | |||||||
Impairment of assets and intangibles(4) |
10,269 | 1,128 | 426 | |||||||
Sales and use tax(5) |
6,363 | 6,484 | 5,478 | |||||||
Property tax(6) |
1,434 | 1,090 | 605 | |||||||
Management fee(7) |
— | 175 | 350 | |||||||
Adjusted EBITDA |
$ | 104,395 | $ | 62,195 | $ | 22,727 | ||||
- (1)
- Includes
amortization of debt issue costs and unrealized foreign currency exchange gains and losses and gain on sale of digital projectors.
- (2)
- Represents
share-based compensation expense of nonstatutory and incentive stock options and restricted stock units to employees, officers, directors and
consultants.
- (3)
- Represents
stock options granted to some of our motion picture exhibitor licensees. The amounts are recorded as contra revenue in the consolidated financial
statements.
- (4)
- Represents
impairment of long-lived assets, such as fixed assets, theatrical equipment and identifiable intangibles.
- (5)
- Represents
taxes incurred by us for cinema license and product revenue.
- (6)
- Represents
property taxes on RealD Cinema Systems and digital projectors.
- (7)
- Represents payment of management fees to our Series C mandatorily redeemable convertible preferred stockholder (included in general and administrative expense), which were terminated upon the completion of our IPO.
We present Adjusted EBITDA because we believe it assists investors and analysts in comparing our performance across reporting periods on a consistent basis by excluding items that we do not believe are indicative of our core operating performance. In addition, we use Adjusted EBITDA in developing our internal budgets, forecasts and strategic plan; in analyzing the effectiveness of our business strategies; to evaluate potential acquisitions; in making compensation decisions; and in communications with our board of directors concerning our financial performance. Adjusted EBITDA has limitations as an analytical tool. Some of these limitations are:
- •
- Adjusted EBITDA does not reflect our cash expenditures, or future requirements, for capital expenditures or contractual
commitments;
- •
- Adjusted EBITDA does not reflect changes in, or cash requirements for, our working capital needs;
65
- •
- Adjusted EBITDA does not reflect the significant interest expense, or the cash requirements necessary to service interest
or principal payments, on our debts;
- •
- although depreciation and amortization are non-cash charges, the assets being depreciated and amortized will
often have to be replaced in the future, and Adjusted EBITDA does not reflect any cash requirements for such replacements;
- •
- non-cash compensation is and will remain a key element of our overall long-term incentive
compensation package, although we exclude it as an expense when evaluating our ongoing operating performance for a particular period;
- •
- Adjusted EBITDA does not reflect the impact of certain cash charges resulting from matters we consider not to be
indicative of our ongoing operations;
- •
- Adjusted EBITDA also differs from the amounts calculated under the similarly titled definition in our Credit Agreement,
which is further adjusted to reflect certain other cash and non-cash charges and is used to determine compliance with financial covenants and our ability to engage in certain activities,
such as incurring additional debt and making certain restricted payments; and
- •
- other companies in our industry may calculate Adjusted EBITDA differently than we do, limiting its usefulness as a comparative measure.
Because of these limitations, Adjusted EBITDA should not be considered in isolation or as a substitute for performance measures calculated in accordance with U.S. GAAP. We compensate for these limitations by relying primarily on our U.S. GAAP results and using Adjusted EBITDA only as a supplement. Our consolidated financial statements and the notes to those statements included elsewhere are prepared in accordance with U.S. GAAP.
Critical accounting policies and estimates
The discussion in this Item 7 is based upon our consolidated financial statements, which have been prepared in accordance with U.S. GAAP. The preparation of our financial statements requires us to make estimates and judgments that affect the reported amounts of assets, liabilities, revenues, and expenses, and related disclosure of contingent assets and liabilities. On an on-going basis, estimates and judgments are evaluated, including those related to revenue recognition, revenue deductions, product returns, fair value of our common stock, share-based compensation, inventories, definite lived asset impairments, goodwill impairment and income taxes. These estimates and judgments are based on historical experience and on various other assumptions that we believe to be reasonable under the circumstances, which form the basis for our judgments about the carrying values of assets and liabilities not readily apparent from other sources. By their nature, estimates are subject to an inherent degree of uncertainty. Actual results may differ from these estimates.
We believe the following critical accounting policies, among others, affect our more significant judgments and estimates used in the preparation of our consolidated financial statements.
Revenue recognition and revenue reductions
We derive substantially all of our revenue from the license of our RealD Cinema Systems and the international product sale of, or fees received domestically related to, our RealD eyewear. We evaluate revenue recognition for transactions using the criteria set forth by the SEC in Staff Accounting Bulletin No. 104, Revenue Recognition (SAB 104) and Accounting Standards Codification Topic 605, Revenue Recognition (ASC 605). The revenue recognition guidance states that revenue is recognized when all of the following criteria are met: persuasive evidence of an arrangement exists, delivery has occurred or
66
services have been rendered, the seller's price to the buyer is fixed or determinable and collectability is reasonably assured.
License revenue. License revenue is accounted for as an operating lease. License revenue is primarily derived under per-admission, periodic fixed fee, or per-motion picture basis with motion picture exhibitors. Amounts received up front, less estimated allowances, are deferred and recognized over the lease term using the straight-line method. Additional lease payments that are contingent upon future events outside our control, including those related to admission and usage, are recognized as revenues when the contingency is resolved and we have no more obligations to our customers specific to the contingent payment received. Certain of our license revenue from leasing our RealD Cinema Systems is earned upon admission by the motion picture exhibitor's consumers. Our licensees, however, do not report and pay for such license revenue until after the admission has occurred, which may be received subsequent to our fiscal period end. We estimate and record licensing revenue related to motion picture exhibitor consumer admissions in the fiscal quarter in which the admission occurs, but only when reasonable estimates of such amounts can be made. We determine that there is persuasive evidence of an arrangement upon the execution of a license agreement or upon the receipt of a licensee's admissions report. Revenue is deemed fixed or determinable upon receipt of a licensee's admissions report. We determine collectability based on an evaluation of the licensee's recent payment history.
Product revenue. We recognize product revenue, net of allowances, when title and risk of loss have passed and when there is persuasive evidence of an arrangement, the payment is fixed or determinable, and collectability of payment is reasonably assured. In the United States and Canada, certain of our product revenue from the sale of our RealD eyewear is earned upon admission and usage by the motion picture exhibitor's consumers. Our customers, however, do not report admission or usage information until after the admission and usage has occurred, and such information may be received subsequent to our fiscal period end. We estimate and record such product revenue in the quarter in which the admission and usage occurs, but only when reasonable estimates of such amounts can be made.
Revenue reductions. We record revenue net of motion picture exhibitor stock options and estimated revenue allowances. In connection with certain exhibitor licensing agreements, we issued the motion picture exhibitors a 10-year option to purchase shares of our common stock at approximately $0.00667 per share. The stock options vest upon the achievement of screen installation targets. Motion picture exhibitor stock options are valued at the underlying stock price at each reporting period until the targets are met. Amounts recognized are based on the number of RealD-enabled screens as a percentage of total screen installation targets. The stock options do not have net cash settlement features. Amounts recorded as a revenue reduction totaled $36.4 million for the year ended March 25, 2011 and $39.2 million for the year ended March 26, 2010. There were no amounts recorded as a revenue reduction for the year ended March 23, 2012. As of March 25, 2011, all 3,668,340 motion picture exhibitor stock options had vested and all associated reduction of revenue had been recognized.
Share-based compensation
We account for stock options, performance stock options and restricted stock units granted to employees and directors by recording compensation expense based on estimated fair values. We estimate the fair value of share-based payment awards on the date of grant. The value of the portion of the award that is ultimately expected to vest is recognized as expense over the requisite service periods in our consolidated statements of operations. Share-based awards are attributed to expense using the straight-line method over the vesting period. We determine the value of each option award that contains a market condition using a lattice-based option valuation model, while all other option awards are valued using the Black-Scholes valuation model as permitted under Accounting Standards
67
Codification Topic 718, Compensation—Stock Compensation (ASC 718). The assumptions used in calculating the fair value of share-based payment awards represent our best estimates based on management judgment and subjective future expectations. Our estimates of the fair values of stock options granted and the resulting amounts of share-based compensation recognized may be impacted by certain variables including stock price volatility, employee stock option exercise behaviors, additional stock option grants, modifications, estimates of forfeitures and the related income tax impact. If any of the assumptions used in our valuation models significantly change, share-based compensation for future awards may differ materially from the awards granted previously.
Inventories
Domestically, we provide our RealD eyewear free of charge to motion picture exhibitors and then receive a fee from the motion picture studios for the usage of that RealD eyewear by the motion picture exhibitors' consumers.
For RealD eyewear located at a motion picture exhibitor, we believe that it is not operationally practical to perform physical counts or request the motion picture exhibitor to perform physical counts and confirm quantities held to ensure that losses due to damage, destruction, and shrinkage are specifically recognized in the period incurred due to the number of domestic RealD-enabled screens and related usage of RealD eyewear. We believe that the cost to monitor shrinkage or usage significantly outweighs the financial reporting benefits of using a specific identification methodology of expensing. We believe that utilizing a composite method of expensing RealD eyewear inventory costs provides a rational and reasonable approach to ensuring that shrinkage is provided for in the period incurred and that inventory costs are expensed in the periods that reasonably reflect the periods in which the related revenue is recognized. In doing so, we believe the following methodology reasonably and generally reflects periodic income or loss under these facts and circumstances:
- •
- For an estimated period of time following shipment to domestic motion picture exhibitors, no expense is recognized between
the time of shipment and until the delivery is made as the inventory unit is in transit and unused.
- •
- The inventory unit cost is expensed on a straight-line basis over an estimated usage period beginning when we believe usage of the inventory unit has started. In estimating the expensing start date and related expense period, we consider various factors including, but not limited to, those relating to a 3D motion picture's opening release date, a 3D motion picture's expected release period, the number of currently playing 3D motion pictures, the motion picture exhibitor's ordering and stocking patterns and practices and the quantities shipped per inventory unit.
We believe that the expensing methodology described above rationally and reasonably approximates the period the related usage occurs resulting in our RealD eyewear product revenue. The expensing start date following the date of shipment is meant to approximate the date at which usage begins. Additionally, as the expense recognition period has been and is expected to continue to be short, we believe it adequately recognizes inventory impairments due to loss and damage on a timely basis. We further believe that exposures due to loss or damage, if any, are considered normal shrinkage and a necessary and expected cost to generate the revenue per 3D motion picture earned through RealD eyewear usage. We continue to monitor the reasonableness of this methodology to ensure that it approximates the period over which the related RealD eyewear product revenue is earned and realizable. RealD eyewear inventory costs that have not yet been expensed are reported as deferred costs-eyewear.
68
Impairment of long-lived assets
We review long-lived assets, such as property and equipment, cinema systems, digital projectors and intangibles, for impairment whenever events or changes in circumstances indicate that the carrying amount of an asset may not be recoverable. Factors or circumstances that could indicate the occurrence of such events include current period operating or cash flow losses combined with a history of operating or cash flow losses, a projection or forecast that demonstrates continuing operating or cash flow losses, or incurring costs in excess of amounts originally expected to acquire or construct an asset. If the asset is not recoverable, an impairment loss is recognized as the amount by which the carrying amount of the asset exceeds its fair value.
Goodwill impairment
Goodwill is deemed to have an indefinite useful life and therefore is not amortized. We evaluate our goodwill for impairment using a two-step process that is performed at least annually during our fourth fiscal quarter, or whenever events or circumstances indicate that goodwill may be impaired. The first step is a comparison of the fair value of an internal reporting unit with its carrying amount, including goodwill. A reporting unit is an operating segment or one level below an operating segment. If the fair value of the reporting unit exceeds its carrying value, goodwill of the reporting unit is not considered impaired and the second step is unnecessary. If the carrying value of the reporting unit exceeds its fair value, the second step is performed to measure the amount of impairment by comparing the carrying amount of the goodwill to a determination of the implied value of the goodwill. If the carrying amount of goodwill is greater than the implied value, an impairment loss is recognized for the difference. We currently have one reporting unit in which goodwill resides and the reporting unit is not at risk of failing step one.
Deferred tax asset valuation and tax exposures
In preparing our consolidated financial statements, we are required to make estimates and judgments that affect our accounting for income taxes. This process includes estimating actual current tax exposure together with assessing temporary differences resulting from differing treatment of items for tax and accounting purposes. These differences, including the timing of recognition of share-based compensation expense, result in deferred tax assets and liabilities, which are included in our consolidated balance sheets. We also assess the likelihood that our deferred tax assets will be recovered from future taxable income and, to the extent that we believe that recovery is not likely, we have established a valuation allowance. We assess realization of our deferred tax assets based on all available evidence in order to conclude whether it is more likely than not that the deferred tax assets will be realized. Available evidence considered by us includes, but is not limited to, our historic operating results, projected future operating results, reversing temporary differences, changing business circumstances, and the ability to realize certain deferred tax assets through loss and tax credit carry-back and carry-forward strategies. As of March 23, 2012, we have determined based on the weight of the available evidence, both positive and negative, to provide for a valuation allowance against substantially all of the net deferred tax assets. The current deferred tax assets not reserved for by the valuation allowance are those in foreign jurisdictions whereby future realization is more likely than not to be obtained. If there is a change in circumstances that causes a change in judgment about the realizability of the deferred tax assets, we will adjust all or a portion of the applicable valuation allowance in the period when such change occurs.
We are subject to ongoing tax exposures, examinations and assessments in various jurisdictions. Accordingly, we may incur additional tax expense based upon the outcomes of such matters. In addition, when applicable, we adjust tax expense to reflect our ongoing assessments of such matters which require judgment and can materially increase or decrease our effective rate as well as impact operating results.
69
Significant judgment is required in determining the provision for income taxes, deferred tax assets and liabilities, the valuation allowance against our deferred tax assets and uncertainty in income tax positions. Our financial position and results of operations may be materially impacted if actual results significantly differ from these estimates or the estimates are adjusted in future periods.
Contingencies and assessments
We are subject to various loss contingencies and assessments arising in the course of our business, some of which relate to litigation, claims, property taxes and sales and use or goods and services tax assessments. We consider the likelihood of the loss or the incurrence of a liability, as well as our ability to reasonably estimate the amount of loss in determining loss, contingencies and assessments. An estimated loss contingency or assessment is accrued when it is probable that a liability has been incurred and the amount of loss can be reasonably estimated. We regularly evaluate current information available to us to determine whether such accruals should be adjusted. Based on the information presently available, including discussion with counsel and other consultants, management believes that resolution of these matters will not have a material adverse effect on our business, consolidated results of operations, financial condition or cash flows.
Recent accounting pronouncements
In May 2011, the FASB issued Accounting Standards Update ("ASU") No. 2011-04, Amendments to Achieve Common Fair Value Measurement and Disclosure Requirements in U.S. GAAP and International Financial Reporting Standards (Topic 820)—Fair Value Measurement, to provide a consistent definition of fair value and ensure that the fair value measurement and disclosure requirements are similar between U.S. GAAP and International Financial Reporting Standards. ASU No. 2011-04 changes certain fair value measurement principles and enhances the disclosure requirements, particularly for level 3 fair value measurements. ASU No. 2011-04 is effective for interim and annual reporting periods beginning after December 15, 2011 and must be applied prospectively. It is not expected that the adoption of this ASU will have a material impact on our financial statements.
In June 2011, the FASB issued ASU 2011-05, Comprehensive Income (Topic 220): Presentation of Comprehensive Income. ASU 2011-05 requires one of two alternatives for presenting comprehensive income and eliminates the option to report other comprehensive income and its components as a part of the consolidated statements of equity. Additionally, ASU 2011-05 requires presentation on the face of the financial statements reclassification adjustments for items that are reclassified from other comprehensive income to net income in the statement(s) where the components of net income and the components of other comprehensive income are presented. The requirement related to the reclassification adjustments from other comprehensive income to net income was deferred in December 2011, as a result of the issuance of ASU 2011-12, Deferral of the Effective Date for Amendments to the Presentation of Reclassifications of Items Out of Accumulated Other Comprehensive Income in Accounting Standards Update 2011-05 (Topic 220). The amendments in ASU 2011-05, as amended by ASU 2011-12, do not change the items that must be reported in other comprehensive income or when an item of other comprehensive income must be reclassified to net income. ASU 2011-05, as amended by ASU 2011-12 is effective for fiscal years and interim periods within those years beginning after December 15, 2011 and is to be applied retrospectively. We will adopt ASU 2011-05 during the first quarter of fiscal 2013. We do not expect the adoption of ASU 2011-05, as amended by ASU 2011-12 to have a material impact on our consolidated financial statements.
In September 2011, the FASB issued ASU 2011-08, Intangibles (Topic 350)—Goodwill and Other, which allows companies to waive comparing the fair value of a reporting unit to its carrying amount in assessing the recoverability of goodwill if, based on qualitative factors, it is not more likely than not that the fair value of a reporting unit is less than its carrying amount. ASU 2011-08 will be effective for annual and interim goodwill impairment tests performed for fiscal years beginning after December 15,
70
2011. The adoption of this ASU did not have a material impact on our consolidated financial statements.
Item 7A. Quantitative and qualitative disclosures about market risk
We have operations outside the United States. We are exposed to market risks in the ordinary course of our business. These risks primarily include interest rate, foreign exchange and inflation risks as well as changes in the general economic conditions in the countries where we conduct business. To reduce certain of these risks, we monitor the financial condition of our large customers and limit credit exposure as we deem appropriate. In addition, our investment strategy currently has been to invest in financial instruments that are highly liquid, readily convertible into cash and which mature within three months from the date of purchase. We also enter into foreign exchange derivative hedging transactions as part of our risk management program. For accounting purposes, we do not designate any of our derivative instruments as hedges and we do not use derivatives for speculating trading purposes and are not a party to leveraged derivatives.
Interest rate risk
We are exposed to market risk related to changes in interest rates.
Our investments are considered cash equivalents and primarily consist of money market funds. At March 23, 2012, we had cash and cash equivalents of $24.9 million. The carrying amount of cash equivalents reasonably approximates fair value due to the short maturities of these instruments. The primary objective of our investment activities is preservation of capital, fulfillment of liquidity needs and fiduciary control of cash and investments. We also seek to maximize income from our investments without assuming significant risk. We do not enter into investments for trading or speculative purposes. Our investments are exposed to market risk due to a fluctuation in interest rates, which may affect our interest income and the fair market value of our investments. Due to the short-term nature of our investment portfolio, however, we do not believe an immediate 10% increase or decrease in interest rates would have a material effect on the fair market value of our portfolio, and therefore we do not expect our operating results or cash flows to be materially affected by a sudden change in market interest rates.
We do not believe our cash equivalents have significant risk of default or illiquidity. While we believe our cash equivalents do not contain excessive risk, we cannot provide absolute assurance that in the future our investments will not be subject to adverse changes in market value. In addition, we maintain significant amounts of cash and cash equivalents at one or more financial institutions that are in excess of federally insured limits. We cannot be assured that we will not experience losses on these deposits.
The revolving credit facility provides for, at our option, Revolving London Interbank Offered Rate (LIBOR) loans, which bear interest at the greater of three and one half percent (3.50%) or the LIBOR plus two and one-half percent (2.50%) or Revolving Prime loans which bear interest at the greater of three and one half percent (3.50%) or the fluctuating Prime Rate per annum. Changes in interest rates do not affect operating results or cash flows on our fixed rate borrowings but would impact our variable rate borrowings. At March 23, 2012, we had $25 million of borrowings outstanding under the Credit Agreement. As of March 23, 2012, borrowings outstanding under the Credit Agreement bear interest at 3.50%.
Foreign currency risk
We have foreign currency risks related to our revenue and operating expenses denominated in currencies other than the United States dollar. Our historical revenue has generally been denominated in United States dollars, and a significant portion of our current revenue continues to be denominated
71
in United States dollars; however, we expect an increasing portion of our future revenue to be denominated in currencies other than the United States dollar, primarily the Euro, British pound sterling, Canadian dollar, various Latin American currencies, Japanese yen, Chinese Yuan and Hong Kong Dollar. Our operating expenses are generally denominated in the currencies of the countries in which our operations are located, primarily the United States and United Kingdom. Increases and decreases in our international revenue from movements in foreign exchange rates are partially offset by the corresponding increases or decreases in our international operating expenses. To further reduce our net exposure to foreign exchange rate fluctuations on our results of operations, we have entered into foreign currency forward contracts.
We had outstanding forward contracts based in British pound sterling, Canadian dollar and the Euro with notional amounts totaling $4.3 million as of March 23, 2012 and $8.1 million as of March 25, 2011. The net gain (loss) related to the change in fair value of our foreign currency forward contracts was not significant for the years ended March 23, 2012, March 25, 2011 and March 26, 2010. With regard to these contracts, a hypothetical 10.0% adverse movement in foreign exchange rates compared with the U.S. dollar relative to exchange rates on March 23, 2012 would result in a $0.4 million reduction in fair value of these forward contracts and a corresponding foreign currency loss of approximately $0.5 million. This analysis does not consider the impact that hypothetical changes in foreign currency exchange rates would have on anticipated transactions and assets and liabilities that these foreign currency sensitive instruments were designed to offset.
As our international operations grow, our risks associated with fluctuation in currency rates will become greater, and we will continue to reassess our approach to managing this risk. In addition, currency fluctuations or a weakening United States dollar can increase the costs of our international expansion. As our international operations grow, we expect to conduct more of our business in currencies other than the U.S. dollar, thereby increasing risks associated with fluctuation in currency rates. Currency fluctuations or a weakening United States dollar can increase the costs of our international expansion. As our exposure to currency risks grows, we will continue to reassess our risk management.
Inflation risk
We do not believe that inflation has had a material effect on our business, financial condition or results of operations. If our costs were to become subject to significant inflationary pressures, we may not be able to fully offset such higher costs through price increases. Our inability or failure to do so could harm our business, financial condition and results of operations.
Counterparty risk
Our financial statements, including derivatives, are subject to counterparty credit risk, which we consider as part of the overall fair value measurement. We attempt to mitigate this risk through credit monitoring procedures.
72
Item 8. Financial statements and supplementary data
73
Report of Independent Registered Public Accounting Firm
The Board of Directors and Stockholders of RealD Inc.
We have audited the accompanying consolidated balance sheets of RealD Inc. as of March 23, 2012 and March 25, 2011, and the related consolidated statements of operations, changes in mandatorily redeemable convertible preferred stock and equity (deficit), and cash flows for each of the three years in the period ended March 23, 2012. Our audits also included the financial statement schedule listed in the Index at Item 15(a) 2. These financial statements are the responsibility of the Company's management. Our responsibility is to express an opinion on these financial statements and schedule based on our audits.
We conducted our audits in accordance with the standards of the Public Company Accounting Oversight Board (United States). Those standards require that we plan and perform the audit to obtain reasonable assurance about whether the financial statements are free of material misstatement. An audit includes examining, on a test basis, evidence supporting the amounts and disclosures in the financial statements. An audit also includes assessing the accounting principles used and significant estimates made by management, as well as evaluating the overall financial statement presentation. We believe that our audits provide a reasonable basis for our opinion.
In our opinion, the financial statements referred to above present fairly, in all material respects, the consolidated financial position of RealD Inc. at March 23, 2012 and March 25, 2011, and the consolidated results of its operations and its cash flows for each of the three years in the period ended March 23, 2012, in conformity with U.S. generally accepted accounting principles. Also, in our opinion, the related financial statement schedule, when considered in relation to the basic financial statements take as a whole, presents fairly in all material respects that information set forth therein.
We also have audited, in accordance with the standards of the Public Company Accounting Oversight Board (United States), RealD, Inc.'s internal control over financial reporting as of March 23, 2012, based on criteria established in Internal Control—Integrated Framework issued by the Committee of Sponsoring Organizations of the Treadway Commission and our report dated May 31, 2012 expressed an unqualified opinion thereon.
|
/s/ Ernst & Young LLP |
Los
Angeles, California
May 31, 2012
74
RealD Inc.
Consolidated balance sheets
(in thousands, except per share data)
| |
March 23, 2012 |
March 25, 2011 |
|||||
|---|---|---|---|---|---|---|---|
Assets |
|||||||
Current assets: |
|||||||
Cash and cash equivalents |
$ | 24,894 | $ | 16,936 | |||
Accounts receivable, net |
59,212 | 50,676 | |||||
Inventories |
40,577 | 54,971 | |||||
Deferred costs—eyewear |
932 | 49 | |||||
Deferred income taxes |
— | 1,029 | |||||
Income taxes receivable |
— | 139 | |||||
Prepaid expenses and other current assets |
2,630 | 1,734 | |||||
Total current assets |
128,245 | 125,534 | |||||
Property and equipment, net |
12,713 | 7,889 | |||||
Cinema systems, net |
141,024 | 122,226 | |||||
Digital projectors, net-held for sale |
1,078 | 10,475 | |||||
Goodwill |
10,657 | 10,657 | |||||
Other intangibles, net |
1,746 | 1,918 | |||||
Deferred income taxes |
3,049 | — | |||||
Other assets |
3,663 | 1,448 | |||||
Total assets |
$ | 302,175 | $ | 280,147 | |||
Liabilities and equity |
|||||||
Current liabilities: |
|||||||
Accounts payable |
$ | 22,617 | $ | 58,713 | |||
Accrued expenses and other liabilities |
28,870 | 40,118 | |||||
Deferred revenue |
7,201 | 14,176 | |||||
Income taxes payable |
1,121 | — | |||||
Deferred income taxes |
3,149 | — | |||||
Current portion of long-term debt |
— | 2,291 | |||||
Total current liabilities |
62,958 | 115,298 | |||||
Credit facility agreement |
25,000 | — | |||||
Deferred revenue, net of current portion |
13,920 | 14,106 | |||||
Other long-term liabilities, customer deposits and virtual print fee liability |
2,691 | 4,533 | |||||
Long-term debt, net of current portion |
— | 19 | |||||
Deferred tax liability |
— | 1,091 | |||||
Commitments and contingencies |
|||||||
Equity (deficit) |
|||||||
Common stock, $0.0001 par value, 200,000 shares authorized; 54,561 and 53,570 shares issued and outstanding at March 23, 2012 and March 25, 2011, respectively |
309,894 | 292,904 | |||||
Accumulated deficit |
(112,711 | ) | (149,580 | ) | |||
Total RealD Inc. stockholders' equity |
197,183 | 143,324 | |||||
Noncontrolling interest |
423 | 1,776 | |||||
Total equity |
197,606 | 145,100 | |||||
Total liabilities and equity |
$ | 302,175 | $ | 280,147 | |||
See accompanying notes to consolidated financial statements
75
RealD Inc.
Consolidated statements of operations
(in thousands, except per share data)
| |
Year ended | |||||||||
|---|---|---|---|---|---|---|---|---|---|---|
| |
March 23, 2012 |
March 25, 2011 |
March 26, 2010 |
|||||||
Revenue: |
||||||||||
License |
$ | 147,801 | $ | 101,523 | $ | 40,914 | ||||
Product and other |
98,827 | 144,613 | 108,932 | |||||||
Total revenue |
246,628 | 246,136 | 149,846 | |||||||
Cost of revenue: |
||||||||||
License |
39,801 | 17,994 | 9,452 | |||||||
Product and other |
78,137 | 160,402 | 131,151 | |||||||
Total cost of revenue |
117,938 | 178,396 | 140,603 | |||||||
Gross profit |
128,690 | 67,740 | 9,243 | |||||||
Operating expenses: |
||||||||||
Research and development |
16,500 | 15,582 | 11,021 | |||||||
Selling and marketing |
27,682 | 24,139 | 16,811 | |||||||
General and administrative |
42,189 | 35,835 | 15,638 | |||||||
Total operating expenses |
86,371 | 75,556 | 43,470 | |||||||
Operating income (loss) |
42,319 | (7,816 | ) | (34,227 | ) | |||||
Interest expense |
(971 | ) | (919 | ) | (1,730 | ) | ||||
Other income (loss) |
782 | 6,182 | (1,112 | ) | ||||||
Income (loss) before income taxes |
42,130 | (2,553 | ) | (37,069 | ) | |||||
Income tax expense |
5,105 | 4,272 | 2,680 | |||||||
Net income (loss) |
37,025 | (6,825 | ) | (39,749 | ) | |||||
Net (income) loss attributable to noncontrolling interest |
(156 | ) | (530 | ) | 896 | |||||
Accretion of preferred stock |
— | (4,934 | ) | (12,372 | ) | |||||
Net income (loss) attributable to RealD Inc. common stockholders |
$ | 36,869 | $ | (12,289 | ) | $ | (51,225 | ) | ||
Earnings (loss) per common share: |
||||||||||
Basic |
$ | 0.68 | $ | (0.29 | ) | $ | (2.09 | ) | ||
Diluted |
$ | 0.65 | $ | (0.29 | ) | $ | (2.09 | ) | ||
Shares used in computing earnings per common share: |
||||||||||
Basic |
54,352 | 41,933 | 24,500 | |||||||
Diluted |
56,852 | 41,933 | 24,500 | |||||||
See accompanying notes to consolidated financial statements
76
Consolidated statements of changes in mandatorily redeemable convertible preferred stock and equity (deficit)
(in thousands, except share data)
| |
Mandatorily redeemable convertible preferred stock |
Equity (deficit) | |||||||||||||||||||||||||||||||||||||||||
|---|---|---|---|---|---|---|---|---|---|---|---|---|---|---|---|---|---|---|---|---|---|---|---|---|---|---|---|---|---|---|---|---|---|---|---|---|---|---|---|---|---|---|---|
| |
Convertible preferred stock | |
|
|
|
|
|
||||||||||||||||||||||||||||||||||||
| |
Series C | Series A | Series B | Series D | Common stock | Accumulated other comprehensive loss |
|
|
|
||||||||||||||||||||||||||||||||||
| |
Accumulated deficit |
Noncontrolling interest |
Total equity (deficit) |
||||||||||||||||||||||||||||||||||||||||
| |
Shares | Amount | Shares | Amount | Shares | Amount | Shares | Amount | Shares | Amount | |||||||||||||||||||||||||||||||||
Balance, March 27, 2009 |
5,139,500 | $ | 50,459 | 2,000,000 | $ | 1,978 | 2,417,644 | $ | 2,970 | 1,666,667 | $ | 19,952 | 24,172,373 | $ | 26,191 | $ | — | $ | (86,066 | ) | $ | 3,030 | $ | (31,945 | ) | ||||||||||||||||||
Issuance of common stock |
— | — | — | — | — | — | — | — | — | — | — | — | — | — | |||||||||||||||||||||||||||||
Accretion of Series C preferred stock |
— | 12,372 | — | — | — | — | — | — | — | — | — | (12,372 | ) | — | (12,372 | ) | |||||||||||||||||||||||||||
Share-based compensation |
— | — | — | — | — | — | — | — | — | 2,909 | — | — | — | 2,909 | |||||||||||||||||||||||||||||
Motion picture exhibitor option reduction in revenue |
— | — | — | — | — | — | — | — | — | 39,234 | — | — | — | 39,234 | |||||||||||||||||||||||||||||
Exercise of stock options |
— | — | — | — | — | — | — | — | 518,581 | 37 | — | — | — | 37 | |||||||||||||||||||||||||||||
Comprehensive income (loss): |
|||||||||||||||||||||||||||||||||||||||||||
Cumulative translation adjustment |
— | — | — | — | — | — | — | — | — | — | — | — | — | — | |||||||||||||||||||||||||||||
Net loss |
— | — | — | — | — | — | — | — | — | — | — | (38,853 | ) | (896 | ) | (39,749 | ) | ||||||||||||||||||||||||||
Total comprehensive loss |
(39,749 | ) | |||||||||||||||||||||||||||||||||||||||||
Balance, March 26, 2010 |
5,139,500 | $ | 62,831 | 2,000,000 | $ | 1,978 | 2,417,644 | $ | 2,970 | 1,666,667 | $ | 19,952 | 24,690,954 | $ | 68,371 | $ | — | $ | (137,291 | ) | $ | 2,134 | $ | (41,886 | ) | ||||||||||||||||||
Accretion of Series C preferred stock |
— | 4,934 | — | — | — | — | — | — | — | — | — | (4,934 | ) | — | (4,934 | ) | |||||||||||||||||||||||||||
Share-based compensation |
— | — | — | — | — | — | — | — | — | 8,950 | — | — | — | 8,950 | |||||||||||||||||||||||||||||
Exercise of stock options |
— | — | — | — | — | — | — | — | 2,019,816 | 3,875 | — | — | — | 3,875 | |||||||||||||||||||||||||||||
Exercise of motion picture exhibitor options |
— | — | — | — | — | — | — | — | 3,260,747 | 22 | — | — | — | 22 | |||||||||||||||||||||||||||||
Exercise of warrants |
— | — | — | — | — | — | — | — | 762,300 | 634 | — | — | — | 634 | |||||||||||||||||||||||||||||
Motion picture exhibitor option reduction in revenue |
— | — | — | — | — | — | — | — | — | 36,447 | — | — | — | 36,447 | |||||||||||||||||||||||||||||
Noncontrolling interest distribution |
— | — | — | — | — | — | — | — | — | — | — | — | (888 | ) | (888 | ) | |||||||||||||||||||||||||||
Conversion of preferred stock |
(5,139,500 | ) | (67,765 | ) | (2,000,000 | ) | (1,978 | ) | (2,417,644 | ) | (2,970 | ) | (1,666,667 | ) | (19,952 | ) | 16,835,714 | 92,665 | — | — | — | 67,765 | |||||||||||||||||||||
Issuance of common stock in connection with initial public offering, net of issuance costs |
— | — | — | — | — | — | — | — | 6,000,000 | 81,940 | — | — | — | 81,940 | |||||||||||||||||||||||||||||
Comprehensive income (loss): |
|||||||||||||||||||||||||||||||||||||||||||
Net income (loss) |
— | — | — | — | — | — | — | — | — | — | — | (7,355 | ) | 530 | (6,825 | ) | |||||||||||||||||||||||||||
Total comprehensive loss |
(6,825 | ) | |||||||||||||||||||||||||||||||||||||||||
Balance, March 25, 2011 |
— | $ | — | — | $ | — | — | $ | — | — | $ | — | 53,569,531 | $ | 292,904 | $ | — | $ | (149,580 | ) | $ | 1,776 | $ | 145,100 | |||||||||||||||||||
Share-based compensation |
— | — | — | — | — | — | — | — | — | 15,744 | — | — | — | 15,744 | |||||||||||||||||||||||||||||
Exercise of stock options |
— | — | — | — | — | — | — | — | 257,354 | 972 | — | — | — | 972 | |||||||||||||||||||||||||||||
Exercise of motion picture exhibitor options |
— | — | — | — | — | — | — | — | 407,593 | 3 | — | — | — | 3 | |||||||||||||||||||||||||||||
Exercise of warrants |
— | — | — | — | — | — | — | — | 326,700 | 271 | — | — | — | 271 | |||||||||||||||||||||||||||||
Noncontrolling interest distribution |
— | — | — | — | — | — | — | — | — | — | — | — | (1,509 | ) | (1,509 | ) | |||||||||||||||||||||||||||
Comprehensive income (loss): |
|||||||||||||||||||||||||||||||||||||||||||
Net income |
— | — | — | — | — | — | — | — | — | — | — | 36,869 | 156 | 37,025 | |||||||||||||||||||||||||||||
Total comprehensive income |
— | — | — | — | — | — | — | — | — | — | — | — | — | 37,025 | |||||||||||||||||||||||||||||
Balance, March 23, 2012 |
— | $ | — | — | $ | — | — | $ | — | — | $ | — | 54,561,178 | $ | 309,894 | $ | — | $ | (112,711 | ) | $ | 423 | $ | 197,606 | |||||||||||||||||||
See accompanying notes to consolidated financial statements
77
RealD Inc.
Consolidated statements of cash flows
(in thousands)
| |
Year ended | |||||||||
|---|---|---|---|---|---|---|---|---|---|---|
| |
March 23, 2012 |
March 25, 2011 |
March 26, 2010 |
|||||||
Cash flows from operating activities |
||||||||||
Net income (loss) |
$ | 37,025 | $ | (6,825 | ) | $ | (39,749 | ) | ||
Adjustments to reconcile net income (loss) to net cash provided by operating activities: |
||||||||||
Depreciation and amortization |
28,266 | 15,737 | 7,952 | |||||||
Deferred income tax |
38 | (2 | ) | 1,387 | ||||||
Non-cash interest expense |
151 | 125 | 1,245 | |||||||
Non-cash stock compensation |
15,744 | 8,950 | 2,909 | |||||||
Motion picture exhibitor option reduction in revenue |
— | 36,447 | 39,234 | |||||||
Gain on sale of digital projectors |
(1,742 | ) | (6,720 | ) | (173 | ) | ||||
Loss on sale of digital projectors |
452 | — | — | |||||||
Impairment of long-lived assets |
10,269 | 1,128 | 426 | |||||||
Changes in operating assets and liabilities: |
||||||||||
Accounts receivable |
(6,062 | ) | 508 | (40,082 | ) | |||||
Inventories |
14,394 | (48,432 | ) | (4,025 | ) | |||||
Prepaid expenses and other current assets |
(896 | ) | (606 | ) | (671 | ) | ||||
Deferred costs—eyewear |
(883 | ) | 1,793 | 6,944 | ||||||
Other assets |
(1,528 | ) | 1,139 | (2,482 | ) | |||||
Accounts payable |
(36,916 | ) | 21,330 | 24,943 | ||||||
Accrued expenses and other liabilities |
(11,399 | ) | 15,420 | 16,951 | ||||||
Virtual print fee liability and customer deposits |
1,989 | 1,791 | 2,306 | |||||||
Income taxes receivable/payable |
1,260 | (1,393 | ) | 1,236 | ||||||
Deferred revenue |
(7,161 | ) | (5,292 | ) | (3,216 | ) | ||||
Net cash provided by operating activities |
43,001 | 35,098 | 15,135 | |||||||
Cash flows from investing activities |
||||||||||
Purchases of marketable securities |
— | (6,849 | ) | — | ||||||
Proceeds from sale of marketable securities |
— | 6,849 | — | |||||||
Purchases of property and equipment |
(8,760 | ) | (6,416 | ) | (2,037 | ) | ||||
Purchases of cinema systems and related components |
(52,708 | ) | (95,756 | ) | (27,462 | ) | ||||
Purchases of digital projectors |
— | (471 | ) | (662 | ) | |||||
Proceeds from sale of digital projectors |
3,999 | 15,612 | 525 | |||||||
Net cash used in investing activities |
(57,469 | ) | (87,031 | ) | (29,636 | ) | ||||
Cash flows from financing activities |
||||||||||
Proceeds from common stock issuance, net of issuance costs |
— | 81,940 | — | |||||||
Noncontrolling interest distribution |
(1,509 | ) | (888 | ) | — | |||||
Proceeds from credit facility agreement—term loan |
— | — | 10,000 | |||||||
Repayments on credit facility agreement—term loan |
— | (10,000 | ) | — | ||||||
Repayments of long-term debt |
(2,311 | ) | (9,698 | ) | (3,106 | ) | ||||
Proceeds from credit facility agreement—revolving credit facility |
30,000 | 5,000 | 5,000 | |||||||
Repayments on credit facility agreement—revolving credit facility |
(5,000 | ) | (15,150 | ) | — | |||||
Proceeds from exercise of stock options |
972 | 3,875 | 37 | |||||||
Proceeds from exercise of warrants |
271 | 634 | — | |||||||
Proceeds from exercise of motion picture exhibitor options |
3 | 22 | — | |||||||
Net cash provided by financing activities |
22,426 | 55,735 | 11,931 | |||||||
Net increase (decrease) in cash and cash equivalents |
7,958 | 3,802 | (2,570 | ) | ||||||
Cash and cash equivalents, beginning of year |
16,936 | 13,134 | 15,704 | |||||||
Cash and cash equivalents, end of year |
$ | 24,894 | $ | 16,936 | $ | 13,134 | ||||
Supplemental disclosures of cash flow information |
||||||||||
Accretion of Series C preferred stock |
$ | — | $ | 4,934 | $ | 12,372 | ||||
Cash payments for income taxes |
1,060 | 3,952 | 57 | |||||||
Cash payments for interest expense |
820 | 794 | 485 | |||||||
Digital projectors purchased in exchange for notes |
— | 370 | 4,005 | |||||||
Sale of digital projectors in accounts receivable |
$ | 2,474 | $ | — | $ | — | ||||
See accompanying notes to consolidated financial statements
78
RealD Inc.
Notes to consolidated financial statements
1. Business and basis of presentation
RealD Inc., including its subsidiaries (RealD), is a global licensor of stereoscopic 3D technologies.
The accompanying consolidated financial statements have been prepared in accordance with accounting principles generally accepted in the United States (U.S. GAAP). The consolidated financial statements include the accounts of RealD, its wholly owned subsidiaries and its majority owned subsidiaries. We do not have any interests in variable interest entities. For consolidated subsidiaries that are not wholly owned but are majority owned, the subsidiaries' assets, liabilities, and operating results are included in their entirety in the accompanying consolidated financial statements. The noncontrolling interests in those assets, liabilities, and operations are reflected as non controlling interests in the consolidated balance sheets under equity (deficit) and consolidated statements of operations.
On March 6, 2007, Digital Link II, LLC (Digital Link II) was formed between Ballantyne of Omaha, Inc. and RealD with member interests of 44.4% and 55.6%, respectively. Digital Link II was formed to fund the deployment of digital projector systems and servers to third-party exhibitors.
On June 28, 2010, we amended our certificate of incorporation, which increased our total authorized capital stock to 200 million shares (comprised of 150 million shares of common stock and 50 million shares of preferred stock), and effected a split of our common stock, which resulted in each share of our common stock splitting into one and one-half shares (or a 1-for-1.5 forward split). The accompanying consolidated financial statements and notes to the consolidated financial statements have been retroactively restated to reflect the stock split for all periods presented.
On July 21, 2010, we completed the initial public offering (IPO) of our common stock in which we sold and issued 6 million shares of common stock at an issue price of $16.00 per share. A total of approximately $96 million in gross proceeds were raised from the IPO, or $81.9 million in net proceeds after deducting underwriting discounts and commissions of approximately $6.7 million and other offering costs of approximately $7.4 million.
All significant intercompany balances and transactions have been eliminated in consolidation.
2. Summary of significant accounting policies
Accounting period
Our fiscal year consists of four 13-week periods for a total of 52 weeks. The fiscal year for 2012 ended on March 23, 2012. The fiscal year for 2011 ended on March 25, 2011. The fiscal year for 2010 ended on March 26, 2010.
Use of estimates
The preparation of financial statements in conformity with U.S. GAAP requires management to make estimates and assumptions that affect the reported amounts of assets and liabilities and disclosures of contingent assets and liabilities at the date of the financial statements and the reported amounts of revenue and expense during the reporting period. Actual results could differ from those estimates.
Net income (loss) per share of common stock
Basic income (loss) per share of common stock is computed by dividing the net income (loss) attributable to RealD common stockholders for the period by the weighted average number of shares
79
RealD Inc.
Notes to consolidated financial statements (Continued)
2. Summary of significant accounting policies (Continued)
of common stock outstanding during the period. Because the holders of our convertible preferred stock were entitled to participate in dividends and earnings of our company, we applied the two-class method in calculating our earnings (loss) per share for periods when we generated net income prior to the conversion of the preferred shares into common shares on July 21, 2010. The two-class method requires net income to be allocated between the common and preferred stockholders based on their respective rights to receive dividends, whether or not declared. No such dividends were paid. Because the convertible preferred stock was not contractually obligated to share in our losses, no such allocation was made for periods when we had net losses. Due to the conversion of the preferred shares into common shares on July 21, 2010, the two-class method of calculating earnings (loss) per share was not applied subsequent to that date.
The calculation of the basic and diluted loss per share of common stock for the years ended March 23, 2012, March 25, 2011 and March 26, 2010 was as follows:
| |
Year ended | |||||||||
|---|---|---|---|---|---|---|---|---|---|---|
(in thousands, except per share data)
|
March 23, 2012 |
March 25, 2011 |
March 26, 2010 |
|||||||
Numerator: |
||||||||||
Net income (loss) |
$ | 37,025 | $ | (6,825 | ) | $ | (39,749 | ) | ||
Net (income) loss attributable to noncontrolling interest |
(156 | ) | (530 | ) | 896 | |||||
Accretion of preferred stock |
— | (4,934 | ) | (12,372 | ) | |||||
Net income (loss) attributable to RealD Inc. common stockholders |
$ | 36,869 | $ | (12,289 | ) | $ | (51,225 | ) | ||
Denominator: |
||||||||||
Weighted-average common shares outstanding (basic) |
54,352 | 41,933 | 24,500 | |||||||
Effect of dilutive securities |
2,500 | — | — | |||||||
Weighted-average common shares outstanding (diluted) |
56,852 | 41,933 | 24,500 | |||||||
Earnings (loss) per common share: |
||||||||||
Basic |
$ | 0.68 | $ | (0.29 | ) | $ | (2.09 | ) | ||
Diluted |
$ | 0.65 | $ | (0.29 | ) | $ | (2.09 | ) | ||
Due to the loss attributable to RealD Inc. common stockholders in the years ended March 25, 2011 and March 26, 2010, basic earnings (loss) per common share and diluted earnings (loss) per common share are the same as the effect of potentially dilutive securities would be anti-dilutive.
The following table shows the weighted-average number of anti-dilutive shares excluded from the calculation of diluted loss per common share for each period presented:
| |
Year ended | |||||||||
|---|---|---|---|---|---|---|---|---|---|---|
(in thousands)
|
March 23, 2012 |
March 25, 2011 |
March 26, 2010 |
|||||||
Options and warrants to purchase common stock |
3,899 | 9,782 | 6,603 | |||||||
Conversion of convertible preferred stock |
— | 5,180 | 16,836 | |||||||
Total |
3,899 | 14,962 | 23,439 | |||||||
80
RealD Inc.
Notes to consolidated financial statements (Continued)
2. Summary of significant accounting policies (Continued)
Fair value measurements
Accounting Standards Codification Topic (ASC) 820-10, Fair Value Accounting (ASC 820), provides a common definition of fair value and establishes a framework to make the measurement of fair value in U.S. GAAP more consistent and comparable. This guidance also requires expanded disclosures to provide information about the extent to which fair value is used to measure assets and liabilities, the methods and assumptions used to measure fair value, and the effect of fair value measures on earnings. Fair value is defined as the amount that would be received for selling an asset or paid to transfer a liability in an orderly transaction between market participants and requires that assets and liabilities carried at fair value be classified and disclosed in the following three categories:
- •
- Level 1—Quoted prices for identical instruments in active markets.
- •
- Level 2—Quoted prices for similar instruments in active markets; quoted prices for identical or similar
instruments in markets that are not active; and model-derived valuations in which all significant inputs and significant value drivers are observable in active markets.
- •
- Level 3—Valuations derived from valuation techniques in which one or more significant inputs or significant value drivers are unobservable.
Our financial assets and liabilities, which include financial instruments as defined by ASC 820, include cash and cash equivalents, accounts receivable, accounts payable, long-term debt and derivatives. The carrying amounts of cash and cash equivalents, accounts receivable and accounts payable are a reasonable approximation of fair value due to the short maturities of these instruments. The carrying amount of long-term debt approximates fair value based on borrowing rates currently available to us. The carrying amount of our derivative instruments is recorded at fair value and is determined based on observable inputs that are corroborated by market data (Level 2).
As of March 23, 2012 and March 25, 2011, the fair values of our derivative instruments that were carried at fair value on a recurring basis were not significant.
Derivative instruments
Our derivative instruments are recorded at fair value in other current assets or other current liabilities, respectively, in the consolidated balance sheets. Changes in fair value are reported as a component of other income or loss on our consolidated statements of operations. For all periods presented, none of our derivative instruments were designated as hedging instruments. We do not use foreign currency option or foreign exchange forward contracts for speculative or trading purposes.
We purchase foreign currency forward contracts, generally with maturities of six months or less, to reduce the volatility of cash flows primarily related to forecasted payments and expenses denominated in certain foreign currencies. We had outstanding forward contracts based in British pound sterling and Euro with notional amounts totaling $4.3 million as of March 23, 2012. We had outstanding forward contracts based in British pound sterling, Euro and Canadian dollar with notional amounts totaling $8.1 million as of March 25, 2011. As of March 23, 2012 and March 25, 2011, the carrying amount of our foreign currency forward contracts was not significant and was classified as Level 2 fair value instruments, which was determined based on observable inputs that were corroborated by market data. For all periods presented, the net realized and unrealized gains and losses related to forward contracts were not significant.
81
RealD Inc.
Notes to consolidated financial statements (Continued)
2. Summary of significant accounting policies (Continued)
Marketable securities
We classify unrealized gains and losses on marketable securities reported as a component of accumulated other comprehensive income. As of March 23, 2012 and March 25, 2011, we had no marketable securities. For the year ended March 25, 2011, the unrealized gains and losses from the available-for-sale securities were not significant.
The objectives of our investment policy are to preserve capital, provide sufficient liquidity to satisfy operating and investment purposes, and capture a market rate of return based on our investment policy parameters and market conditions. Our investment policy limits investments to certain types of debt and money market instruments issued by institutions with investment grade credit ratings and places restrictions on maturities and concentration by type and issuer.
Cash equivalents
We consider cash equivalents to be only those investments that are highly liquid, readily convertible into cash and which mature within three months from the date of purchase.
Accounts receivable
Accounts receivable consist of trade receivables, VAT receivable and other receivables. We extend credit to our customers, who are primarily in the movie production and exhibition businesses. We provide for the estimated accounts receivable that will not be collected. These estimates are based on an analysis of historical bad debts, customer concentrations, customer creditworthiness, current economic trends and changes in the customers' payment terms and their economic condition. Collection of accounts receivable may be affected by changes in economic or other industry conditions and may, accordingly, impact our overall credit risk. The allowance for doubtful accounts and customer credits totaled $4.2 million and $6.8 million as of March 23, 2012 and March 25, 2011, respectively.
Inventories and deferred costs-eyewear
Inventories and deferred costs-eyewear represent eyewear and are substantially all finished goods. Inventories and deferred costs-eyewear are valued at the lower of cost (first-in, first-out method) or market value. At each balance sheet date, we evaluate ending inventories and deferred costs-eyewear for net realizable value. We also evaluate inventories for excess quantities and obsolescence. These evaluations include analyses of expected future average selling prices, projections of future demand and technology changes. In order to state inventories at lower of cost or market, we maintain reserves against such inventories. If our analyses indicate that market is lower than cost, a write-down of inventories is recorded in cost of revenue in the period the loss is identified. As of March 23, 2012 and March 25, 2011, the inventory reserve as a result of our net realizable value analyses was $0.6 million and $3.2 million, respectively.
Domestically, we provide our RealD eyewear free of charge to motion picture exhibitors and then receive a fee from the motion picture studios for the usage of that RealD eyewear by the motion picture exhibitors' consumers.
For RealD eyewear located at a motion picture exhibitor, we believe that it is not operationally practical to perform physical counts or request the motion picture exhibitor to perform physical counts and confirm quantities held to ensure that losses due to damage, destruction, and shrinkage are
82
RealD Inc.
Notes to consolidated financial statements (Continued)
2. Summary of significant accounting policies (Continued)
specifically recognized in the period incurred due to the number of domestic RealD-enabled screens and the related usage of RealD eyewear. We believe that the cost to monitor shrinkage or usage significantly outweighs the financial reporting benefits of using a specific identification methodology of expensing. We believe that utilizing a composite method of expensing RealD eyewear inventory costs provides a rational and reasonable approach to ensuring that shrinkage is provided for in the period incurred and that inventory costs are expensed in the periods that reasonably reflect the periods in which the related revenue is recognized. In doing so, we believe the following methodology reasonably and generally reflects periodic income or loss under these facts and circumstances:
- •
- For an estimated period of time following shipment to domestic motion picture exhibitors, no expense is recognized between
the time of shipment and until the delivery is made as the inventory unit is in transit and unused.
- •
- The inventory unit cost is expensed on a straight-line basis over an estimated usage period beginning when we believe usage of the inventory unit has started. In estimating the expensing start date and related expense period, we consider various factors including, but not limited to, those relating to a 3D motion picture's opening release date, a 3D motion picture's expected release period, the number of currently playing 3D motion pictures, the motion picture exhibitor's buying and stocking patterns and practices and the quantities shipped per inventory unit.
We believe that the expensing methodology described above rationally and reasonably approximates the period the related usage occurs resulting in our RealD eyewear product revenue. The expensing start date following the date of shipment is meant to approximate the date at which usage begins. Additionally, as the expense recognition period has been and is expected to continue to be short, we believe it adequately recognizes inventory impairments due to loss and damage on a timely basis. We further believe that exposures due to loss or damage, if any, are considered normal shrinkage and a necessary and expected cost to generate the revenue per 3D motion picture earned through RealD eyewear usage. We continue to monitor the reasonableness of this methodology to ensure that it approximates the period over which the related RealD eyewear product revenue is earned and realizable. RealD eyewear inventory costs that have not yet been expensed are reported as deferred costs-eyewear.
Deferred offering costs
There was $7.4 million of deferred offering costs incurred through July 21, 2010, which were offset against the proceeds of our IPO.
83
RealD Inc.
Notes to consolidated financial statements (Continued)
2. Summary of significant accounting policies (Continued)
Property and equipment, RealD Cinema Systems and digital projectors
Property and equipment, RealD Cinema Systems and digital projectors are stated at cost. Depreciation is computed using the straight-line method over the estimated useful lives of the related assets. The major categories and related estimated useful lives are as follows:
RealD Cinema Systems |
5 - 8 years | |
Digital projectors—held for sale |
10 years | |
Leasehold improvements |
Shorter of useful life or lease | |
Machinery and equipment |
2 - 7 years | |
Furniture and fixtures |
3 - 5 years | |
Computer equipment and software |
3 - 5 years |
Digital projectors—held for sale (digital projectors) also include digital servers, lenses and accessories. Upon installation at the customer location, we retain title to the RealD Cinema Systems which are held and used by our customers. The digital projectors are held for sale at either a specified date or upon occurrence of certain contingent events. Depreciation for RealD Cinema Systems and digital projectors is included in cost of revenue.
We receive virtual print fees (VPFs) from third-party motion picture studios. VPFs represent amounts from third-party motion picture studios that are paid to us when a motion picture is played on one of our digital projectors. VPFs are deferred and deducted from the selling price of the digital projector. VPFs are recorded as a liability on the accompanying consolidated balance sheets and totaled $0.3 million and $1.5 million as of March 23, 2012 and March 25, 2011, respectively.
Major enhancements and improvements are capitalized. Maintenance and repairs for cinema systems and digital projectors are charged to expense as incurred. Maintenance and repairs expense totaled $0.7 million, $0.8 million and $0.8 million for the years ended March 23, 2012, March 25, 2011 and March 26, 2010, respectively.
Intangibles
Intangibles are deemed to have finite lives and consist of acquired developed technologies (which are primarily patents) and are amortized over their estimated useful lives of 11 to 19 years (with a weighted average amortization period of 16.7 years) using the straight-line method.
Impairment of long-lived assets
We review long-lived assets, such as property and equipment, cinema systems, digital projectors and intangibles, for impairment whenever events or changes in circumstances indicate that the carrying amount of an asset may not be recoverable. Factors or circumstances that could indicate the occurrence of such events include current period operating or cash flow losses combined with a history of operating or cash flow losses, a projection or forecast that demonstrates continuing operating or cash flow losses, or incurring costs in excess of amounts originally expected to acquire or construct an asset. If the asset is not recoverable, an impairment loss is recognized as the amount by which the carrying amount of the asset exceeds its fair value.
During the three months ended September 23, 2011, we determined that certain of our cinema systems were not recoverable and that the carrying value of the assets exceeded fair value, primarily
84
RealD Inc.
Notes to consolidated financial statements (Continued)
2. Summary of significant accounting policies (Continued)
due to the number of certain of our cinema system assets on hand, including related outstanding purchase commitments and the continuing shift in the mix in the deployment of cinema systems based on the type of digital projectors installed and theater configuration. The fair value was primarily determined by evaluating the discounted future cash flows expected to be generated from the cinema systems. The impairment charged during the three months ended September 23, 2011 to cost of revenue for certain of the cinema systems totaled $6.8 million.
For the years ended March 23, 2012, March 25, 2011 and March 26, 2010, impairment charges for all impaired RealD Cinema Systems charged to cost of revenue totaled $10.3 million, $1.1 million and $0.4 million, respectively.
Goodwill
Goodwill is deemed to have an indefinite useful life and therefore is not amortized. We perform an impairment test annually and whenever events or changes in circumstances indicate that the carrying amount of goodwill may not be recoverable. An impairment loss is recognized if the carrying amount of goodwill at each reporting unit exceeds its implied fair value. For all periods presented, we reviewed goodwill for impairment and concluded that goodwill was not impaired.
Revenue recognition and revenue reductions
We derive substantially all of our revenue from the license of our RealD Cinema Systems and the product sale of our RealD eyewear. We evaluate revenue recognition for transactions using the criteria set forth by the SEC in Staff Accounting Bulletin No. 104, Revenue Recognition(SAB 104) and Accounting Standards Codification Topic 605, Revenue Recognition (ASC 605). The revenue recognition guidance states that revenue is recognized when all of the following criteria are met: persuasive evidence of an arrangement exists, delivery has occurred or services have been rendered, the seller's price to the buyer is fixed or determinable and collectibility is reasonable assured.
License revenue
License revenue is accounted for as an operating lease. License revenue is primarily derived under per-admission, periodic fixed fee, or per-motion picture basis with motion picture exhibitors. Amounts received up front, less estimated allowances, are deferred and recognized over the lease term using the straight-line method. Additional lease payments that are contingent upon future events outside our control, including those related to admission and usage, are recognized as revenues when the contingency is resolved and we have no more obligations to our customers specific to the contingent payment received. Certain of our license revenue from leasing our RealD Cinema Systems is earned upon admission by the motion picture exhibitor's consumers. Our licensees, however, do not report and pay for such license revenue until after the admission has occurred, which may be received subsequent to our fiscal period end. We estimate and record licensing revenue related to motion picture exhibitor consumer admissions in the quarter in which the admission occurs, but only when reasonable estimates of such amounts can be made. We determine that there is persuasive evidence of an arrangement upon the execution of a license agreement or upon the receipt of a licensee's admissions report. Revenue is deemed fixed or determinable upon receipt of a licensee's admissions report. We determine collectibility based on an evaluation of the licensee's recent payment history.
85
RealD Inc.
Notes to consolidated financial statements (Continued)
2. Summary of significant accounting policies (Continued)
Product revenue
We recognize product revenue, net of allowances, when title and risk of loss have passed and when there is persuasive evidence of an arrangement, the payment is fixed or determinable, and collectability of payment is reasonably assured. In the United States and Canada, certain of our product revenue from the sale of our RealD eyewear is earned upon admission and usage by the motion picture exhibitor's consumers. Our customers, however, do not report admission or usage information until after the admission and usage has occurred, and such information may be received subsequent to our fiscal period end. We estimate and record such product revenue in the period in which the admission and usage occurs, but only when reasonable estimates of such amounts can be made.
Revenue reductions
We record revenue net of motion picture exhibitor stock options and estimated revenue allowances. In connection with certain exhibitor licensing agreements, we issued to the motion picture exhibitors a 10-year option to purchase 3,668,340 shares of our common stock at $0.00667 per share. The stock options vest upon the achievement of screen installation targets. Motion picture exhibitor stock options are valued at the underlying stock price at each reporting period until the targets are met. Amounts recognized are based on the number of RealD-enabled screens as a percentage of total screen installation targets. The stock options do not have net cash settlement features. Amounts recorded as a revenue reduction related to motion picture exhibitor stock options totaled $36.4 million for the year ended March 25, 2011 and $39.2 million for the year ended March 26, 2010. As of March 25, 2011 all 3,668,340 motion picture exhibitor stock options had vested and all associated reduction of revenue has been recognized.
Cost of revenue
Cost of revenue principally consists of depreciation expense of our RealD Cinema Systems deployed at a motion picture exhibitor's premises, digital projector depreciation expenses, RealD eyewear costs (including shipping, handling and recycling costs), field service and support costs and occupancy costs.
Shipping and handling costs
Amounts billed to customers for shipping and handling costs are included in revenue. Shipping and handling costs that we incur consist primarily of packaging and transportation charges and are recorded in cost of revenue. Shipping and handling costs recognized in cost of revenue were $6.8 million, $10.2 million and $9.6 million for the years ended March 23, 2012, March 25, 2011 and March 26, 2010, respectively.
Research and development costs
Research and development costs are expensed as incurred and are primarily comprised of personnel costs related to our research and development staff, depreciation and amortization of research and development assets, prototype and materials costs, the cost of third-party service providers supporting our research and development efforts and occupancy costs.
86
RealD Inc.
Notes to consolidated financial statements (Continued)
2. Summary of significant accounting policies (Continued)
Selling and marketing costs
Selling and marketing costs are primarily comprised of personnel costs related to our selling and marketing staff, advertising costs, including promotional events and other brand building and product marketing expenses, corporate communications, certain professional fees, occupancy costs and travel expenses.
Advertising costs are expensed as incurred. Advertising expenses were approximately $5.3 million, $4.3 million and $2.6 million for the years ended March 23, 2012, March 25, 2011 and March 26, 2010, respectively.
General and administrative costs
General and administrative costs principally consist of personnel costs related to our executive, legal, finance, and human resources staff, professional fees including legal and accounting costs, occupancy costs and public company costs. Additionally, general and administrative costs include sales, use, goods and services tax, and property taxes and management fees payable to a stockholder, which terminated upon consummation of our IPO. For our U.S. cinema license and product revenue, we absorb the majority of sales and use taxes and do not pass such costs on to our customers.
Share-based compensation
We account for stock options, performance stock options and restricted stock units granted to employees and directors by recording compensation expense based on estimated fair values. We estimate the fair value of share-based payment awards on the date of grant. The value of the portion of the award that is ultimately expected to vest is recognized as expense over the requisite service periods in our consolidated statements of operations. Share-based awards are attributed to expense using the straight-line method over the vesting period. We determine the value of each option award that contains a market condition using a lattice-based option valuation model, while all other option awards are valued using the Black-Scholes valuation model as permitted under Accounting Standards Codification Topic 718, Compensation—Stock Compensation (ASC 718). The assumptions used in calculating the fair value of share-based payment awards represent our best estimates based on management judgment and subjective future expectations. Our estimates of the fair values of stock options granted and the resulting amounts of share-based compensation recognized may be impacted by certain variables including stock price volatility, employee stock option exercise behaviors, additional stock option grants, modifications, estimates of forfeitures and the related income tax impact. If any of the assumptions used in our valuation models significantly change, share-based compensation for future awards may differ materially from the awards granted previously. See Note 9, Share-based compensation.
Foreign currency
Local currency transactions of our foreign operations that have the U.S. dollar as their functional currency are remeasured into U.S. dollars using current rates of exchange for monetary assets and liabilities and historical rates of exchange for nonmonetary assets and liabilities. Gains and losses from remeasurement of monetary assets and liabilities are included in other income (loss) in our statements of operations.
87
RealD Inc.
Notes to consolidated financial statements (Continued)
2. Summary of significant accounting policies (Continued)
The assets and liabilities of our foreign operations for which the functional currency is not the U.S. dollar are translated into U.S. dollars at exchange rates as of the balance sheet date, revenues and expenses are translated at average exchange rates for the period, and equity balances are translated at the historical rate. Resulting translation adjustments are included in other comprehensive loss, a component of equity (deficit).
Net losses arising from exchange rate fluctuations on transactions denominated in a currency other than the functional currency and the net realized and unrealized gains and losses related to forward contracts totaled $0.5 million, $0.6 million and $1.3 million for the years ended March 23, 2012, March 25, 2011 and March 26, 2010, respectively, and are included in other income (loss).
Income taxes
Deferred income tax assets and liabilities are recognized for the future tax consequences attributable to differences between the financial statement carrying amounts of existing assets and liabilities at year-end and their respective tax bases using enacted tax rates in effect for the year in which the differences are expected to affect taxable income. Valuation allowances are established when necessary to reduce deferred tax assets to the amount more likely than not to be realized.
Employee benefit plans
We have a voluntary 401(k) savings plans in which most U.S. employees are eligible to participate. Eligible employees may make contributions not to exceed the maximum statutory contribution amounts. We may match a percentage of each employee's contributions consistent with the provisions of the plan for which they are eligible. All employee and employer contributions fully vest immediately. Our contributions to these plans totaled $0.5 million, $0.3 million and $0.2 million for the years ended March 23, 2012, March 25, 2011 and March 26, 2010, respectively.
Recent accounting pronouncements
In May 2011, the FASB issued Accounting Standards Update ("ASU") No. 2011-04, Amendments to Achieve Common Fair Value Measurement and Disclosure Requirements in U.S. GAAP and International Financial Reporting Standards (Topic 820)—Fair Value Measurement, to provide a consistent definition of fair value and ensure that the fair value measurement and disclosure requirements are similar between U.S. GAAP and International Financial Reporting Standards. ASU No. 2011-04 changes certain fair value measurement principles and enhances the disclosure requirements, particularly for level 3 fair value measurements. ASU No. 2011-04 is effective for interim and annual reporting periods beginning after December 15, 2011 and must be applied prospectively. It is not expected that the adoption of this ASU will have a material impact on our financial statements.
In June 2011, the FASB issued ASU 2011-05, Comprehensive Income (Topic 220): Presentation of Comprehensive Income. ASU 2011-05 requires one of two alternatives for presenting comprehensive income and eliminates the option to report other comprehensive income and its components as a part of the consolidated statements of equity. Additionally, ASU 2011-05 requires presentation on the face of the financial statements reclassification adjustments for items that are reclassified from other comprehensive income to net income in the statement(s) where the components of net income and the components of other comprehensive income are presented. The requirement related to the reclassification adjustments from other comprehensive income to net income was deferred in December
88
RealD Inc.
Notes to consolidated financial statements (Continued)
2. Summary of significant accounting policies (Continued)
2011, as a result of the issuance of ASU 2011-12, Deferral of the Effective Date for Amendments to the Presentation of Reclassifications of Items Out of Accumulated Other Comprehensive Income in Accounting Standards Update 2011-05 (Topic 220). The amendments in ASU 2011-05, as amended by ASU 2011-12, do not change the items that must be reported in other comprehensive income or when an item of other comprehensive income must be reclassified to net income. ASU 2011-05, as amended by ASU 2011-12 is effective for fiscal years and interim periods within those years beginning after December 15, 2011 and is to be applied retrospectively. We will adopt ASU 2011-05 during the first quarter of fiscal 2013. We do not expect the adoption of ASU 2011-05, as amended by ASU 2011-12 to have a material impact on our consolidated financial statements.
In September 2011, the FASB issued ASU 2011-08, Intangibles (Topic 350)—Goodwill and Other (ASU 2011-08) which allows companies to waive comparing the fair value of a reporting unit to its carrying amount in assessing the recoverability of goodwill if, based on qualitative factors, it is not more likely than not that the fair value of a reporting unit is less than its carrying amount. ASU 2011-08 will be effective for annual and interim goodwill impairment tests performed for fiscal years beginning after December 15, 2011. The adoption of this ASU did not have a material impact on our consolidated financial statements.
3. Property and equipment, RealD Cinema Systems and digital projectors
Property and equipment, RealD Cinema Systems and digital projectors consist of the following:
(in thousands)
|
March 23, 2012 |
March 25, 2011 |
|||||
|---|---|---|---|---|---|---|---|
RealD Cinema Systems |
$ | 184,197 | $ | 142,602 | |||
Digital projectors—held for sale |
1,843 | 13,333 | |||||
Leasehold improvements |
4,325 | 1,163 | |||||
Machinery and equipment |
6,641 | 6,430 | |||||
Furniture and fixtures |
12 | 15 | |||||
Computer equipment and software |
2,788 | 2,089 | |||||
Construction in process |
3,364 | 820 | |||||
Total |
$ | 203,170 | $ | 166,452 | |||
Less accumulated depreciation |
(48,355 | ) | (25,862 | ) | |||
Property and equipment, RealD Cinema Systems and digital projectors, net |
$ | 154,815 | $ | 140,590 | |||
Depreciation expense amounted to $28.1 million, $15.6 million and $7.7 million for the years ended March 23, 2012, March 25, 2011 and March 26, 2010, respectively.
During the year ended March 23, 2012, we received $4.0 million in cash and had $2.5 million of accounts receivable from motion picture exhibitor customers from the sale of digital projectors, resulting in a gain of $1.7 million in other income (loss).
During the year ended March 25, 2011, we received $15.6 million in cash from motion picture exhibitor customers for the sale of digital projectors, resulting in a gain of $6.7 million in other income (loss). With the proceeds, we repaid an aggregate of $5.6 million of notes payable to the equipment providers.
89
RealD Inc.
Notes to consolidated financial statements (Continued)
3. Property and equipment, RealD Cinema Systems and digital projectors (Continued)
During the three months ended September 23, 2011, we determined that certain of our cinema systems were not recoverable and that the carrying value of the assets exceeded fair value, primarily due to the number of certain of our cinema system assets on hand, including related outstanding purchase commitments and the continuing shift in the mix in the deployment of cinema systems based on the type of digital projectors installed and theater configuration. The fair value was primarily determined by evaluating the discounted future cash flows expected to be generated from the cinema systems. The impairment charged during the three months ended September 23, 2011 to cost of revenue for certain of the cinema systems totaled $6.8 million.
For the years ended March 23, 2012, March 25, 2011 and March 26, 2010, impairment charges for all impaired RealD Cinema Systems charged to cost of revenue totaled $10.3 million, $1.1 million and $0.4 million, respectively.
4. Goodwill and intangible assets
Goodwill and intangible assets consist of the following at:
| |
March 23, 2012 | March 25, 2011 | |||||||||||
|---|---|---|---|---|---|---|---|---|---|---|---|---|---|
(in thousands)
|
Gross amount |
Accumulated amortization |
Gross amount |
Accumulated amortization |
|||||||||
Acquired developed technologies |
$ | 3,239 | $ | 1,493 | $ | 3,239 | $ | 1,321 | |||||
Goodwill |
10,657 | — | 10,657 | — | |||||||||
Total |
$ | 13,896 | $ | 1,493 | $ | 13,896 | $ | 1,321 | |||||
Amortization expense amounted to $0.2 million, $0.1 million and $0.2 million for the years ended March 23, 2012, March 25, 2011 and March 26, 2010, respectively.
At March 23, 2012, the remaining amortization expense is estimated to be as follows (in thousands):
Fiscal year 2013 |
$ | 168 | ||
Fiscal year 2014 |
168 | |||
Fiscal year 2015 |
168 | |||
Fiscal year 2016 |
168 | |||
Fiscal year 2017 |
168 | |||
Thereafter |
906 | |||
Total |
$ | 1,746 | ||
90
RealD Inc.
Notes to consolidated financial statements (Continued)
5. Accrued expenses and other liabilities
Accrued expenses and other liabilities consist of the following at:
(in thousands)
|
March 23, 2012 |
March 25, 2011 |
|||||
|---|---|---|---|---|---|---|---|
Payroll and compensation |
$ | 7,544 | $ | 18,730 | |||
Sales, use taxes and other taxes |
7,100 | 7,749 | |||||
Professional fees |
1,676 | 3,852 | |||||
Refundable deposits |
930 | 3,434 | |||||
Marketing |
2,516 | 1,329 | |||||
RealD Cinema system installation fees |
4,767 | — | |||||
Other |
4,337 | 5,024 | |||||
Total |
$ | 28,870 | $ | 40,118 | |||
For our U.S. cinema license and product revenues, we absorb the majority of sales and use taxes and do not pass such costs on to our customers.
6. Borrowings
Credit Agreement
Prior to July 21, 2010, the date of our IPO, we had a $35.0 million credit facility agreement with City National Bank that provided for a maximum amount of borrowing under a revolving credit facility of $25.0 million and a term loan of $10.0 million.
We have entered into a credit and security agreement with City National Bank, a national banking association, or City National, which was dated as of June 24, 2010 and amended on April 5, 2011 (as amended, the "Credit Agreement"), to provide that the aggregate principal amount outstanding at any one time under our revolving credit loans may be (i) up to $50 million through December 31, 2011 and (ii) up to $25.0 million thereafter and which will mature on June 30, 2012. On December 6, 2011, we further amended the Credit Agreement to provide that the aggregate principal amount outstanding at any one time under our revolving credit loans shall remain $50 million after December 31, 2011 and to extend the maturity date of the revolving credit loans under the Credit Agreement to December 31, 2013. The Credit Agreement and the revolving credit facility provided thereunder became effective on July 21, 2010. Our obligations under the Credit Agreement are secured by a first priority security interest in substantially all of our tangible and intangible assets in favor of City National and are guaranteed by our subsidiaries, ColorLink, Inc., or ColorLink and Stereographics Corporation , or Stereographics. The revolving credit facility provides for, at our option, Revolving London Interbank Offered Rate ("LIBOR") loans, which bear interest at the greater of three and one half percent (3.50%) or the LIBOR plus two and one-half percent (2.50%) or Revolving Prime loans which bear interest at the greater of three and one half percent (3.50%) or the fluctuating Prime Rate per annum.
Under the Credit Agreement, our business will be subject to certain limitations, including limitations on our ability to incur additional debt, make certain investments or acquisitions, enter into certain merger and consolidation transactions, and sell our assets other than in the ordinary course of business. We will also be required to maintain compliance with certain financial covenants, including a minimum fixed charge coverage ratio and a maximum leverage ratio. As of March 23, 2012, we were in compliance with all financial covenants in the Credit Agreement. If we fail to comply with any of the
91
RealD Inc.
Notes to consolidated financial statements (Continued)
6. Borrowings (Continued)
covenants or if any other event of default, as defined in the Credit Agreement, should occur, the bank could elect to prevent us from borrowing and declare the indebtedness to be immediately due and payable.
As of March 23, 2012, there were $25.0 million in borrowings outstanding under the Credit Agreement. As of March 23, 2012, borrowings outstanding under the Credit Agreement bear interest at 3.50%. As of March 25, 2011, there were no borrowings outstanding under the Credit Agreement. Interest expense related to our borrowings under our credit and security agreement was $0.9 million, $0.6 million and $0.9 million for the years ended March 23, 2012, March 25, 2011 and March 26, 2010, respectively.
Notes payable
From time to time, we enter into equipment purchase agreements with certain of our vendors for the purchase of digital projectors, digital servers, lenses and accessories. We pay a portion of the cost of the equipment upon delivery and finance a portion of the purchase price by issuing notes payable. The equipment is included in digital projectors in the accompanying consolidated balance sheets. Certain of these notes payables are non-interest bearing. In those cases, we record the net present value of the notes payable assuming an implied annual interest rate which is approximately 8.4%. The notes are secured by the underlying equipment. There was no notes payable outstanding as of March 23, 2012. Notes payable totaled $2.3 million as of March 25, 2011. Interest expense is based on annual interest rates ranging from 7.0% to 8.4%. Interest expense related to our notes payable was $0.1 million, $0.3 million and $0.8 million for the years ended March 23, 2012, March 25, 2011 and March 26, 2010, respectively.
7. Commitments and contingencies
Lease obligations
We lease certain office, production and research and development space under noncancelable operating leases that expire at various dates. Certain operating leases provide us with the option to renew for additional periods. Where operating leases contain escalation clauses, rent abatements, and/or concessions, such as rent holidays and landlord or tenant incentives or allowances, we apply them in the determination of straight-line rent expense over the lease term. Certain operating leases require the payment of real estate taxes or other occupancy costs, which may be subject to escalation.
At March 23, 2012, our future minimum lease obligations were as follows (in thousands):
Fiscal year 2013 |
$ | 3,221 | ||
Fiscal year 2014 |
2,991 | |||
Fiscal year 2015 |
2,972 | |||
Fiscal year 2016 |
3,058 | |||
Fiscal year 2017 |
2,957 | |||
Thereafter |
13,723 | |||
Total |
$ | 28,922 | ||
92
RealD Inc.
Notes to consolidated financial statements (Continued)
7. Commitments and contingencies (Continued)
Rent expense was $4.3 million, $2.6 million and $1.6 million for the fiscal years ended March 23, 2012, March 25, 2011 and March 26, 2010, respectively.
Indemnities and commitments
During the ordinary course of business, we make certain indemnities and commitments under which we may be required to make payments in relation to certain transactions. These indemnities include indemnities of certain customers and licensees of our technologies, and indemnities to our directors and officers to the maximum extent permitted under the laws of the State of California. The duration of these indemnities and commitments varies, and in certain cases, is indefinite. The majority of these indemnities and commitments do not provide for any limitation of the maximum potential future payments we could be obligated to make. We have not recorded any liability for these indemnities and commitments in the accompanying consolidated balance sheets. We do, however, accrue for losses for any known contingent liability, including those that may arise from indemnification provisions, when future payment is probable and estimable.
We have entered into contracts with certain of our vendors. Future obligations under such contracts totaled $8.7 million at March 23, 2012 and include revolving 90-day supply commitments. Many of the contracts contain cancellation penalty provisions requiring payment of up to 20.0% of the unused contract.
Contingencies and assessments
We are subject to various loss contingencies and assessments arising in the course of our business, some of which relate to litigation, claims, property taxes and sales and use tax or goods and services tax assessments. We consider the likelihood of the loss or the incurrence of a liability, as well as our ability to reasonably estimate the amount of loss in determining loss contingencies and assessments. An estimated loss contingency or assessment is accrued when it is probable that a liability has been incurred and the amount of loss can be reasonably estimated. We regularly evaluate current information available to us to determine whether such accruals should be adjusted. Based on the information presently available, including discussion with counsel and other consultants, management believes that resolution of these matters will not have a material adverse effect on our business, consolidated results of operations, financial condition or cash flows.
8. Mandatorily redeemable convertible preferred stock and equity (deficit)
Initial public offering
In July 2010, we completed the IPO of our common stock in which we sold and issued 6 million shares of common stock at $16.00 per share. A total of approximately $96 million in gross proceeds were raised from the IPO, or $81.9 million in net proceeds after deducting underwriting discounts and commissions of approximately $6.7 million and other offering costs of approximately $7.4 million. In conjunction with our IPO, all of our previously outstanding Series A, B and D convertible preferred stock in the amount of 6,084,311 shares converted at a ratio of 1:1.5 into 9,126,466 shares of common stock.
93
RealD Inc.
Notes to consolidated financial statements (Continued)
8. Mandatorily redeemable convertible preferred stock and equity (deficit) (Continued)
Common stock
In November 2008, we entered into a stock purchase agreement with our Series D preferred stockholder. We sold 199,999 shares of our common stock at $10.00 per share. Total proceeds received were $2.0 million and were recorded net of issuance costs.
At March 23, 2012, we reserved the following shares of common stock for future issuances in connection with (in thousands):
Restricted stock units |
243 | |||
Performance units |
589 | |||
Stock option and employee stock purchase plan: |
||||
Outstanding |
7,661 | |||
Reserved for future issuance |
3,077 | |||
Total |
11,570 | |||
Convertible preferred stock
Prior to April 1, 2006, we issued 2,000,000 shares of Series A preferred stock for $2.0 million, or $1.00 per share. Offering costs were recorded against the proceeds received.
Rights and preferences afforded the stockholders of Series A preferred stock were as follows:
- •
- Shares were convertible into common stock at the holder's option on a 1-for-1.50 basis, subject to
certain anti-dilution provisions, as defined. Shares were automatically convertible into common stock upon the occurrence of a qualified initial public offering, as defined in our
certificate of incorporation. Our July 2010 IPO was a qualified initial public offering.
- •
- Upon a liquidating event, as defined, holders were entitled to liquidation payments equal to $1.00 per share for
Series A, plus declared but unpaid dividends. Further, holders were entitled to participate in distributions to common stockholders on a pro-rata basis as if the holders had
converted preferred shares into common stock. Liquidation payments to preferred stockholders ranked senior to payments to common stockholders. No liquidation events occurred prior to conversion.
- •
- Holders were entitled to dividends when and if declared. Dividends were participating with other classes of stock;
however, they were not cumulative.
- •
- Were redeemable for cash upon ordinary liquidation.
- •
- Each holder had the number of votes for each share of convertible preferred stock held by such holder equal to the whole number of shares of common stock into which such share of convertible preferred stock would have been converted as of the record date for the vote.
Prior to April 1, 2006, we had issued 2,417,644 shares of Series B preferred stock for $3.0 million or $1.24 per share. Offering costs have been recorded against the proceeds received.
94
RealD Inc.
Notes to consolidated financial statements (Continued)
8. Mandatorily redeemable convertible preferred stock and equity (deficit) (Continued)
Rights and preferences afforded the stockholders of Series B preferred stock were as follows:
- •
- Shares were convertible into common stock at the holder's option on a 1-for-1.50 basis, subject to
certain anti-dilution provisions, as defined. Shares were automatically converted into common stock upon the occurrence of a qualified initial public offering, as defined in our
certificate of incorporation. Our July 2010 IPO was a qualified initial public offering.
- •
- Upon a liquidating event, as defined, holders were entitled to liquidation payments equal to $1.24 per share for
Series B preferred stock, plus declared but unpaid dividends. Further, holders were entitled to participate in distributions to common stockholders on a pro-rata basis as if the
holders had converted preferred shares into common stock. Liquidation payments to preferred stockholders ranked senior to payments to common stockholders. No liquidation events had occurred prior to
conversion.
- •
- Holders were entitled to dividends when and if declared. Dividends are participating with other classes of stock; however,
they were not cumulative.
- •
- Were redeemable for cash upon ordinary liquidation, and upon a deemed liquidation such as a change in control.
- •
- Each holder had the number of votes for each share of convertible preferred stock held by such holder equal to the whole number of shares of common stock into which such share of convertible preferred stock would have been converted as of the record date for the vote.
In December 2007, we sold 1,666,667 shares of Series D preferred stock at $12.00 per share. Total proceeds received were $20.0 million. Offering costs, consisting primarily of legal and placement fees, would have been recorded against the proceeds received. Rights and preferences afforded the stockholders of Series D preferred stock were as follows:
- •
- Shares were convertible into common stock at the holder's option on a 1-for-1.50 basis, subject to
certain anti-dilution provisions, as defined. Shares were automatically convertible into common stock upon the occurrence of a qualified initial public offering, as defined in our
certificate of incorporation. Our July 2010 IPO was a qualified initial public offering.
- •
- Upon a liquidating event, as defined, holders were entitled to liquidation payments at 1.5 times initial per share
purchase price, plus declared, but unpaid dividends. Preference was pro-rata with the Series C mandatorily redeemable convertible preferred stockholders based upon relative
liquidation preference and payments rank senior to all other classes of stock. No liquidation events occurred prior to conversion.
- •
- Were redeemable for cash upon ordinary liquidation.
- •
- Each holder had the number of votes for each share of convertible preferred stock held by such holder equal to the whole
number of shares of common stock into which such share of convertible preferred stock would have been converted as of the record date for the vote.
- •
- Holders were entitled to dividends when and if declared. Dividends were participating with other classes of stock; however, they were not cumulative.
Our previously outstanding Series A, B and D convertible preferred stock was classified as part of permanent equity within the consolidated balance sheets based on their rights and preferences set forth
95
RealD Inc.
Notes to consolidated financial statements (Continued)
8. Mandatorily redeemable convertible preferred stock and equity (deficit) (Continued)
under the certificate of incorporation, California and Delaware law and the accounting standards pertaining to classification within the consolidated balance sheet. We therefore recorded the Series A, B and D preferred stock at their original issuance price net of applicable issuance costs. On July 21, 2010, in conjunction with our IPO, all of our previously outstanding Series A, B and D convertible preferred stock in the amount of 6,084,311 shares converted at a ratio of 1:1.5 into 9,126,466 shares of common stock.
Mandatorily redeemable convertible preferred stock
During February 2007, we sold 5,139,500 shares of Series C mandatorily redeemable convertible preferred stock at $6.81 per share. Total proceeds received were $35.0 million. Offering costs, consisting primarily of legal and placement fees, incurred were $3.2 million and have been recorded against the proceeds received.
Rights and preferences afforded the stockholders of Series C mandatorily redeemable convertible preferred stock were as follows:
- •
- Shares were convertible into common stock at the holder's option on a 1-for-1.50 basis, subject to
certain anti-dilution provisions, as defined. Shares were automatically convertible into common stock upon the occurrence of a qualified initial public offering, as defined in our
certificate of incorporation. Our July 2010 IPO was a qualified initial public offering.
- •
- Shares were mandatorily redeemable at the option of the holders beginning in December 2011. Redemption price is $17.025
per share, plus declared but unpaid dividends. We may elect to pay the redemption price in two installments, as defined. Amounts not paid in the first installment accrue interest at 6.0% per annum.
- •
- Shares were redeemable at our option at any time for liquidation value.
- •
- Upon a liquidating event, as defined, holders were entitled to liquidation payments equal to $17.025 per share, plus
declared but unpaid dividends. Liquidation payments to holders rank senior to payments to all other classes of stock. No liquidation events occurred prior to conversion.
- •
- Holders were entitled to dividends when and if declared. Dividends were participating with other classes of stock; however, they were not cumulative.
Our Series C mandatorily redeemable convertible preferred stock was classified in temporary equity under the SEC's guidance provided in Accounting Series Release No. 268, Presentation in Financial Statements of "Redeemable Preferred Stocks," (ASR 268) because the holders of our Series C mandatorily redeemable convertible preferred stock had the right to cause us to redeem the instrument for cash for a specified period. On July 21, 2010, in conjunction with our IPO, all of our previously outstanding Series C mandatorily redeemable convertible preferred stock in the amount of 5,139,500 shares converted at a ratio of 1:1.5 into 7,709,250 shares of common stock.
We accreted the carrying value of the Series C mandatorily redeemable convertible preferred stock up to liquidation value through July 21, 2010. Accretion was provided using the effective interest-rate method. During the years ended March 25, 2011 and March 26, 2010, we recorded accretion of $4.9 million and $12.4 million, respectively.
96
RealD Inc.
Notes to consolidated financial statements (Continued)
8. Mandatorily redeemable convertible preferred stock and equity (deficit) (Continued)
Motion picture exhibitor stock options
In connection with motion picture exhibitor licensing agreements, we issued to motion picture exhibitors a 10-year option to purchase 3,668,340 shares of our common stock at $0.00667 per share. These stock options to our motion picture exhibitor licensees vested upon the achievement of screen installation targets and were valued at the underlying stock price at each reporting period until the targets were met. All targets have been met and these stock options are fully vested.
Amounts recorded as a revenue reduction from motion picture exhibitor stock options totaled $36.4 million and $39.2 million for the years ended March 25, 2011 and March 26, 2010, respectively. Amounts recognized are based on the number of RealD-enabled screens as a percentage of total screen installation targets. The stock options do not have net cash settlement features. As of March 25, 2011 all 3,668,340 motion picture exhibitor stock options had vested and all associated reduction of revenue has been recognized.
Warrants
Prior to April 1, 2006, we had issued warrants to purchase a total of 1,335,000 shares of common stock. The warrants were primarily issued in exchange for cash received totaling $24,000. During April 2007, warrants to purchase 360,000 shares of common stock were exercised.
Prior to April 1, 2006, we issued warrants and options to purchase 1,900,500 shares of common stock in exchange for cash received and as additional consideration to a person who lent us money. Prior to April 1, 2006, and when the awards were not fully vested, the lender exercised the warrants and options. The lender entered into a restricted stock agreement whereby we could repurchase the shares if the shares do not vest. During the year ended March 31, 2008, we repurchased 307,500 restricted shares that did not vest.
As of March 25, 2011, there were warrants outstanding to purchase 326,700 shares of common stock. The warrants' weighted-average exercise price was approximately $0.83 per share.
As of March 23, 2012, there were no warrants outstanding.
9. Share-based compensation
We account for stock options granted to employees and directors by recording compensation expense based on estimated fair values. We estimate the fair value of share-based payment awards on the date of grant. The value of the portion of the award that is ultimately expected to vest is recognized as expense over the requisite service periods in our consolidated statements of operations. Share-based awards are attributed to expense using the straight-line method over the vesting period. We determine the value of each option award that contains a market condition using a lattice-based option valuation model, while all other option awards are valued using the Black-Scholes valuation model as permitted under ASC 718, Compensation—Stock Compensation. The assumptions used in calculating the fair value of share-based payment awards represent our best estimates. Our estimates of the fair values of stock options granted and the resulting amounts of share-based compensation recognized may be impacted by certain variables including stock price volatility, employee stock option exercise behaviors, additional stock option grants, modifications, estimates of forfeitures and the related income tax impact.
97
RealD Inc.
Notes to consolidated financial statements (Continued)
9. Share-based compensation (Continued)
In April 2010, our board of directors unanimously adopted the RealD Inc. 2010 Stock Incentive Plan (the "2010 Stock Plan"), and in June 2010, our stockholders approved the 2010 Stock Plan. The board of directors intends for the 2010 Stock Plan to replace our 2004 Amended and Restated Stock Incentive Plan, (the "2004 Plan"), such that, effective with our IPO, we will no longer make any new grants under the 2004 Plan. Instead, the board of directors or our compensation committee will issue equity compensation awards under the 2010 Stock Plan. The stock plan provides for the granting of nonstatutory stock options, incentive stock options, stock appreciation rights, restricted stock awards and stock units to employees, officers, directors, non-employee directors and consultants. Additionally, in June 2011 our board of directors approved the RealD Inc. 2011 Employee Stock Purchase Plan (the "ESPP Plan") and in July 2011, our stockholders approved the ESPP Plan. Stock-based compensation expense related to the ESPP Plan for the year ended March 23, 2012 was not significant.
On May 19, 2011, we entered into a separation agreement and general release of claims with Joshua Greer, a current director and who previously served as our president. Pursuant to the terms of the separation agreement, Mr. Greer will receive acceleration of a time-based vesting stock option for 105,000 shares granted to Mr. Greer on July 15, 2010 as of July 15, 2011, which will remain exercisable for 6 months following the end of the term of the consulting agreement that we entered into with Mr. Greer on the same date. A second stock option for 105,000 shares granted to Mr. Greer on July 15, 2010 was entirely forfeited and cancelled without consideration. The incremental compensation cost resulting from the modifications totaled $0.9 million for the year ended March 23, 2012.
The following table reflects the components of stock-based compensation expense recognized in our consolidated statements of operations for the years ended March 23, 2012, March 25, 2011 and March 26, 2010:
| |
Year ended | |||||||||
|---|---|---|---|---|---|---|---|---|---|---|
(in thousands)
|
March 23, 2012 |
March 25, 2011 |
March 26, 2010 |
|||||||
Cost of revenue |
$ | 458 | $ | 160 | $ | 60 | ||||
Research and development |
2,604 | 1,470 | 985 | |||||||
Selling and marketing |
4,776 | 2,937 | 1,589 | |||||||
General and administrative |
7,906 | 4,383 | 275 | |||||||
Total |
$ | 15,744 | $ | 8,950 | $ | 2,909 | ||||
Stock options
Stock options granted generally vest over a four-year period, with 25% of the shares vesting after one year and monthly vesting thereafter. The options generally expire ten years from the date of grant. Share-based compensation expense related to stock options was $12.3 million, $6.9 million and $2.9 million for the years ended March 23, 2012, March 25, 2011 and March 26, 2010, respectively.
98
RealD Inc.
Notes to consolidated financial statements (Continued)
9. Share-based compensation (Continued)
A summary of our stock option activity is as follows:
(in thousands, except exercise price data and contractual term data) |
Options | Weighted- average exercise price |
Weighted- average remaining contractual term (years) |
Aggregate intrinsic value |
|||||||||
|---|---|---|---|---|---|---|---|---|---|---|---|---|---|
Outstanding at March 25, 2011 |
6,246 | $ | 9.94 | ||||||||||
Granted |
1,914 | 20.71 | |||||||||||
Exercised |
(257 | ) | 3.79 | ||||||||||
Forfeited or expired |
(242 | ) | 19.65 | ||||||||||
Outstanding at March 23, 2012 |
7,661 | $ | 12.54 | 7.2 | $ | 27,103 | |||||||
Exercisable at March 23, 2012 |
4,152 | $ | 7.90 | 5.9 | $ | 25,457 | |||||||
Vested or expected to vest |
7,509 | $ | 12.42 | 7.2 | $ | 26,987 | |||||||
The total intrinsic value of options exercised was $3.9 million, $47.0 million and $6.2 million for the years ended March 23, 2012, March 25, 2011 and March 26, 2010, respectively.
Awards that are vested or expected to vest take into consideration estimated forfeitures for awards not yet vested.
The weighted-average grant date fair values were determined using the Black-Scholes option-pricing model with the following weighted-average assumptions:
| |
Year ended | |||||||||
|---|---|---|---|---|---|---|---|---|---|---|
| |
March 23, 2012 |
March 25, 2011 |
March 26, 2010 |
|||||||
Fair value of stock options granted |
$ | 11.39 | $ | 8.92 | $ | 6.05 | ||||
Expected volatility |
58 | % | 57 | % | 63 | % | ||||
Expected term (years) |
6 | 6 | 6 | |||||||
Risk-free rate |
2.0 | % | 2.0 | % | 2.9 | % | ||||
Expected dividends |
— | — | — | |||||||
For purposes of determining the expected term and in the absence of historical data relating to stock option exercises, we apply a simplified approach: the expected term of awards granted is presumed to be the mid-point between the vesting date and the end of the contractual term. We use the contractual term when valuing awards to consultants. We use the average volatility of similar, publicly traded companies as an estimate for expected volatility. The risk-free interest rate for periods within the expected or contractual life of the option, as applicable, is based on the United States Treasury yield curve in effect during the period the options were granted. Our expected dividend yield is zero.
As of March 23, 2012, there was $31.7 million of total unrecognized compensation costs related to stock option compensation arrangements granted which is expected to be recognized over the remaining weighted-average period of 2.8 years.
99
RealD Inc.
Notes to consolidated financial statements (Continued)
9. Share-based compensation (Continued)
Performance stock options
Certain of our management-level employees receive performance stock options, which gives the recipient the right to receive common stock that is contingent upon achievement of specified pre-established performance goals over the performance period, which is three years. The performance goals for the performance stock options are based on the measurement of our total shareholder return, on a percentile basis, compared to a comparable group of companies. Depending on the outcome of the performance goals, the recipient may ultimately earn performance stock options equal to or less than the number of performance stock options granted. For the year ended March 25, 2011, we granted 641,250 performance stock options at a weighted average grant date fair value of $9.45 per share. There were no grants of performance stock options for the year ended March 23, 2012. Share-based compensation expense related to performance stock options was $1.7 million and $1.4 million for the years ended March 23, 2012 and March 25, 2011.
The lattice-based option valuation model uses terms based on the length of the performance period and compound annual growth rate goals for total stockholder return based on the provisions of the award. For purposes of determining the expected term and in the absence of historical data relating to stock option exercises, we apply a simplified approach: the expected term of awards granted is presumed to be the mid-point between the vesting date and the end of the contractual term. We use the average volatility of a peer group of companies as an estimate for expected volatility. The risk-free interest rate for periods within the expected or contractual life of the option, as applicable, is based on the United States Treasury yield curve in effect during the period the options were granted.
A summary of our performance stock option activity is as follows:
(in thousands, except exercise price data and contractual term data) |
Options | Weighted- average exercise price |
Weighted- average remaining contractual term (years) |
|||||||
|---|---|---|---|---|---|---|---|---|---|---|
Outstanding at March 25, 2011 |
641 | $ | 16.00 | |||||||
Granted |
— | — | ||||||||
Exercised |
— | — | ||||||||
Forfeited or expired |
(52 | ) | 16.00 | |||||||
Outstanding at March 23, 2012 |
589 | $ | 16.00 | 8.3 | ||||||
As of March 23, 2012, there was $2.4 million of total unrecognized compensation costs related to performance stock option compensation arrangements granted which is expected to be recognized over the remaining weighted-average period of 1.3 years.
Restricted stock units
The fair value of a restricted stock unit is equal to the closing price of our common stock on the grant date. The weighted-average grant date fair values of restricted stock units granted in the year ended March 23, 2012 was $20.53. The weighted-average grant date fair values of restricted stock units granted in the year ended March 25, 2011 was $20.78. Share-based compensation expense related to restricted stock units was $1.7 million and $0.7 million for the years ended March 23, 2012 and March 25, 2011, respectively.
100
RealD Inc.
Notes to consolidated financial statements (Continued)
9. Share-based compensation (Continued)
The following summarizes select information regarding our restricted stock units during the year ended March 23, 2012:
(in thousands, except grant date fair value data)
|
Units | Weighted- average grant date fair value |
|||||
|---|---|---|---|---|---|---|---|
Nonvested at March 25, 2011 |
36 | $ | 23.31 | ||||
Granted |
174 | 20.53 | |||||
Vested |
(57 | ) | 17.82 | ||||
Forfeited |
— | — | |||||
Nonvested at March 23, 2012 |
153 | $ | 21.81 | ||||
As of March 23, 2012, there was $2.6 million of total unrecognized compensation costs related to restricted stock units granted which is expected to be recognized over the remaining weighted-average period of 2.0 years.
The total fair values of restricted stock units that vested was $1.0 million and $0.7 million for the years ended March 23, 2012 and March 25, 2011, respectively. Restricted stock units were not granted in the year ended March 26, 2010.
10. Income taxes
The income tax provision from continuing operations consists of the following:
| |
Year ended | |||||||||
|---|---|---|---|---|---|---|---|---|---|---|
(in thousands)
|
March 23, 2012 |
March 25, 2011 |
March 26, 2010 |
|||||||
Current income tax provision |
||||||||||
Federal |
$ | — | $ | — | $ | — | ||||
State |
119 | 87 | 78 | |||||||
Foreign |
4,948 | 4,187 | 2,538 | |||||||
|
5,067 | 4,274 | 2,616 | |||||||
Deferred income tax benefit |
||||||||||
Federal |
— | — | — | |||||||
State |
— | — | — | |||||||
Foreign |
38 | (2 | ) | 64 | ||||||
Total income tax provision from continuing operations |
$ | 5,105 | $ | 4,272 | $ | 2,680 | ||||
101
RealD Inc.
Notes to consolidated financial statements (Continued)
10. Income taxes (Continued)
Income (loss) from continuing operations before income taxes consisted of the following:
| |
Year ended | |||||||||
|---|---|---|---|---|---|---|---|---|---|---|
(in thousands)
|
March 23, 2012 |
March 25, 2011 |
March 26, 2010 |
|||||||
Domestic |
$ | 37,600 | $ | (5,749 | ) | $ | (41,405 | ) | ||
Foreign |
4,530 | 3,196 | 4,336 | |||||||
Total |
$ | 42,130 | $ | (2,553 | ) | $ | (37,069 | ) | ||
Significant components of our deferred tax balances are as follows:
(in thousands)
|
March 23, 2012 |
March 25, 2011 |
|||||
|---|---|---|---|---|---|---|---|
Deferred tax assets: |
|||||||
Net operating loss carryforwards |
$ | 30,668 | $ | 25,622 | |||
Deferred revenue |
4,503 | 6,986 | |||||
Motion picture exhibitor options |
— | 3,605 | |||||
Accruals, reserves and allowances |
4,163 | 9,197 | |||||
Share-based compensation |
8,006 | 4,441 | |||||
Intangible assets |
825 | 454 | |||||
Foreign tax credit carryovers |
8,031 | 4,913 | |||||
Other |
1,918 | 1,610 | |||||
Total deferred tax assets |
$ | 58,114 | $ | 56,828 | |||
Deferred tax liabilities |
|||||||
Fixed assets |
$ | (18,579 | ) | $ | (9,493 | ) | |
Intangible assets |
— | — | |||||
Partnership interest |
(154 | ) | (358 | ) | |||
Unbilled receivables |
(5,371 | ) | (3,782 | ) | |||
Other |
(116 | ) | (76 | ) | |||
Total deferred tax liabilities |
$ | (24,220 | ) | $ | (13,709 | ) | |
Valuation allowance |
(33,994 | ) | (43,181 | ) | |||
Net deferred tax liabilities |
$ | (100 | ) | $ | (62 | ) | |
Due to the uncertainties surrounding the timing and realization of the benefits from our tax attributes in future tax returns, we have placed a valuation allowance against primarily all of our otherwise recognizable net deferred tax assets as of March 23, 2012, March 25, 2011 and March 26, 2010. As a result, we increased our valuation allowance through the operating statement as follows:
(in thousands)
|
March 23, 2012 |
March 25, 2011 |
|||||
|---|---|---|---|---|---|---|---|
Through continuing operations |
$ | (9,187 | ) | $ | 4,986 | ||
Net deferred tax liabilities |
$ | (9,187 | ) | $ | 4,986 | ||
102
RealD Inc.
Notes to consolidated financial statements (Continued)
10. Income taxes (Continued)
The income tax provision from continuing operations differs from the amount computed by applying the U.S. statutory federal income tax rate of 34.0% to the pretax loss as a result of the following differences:
| |
Year ended | |||||||||
|---|---|---|---|---|---|---|---|---|---|---|
| |
March 23, 2012 |
March 25, 2011 |
March 26, 2010 |
|||||||
Federal tax at statutory rate |
34.0 | % | 34.0 | % | 34.0 | % | ||||
State tax, net of federal benefit |
1.6 | % | (1.2 | )% | 4.2 | % | ||||
Foreign tax rate differential |
0.5 | % | 11.3 | % | 0.1 | % | ||||
LLC income minority interest not taxed |
(0.1 | )% | 7.2 | % | (0.8 | )% | ||||
Revaluation of deferred taxes due to changes in effective income tax rates |
(1.4 | )% | (13.7 | )% | (0.6 | )% | ||||
Research tax credits |
0.0 | % | 25.20 | % | — | |||||
Permanent differences and other |
(0.7 | )% | (35.0 | )% | (0.2 | )% | ||||
Change in valuation allowance |
(21.8 | )% | (195.4 | )% | (43.9 | )% | ||||
Total tax benefit |
12.1 | % | (167.7 | )% | (7.2 | )% | ||||
As of March 23, 2012, we had net operating loss carryforwards of approximately $142.4 million for federal and $68.6 million for state purposes. Federal and state net operating loss carryforwards begin to expire in year 2012 and 2020, respectively. As of March 23, 2012 we had foreign tax credit carryforwards of approximately $8.0 million for federal income tax purposes that begin to expire in the year 2019. Our ability to utilize net operating loss carryforwards are generally limited and may become limited further in the event that a change in ownership occurs, as defined in the Internal Revenue Code.
We recognize excess tax benefits associated with share-based compensation and motion picture exhibitor options to stockholders' equity only when realized. As of March 23, 2012, we have approximately $23.3 million of unrealized excess tax benefits associated with share-based compensation and exhibitor options. These tax benefits will be accounted for as a credit to additional paid-in capital, if and when realized, rather than a reduction of the provision for income taxes.
On April 1, 2009, we adopted accounting for uncertain tax positions pursuant to ASC 740, Income Taxes. As a result of adoption, we recorded a reduction of our deferred tax assets of approximately $0.1 million with a corresponding decrease to our valuation allowance.
The following table summarized the activity related to our unrecognized tax benefits (in thousands):
Balance as of March 25, 2011 |
$ | 346 | ||
Increases related to prior year tax positions |
— | |||
Increase related to current year tax positions |
— | |||
Expiration of the statute of limitations for the assessment of taxes |
— | |||
Settlements |
— | |||
Balance as of March 23, 2012 |
$ | 346 | ||
103
RealD Inc.
Notes to consolidated financial statements (Continued)
10. Income taxes (Continued)
Approximately $0.3 million of the unrecognized tax benefits will decrease the effective tax rate if recognized, subject to the valuation allowance.
It is not anticipated that there will be a significant change in the unrecognized tax benefits over the next 12 months.
Due to the net operating loss carryforwards, our United States federal and state returns are open to examination by the Internal Revenue Service and state jurisdictions for all years since inception.
Our policy is to recognize interest expense and penalties related to income tax matters as a component of income tax expense. As of March 23, 2012, amounts for accrued interest and penalties associated with uncertain tax positions were not significant.
As of March 23, 2012, unremitted earnings of the subsidiary outside of the United States were approximately $9.4 million, on which no United States taxes had been provided. Our current intention is to reinvest these earnings outside the United States. It is not practicable to estimate the amount of additional taxes that might be payable upon repatriation of foreign earnings.
11. Related-party transactions
In November 2007, we sold our 51.0% interest in ColorLink Japan to its noncontrolling interest owner. Prior to the November disposition, ColorLink Japan leased certain employees and facilities from its noncontrolling interest owner and purchased certain raw materials from that owner. Furthermore, the noncontrolling interest owner and its affiliate acted as a sales distributor for ColorLink Japan for designated customers. The noncontrolling interest owner provided management services for ColorLink Japan for which it received a fee of 2.0% to 3.0% of ColorLink Japan sales. Management fees paid by ColorLink Japan to its noncontrolling interest owner from the date of acquisition through the date of sale totaled $0.1 million.
In conjunction with the November 2007 disposition of ColorLink Japan, we entered into a Technology and License Agreement with the previous noncontrolling interest owner of ColorLink Japan, and ColorLink Japan granting the parties certain exclusive and non-exclusive rights to make, use and sell designated inventions. As consideration for the grant of these rights, the parties have agreed to pay a royalty equal to 8.0% of revenue earned on the sale of the licensed products. Royalties earned in the year ended March 23, 2012 totaled $2.4 million, of which $0.3 million remained due and outstanding as of March 23, 2012. Royalties earned in the year ended March 25, 2011 totaled $5.9 million, of which $0.2 million remained due and outstanding as of March 25, 2011. Royalties earned in the year ended March 26, 2010 totaled $0.8 million, of which $0.2 million remained due and outstanding as of March 26, 2010.
In addition, we purchased inventory from the previous noncontrolling interest owner of ColorLink Japan. Inventory amounts purchased totaled $7.0 million and $13.5 million for the years ended March 23, 2012 and March 25, 2011, respectively. As of March 23, 2012 and March 25, 2011, we owed the previous noncontrolling interest owner of ColorLink Japan $0.9 million and $1.4 million, respectively. Amounts purchased from us by the noncontrolling interest owner of ColorLink Japan in the year ended March 23, 2012 totaled $3.6 million of which $1.5 million remained outstanding. A principal of the previous noncontrolling interest owner of ColorLink Japan owns less than 5% share of our common stock.
104
RealD Inc.
Notes to consolidated financial statements (Continued)
11. Related-party transactions (Continued)
During the year ended March 25, 2011, we purchased digital projectors from the noncontrolling interest owner of our subsidiaries totaling $0.8 million. Of this amount, $0.5 million was paid upfront and $0.3 million was financed as long-term debt.
During the years ended March 25, 2011 and March 26, 2010 we paid a $0.2 million and $0.4 million management fee to the holder of our Series C mandatorily redeemable convertible preferred stock, respectively. Upon the closing of our IPO in July 2010, our obligation to pay this management fee ceased.
On May 19, 2011, we entered into a separation agreement and general release of claims with Joshua Greer, a current director and who previously served as our president. Pursuant to the terms of the separation agreement, Mr. Greer will receive the following benefits: (i) cash severance of $450,000 paid in ten equal installments, with the first such installment paid on October 15, 2011; (ii) reimbursement from us for insurance coverage under COBRA for 18 months following July 15, 2011 or such earlier time as Mr. Greer becomes eligible for insurance through another employer; (iii) a pro-rated cash performance bonus for fiscal year 2012 (to be paid no later than June 15, 2012), in an amount equal to 30% of 80% of Mr. Greer's salary, computed assuming that Mr. Greer had remained as our president through the end of fiscal year 2012; and (iv) acceleration of a time-based vesting stock option for 105,000 shares granted to Mr. Greer on July 15, 2010 as of July 15, 2011, which will remain exercisable for 6 months following the end of the term of the consulting agreement that we entered into with Mr. Greer on the same date. A second stock option for 105,000 shares granted to Mr. Greer on July 15, 2010 was entirely forfeited and cancelled without consideration. The incremental compensation cost resulting from the modifications totaled $0.9 million for the year ended March 23, 2012. We entered into a consulting agreement with Mr. Greer pursuant to which Mr. Greer will be paid $275,000 per year commencing as of July 16, 2011. The consulting agreement with Mr. Greer expires on July 16, 2012 (unless earlier terminated). During the year ended March 23, 2012, we paid $0.2 million pursuant to the separation agreement and $0.1 million pursuant to the consulting agreement.
12. Segment and geographic information
For financial reporting purposes we currently have one reportable segment. We have three operating segments: cinema, consumer electronics and professional. Operating segments are defined as components of an enterprise about which separate financial information is available that is evaluated regularly by the chief operating decision maker, or decision making group, in deciding how to allocate resources and in assessing performance. Our chief operating decision maker is our Chief Executive Officer. We aggregate our three operating segments into one reportable segment based on qualitative factors including similar economic characteristics and the nature of the products and services. Our product portfolio is used in applications that enable a premium 3D viewing experience across the segments. We currently generate substantially all of our revenue from the license of our RealD Cinema Systems and the sale of our eyewear, which together enable a digital cinema projector to show 3D motion pictures.
Our top 10 customers with an accounts receivable balance represented approximately 45% and 52% of our net accounts receivable as of March 23, 2012 and March 25, 2011, respectively. Our top 10 customers accounted for approximately 46%, 50% and 70% of our revenue for the years ended March 23, 2012, March 25, 2011 and March 26, 2010, respectively.
105
RealD Inc.
Notes to consolidated financial statements (Continued)
12. Segment and geographic information (Continued)
Our customers with revenues of 10% or greater of total revenues are presented below for the periods indicated:
| |
Percentage of net revenue |
|||
|---|---|---|---|---|
| |
Year ended March 26, 2010 |
|||
Customer A |
13 | % | ||
Customer B |
12 | % | ||
Customer C |
— | |||
Customer D |
— | |||
Customer E |
10 | % | ||
Customer F |
— | |||
No individual customer accounted for greater than 10% of our revenues during the years ended March 23, 2012 and March 25, 2011.
Geographic information
Revenue by geographic region, as determined based on the location of our customers or the anticipated destination of use was as follows:
| |
Year ended | |||||||||
|---|---|---|---|---|---|---|---|---|---|---|
(in thousands)
|
March 23, 2012 |
March 25, 2011 |
March 26, 2010 |
|||||||
Domestic (United States and Canada) |
$ | 126,151 | $ | 91,259 | $ | 62,488 | ||||
International |
120,477 | 154,877 | 87,358 | |||||||
Total revenues |
$ | 246,628 | $ | 246,136 | $ | 149,846 | ||||
Long-lived tangible assets, net of accumulated depreciation, by geographic region were as follows:
(in thousands)
|
March 25, 2011 |
March 25, 2011 |
|||||
|---|---|---|---|---|---|---|---|
Domestic (United States and Canada) |
$ | 105,851 | $ | 101,563 | |||
International |
48,964 | 39,027 | |||||
Total long-lived tangible assets |
$ | 154,815 | $ | 140,590 | |||
106
RealD Inc.
Notes to consolidated financial statements (Continued)
13. Quarterly financial data (unaudited)
| |
Three months ended | ||||||||||||
|---|---|---|---|---|---|---|---|---|---|---|---|---|---|
(dollars in thousands, except per share data)
|
March 23, 2012 |
December 23, 2011 |
September 23, 2011 |
June 24, 2011 |
|||||||||
Net revenue |
$ | 50,047 | $ | 49,026 | $ | 87,995 | $ | 59,560 | |||||
Gross profit |
26,895 | 23,954 | 42,522 | 35,319 | |||||||||
Net income |
5,683 | 2,763 | 19,177 | 9,402 | |||||||||
Net income attributable to RealD Inc. common stockholders |
$ | 5,536 | $ | 2,833 | $ | 18,905 | $ | 9,595 | |||||
Earnings per common share: |
|||||||||||||
Basic |
$ | 0.10 | $ | 0.05 | $ | 0.35 | $ | 0.18 | |||||
Diluted |
$ | 0.10 | $ | 0.05 | $ | 0.33 | $ | 0.17 | |||||
| |
Three months ended | ||||||||||||
|---|---|---|---|---|---|---|---|---|---|---|---|---|---|
(dollars in thousands, except per share data)
|
March 25, 2011 |
December 24, 2010 |
September 24, 2010 |
June 25, 2010 |
|||||||||
Net revenue |
$ | 58,514 | $ | 57,780 | $ | 65,322 | $ | 64,520 | |||||
Gross profit |
29,877 | 6,138 | 13,823 | 17,902 | |||||||||
Net income (loss) |
4,305 | (16,768 | ) | (4,214 | ) | 9,852 | |||||||
Net income (loss) attributable to RealD Inc. common stockholders |
$ | 4,467 | $ | (16,587 | ) | $ | (5,123 | ) | $ | 2,946 | (1) | ||
Earnings (loss) per common share: |
|||||||||||||
Basic |
$ | 0.09 | $ | (0.34 | ) | $ | (0.12 | ) | $ | 0.12 | |||
Diluted |
$ | 0.08 | $ | (0.34 | ) | $ | (0.12 | ) | $ | 0.09 | |||
- (1)
- Includes undistributed earnings attributable to preferred stockholders of $2.0 million.
14. Subsequent events (unaudited)
In April 2012, we received proceeds of $2.5 million for the sale of digital projectors to certain of our motion picture exhibitors which closed in March 2012.
We recently entered into a secured credit facility agreement with City National to provide us with:
- •
- a revolving credit facility (including a letter of credit sub-facility) in a maximum amount not to exceed
$75,000,000 (the "Revolving Facility"); and
- •
- a delayed-draw term loan facility in a maximum amount not to exceed $50,000,000 (the "Term Loan Facility")
The Revolving Facility and the Term Loan Facility replaced pre-existing revolving and term loan facilities provided under our pre-existing credit and security agreement with City National, which had been most recently amended on December 6, 2011.
Our obligations under our secured credit facility are secured by a first priority security interest in substantially all of our tangible and intangible assets and are fully and unconditionally guaranteed by our subsidiaries, ColorLink Inc., a Delaware corporation ("ColorLink"), and Stereographics Corporation, a California corporation ("Stereographics").
107
RealD Inc.
Notes to consolidated financial statements (Continued)
14. Subsequent events (unaudited) (Continued)
Our Revolving Facility matures on April 17, 2015, and the Term Loan Facility matures the last day of the twelfth (12th) full fiscal quarter after the earlier of October 18, 2013 or the date that aggregate term loan commitments have been drawn in full, which maturity dates may, in each case, be accelerated in certain circumstances.
On April 20, 2012, we announced that our board of directors had approved an authorization for the Company to repurchase up to $50 million of RealD common stock. The number of shares to be repurchased and the timing of any potential repurchases will depend on factors such as the Company's stock price, economic and market conditions, alternative uses of capital, and corporate and regulatory requirements. Repurchases of common stock may be made under a Rule 10b5-1 plan, which would permit common stock to be repurchased when RealD might otherwise be precluded from doing so under insider trading laws, and a variety of other methods, including open market purchases, privately negotiated transactions, block trades, accelerated share repurchase transactions, or by any combination of such methods. The repurchase program may be suspended or discontinued at any time.
108
Item 9. Changes in and disagreements with accountants on accounting and financial disclosure
None.
Item 9A. Controls and procedures
Evaluation of disclosure controls and procedures
We maintain "disclosure controls and procedures," as such term is defined in Rules 13a-15(e) and 15d-15(e) under the Securities Exchange Act of 1934, or the Exchange Act, that are designed to ensure that information required to be disclosed by us in reports that we file or submit under the Exchange Act is recorded, processed, summarized, and reported within the time periods specified in Securities and Exchange Commission rules and forms, and that such information is accumulated and communicated to our management, including our Chief Executive Officer and Chief Financial Officer, as appropriate, to allow for timely decisions regarding required disclosure. In designing and evaluating our disclosure controls and procedures, management recognized that disclosure controls and procedures, no matter how well conceived and operated, can provide only reasonable, not absolute, assurance that the objectives of the disclosure controls and procedures are met. Additionally, in designing disclosure controls and procedures, our management necessarily was required to apply its judgment in evaluating the cost-benefit relationship of possible disclosure controls and procedures. The design of any disclosure controls and procedures also is based in part upon certain assumptions about the likelihood of future events, and there can be no assurance that any design will succeed in achieving its stated goals under all potential future conditions.
Subject to the limitations noted above, our management, with the participation of our Chief Executive Officer and Chief Financial Officer, has evaluated the effectiveness of the design and operation of our disclosure controls and procedures as of the end of the fiscal period covered by this Annual Report on Form 10-K. Based on that evaluation, the Chief Executive Officer and Chief Financial Officer have concluded that, as of such date, our disclosure controls and procedures were effective to meet the objective for which they were designed and operate at the reasonable assurance level.
Management's Report on Internal Control Over Financial Reporting
Our management is responsible for establishing and maintaining adequate internal control over financial reporting, as such term is defined in Exchange Act Rules 13a-15(f) and 15d-15(f). Under the supervision and with the participation of management, including our Chief Executive Officer and Chief Financial Officer, we conducted an evaluation of the effectiveness of our internal controls over financial reporting based on the framework in "Internal Control—Integrated Framework" issued by the Committee of Sponsoring Organizations of the Treadway Commission ("COSO"). Based on our evaluation, management has concluded that our internal control over financial reporting was effective as of March 23, 2012.
Our internal control over financial reporting includes those policies and procedures that (i) pertain to the maintenance of records that, in reasonable detail, accurately and fairly reflect the transactions and dispositions of the assets; (ii) provide reasonable assurance that transactions are recorded as necessary to permit preparation of financial statements in accordance with generally accepted accounting principles, and that receipts and expenditures are being made only in accordance with authorizations of management and directors; and (iii) provide reasonable assurance regarding prevention or timely detection of unauthorized acquisition, use, or disposition of our assets that could have a material effect on the financial statements. Internal control over financial reporting cannot provide absolute assurance of achieving financial reporting objectives because of the inherent limitations of any system of internal control. Internal control over financial reporting is a process that involves human diligence and compliance and is subject to lapses of judgment and breakdowns resulting
109
from human failures. Internal control over financial reporting also can be circumvented by collusion or improper overriding of controls. As a result of such limitations, there is risk that material misstatements may not be prevented or detected on a timely basis by internal control over financial reporting. However, these inherent limitations are known features of the financial reporting process. Therefore, it is possible to design into the process safeguards to reduce, though not eliminate, this risk.
Our independent registered public accounting firm, Ernst & Young LLP, which has audited and reported on our financial statements, issued an attestation report regarding our internal controls over financial reporting as of March 23, 2012. Ernst & Young LLP's report is included in this annual report below.
Inherent Limitations on Effectiveness of Controls
Our management, including our chief executive officer and chief financial officer, does not expect that our disclosure controls or our internal control over financial reporting will prevent or detect all errors and all fraud. A control system, no matter how well designed and operated, can provide only reasonable, not absolute, assurance that the control system's objectives will be met. The design of any system of controls is based in part on certain assumptions about the likelihood of future events, and there can be no assurance that any design will succeed in achieving its stated goals under all potential future conditions.
Changes in internal control over financial reporting
There were no changes in our internal control over financial reporting during the fiscal quarter ended March 23, 2012, that have materially affected, or are reasonably likely to materially affect, our internal control over financial reporting.
110
Report of Independent Registered Public Accounting Firm
The Board of Directors and Stockholders of RealD Inc.
We have audited RealD Inc.'s (the "Company") internal control over financial reporting as of March 23, 2012, based on criteria established in Internal Control—Integrated Framework issued by the Committee of Sponsoring Organizations of the Treadway Commission (the COSO criteria). RealD Inc.'s management is responsible for maintaining effective internal control over financial reporting, and for its assessment of the effectiveness of internal control over financial reporting included in the accompanying "Management's Report on Internal Control over Financial Reporting". Our responsibility is to express an opinion on the company's internal control over financial reporting based on our audit.
We conducted our audit in accordance with the standards of the Public Company Accounting Oversight Board (United States). Those standards require that we plan and perform the audit to obtain reasonable assurance about whether effective internal control over financial reporting was maintained in all material respects. Our audit included obtaining an understanding of internal control over financial reporting, assessing the risk that a material weakness exists, testing and evaluating the design and operating effectiveness of internal control based on the assessed risk, and performing such other procedures as we considered necessary in the circumstances. We believe that our audit provides a reasonable basis for our opinion.
A company's internal control over financial reporting is a process designed to provide reasonable assurance regarding the reliability of financial reporting and the preparation of financial statements for external purposes in accordance with generally accepted accounting principles. A company's internal control over financial reporting includes those policies and procedures that (1) pertain to the maintenance of records that, in reasonable detail, accurately and fairly reflect the transactions and dispositions of the assets of the company; (2) provide reasonable assurance that transactions are recorded as necessary to permit preparation of financial statements in accordance with generally accepted accounting principles, and that receipts and expenditures of the company are being made only in accordance with authorizations of management and directors of the company; and (3) provide reasonable assurance regarding prevention or timely detection of unauthorized acquisition, use, or disposition of the company's assets that could have a material effect on the financial statements.
Because of its inherent limitations, internal control over financial reporting may not prevent or detect misstatements. Also, projections of any evaluation of effectiveness to future periods are subject to the risk that controls may become inadequate because of changes in conditions, or that the degree of compliance with the policies or procedures may deteriorate.
In our opinion, RealD Inc. maintained, in all material respects, effective internal control over financial reporting as of March 23, 2012, based on the COSO criteria.
We also have audited, in accordance with the standards of the Public Company Accounting Oversight Board (United States), the consolidated balance sheets of RealD Inc. as of March 23, 2012 and March 25, 2011, and related consolidated statements of operations, changes in mandatorily redeemable convertible preferred stock and equity (deficit), and cash flows for each of the three years in the period ended March 23, 2012 of RealD Inc. and our report dated May 31, 2012 expressed an unqualified opinion thereon.
/s/ Ernst & Young LLP
Los
Angeles, California
May 31, 2012
111
Information required by this Item is incorporated by reference to the information contained in RealD's definitive Proxy Statement for its 2012 Annual Meeting of Stockholders under the headings "Compensation Discussion and Analysis".
Item 10. Directors, executive officers and corporate governance
Information required by this Item is incorporated by reference to the information contained in RealD's definitive Proxy Statement for its 2012 Annual Meeting of Stockholders under the headings "Proposal One—Election of Class II Directors," "Corporate Governance," and "Security Ownership of Management and Certain Beneficial Owners—Section 16(a) beneficial ownership reporting compliance".
Item 11. Executive compensation
Information required by this Item is incorporated by reference to the information contained in RealD's definitive Proxy Statement for its 2012 Annual Meeting of Stockholders under the headings "Compensation Discussion and Analysis," "Board structure—Compensation committee interlocks and insider participation," and "Compensation Committee Report".
Item 12. Security ownership of certain beneficial owners and management and related stockholder matters
Information required by this Item is incorporated by reference to the information contained in RealD's definitive Proxy Statement for its 2012 Annual Meeting of Stockholders under the headings "Security Ownership of Management and Certain Beneficial Owners" and "Equity Compensation Plan Information".
Item 13. Certain relationships and related transactions, and director independence
Information required by this Item is incorporated by reference to the information contained in RealD's definitive Proxy Statement for its 2012 Annual Meeting of Stockholders under the headings "Board Structure—Director Independence," "Compensation Discussion and Analysis—Executive employment agreements," "Proposal One—Election of Class II Directors," and "Corporate Governance".
Item 14. Principal accounting fees and services
Information required by this Item is incorporated by reference to the information contained in RealD's definitive Proxy Statement for its 2012 Annual Meeting of Stockholders under the headings "Proposal Two—Ratification of the Appointment of Independent Registered Public Accounting Firm for Fiscal Year 2013".
112
Item 15. Exhibit and financial statement schedules
- (a)
- The
following documents are filed as part of or are included in this Annual Report on Form 10-K:
- (1)
- Financial Statements
- (2)
- Financial Statement Schedules
See Index to Consolidated Financial Statements on page 73 of this Annual Report on Form 10-K.
Financial Statement Schedule II: Valuation and Qualifying Accounts that follows the Notes to Consolidated Financial Statements is filed as part of this Annual Report Form 10-K. Other financial statement schedules have been omitted since they are either not required or the information is otherwise included.
SCHEDULE II—VALUATION AND QUALIFYING ACCOUNTS
| |
Balance at beginning of period |
Additions charged to cost and expenses |
Other Adjustments/ Deductions(1) |
Balance at end of period |
|||||||||
|---|---|---|---|---|---|---|---|---|---|---|---|---|---|
Allowance for doubtful accounts and customer credits: |
|||||||||||||
Year ended March 23, 2012 |
$ | 6,803 | $ | — | $ | (2,579 | ) | $ | 4,224 | ||||
Year ended March 25, 2011 |
$ | 1,201 | $ | 5,432 | $ | 170 | $ | 6,803 | |||||
Year ended March 26, 2010 |
$ | 647 | $ | 816 | $ | (262 | ) | $ | 1,201 | ||||
Deferred tax valuation allowance: |
|||||||||||||
Year ended March 23, 2012 |
$ | 43,181 | $ | — | $ | (9,187 | ) | $ | 33,994 | ||||
Year ended March 25, 2011 |
$ | 38,195 | $ | 4,986 | $ | — | $ | 43,181 | |||||
Year ended March 26, 2010 |
$ | 21,857 | $ | 16,338 | $ | — | $ | 38,195 | |||||
- (1)
- Other adjustments and deductions primarily consist of adjustments to deferred revenue and write-offs of amounts previously charged to the provision.
- (3)
- List of Exhibits
The Exhibits filed as part of this Annual Report on Form 10-K, or incorporated by reference, are listed on the Exhibit Index immediately preceding such Exhibits, which Exhibit Index is incorporated herein by reference.
113
Pursuant to the requirements of Section 13 or 15(d) of the Securities Exchange Act of 1934, the Registrant has duly caused this report to be signed on its behalf by the undersigned, thereunto duly authorized.
| RealD Inc. (Registrant) |
||||
May 31, 2012 |
By: |
/s/ MICHAEL V. LEWIS Michael V. Lewis Chief Executive Officer |
||
Each person whose individual signature appears below hereby constitutes and appoints Michael V. Lewis, Andrew A. Skarupa and Craig S. Gatarz, and each of them, with full power of substitution and resubstitution and full power to act without the other, as his or her true and lawful attorney-in-fact and agent to act in his or her name, place and stead and to execute in the name and on behalf of each person, individually and in each capacity stated below, and to file any and all amendments to this Annual Report on Form 10-K, and to file the same, with all exhibits thereto, and other documents in connection therewith, with the Securities and Exchange Commission, granting unto said attorneys-in-fact and agents, and each of them, full power and authority to do and perform each and every act and thing, ratifying and confirming all that said attorneys-in-fact and agents or any of them or their or his substitute or substitutes may lawfully do or cause to be done by virtue thereof.
Pursuant to the requirements of the Securities Exchange Act of 1934, this report has been signed below by the following persons on behalf of the Registrant and in the capacities and on the dates indicated.
Signature
|
Title
|
Date
|
||
|---|---|---|---|---|
| /s/ MICHAEL V. LEWIS Michael V. Lewis |
Chief Executive Officer and Director (Principal Executive Officer) | May 31, 2012 | ||
/s/ ANDREW A. SKARUPA Andrew A. Skarupa |
Chief Operating Officer and Chief Financial Officer (Principal Financial Officer and Principal Accounting Officer) |
May 31, 2012 |
||
/s/ FRANK J. BIONDI, JR. Frank J. Biondi, Jr. |
Director |
May 31, 2012 |
||
/s/ RICHARD L. GRAND-JEAN Richard L. Grand-Jean |
Director |
May 31, 2012 |
114
Signature
|
Title
|
Date
|
||
|---|---|---|---|---|
| /s/ JOSHUA GREER Joshua Greer |
Director | May 31, 2012 | ||
/s/ SHERRY LANSING Sherry Lansing |
Director |
May 31, 2012 |
||
/s/ DAVID HABIGER David Habiger |
Director |
May 31, 2012 |
||
/s/ P. GORDON HODGE P. Gordon Hodge |
Director |
May 31, 2012 |
||
/s/ JAMES CAMERON James Cameron |
Director |
May 31, 2012 |
115
| |
|
Incorporated by Reference | |
||||||||||||||||
|---|---|---|---|---|---|---|---|---|---|---|---|---|---|---|---|---|---|---|---|
| Exhibit Number |
Exhibit Description | Form | SEC File No. |
Exhibit | Filing Date | Filed Herewith | |||||||||||||
| 3.1 | Amended and Restated Certificate of Incorporation as filed with the Secretary of State of the State of Delaware on July 15, 2010. | 10-Q | 001-34818 | 3.1 | July 28, 2011 | ||||||||||||||
| 3.2 | Amended and Restated Bylaws as became effective on July 15, 2010. | 10-Q | 001-34818 | 3.2 | July 28, 2011 | ||||||||||||||
| 4.1 | Specimen of common stock certificate. | S-1/A | 333-165988 | 4.1 | May 26, 2010 | ||||||||||||||
| 4.2 | Amended and Restated Investors' Rights Agreement, dated December 24, 2007, by and among the registrant, the founders and the investors named therein. | S-1/A | 333-165988 | 4.2 | May 26, 2010 | ||||||||||||||
| 4.3 | Amendment and Agreement to Amended and Restated Investors' Rights Agreement, dated June 11, 2010, by and among the registrant and the other signatories thereto. | S-1/A | 333-165988 | 4.6 | June 28, 2010 | ||||||||||||||
| 4.4 | Side letter, dated June 25, 2010, to Amended and Restated Investors' Rights Agreement, as amended. | S-1/A | 333-165988 | 4.8 | June 28, 2010 | ||||||||||||||
| 10.1 | # | 2004 Amended and Restated Stock Incentive Plan. | S-1/A | 333-165988 | 10.1 | June 28, 2010 | |||||||||||||
| 10.2 | # | Form of Stock Option Agreement for 2004 Amended and Restated Stock Incentive Plan. | S-1 | 333-165988 | 10.2 | April 9, 2010 | |||||||||||||
| 10.3 | # | 2010 Stock Incentive Plan. | S-1/A | 333-165988 | 10.3 | June 28, 2010 | |||||||||||||
| 10.4 | # | 2010 Stock Incentive Plan—Form of Nonstatutory Stock Option Agreement between the Chief Executive Officer and the registrant. | S-1/A | 333-165988 | 10.4 | June 28, 2010 | |||||||||||||
116
| |
|
Incorporated by Reference | |
||||||||||||||||
|---|---|---|---|---|---|---|---|---|---|---|---|---|---|---|---|---|---|---|---|
| Exhibit Number |
Exhibit Description | Form | SEC File No. |
Exhibit | Filing Date | Filed Herewith | |||||||||||||
| 10.5 | # | 2010 Stock Incentive Plan—Form of Nonstatutory Stock Option Agreement between the executive officers and the registrant. | S-1/A | 333-165988 | 10.5 | June 28, 2010 | |||||||||||||
| 10.6 | # | 2010 Stock Incentive Plan—Form of Performance Stock Option Agreement issued in connection with the initial public offering between the Chief Executive Officer and the registrant. | S-1/A | 333-165988 | 10.6 | June 28, 2010 | |||||||||||||
| 10.7 | # | 2010 Stock Incentive Plan—Form of Performance Stock Option Agreement issued in connection with the initial public offering between the executive officers and the registrant. | S-1/A | 333-165988 | 10.7 | June 28, 2010 | |||||||||||||
| 10.8 | # | 2010 Stock Incentive Plan—Form of Stock Unit Agreement between the non-employee directors and the registrant. | S-1/A | 333-165988 | 10.8 | June 28, 2010 | |||||||||||||
| 10.9 | # | Employment Agreement, dated May 25, 2010, between Michael V. Lewis and the registrant. | S-1/A | 333-165988 | 10.9 | June 28, 2010 | |||||||||||||
| 10.10 | # | Employee Invention Assignment and Confidentiality Agreement dated May 25, 2010 between Michael V. Lewis and the registrant. | S-1/A | 333-165988 | 10.10 | June 28, 2010 | |||||||||||||
| 10.11 | # | Indemnification Agreement, dated April 8, 2010, between Michael V. Lewis and the registrant. | S-1/A | 333-165988 | 10.11 | May 26, 2010 | |||||||||||||
| 10.12 | # | Form of Separation Agreement and General Release of Claims between Michael V. Lewis and the registrant. | S-1/A | 333-165988 | 10.12 | May 26, 2010 | |||||||||||||
117
| |
|
Incorporated by Reference | |
||||||||||||||||
|---|---|---|---|---|---|---|---|---|---|---|---|---|---|---|---|---|---|---|---|
| Exhibit Number |
Exhibit Description | Form | SEC File No. |
Exhibit | Filing Date | Filed Herewith | |||||||||||||
| 10.13 | # | Form of Indemnification Agreement between the registrant and its directors and officers. | S-1 | 333-165988 | 10.13 | April 9, 2010 | |||||||||||||
| 10.14 | + | Real D System License Agreement (U.S. 2008), dated October 15, 2008, by and between REGAL Cinemas, Inc. and the registrant. | S-1/A | 333-165988 | 10.14 | June 28, 2010 | |||||||||||||
| 10.15 | + | Real D Nonqualified Stock Option Grant and Real D Stock Option Agreement, both dated, October 15, 2008, by and between REGAL Cinemas, Inc. and the registrant. | S-1/A | 333-165988 | 10.15 | May 10, 2010 | |||||||||||||
| 10.16 | + | Amended and Restated Real D System License Agreement (U.S. 2009), dated May 19, 2009, by and between Cinemark USA, Inc. and the registrant. | S-1/A | 333-165988 | 10.16 | June 28, 2010 | |||||||||||||
| 10.17 | + | Real D Nonqualified Stock Option Grant and Real D Stock Option Agreement, both dated May 19, 2009, by and between Cinemark USA, Inc. and the registrant. | S-1/A | 333-165988 | 10.17 | May 10, 2010 | |||||||||||||
| 10.18 | + | Second Amended and Restated RealD System License Agreement (2010), dated May 9, 2010, by and between American Multi-Cinema, Inc. and the registrant. | S-1/A | 333-165988 | 10.18 | June 28, 2010 | |||||||||||||
| 10.19 | Operating Agreement of Digital Link II, LLC, dated March 2, 2007. | S-1/A | 333-165988 | 10.19 | May 10, 2010 | ||||||||||||||
118
| |
|
Incorporated by Reference | |
||||||||||||||||
|---|---|---|---|---|---|---|---|---|---|---|---|---|---|---|---|---|---|---|---|
| Exhibit Number |
Exhibit Description | Form | SEC File No. |
Exhibit | Filing Date | Filed Herewith | |||||||||||||
| 10.20 | + | RealD Inc. Amended and Restated Nonqualified Stock Option Grant and RealD Inc. Amended and Restated Stock Option Agreement, both dated May 9, 2010, by and between American Multi-Cinema, Inc. and the registrant. | S-1/A | 333-165988 | 10.24 | May 10, 2010 | |||||||||||||
| 10.21 | # | Director Offer Letter and Consent, dated May 17, 2010, by and between P. Gordon Hodge and the registrant. | S-1/A | 333-165988 | 10.25 | May 26, 2010 | |||||||||||||
| 10.22 | # | Employment Agreement, dated May 25, 2010, between Andrew A. Skarupa and the registrant. | S-1/A | 333-165988 | 10.27 | June 28, 2010 | |||||||||||||
| 10.23 | # | Employment Agreement, dated May 25, 2010, between Joshua Greer and the registrant. | S-1/A | 333-165988 | 10.28 | June 28, 2010 | |||||||||||||
| 10.24 | # | Employment Agreement, dated May 25, 2010, between Joseph Peixoto and the registrant. | S-1/A | 333-165988 | 10.29 | June 28, 2010 | |||||||||||||
| 10.25 | # | Employment Agreement, dated May 25, 2010, between Robert Mayson and the registrant. | S-1/A | 333-165988 | 10.30 | June 28, 2010 | |||||||||||||
| 10.26 | # | Form of Separation Agreement and General Release of Claims between the registrant and Andrew A. Skarupa, Joshua Greer, Joseph Peixoto and Robert Mayson. | S-1/A | 333-165988 | 10.31 | May 26, 2010 | |||||||||||||
119
| |
|
Incorporated by Reference | |
||||||||||||||||
|---|---|---|---|---|---|---|---|---|---|---|---|---|---|---|---|---|---|---|---|
| Exhibit Number |
Exhibit Description | Form | SEC File No. |
Exhibit | Filing Date | Filed Herewith | |||||||||||||
| 10.27 | # | Form of Employee Invention Assignment and Confidentiality Agreement between the registrant and Andrew A. Skarupa, Joshua Greer, Joseph Peixoto, Robert Mayson and other non-executive employees. | S-1/A | 333-165988 | 10.32 | May 26, 2010 | |||||||||||||
| 10.28 | # | Employment Agreement, dated January 21, 2010, between Craig Gatarz and the registrant. | S-1/A | 333-165988 | 10.33 | May 26, 2010 | |||||||||||||
| 10.29 | Credit and Security Agreement, dated June 24, 2010, by and between City National Bank and the registrant. | S-1/A | 333-165988 | 10.34 | June 28, 2010 | ||||||||||||||
| 10.30 | # | Amended and Restated Agreement of Employment, dated September 1, 2007, between Andrew A. Skarupa and the registrant. | S-1/A | 333-165988 | 10.35 | June 28, 2010 | |||||||||||||
| 10.31 | # | Amended and Restated Agreement of Employment, dated September 1, 2007, between Joseph Peixoto and the registrant. | S-1/A | 333-165988 | 10.36 | June 28, 2010 | |||||||||||||
| 10.32 | # | Employment Agreement, dated February 25, 2010, between Robert Mayson and the registrant. | S-1/A | 333-165988 | 10.37 | May 26, 2010 | |||||||||||||
| 10.33 | # | Employment Agreement, dated November 5, 2008, between Robert Mayson and RealD Europe Limited. | S-1/A | 333-165988 | 10.38 | May 26, 2010 | |||||||||||||
| 10.34 | # | Director Offer Letter and Consent, dated May 20, 2010, by and between Sherry Lansing and the registrant. | S-1/A | 333-165988 | 10.39 | May 26, 2010 | |||||||||||||
120
| |
|
Incorporated by Reference | |
||||||||||||||||
|---|---|---|---|---|---|---|---|---|---|---|---|---|---|---|---|---|---|---|---|
| Exhibit Number |
Exhibit Description | Form | SEC File No. |
Exhibit | Filing Date | Filed Herewith | |||||||||||||
| 10.35 | # | Director Offer Letter and Consent, dated May 17, 2010, by and between Frank J. Biondi, Jr. and the registrant. | S-1/A | 333-165988 | 10.40 | May 26, 2010 | |||||||||||||
| 10.36 | # | Director Offer Letter and Consent, dated May 17, 2010, by and between Richard Grand-Jean and the registrant. | S-1/A | 333-165988 | 10.41 | May 26, 2010 | |||||||||||||
| 10.37 | # | Director Offer Letter and Consent, dated May 20, 2010, by and between James Cameron and the registrant. | S-1/A | 333-165988 | 10.42 | June 28, 2010 | |||||||||||||
| 10.38 | # | 2010 Management Incentive Plan. | S-1/A | 333-165988 | 10.43 | June 28, 2010 | |||||||||||||
| 10.39 | # | Employment Agreement, dated October 18, 2010, between Craig Gatarz and the registrant. | S-1 | 333-170766 | 10.39 | November 22, 2010 | |||||||||||||
| 10.40 | + | First Amendment to Real D System License Agreement (U.S. 2008), dated as of January 26, 2011, by and between RealD Inc. and Regal Cinemas, Inc. | 8-K | 001-34818 | 10.1 | January 27, 2011 | |||||||||||||
| 10.41 | First Amendment to Credit and Security Agreement, dated as of April 5, 2011, between RealD, Inc. and City National Bank. | 8-K | 001-34818 | 10.1 | April 8, 2011 | ||||||||||||||
| 10.42 | Continuing Guaranty, dated as of April 5, 2011, executed by ColorLink Inc. in favor of City National Bank. | 8-K | 001-34818 | 10.2 | April 8, 2011 | ||||||||||||||
| 10.43 | Continuing Guaranty, dated as of April 5, 2011, executed by Stereographics Corporation in favor of City National Bank. | 8-K | 001-34818 | 10.3 | April 8, 2011 | ||||||||||||||
121
| |
|
Incorporated by Reference | |
||||||||||||||||
|---|---|---|---|---|---|---|---|---|---|---|---|---|---|---|---|---|---|---|---|
| Exhibit Number |
Exhibit Description | Form | SEC File No. |
Exhibit | Filing Date | Filed Herewith | |||||||||||||
| 10.44 | # | Separation Agreement and General Release of Claims, dated as of May 16, 2011, by and between Joshua Greer and the registrant. | 10-K | 001-34818 | 10.44 | June 9, 2011 | |||||||||||||
| 10.45 | # | Consulting Agreement, dated as of May 16, 2011, by and between Joshua Greer and the registrant. | 10-K | 001-34818 | 10.45 | June 9, 2011 | |||||||||||||
| 10.46 | # | 2010 Stock Incentive Plan—Form of Stock Unit Agreement between the executive officers and the registrant. | 10-K | 001-34818 | 10.46 | June 9, 2011 | |||||||||||||
| 10.47 | + | First Amendment to Amended and Restated RealD System License Agreement (U.S. 2009), dated as of July 20, 2011, by and between Cinemark USA, Inc. and the registrant. | 8-K | 001-34818 | 10.1 | July 21, 2011 | |||||||||||||
| 10.48 | + | Amendment Number 1 to the Second Amended and Restated RealD System License Agreement, dated as of July 28, 2011, by and between American Multi-Cinema, Inc. and the registrant. | S-1 | 333-165988 | 10.48 | April 9, 2010 | |||||||||||||
| 10.49 | # | RealD 2011 Employee Stock Purchase Plan. | 8-K | 001-34818 | 10.1 | August 1, 2011 | |||||||||||||
| 10.50 | Second Amendment to Credit and Security Agreement, dated as of December 6, 2011, between City National Bank and the registrant, acknowledged by each of ColorLink, Inc. and Stereographics Corporation. | 8-K | 001-34818 | 10.1 | December 8, 2011 | ||||||||||||||
| 10.51 | # | Employment Agreement, dated April 18, 2012, between Robert Mayson and the registrant. | 8-K | 001-34818 | 10.1 | April 18, 2012 | |||||||||||||
122
| |
|
Incorporated by Reference | |
||||||||||||||||
|---|---|---|---|---|---|---|---|---|---|---|---|---|---|---|---|---|---|---|---|
| Exhibit Number |
Exhibit Description | Form | SEC File No. |
Exhibit | Filing Date | Filed Herewith | |||||||||||||
| 10.52 | # | Secondment Letter, dated April 18, 2012, by and between Robert Mayson and the registrant. | 8-K | 001-34818 | 10.2 | April 18, 2012 | |||||||||||||
| 10.53 | + | Credit Agreement, dated as of April 19, 2012, among City National Bank, U.S. Bank National Association, HSBC Bank USA, N.A., the lenders party thereto and the registrant. | 8-K/A | 001-34818 | 10.1 | April 25, 2012 | |||||||||||||
| 10.54 | General Continuing Guaranty, dated as of April 19, 2012, executed by Stereographics Corporation and ColorLink Inc. in favor of City National Bank and the lenders party to the Credit Agreement, dated as of April 19, 2012. | 8-K/A | 001-34818 | 10.2 | April 25, 2012 | ||||||||||||||
| 10.55 | + | Security Agreement, dated as of April 19, 2012, among Stereographics Corporation, ColorLink Inc., City National Bank and the registrant. | 8-K/A | 001-34818 | 10.3 | April 25, 2012 | |||||||||||||
| 21.1 | List of significant subsidiaries of the registrant. | X | |||||||||||||||||
| 23.1 | Consent of Independent Registered Public Accounting Firm. | X | |||||||||||||||||
| 24.1 | Power of Attorney (included on signature page to this Annual Report on Form 10-K). | X | |||||||||||||||||
| 31.1 | Certification of Principal Executive Officer required by Rule 13a-14(a) or Rule 15d-14(a) of the Securities Exchange Act of 1934, as adopted pursuant to Section 302 of the Sarbanes-Oxley Act of 2002. | X | |||||||||||||||||
123
| |
|
Incorporated by Reference | |
||||||||||||||||
|---|---|---|---|---|---|---|---|---|---|---|---|---|---|---|---|---|---|---|---|
| Exhibit Number |
Exhibit Description | Form | SEC File No. |
Exhibit | Filing Date | Filed Herewith | |||||||||||||
| 31.2 | Certification of Principal Financial Officer required by Rule 13a-14(a) or Rule 15d-14(a) of the Securities Exchange Act of 1934, as adopted pursuant to Section 302 of the Sarbanes-Oxley Act of 2002. | X | |||||||||||||||||
| 32.1 | Certification of Chief Executive Officer pursuant to 18 U.S.C. Section 1350, as adopted pursuant to Section 906 of the Sarbanes-Oxley Act of 2002. | X | |||||||||||||||||
| 32.2 | Certification of Chief Financial Officer pursuant to 18 U.S.C. Section 1350, as adopted pursuant to Section 906 of the Sarbanes-Oxley Act of 2002. | X | |||||||||||||||||
| 101.INS | * | XBRL Instance Document. | |||||||||||||||||
| 101.SCH | * | XBRL Taxonomy Extension Schema Document. | |||||||||||||||||
| 101.CAL | * | XBRL Taxonomy Extension Calculation Linkbase Document. | |||||||||||||||||
| 101.DEF | * | XBRL Taxonomy Extension Definition Linkbase Document. | |||||||||||||||||
| 101.LAB | * | XBRL Taxonomy Extension Label Linkbase Document. | |||||||||||||||||
| 101.PRE | * | XBRL Taxonomy Extension Presentation Linkbase Document. | |||||||||||||||||
- +
- Certain
provisions of this exhibit have been omitted pursuant to a request for confidential treatment.
- #
- Indicates
management contract or compensatory plan, contract, or agreement.
- *
- XBRL (Extensible Business Reporting Language) information is furnished and not filed herewith, is not a part of a registration statement or Prospectus for purposes of sections 11 or 12 of the Securities Act of 1933, is deemed not filed for purposes of section 18 of the Securities Exchange Act of 1934, and otherwise is not subject to liability under these sections.
124