Attached files
| file | filename |
|---|---|
| 8-K - 8-K - M&T BANK CORP | d360248d8k.htm |
 Sanford C. Bernstein
Strategic Decisions Conference 2012
May 31, 2012
Exhibit 99 |
 2
Disclaimer
This presentation contains forward looking statements within the meaning of the Private
Securities Litigation Reform Act giving the Company's expectations or predictions of
future financial or business performance or conditions. Forward-looking
statements are typically identified by words such as "believe," "expect," "anticipate," "intend,"
"target," "estimate," "continue," "positions,"
"prospects" or "potential," by future conditional verbs such as "will,"
"would," "should," "could" or "may," or by variations of such
words or by similar expressions. These forward-looking statements are subject
to numerous assumptions, risks and uncertainties which change over time. Forward-looking
statements speak only as of the date they are made and we assume no duty to update
forward-looking statements.
In addition to factors previously disclosed in our SEC reports and those identified elsewhere
in this presentation, the following factors among others, could cause actual results to
differ materially from forward-looking statements or historical performance:
changes in asset quality and credit risk; the inability to sustain revenue and earnings growth;
changes in interest rates and capital markets; inflation; customer acceptance of M&T
products and services; customer borrowing, repayment, investment and deposit practices;
customer disintermediation; the introduction, withdrawal, success and timing of
business initiatives; competitive conditions; the inability to realize cost savings or
revenues or to implement integration plans and other consequences associated with mergers,
acquisitions and divestitures; economic conditions; and the impact, extent and timing
of technological changes, capital management activities, and other actions of the
Federal Reserve Board and legislative and regulatory actions and reforms, including
those associated with the Dodd-Frank Wall Street Reform and Consumer Protection Act.
Annualized, pro forma, projected and estimated numbers are used for illustrative purpose only,
are not forecasts and may not reflect actual results.
|
 3
Top 20 US-based full-service commercial
bank holding company by assets and Top 15
by market cap
Founded in 1856
$79 billion total assets
761
domestic branches and more than 2,000
ATMs
15,479 employees located in New York,
Maryland, Pennsylvania, Washington, D.C.,
Virginia, West Virginia and Delaware
Over 2 million consumer/retail household
customers
208,000 commercial customers
M&T Bank Corporate Profile
As of 03/31/12 |
 4
Most honored bank in 2011 Greenwich Excellence Awards for Small Business
Banking: 12 national awards and 2 regional awards
Highest number of awards among all 750 banks rated by business customers
Received the highest possible Community Reinvestment Act (CRA) rating on every
exam since 1982
M&T Charitable Foundation has contributed over $147 million to
not-for-profit organizations in its communities over the past 10
years Contributed $40 million to M&T Charitable Foundation in 2011
More than 3,000 M&T employees volunteer with
5,100 different not-for-profit organizations
Strong long-term returns for shareholders
Customers, Communities & Shareholders |
 5
Strong Presence In Our Communities
#1 Small Business Administration
Lender in:
Baltimore
Binghamton
Buffalo
Philadelphia
Rochester
Syracuse
Washington, DC
Wilmington
Ranked 6
th
Nationally
Ranked 3
rd
in Eastern U.S.
#1 market share for lead bank
relationships
among middle market clients in:
(1)
Baltimore
Binghamton
Buffalo
Harrisburg
Northern Pennsylvania
Rochester
Syracuse
State of Maryland overall
State of Delaware overall
(1)
Independent 3
party market research
(2)
Reflects in-market deposits only
#1 or #2 deposit market share
in 8 of top 10 communities:
#2 in Baltimore
#1 in Binghamton
#1 in Buffalo
#2 in Harrisburg
#2 in Rochester
#1 in Syracuse
#1 Wilmington / State of Delaware
(2)
#1 in York
We lend in the markets where we live and work to people and enterprises whom we
know rd |
  6
GAAP Earnings
2006
2007
2008
2009
2010
2011
1Q12
Net Income ($MM)
839
654
556
380
736
859
206
EPS ($ per share)
7.37
5.95
5.01
2.89
5.69
6.35
1.50
Net Operating Earnings
Net Operating Income ($MM)
881
704
599
455
755
884
218
Net Operating EPS ($ per share)
7.73
6.40
5.39
3.54
5.84
6.55
1.59
Earnings Summary
Net Operating Income and Net Operating EPS are non-GAAP financial measures (Excludes
merger-related gains and expenses and amortization expense associated with intangible
assets ). Refer to the Appendix for a reconciliation between these measures and GAAP |
 7
Strong
credit
through
crisis
Focused
on returns
Consistent
capital
generation
(1)
The Efficiency Ratio and Pre-tax, Pre-provision Earnings are non-GAAP
financial measures. A reconciliation of GAAP to non-GAAP financial
measures is available in the appendix. The Efficiency Ratio reflects
non-interest expense (excluding amortization expense associated with
intangible assets and merger-related expenses) as a percentage of fully taxable
equivalent net interest income and non-interest revenues (excluding
gains or losses from securities transactions and merger-related gains).
(2)
Excludes merger-related gains and expenses and amortization expense associated
with intangible assets. Key Measures
2006
2007
2008
2009
2010
2011
1Q12
Net Interest Margin
3.70%
3.60%
3.38%
3.49%
3.84%
3.73%
3.69%
Efficiency
Ratio
-
Tangible
(1)
51.51%
52.77%
54.35%
56.50%
53.71%
60.43%
61.09%
Pre-tax, Pre-provision Earnings ($MM)
(1)
1,312
1,156
1,152
1,123
1,461
1,495
357
Allowance to Loans (As At)
1.51%
1.58%
1.61%
1.69%
1.74%
1.51%
1.49%
Net Charge-Offs to Loans
0.16%
0.26%
0.78%
1.01%
0.67%
0.47%
0.32%
Net Operating Return on
Tangible Assets
(2)
1.67%
1.27%
0.97%
0.71%
1.17%
1.26%
1.18%
Tangible Common Equity
(2)
29.55%
22.58%
19.63%
13.42%
18.95%
17.96%
16.79%
Common
Equity
to
Assets
-
Tangible
5.84%
5.01%
4.59%
5.13%
6.19%
6.40%
6.51%
Tier 1 Common Capital Ratio
6.42%
5.62%
6.08%
5.66%
6.51%
6.86%
7.04%
Tier 1 Capital Ratio
7.74%
6.84%
8.83%
8.59%
9.47%
9.68%
9.85%
Total Capital Ratio
11.78%
11.18%
12.83%
12.30%
13.08%
13.26%
13.43%
Leverage Ratio
7.20%
6.59%
8.35%
8.43%
9.33%
9.28%
9.53%
TBV per Share
28.57
27.98
25.94
28.27
33.26
37.79
38.89
Superior
pre-credit
earnings |
 8
Efficiency Ratio
M&T’s Philosophy: Efficiently Delivering Banking Services
52.25%
60.43%
61.09%
56.28%
64.33%
65.02%
45%
50%
55%
60%
65%
70%
'00
'01
'02
'03
'04
'05
'06
'07
'08
'09
'10
'11
1Q12
MTB
Peer Median
Efficiency Ratio reflects non-interest expense (excluding amortization expense associated with
intangible assets, merger-related expenses and other non-recurring expenses) as a
percentage of fully taxable equivalent net interest income and non-interest revenues (excluding gains from securities
transactions and merger-related gains). The Efficiency Ratio is a non-GAAP
measure. See Appendix for a reconciliation to GAAP measures. 2011 & 1Q12 results influenced by Wilmington Trust
|
 9
51.5%
60.4%
46.0%
48.0%
50.0%
52.0%
54.0%
56.0%
58.0%
60.0%
62.0%
MTB Efficiency
Ratio - 2006
Elevated Credit
Cycle Expenses
Higher FDIC
Expenses
Lower Revenue
from Reg E &
Durbin
Wilmington Trust
Impact
MTB Efficiency
Ratio - 2011
Drivers
of
Increase
in
Efficiency
Ratio
2006
-
2011
Estimated
Drivers
of
M&T’s
Increased
Efficiency
Ratio:
2006
-
2011
1.5 –
2.0%
2.5 –
3.0%
1.0 –
1.5%
2.5 –
3.0%
Efficiency
Ratio
reflects
non-interest
expense
(excluding
amortization
expense
associated
with
intangible
assets,
merger-related
expenses
and
other
non-recurring expenses) as a percentage of fully taxable equivalent net
interest income and non-interest revenues (excluding gains from securities
transactions and merger-related gains). |
 10
M&T’s Community Lending –
Granular Loan Portfolio
Source: M&T Bank Corporation 2011 10-K
Key attributes: many small loans and moderate risk geography
Dollars in Billions
Total Commercial & Industrial
$4.1
$4.1
$6.3
$0.9
$0.2
$0.1
$15.7
Percent by Size
26%
26%
40%
6%
1%
1%
100%
Total Commercial Real Estate
$3.7
$7.8
$9.8
$1.7
$1.2
$0.2
$24.4
Percent by Size
15%
32%
40%
7%
5%
1%
100%
Total Commercial Loans
$7.8
$11.9
$16.1
$2.7
$1.4
$0.3
$40.1
Percent by Size
19%
30%
40%
7%
4%
1%
100%
Cumulative Percent by Size
19%
49%
89%
96%
99%
100%
Total
Commercial
Loans
-
$40.1
Billion
At December 31, 2011
Commercial Loan Granularity
$0-1
$1-5
$5-30
$30-50
$50-100
$100+
Million
Million
Million
Million
Million
Million
Totals |
 11
Relative Loss Rate
(1)
BBT
CMA
COF
FITB
HBAN
KEY
MTB
PNC
RF
SNV
STI
ZION
BAC
C
JPM
USB
WFC
1991
39%
38%
NA
60%
40%
57%
61%
95%
22%
39%
61%
82%
159%
NA
230%
74%
60%
1992
40%
52%
NA
62%
59%
81%
68%
99%
28%
64%
55%
40%
94%
NA
154%
100%
62%
1993
28%
54%
NA
45%
43%
65%
76%
95%
32%
58%
60%
(36%)
60%
NA
187%
92%
84%
1994
35%
56%
NA
68%
56%
56%
55%
81%
54%
92%
57%
46%
69%
NA
265%
85%
113%
1995
71%
79%
NA
69%
74%
50%
70%
100%
52%
96%
64%
27%
82%
NA
119%
71%
137%
1996
96%
76%
NA
112%
91%
81%
101%
77%
51%
77%
77%
41%
93%
NA
101%
73%
142%
1997
118%
75%
NA
121%
100%
107%
111%
87%
81%
83%
61%
79%
102%
NA
67%
137%
172%
1998
76%
65%
NA
127%
90%
95%
95%
125%
100%
79%
91%
81%
164%
NA
96%
94%
338%
1999
75%
58%
NA
107%
75%
88%
85%
58%
113%
62%
79%
93%
101%
107%
119%
122%
127%
2000
60%
40%
NA
48%
70%
98%
43%
51%
90%
45%
35%
90%
100%
Bernstein bank analysis of Relative Loss Rates –
Focused on Long Term Underwriting Trends
Source: FDIC and Sanford Bernstein. (1) Expected loss
rates for each period are calculated by multiplying each bank's loan concentration by type by the actual industry-wide loss rate by
type. Dividing each bank's actual NCO rate by the expected loss rate yields the bank's relative
loss rate. JPM, PNC and WFC 2009 and 2010 results affected by recent acquisitions of WaMu,
National City, Wachovia, respectively. 148%
86%
122%
111%
2001
65%
46%
NA
70%
103%
112%
53%
298%
81%
38%
46%
43%
111%
114%
85%
128%
98%
2002
67%
96%
NA
44%
121%
118%
59%
56%
62%
38%
62%
53%
87%
116%
117%
90%
81%
2003
71%
102%
NA
74%
106%
106%
44%
76%
71%
62%
52%
69%
82%
113%
85%
100%
79%
2004
94%
139%
NA
91%
93%
149%
58%
71%
128%
92%
53%
74%
89%
125%
100%
91%
103%
2005
92%
121%
136%
112%
118%
135%
62%
20%
130%
151%
56%
56%
119%
137%
84%
86%
135%
2006
98%
61%
171%
123%
117%
78%
62%
103%
144%
147%
72%
80%
116%
155%
80%
76%
144%
2007
77%
75%
147%
98%
332%
70%
56%
67%
75%
124%
67%
47%
94%
141%
87%
67%
129%
2008
63%
90%
166%
228%
156%
130%
69%
60%
132%
121%
94%
81%
105%
144%
98%
70%
134%
2009
67%
82%
133%
116%
165%
140%
46%
65%
101%
188%
104%
118%
107%
155%
109%
69%
83%
2010
103%
70%
117%
128%
115%
138%
33%
85%
155%
219%
115%
117%
105%
145%
107%
79%
97%
2011
108%
76%
95%
104%
85%
95%
36%
79%
181%
183%
125%
97%
108%
157%
88%
83%
96%
2008Q1
58%
141%
182%
133%
59%
74%
49%
66%
67%
127%
100%
78%
93%
135%
107%
63%
128%
2008Q2
54%
98%
168%
127%
58%
240%
77%
56%
80%
82%
81%
64%
97%
135%
98%
65%
100%
2008Q3
63%
86%
162%
145%
62%
107%
64%
51%
130%
101%
83%
74%
97%
132%
103%
70%
112%
2008Q4
57%
60%
152%
355%
289%
89%
66%
59%
169%
129%
87%
84%
104%
152%
82%
65%
133%
2009Q1
77%
78%
142%
109%
185%
136%
48%
51%
92%
181%
96%
87%
108%
164%
94%
70%
72%
2009Q2
64%
89%
113%
104%
143%
115%
46%
71%
85%
170%
94%
133%
108%
154%
106%
63%
74%
2009Q3
60%
84%
115%
122%
148%
133%
43%
57%
114%
234%
118%
139%
116%
145%
114%
66%
85%
2009Q4
55%
72%
124%
106%
168%
151%
36%
68%
103%
147%
90%
92%
94%
153%
109%
63%
84%
2010Q1
68%
78%
106%
106%
111%
146%
32%
67%
137%
181%
114%
100%
102%
118%
108%
68%
94%
2010Q2
100%
69%
96%
91%
140%
140%
30%
91%
144%
267%
111%
118%
102%
125%
88%
77%
93%
2010Q3
143%
65%
105%
215%
97%
124%
35%
73%
178%
154%
114%
117%
93%
149%
93%
76%
95%
2010Q4
87%
59%
104%
83%
89%
102%
29%
99%
163%
255%
104%
126%
93%
150%
104%
73%
91%
2011Q1
90%
79%
98%
109%
109%
107%
38%
86%
154%
177%
120%
109%
98%
166%
88%
78%
94%
2011Q2
106%
83%
91%
98%
67%
85%
30%
74%
188%
202%
114%
93%
108%
153%
87%
82%
90%
2011Q3
108%
76%
79%
91%
71%
78%
29%
70%
193%
184%
120%
92%
116%
144%
75%
76%
90%
2011Q4
105%
58%
100%
86%
68%
77%
39%
64%
174%
158%
117%
87%
101%
151%
97%
75%
94%
Cycle Cumul.
80%
77%
117%
129%
136%
120%
42%
70%
133%
178%
103%
103%
101%
145%
98%
70%
95%
10-Yr Avg
83%
85%
131%
120%
137%
123%
47%
71%
126%
161%
95%
97%
102%
141%
99%
78%
101%
5-Yr Avg
84%
78%
126%
135%
146%
125%
45%
73%
135%
183%
107%
105%
105%
152%
101%
73%
101%
Median
71%
75%
136%
98%
93%
95%
61%
79%
81%
83%
62%
74%
101%
141%
100%
86%
111%
St Dev
25%
25%
27%
42%
61%
30%
21%
53%
44%
53%
23%
34%
25%
19%
51%
21%
58% |
 12
Industry Aggregate NCOs and MTB Relative Loss Rate
Source: Regulatory Data per SNL. Relative Loss Rate per Bernstein Research,
with post-publication updates 61% 68% 76% 55% 70%
101% 111% 95% 85% 43% 53% 59% 44% 58% 62% 62% 56% 69% 44% 32% 34%
MTB Relative
Loss Rate
MTB
vs.
Industry
-
relative
loss
experience,
after
adjusting
MTB
loan
mix
to
industry
loan
mix
Industry Aggregate Net Charge-off Ratio
MTB Net Charge-off Ratio
Over the long-term, M&T recorded significantly less net charge-offs vs.
the Industry |
 13
17.5%
16.0%
11.1%
10.3%
9.6%
9.3%
8.0%
7.8%
6.9%
6.0%
5.1%
3.1%
Peer Median
8.6%
Industry 9.6%
0%
5%
10%
15%
20%
Peer 1
Peer 2
Peer 3
Peer 4
Peer 5
Peer 6
Peer 7
Peer 8
Peer 9
Peer 10
Peer 11
MTB
Total Loans
9.3%
9.1%
8.7%
8.5%
7.5%
7.1%
4.8%
4.1%
4.0%
3.8%
2.8%
0.6%
Peer Median
5.9%
Industry 3.6%
0%
3%
6%
9%
12%
Peer 1
Peer 2
Peer 3
Peer 4
Peer 5
Peer 6
Peer 7
Peer 8
Peer 9
Peer 10
Peer 11
MTB
Comm. Real Estate
15.7%
11.0%
8.9%
8.5%
7.7%
6.7%
6.1%
5.0%
4.9%
4.5%
3.4%
2.9%
Peer Median
6.4%
Industry 6.0%
0%
5%
9%
14%
18%
Peer 1
Peer 2
Peer 3
Peer 4
Peer 5
Peer 6
Peer 7
Peer 8
Peer 9
Peer 10
Peer 11
MTB
Commercial & Industrial
36.5%
33.2%
29.9%
26.4%
21.3%
20.8%
19.8%
16.6%
15.7%
15.3%
10.2%
8.0%
Peer Median
20.3%
Industry 17.5%
0%
10%
20%
30%
40%
Peer 1
Peer 2
Peer 3
Peer 4
Peer 5
Peer 6
Peer 7
Peer 8
Peer 9
Peer 10
Peer 11
MTB
Construction
12.0%
11.2%
9.8%
8.7%
8.2%
5.5%
5.0%
4.7%
4.7%
4.4%
3.9%
2.7%
Peer Median
5.2%
Industry 6.8%
0%
3%
6%
9%
12%
15%
Peer 1
Peer 2
Peer 3
Peer 4
Peer 5
Peer 6
Peer 7
Peer 8
MTB
Peer 9
Peer 10
Peer 11
Residential Mortgage
26.4%
14.3%
9.8%
9.1%
7.3%
5.3%
5.2%
5.2%
4.5%
3.3%
3.3%
1.8%
Peer Median
5.3%
Industry 10.2%
0%
6%
12%
18%
24%
30%
Peer 1
Peer 2
Peer 3
Peer 4
Peer 5
Peer 6
Peer 7
Peer 8
Peer 9
Peer 10
Peer 11
MTB
HELOC
Strong Underwriting Across All Portfolios
*Represents cumulative net credit losses from 3Q07 through 4Q11 as a percentage of
average loans over that period. Note: Industry data reflects an aggregate of
commercial bank data per SNL. Loss
experience
through
the
financial
crisis
3Q07
–
4Q11* |
 14
M&T Ranks Lowest for Volatility in FDIC’s Core Earnings Metric
(1)
Core Earnings Ratio per the FDIC. Volatility calculated as the standard deviation of change in
4qtr core earnings / average 5qtr end of period assets (Core earnings = net income, excl.
securities gain / loss and extraordinary items).
Source: Regulatory FR-Y9C reported data per SNL
Financial. Earnings
Earnings
Negative Core Earnings
Large Cap Banks
Volatility
(1)
Rank
Volatility
(1)
Rank
(# of Quarters)
MTB
2.8%
2
7.6%
1
0
USB
17.5%
13
9.1%
2
0
BBT
8.9%
11
14.0%
3
0
WFC
4.0%
6
17.6%
4
0
JPM
33.2%
14
41.3%
5
0
PNC
58.8%
15
44.2%
6
0
BAC
378.2%
16
78.0%
7
6
CMA
6.7%
9
135.6%
8
4
RF
2.5%
1
166.3%
9
11
COF
NA
NA
183.4%
10
3
SNV
3.8%
4
187.7%
11
14
STI
3.9%
5
200.4%
12
7
ZION
7.2%
10
212.9%
13
10
KEY
5.9%
8
345.2%
14
9
C
4.6%
7
412.1%
15
8
FITB
3.2%
3
683.4%
16
5
HBAN
9.2%
12
2791.4%
17
7
Large Cap Median
6.3%
166.3%
5
10 Years
:
1991 -
2000
10 Years
:
2001 -
2011
M&T has been a uniquely strong and stable performer, through good times and
bad |
 15
M&T’s strength during economic crises has provided
growth opportunities |
 16
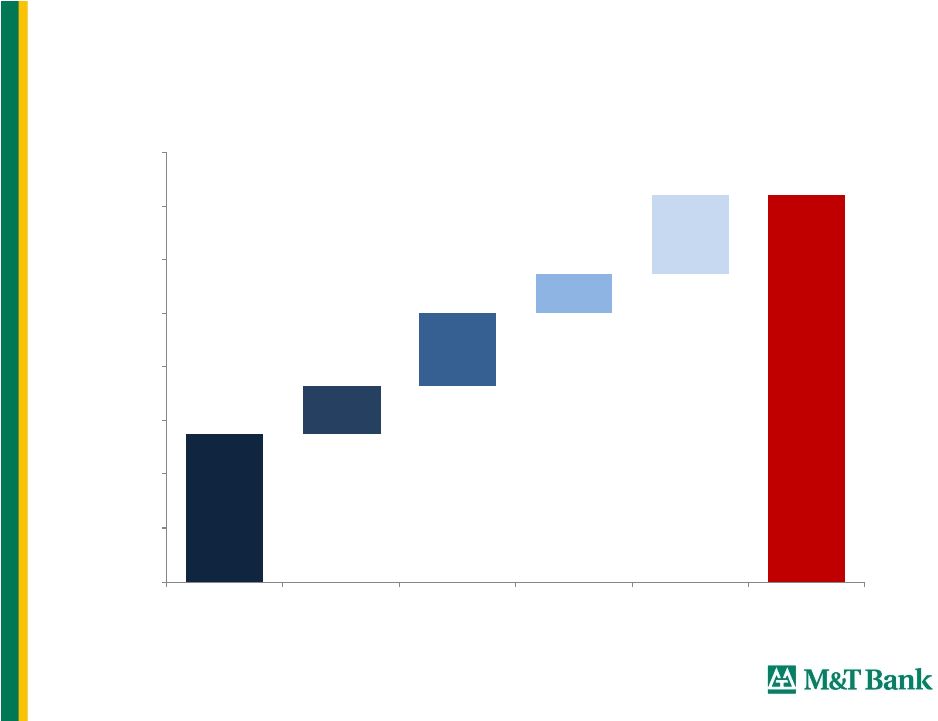
M&T’s long-term superior profitability demonstrated:
Operating returns on Avg. Tangible Common Equity
26.0%
13.4%
18.9%
18.0%
21.1%
-12.0%
5.5%
10.9%
-15%
-10%
-5%
0%
5%
10%
15%
20%
25%
30%
35%
'00
'01
'02
'03
'04
'05
'06
'07
'08
'09
'10
'11
MTB
Peer Median
Operating Return on Avg. Tangible Common Equity = Operating Earnings divided by
Avg. Tangible Common Equity. Operating Earnings = Net Income Available
to Common less Nonrecurring Revenue & Expense (as reported by SNL for Peer banks) and
Amortization Expense.
Avg. Tang Common Equity = Avg. Common Equity less Avg. Intangible Assets.
|
 17
Consistent Earnings & Dividends: 1983 –
1Q12
Note:
Data
prior
to
1998
does
not
include
provisions
of
SFAS
No.
123
and
No.
148
stock
option
expensing.
Net Operating Income and Net Operating EPS are non-GAAP financial measures.
Refer to the Appendix for a reconciliation between these measures and
GAAP M&T maintained its dividend and experienced no losses through the
recent crisis |
 18
For FY2012, expect NIM lower than FY2011’s 3.73%
Expect continued pressure to core NIM
2Q12 inflows of trust deposits will also impact NIM but not NII
Credit trends continue moderate improvement
Expect some lumpiness in credit metrics
Expect normal decline from 1Q12 seasonally high compensation expense
Remaining Wilmington Trust systems integration targeted for end of 2Q 2012
Outlook Consistent with Remarks on April earnings call |
 19
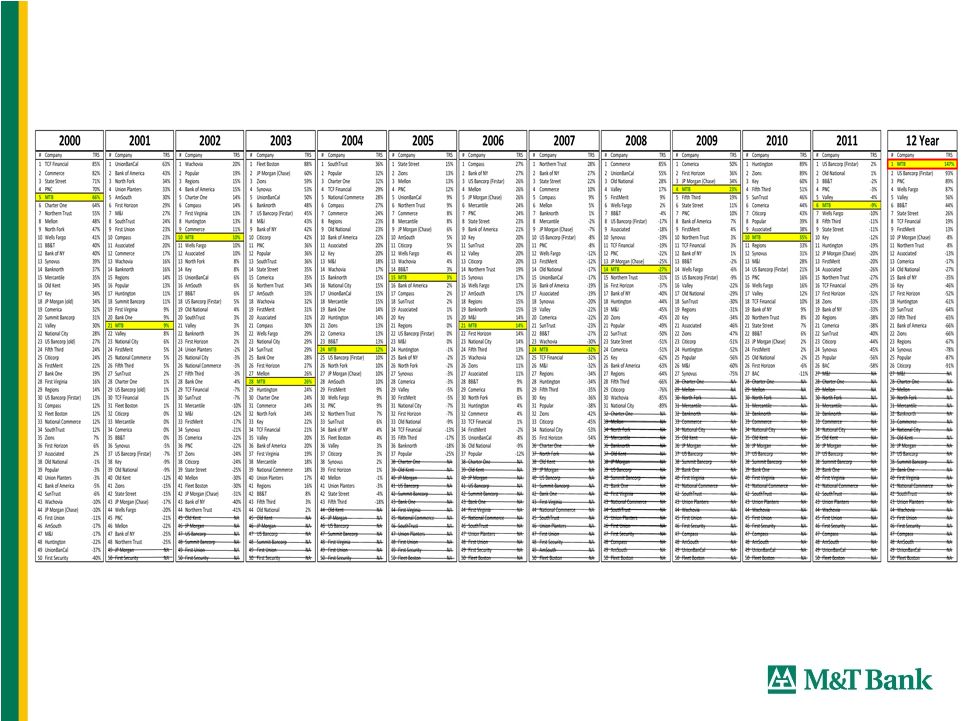
Strong Long-term Returns to Shareholders
Highest annual stock price appreciation among top 100 banks since 1983
19.3% annual total return since 1980
Highest total return among top 50 banks since 2000
$3,418 invested in M&T in 1980 would be worth $1 million today
|
 Sanford C. Bernstein
Strategic Decisions Conference 2012
May 31, 2012 |
 21
Appendix |
 22
1 1983 Stock Prices Source: Compustat and/or SNL
Of the largest 100
banks operating in
1983, only 23 remain
today
Among the
remaining, M&T
ranks 1
st
in stock
price growth
M&T Bank Corporation…
a solid investment
Stock
Closing Price at
Return
4/30/2012
3/31/1983
CAGR
Rank
Company Name
Ticker
($)
($)
1
(%)
1
M&T Bank Corporation
MTB
86.27
1.34
15.4
2
State Street Corporation
STT
46.22
1.06
13.9
3
U.S. Bancorp
USB
32.17
0.92
13.0
4
Northern Trust Corporation
NTRS
47.56
1.51
12.6
5
Wells Fargo & Company
WFC
33.42
1.18
12.2
23
—
—
2.6
Median
—
—
7.8
MTB Price @ Median Growth Rate
11.96
1.34
7.8 |
 23
19.3% Annual rate of return since 1980*
–
22
nd
best
return
of
the
entire
universe
of
over
700
U.S.
based
stocks that have traded publicly since 1980
$3,418 invested in M&T in 1980 would be worth $1 million today
*CAGR calculated assuming reinvestment of dividends through February 29,
2012. M&T Bank Corporation…
a solid investment
Rank
Company Name
Industry
Annual Return
1
Eaton Vance Corp.
Financials
25.1
2
Limited Brands Inc.
Consumer Discretionary
23.3
3
Gap Inc.
Consumer Discretionary
22.8
4
Progressive Corp.
Financials
22.8
5
TJX Cos.
Consumer Discretionary
22.6
6
Stryker Corp.
Health Care
22.2
7
Wal-Mart Stores Inc.
Consumer Staples
21.8
8
Hasbro Inc.
Consumer Discretionary
21.6
9
Mylan Inc.
Health Care
21.6
10
Precision Castparts Corp.
Industrials
21.4
11
Leucadia National Corp.
Financials
20.9
12
Raven Industries Inc.
Industrials
20.9
13
Valspar Corp.
Materials
20.7
14
State Street Corp.
Financials
20.3
15
HollyFrontier Corp.
Energy
20.3
16
Danaher Corp.
Industrials
20.3
17
Berkshire Hathaway Inc. Cl A
Financials
20.2
18
Robert Half International Inc.
Industrials
19.8
19
Forest Laboratories Inc.
Health Care
19.8
20
Family Dollar Stores Inc.
Consumer Discretionary
19.4
21
Graco Inc.
Industrials
19.4
22
M&T Bank Corp.
Financials
19.3 |
 24
Total Returns to Shareholders
(1)
Largest 50 banks by market capitalization as of January 1, 2000
(1) Total Return To Shareholder from 12/31/1999 to 12/31/2011, as sourced
from Barclays Capital and SNL Financial. |
 25
2011 Peer Group -
Largest 12 Regional Banks
BB&T Corporation
M&T Bank Corporation
Capital One Financial Corporation
PNC Financial Services Group, Inc.
Comerica Incorporated
Regions Financial Corporation
Fifth Third Bancorp
Synovus Financial Corp.
SunTrust Banks, Inc.
Huntington Bancshares Incorporated
Zions Bancorporation
KeyCorp |
 26
Reconciliation of GAAP and Non-GAAP Measures
Net Income
2000
2001
2002
2003
2004
2005
2006
2007
2008
2009
2010
2011
1Q12
$'s in millions
Net income
$268.2
$353.1
$456.7
$573.9
$722.5
$782.2
$839.2
$654.3
$555.9
$379.9
$736.2
$859.5
$206.5
Intangible amortization*
56.1
99.4
32.5
47.8
46.1
34.7
38.5
40.5
40.5
39.0
35.3
37.6
10.2
Merger-related items*
16.4
4.8
-
39.2
-
-
3.0
9.1
2.2
36.5
(16.3)
(12.8)
1.7
Net operating income
$340.7
$457.3
$489.2
$660.9
$768.6
$816.9
$880.7
$703.8
$598.6
$455.4
$755.2
$884.3
$218.4
Pre-Tax, Pre-Provision
Income
Net Income for EPS
$268.2
$353.1
$456.8
$573.9
$722.5
$782.2
$839.2
$654.3
$555.1
$332.0
$675.9
$781.8
$188.2
Preferred Div., Amort. of Pref. Stock
& Unvested Stock Awards
$0.0
$0.0
$0.0
$0.0
$0.0
$0.0
$0.0
$0.0
$0.8
$47.9
$60.3
$77.7
$18.2
Income Taxes
$154.1
$198.6
$219.2
$276.7
$344.0
$388.7
$392.5
$309.3
$183.9
$139.4
$356.6
$365.1
$102.0
GAAP Pre-tax Income
$422.3
$551.6
$675.9
$850.7
$1,066.5
$1,170.9
$1,231.6
$963.5
$739.8
$519.3
$1,092.8
$1,224.6
$308.4
Provision for credit losses
38.0
103.5
122.0
131.0
95.0
88.0
80.0
192.0
412.0
604.0
368.0
270.0
49.0
Pre-Tax, Pre-Provision Income
$460.3
$655.1
$797.9
$981.7
$1,161.5
$1,258.9
$1,311.6
$1,155.5
$1,151.8
$1,123.3
$1,460.8
$1,494.6
$357.4
Earnings Per Share
Diluted earnings per share
$3.24
$3.58
$4.78
$4.95
$6.00
$6.73
$7.37
$5.95
$5.01
$2.89
$5.69
$6.35
$1.50
Intangible amortization*
0.67
1.00
0.34
0.41
0.38
0.30
0.33
0.37
0.36
0.34
0.29
0.30
0.08
Merger-related items*
0.20
0.05
-
0.34
-
-
0.03
0.08
0.02
0.31
(0.14)
(0.10)
0.01
Diluted net operating
earnings per share
$4.11
$4.63
$5.12
$5.70
$6.38
$7.03
$7.73
$6.40
$5.39
$3.54
$5.84
$6.55
$1.59
Efficiency Ratio
$'s in millions
Non-interest expenses
$718.6
$980.6
$961.6
$1,448.2
$1,516.0
$1,485.1
$1,551.7
$1,627.7
$1,727.0
$1,980.6
$1,914.8
$2,478.1
$639.7
less: intangible amortization
69.6
121.7
51.5
78.2
75.4
56.8
63.0
66.5
66.6
64.3
58.1
61.6
16.8
less: merger-related expenses
26.0
8.0
-
60.4
-
-
5.0
14.9
3.5
89.2
0.8
83.7
2.7
Non-interest operating expenses
$623.0
$850.9
$910.1
$1,309.6
$1,440.6
$1,428.3
$1,483.7
$1,546.3
$1,656.8
$1,827.2
$1,856.0
$2,332.8
$620.2
FTE net interest income
$864.7
$1,175.8
$1,261.6
$1,615.1
$1,751.9
$1,811.6
$1,837.2
$1,871.0
$1,961.6
$2,077.6
$2,291.5
$2,415.6
$627.1
plus: Other Income
$324.7
$477.5
$512.0
$831.1
$943.0
$949.7
$1,045.9
$933.1
$939.0
$1,048.1
$1,108.1
$1,582.9
$376.7
less: gain/(loss) on sale of securities
(3.1)
1.9
(0.6)
2.5
2.9
1.2
2.6
1.2
34.4
1.2
2.8
150.2
0.0
less: net OTTI losses recognized
-
-
-
-
-
(29.4)
-
(127.3)
(182.2)
(138.3)
(86.3)
(77.0)
(11.5)
less: merger-related gains
-
-
-
-
-
-
-
-
-
29.1
27.5
64.9
-
Denominator for efficiency ratio
$1,192.5
$1,651.4
$1,774.2
$2,443.7
$2,692.0
$2,789.5
$2,880.5
$2,930.2
$3,048.4
$3,233.7
$3,455.6
$3,860.5
$1,015.3
Net operating efficiency ratio
52.3%
51.5%
51.3%
53.6%
53.5%
51.2%
51.5%
52.8%
54.4%
56.5%
53.7%
60.4%
61.1%
*Net of tax |
 27
Reconciliation of GAAP and Non-GAAP Measures
Average Assets
2000
2001
2002
2003
2004
2005
2006
2007
2008
2009
2010
2011
1Q12
$'s in millions
Average assets
23,670
$
30,842
$
31,935
$
45,349
$
51,517
$
54,135
$
55,839
$
58,545
$
65,132
$
67,472
$
68,380
$
73,977
$
78,026
$
Goodwill
(641)
(1,126)
(1,098)
(2,456)
(2,904)
(2,904)
(2,908)
(2,933)
(3,193)
(3,393)
(3,525)
(3,525)
(3,525)
Core deposit and other
intangible assets
(125)
(196)
(143)
(233)
(201)
(135)
(191)
(221)
(214)
(191)
(153)
(168)
(168)
Deferred taxes
30
56
46
-
-
52
38
24
30
33
29
43
48
Average tangible assets
22,934
$
29,576
$
30,740
$
42,660
$
48,412
$
51,148
$
52,778
$
55,415
$
61,755
$
63,921
$
64,731
$
70,327
$
74,381
$
Average Common Equity
$'s in millions
Average common equity
2,045
$
2,975
$
3,026
$
4,941
$
5,701
$
5,798
$
6,041
$
6,247
$
6,423
$
6,616
$
7,367
$
8,207
$
8,510
$
Goodwill
(641)
(1,126)
(1,098)
(2,456)
(2,904)
(2,904)
(2,908)
(2,933)
(3,193)
(3,393)
(3,525)
(3,525)
(3,525)
Core deposit and other
intangible assets
(125)
(196)
(143)
(233)
(201)
(135)
(191)
(221)
(214)
(191)
(153)
(168)
(168)
Deferred taxes
30
56
46
68
76
52
38
24
30
33
29
43
48
Average tangible common equity
1,309
$
1,709
$
1,831
$
2,320
$
2,672
$
2,811
$
2,980
$
3,117
$
3,046
$
3,065
$
3,718
$
4,557
$
4,866
$ |