Attached files
| file | filename |
|---|---|
| 8-K - FORM 8-K - Booz Allen Hamilton Holding Corp | d360661d8k.htm |
| EX-99.1 - PRESS RELEASE - Booz Allen Hamilton Holding Corp | d360661dex991.htm |
 Booz
Allen Hamilton Fourth Quarter Fiscal 2012
Booz Allen Hamilton
Fourth Quarter Fiscal 2012
May 30, 2012
May 30, 2012
Exhibit 99.2 |
 2
Today’s Agenda
Today’s Agenda
Curt Riggle
Director, Investor Relations
Ralph Shrader
Chairman, Chief Executive Officer and President
Sam Strickland
Executive Vice President and Chief Financial Officer
Introduction
Management
Overview
Financial
Overview
Questions and
Answers |
 3
Disclaimers
Disclaimers
Forward Looking Safe Harbor Statement
The following information includes “forward-looking statements” within the meaning of
the Private Securities Litigation Reform Act of 1995. Examples of forward-looking statements
include information concerning Booz Allen’s preliminary financial results, financial outlook and
guidance, including projected Revenue, Diluted EPS, and Adjusted Diluted EPS, as well as any
other statement that does not directly relate to any historical or current fact. In some cases, you can identify forward-looking statements by terminology such as “may,” “will,”
“could,” “should,” “forecasts,” “expects,”
“intends,” “plans,” “anticipates,” “projects,” “outlook,” “believes,” “estimates,” “predicts,” “potential,” “continue,” “preliminary,” or
the negative of these terms or other comparable terminology. Although we believe that the
expectations reflected in the forward-looking statements are reasonable, we can give you no assurance
these expectations will prove to have been correct. These forward-looking statements relate to
future events or our future financial performance and involve known and unknown risks,
uncertainties and other factors that may cause our actual results, levels of activity, performance or
achievements to differ materially from any future results, levels of activity, performance or
achievements expressed or implied by these forward-looking statements. These risks and other factors include: cost cutting and efficiency initiatives and other efforts
to reduce U.S. government spending, which could reduce or delay funding for orders for services
especially in the current political environment; delayed funding of our contracts due to delays
in the completion of the U.S. government’s budgeting process and the use of continuing resolutions by the U.S. government to fund its operations or related changes in the
pattern or timing of government funding and spending; any issue that compromises our relationships
with the U.S. government or damages our professional reputation; changes in U.S. government
spending and mission priorities that shift expenditures away from agencies or programs that we support; the size of our addressable markets and the amount of U.S.
government spending on private contractors; failure to comply with numerous laws and regulations; our
ability to compete effectively in the competitive bidding process and delays caused by
competitors’ protests of major contract awards received by us; the loss of General Services Administration Multiple Award Schedule Contracts, or GSA schedules, or our
position as prime contractor on Government-wide acquisition contract vehicles; changes in the mix
of our contracts and our ability to accurately estimate or otherwise recover expenses, time and
resources for our contracts; our ability to generate revenue under certain of our contracts; our ability to realize the full value of our backlog and the timing of our
receipt of revenue under contracts included in backlog; changes in estimates used in recognizing
revenue; any inability to attract, train or retain employees with the requisite skills,
experience and security clearances; an inability to hire, assimilate and deploy enough employees to
serve our clients under existing contracts; an inability to timely and effectively utilize our
employees; failure by us or our employees to obtain and maintain necessary security clearances; the loss of members of senior management or failure to develop new
leaders; misconduct or other improper activities from our employees or subcontractors; increased
competition from other companies in our industry; failure to maintain strong relationships with
other contractors; inherent uncertainties and potential adverse developments in legal or regulatory proceedings, including litigation, audits, reviews and
investigations, which may result in materially adverse judgments, settlements, withheld payments,
penalties or other unfavorable outcomes including debarment, as well as disputes over the
availability of insurance or indemnification; internal system or service failures and security breaches, including, but not limited to, those resulting from external cyber attacks on
our network and internal systems; risks related to changes in our operating structure, capabilities,
or strategy intended to address client needs, grow our business, or respond to market
developments; risks associated with new relationships, clients, capabilities, and service offerings in our U.S. and international businesses; risks related to our indebtedness and
credit facilities which contain financial and operating covenants; the adoption by the U.S. government
of new laws, rules and regulations, such as those relating to organizational conflicts of
interest issues; an inability to utilize existing or future tax benefits, including those related to our Net Operating Losses and stock-based compensation expense, for any
reason, including a change in law; and variable purchasing patterns under U.S. government GSA
schedules, blanket purchase agreements and Indefinite Delivery/Indefinite Quantity
contracts. Additional information concerning these and other factors can be found in our filings
with the Securities and Exchange Commission (SEC), including our Annual Report on Form 10K,
filed with the SEC on June 8, 2011.All forward-looking statements attributable to the company or persons acting on the company’s behalf are expressly qualified in their
entirety by the foregoing cautionary statements. All such statements speak only as of the date
made and, except as required by law, the company undertakes no obligation to update or revise
publicly any forward-looking statements, whether as a result of new information, future events or otherwise.
Note Regarding Non-GAAP Financial Data Information
Booz Allen discloses in the following information Adjusted Operating Income, Adjusted EBITDA, Adjusted
Net Income, Adjusted Diluted EPS, and Free Cash Flow which are not recognized
measurements under GAAP, and when analyzing Booz Allen’s performance or liquidity as applicable, investors should (i) evaluate each adjustment in our reconciliation of
Operating and Net Income to Adjusted Operating Income, Adjusted EBITDA and Adjusted Net Income, and
cash flow to free cash flow, and the explanatory footnotes regarding those adjustments, and
(ii) use Adjusted EBITDA, Adjusted Net Income, Adjusted Operating Income, and Adjusted Diluted EPS in addition to, and not as an alternative to operating income,
net income or Diluted EPS as a measure of operating results with cash flow in addition to and not as
an alternative to net cash generated from operating activities as a measure of liquidity, each
as defined under GAAP. The Financial Appendix includes a reconciliation of Adjusted Operating Income, Adjusted EBITDA, Adjusted Net Income, Adjusted Diluted
EPS, and Free Cash Flow to the most directly comparable financial measure calculated and presented in
accordance with GAAP. Booz Allen presents these supplemental performance measures because
it believes that these measures provide investors and securities analysts with important supplemental information with which to evaluate Booz Allen’s
performance, long term earnings potential, or liquidity, as applicable and to enable them to assess
Booz Allen’s performance on the same basis as management. These supplemental performance
and liquidity measurements may vary from and may not be comparable to similarly titled measures by other companies in Booz Allen’s industry. |
 Fiscal Year-to-Date 2012
Business Highlights
Fiscal Year-to-Date 2012
Business Highlights
Continued top and bottom line growth in a challenging environment
Declaration of $0.09 quarterly dividend and $1.50 special dividend
High demand for services demonstrated by book-to-bill of 1.0
Increasing investment in growth areas as a result of cost reductions
Strategically
aligned
to
serve
clients’
core
missions
Ongoing recognition as a “Best Company to Work For”
4 |
 5
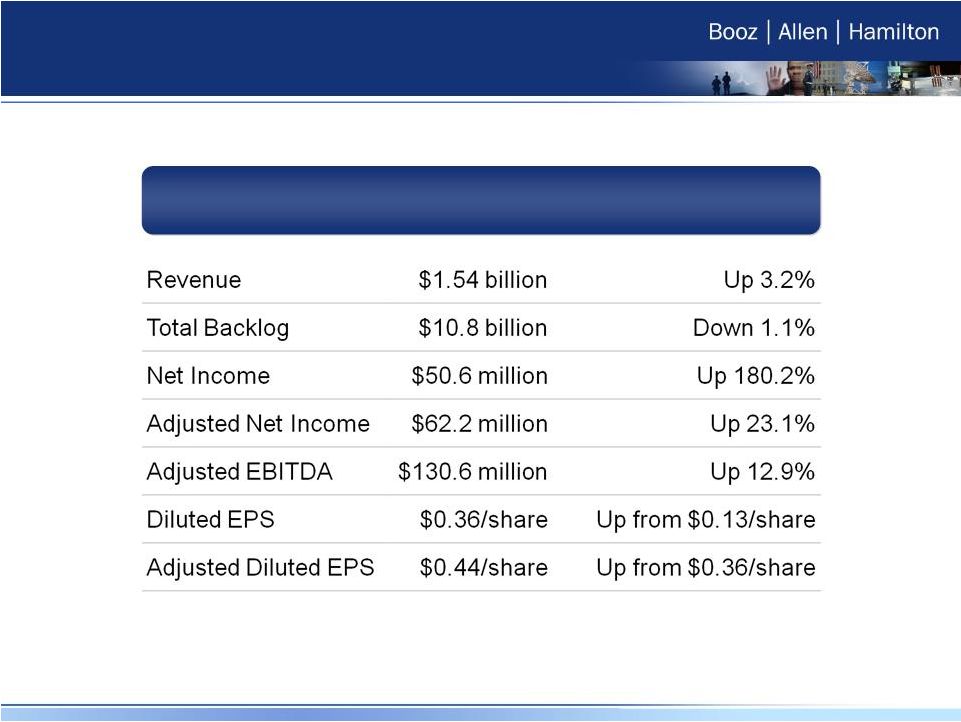
Key Financial Highlights
Key Financial Highlights
Comparisons are to prior fiscal year period
Preliminary
Fourth Quarter Fiscal 2012 Results |
 6
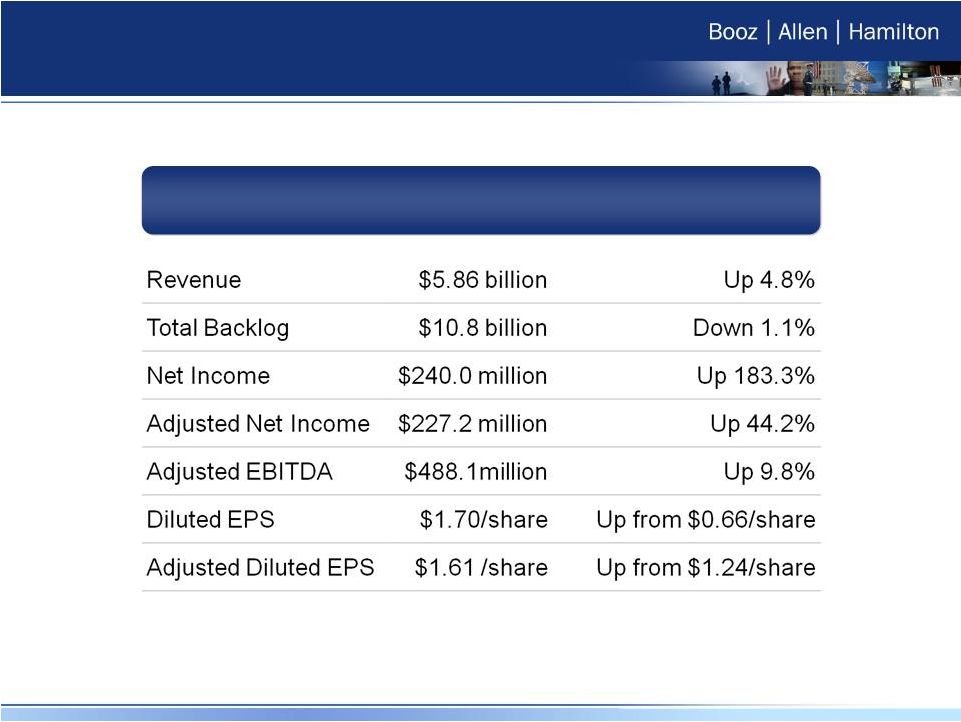
Key Financial Highlights
Key Financial Highlights
Preliminary Full Year Fiscal 2012 Results
Comparisons are to prior fiscal year |
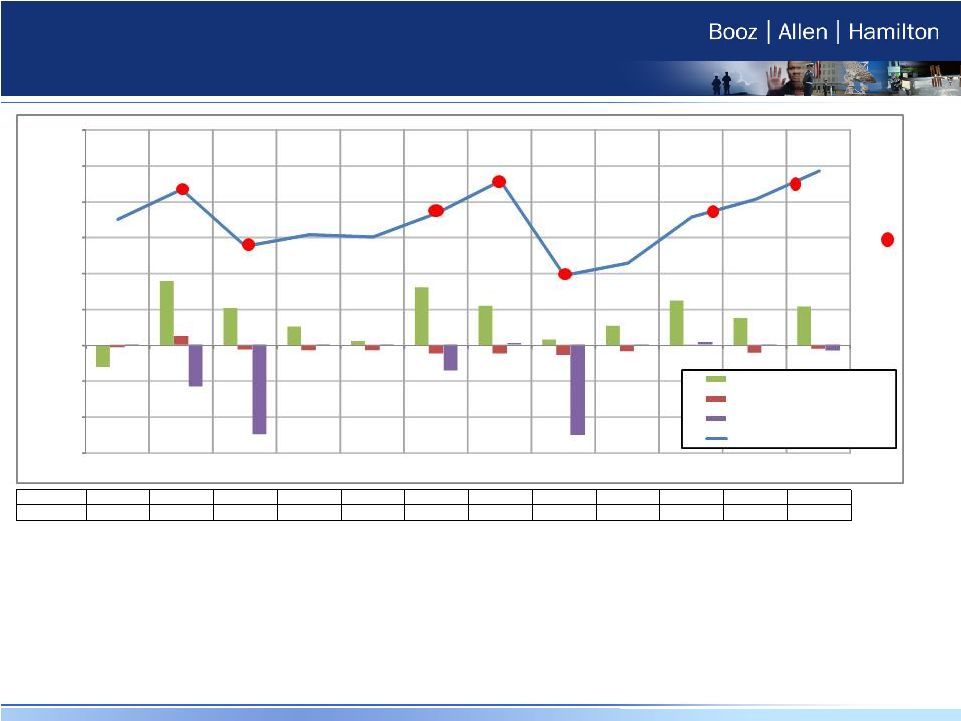 Capital Generation and Deployment
7
($M)
Total Debt
$1,568.6
$1,563.9
$1,474.9
$1,229.3
$994.3
$987.1
$979.9
$972.7
$965.4
Cash Taxes
$3.2
$0.2
$2.5
$2.7
$2.3
$1.6
$48.4
$19.2
$20.1
See SEC Filings for full discloure regarding these transactions
($300.0)
($200.0)
($100.0)
$0.0
$100.0
$200.0
$300.0
$500.0
$600.0
FY10 Q1
FY10 Q2
FY10 Q3
FY10 Q4
FY11 Q1
FY11 Q2
FY11 Q3
FY11 Q4
FY12 Q1
FY12 Q2
FY12 Q3
FY12 Q4
Net Cash From Operations
Net Cash From Investing Activities
Net Cash From Financing Activities
Cash Balance
$30M Share Repurchase
Authorization
Recapitalization
Special
Dividend
Mezz
Repayment
IPO
Refinancing
$11.9M Quarterly Dividend, $211.8M
Special Dividend, and $3.4M in accrued
interest on DPO Payable on June 29, 2012
Quarterly
Dividend and
$19.4M in Accrued
Interest on DPO
Special Dividend Payment (July 2009) - $114.9M of cash on hand
Recapitalization Transaction (December 2009) - $321.9M of cash on hand plus net
proceeds from recapitalization to pay dividend of $497.5M and DPO principal and accrued interest of $100.4M
Mezzanine Prepayment (August 2010) - $85M of cash on hand to optionally repay indebtedness
outstanding under mezzanine credit facility Initial Public Offering (November 2010)
- $250.2M net proceeds (and no cash on hand) used to repay indebtedness under mezzanine credit facility ($242.9M plus $7.3M in penalties)
Refinancing Transaction (February 2011) - $268.9M of cash on hand to repay balance of
mezzanine facility, $21.5M of senior term loans, fees, expenses, and penalties Share
Repurchase (December 2011) - Authorization of $30M share repurchase. As of May 30, 2012, no purchases have occurred.
Regular Dividend (February 2012) - $11.9M of cash on hand to pay $0.09/share quarterly
dividend Regular and Special Dividend (June 2012) - $11.9M of cash on hand to pay
$0.09/share quarterly dividend and $211.8M of cash on hand to pay $1.50/share special dividend
Payment of Accrued Interest on DPO (June 2012) - $3.4M in cash on hand to pay accrued
interest on DPO |
 Value Drivers
Deployment of capital to maximize shareholder value
Management of our business with agility and precision
Alignment
with
our
clients’
core
missions
Commitment to being essential to our clients and differentiated from our
competitors
Investment in growth markets and capabilities
Development of industry-leading talent and a commitment to excellence
Enhancement of margins and a focus on long-term performance
8 |
 Outlook
9
Revenue growth forecast:
Relatively Flat to Low-Single
Digits in the First Half
Diluted EPS forecast:
$1.62 -
$1.72
(1)
Adjusted Diluted EPS forecast:
$1.71 -
$1.81
(1)
Fiscal 2013 Outlook
(1) Full Fiscal Year 2013 |
 10
Financial Appendix
Financial Appendix |
 Booz Allen Hamilton Holding Corporation
Non-GAAP Financial Information
Booz Allen Hamilton Holding Corporation
Non-GAAP Financial Information
11
“Adjusted Operating Income”
represents Operating Income before (i) certain stock option-based and other
equity-based compensation expenses, (ii) the impact of the application
of purchase accounting, (iii) adjustments related to the amortization of
intangible assets and (iv) any extraordinary, unusual or non-recurring items. Booz Allen prepares
Adjusted Operating Income to eliminate the impact of items it does not consider
indicative of ongoing operating performance due to their inherent unusual,
extraordinary or non-recurring nature or because they result from an event of
a similar nature.
“Adjusted EBITDA”
represents net income before income taxes, net interest and other expense and
depreciation and amortization and before certain other items, including: (i)
certain stock option-based and other equity-based compensation
expenses,
(ii)
transaction
costs,
fees,
losses,
and
expenses,
(iii)
the
impact
of
the
application
of
purchase
accounting and (iv) any extraordinary, unusual or non-recurring items. Booz
Allen prepares Adjusted EBITDA to eliminate
the
impact
of
items
it
does
not
consider
indicative
of
ongoing
operating
performance
due
to
their
inherent
unusual, extraordinary or non-recurring nature or because they result from an
event of a similar nature. “Adjusted Net Income”
represents net income before: (i) certain stock option-based and other
equity-based compensation
expenses,
(ii)
transaction
costs,
fees,
losses,
and
expenses,
including
fees
associated
with
debt
prepayments, (iii) the impact of the application of purchase accounting, (iv)
adjustments related to the amortization of intangible assets, (v)
amortization or write-off of debt issuance costs and write-off of original issue discount, or OID, and
(vi) any extraordinary, unusual or non-recurring items, in each case net of the
tax effect calculated using an assumed effective tax rate. Booz Allen
prepares Adjusted Net Income to eliminate the impact of items, net of tax, it does not
consider indicative of ongoing operating performance due to their inherent unusual,
extraordinary or non-recurring nature or because they result from an
event of a similar nature. “Adjusted Diluted EPS”
represents Diluted EPS calculated using Adjusted Net Income as opposed to Net
Income. “Free Cash Flow”
represents the net cash generated from operating activities less the impact of
purchases of property and equipment. |
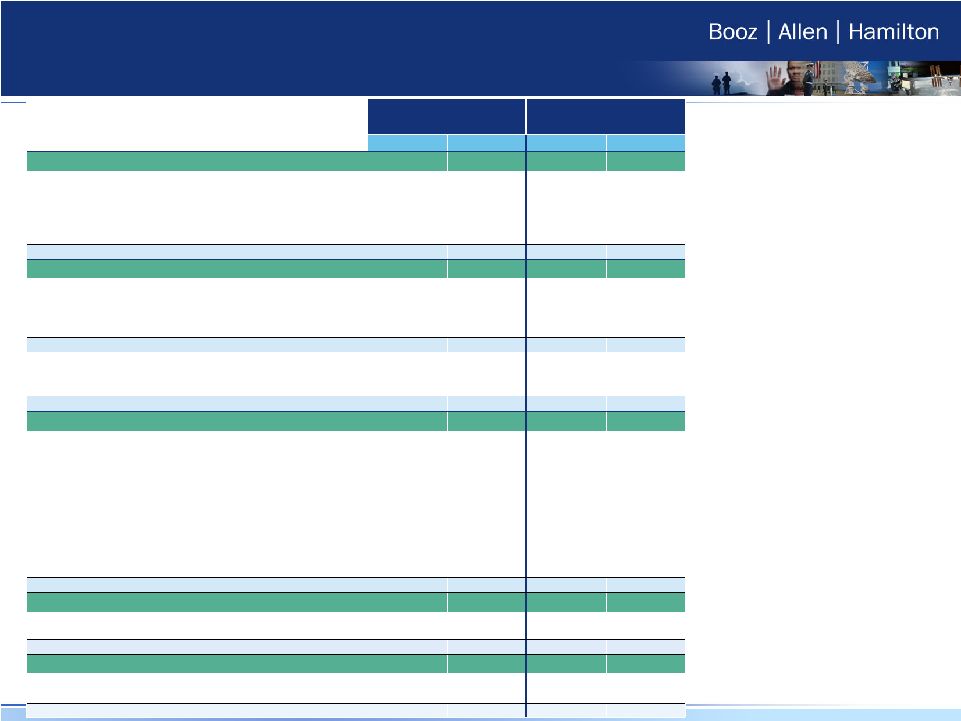 Booz Allen Hamilton Holding Corporation
Non-GAAP Financial Information
Booz Allen Hamilton Holding Corporation
Non-GAAP Financial Information
12
(Unaudited and in thousands, except per share data)
Three Months Ended
March 31,
Fiscal Year Ended
March 31
2012
2011
2012
2011
Adjusted Operating Income
Operating Income
$97,457
$83,659
$387,432
$319,444
Certain stock-based compensation expense (a)
2,652
6,816
14,241
39,947
Amortization of intangible assets (b)
4,091
7,161
16,364
28,641
Net restructuring charge (h)
11,182
-
11,182
-
Transaction expenses (c)
-
4,313
-
4,448
Adjusted Operating Income
$115,382
$101,949
$429,219
$392,480
EBITDA & Adjusted EBITDA
Net income
$50,627
$18,070
$239,955
$84,694
Income tax expense
35,948
13,690
103,919
43,370
Interest and other, net
10,882
51,899
43,558
191,380
Depreciation and amortization
19,281
20,835
75,205
80,603
EBITDA
116,738
104,494
462,637
400,047
Certain stock-based compensation expense (a)
2,652
6,816
14,241
39,947
Net restructuring charge (h)
11,182
-
11,182
-
Transaction expenses (c)
-
4,313
-
4,448
Adjusted EBITDA
$130,572
$115,623
$488,060
$444,442
Adjusted Net Income
Net income
$50,627
$18,070
$239,955
$84,694
Certain stock-based compensation expense (a)
2,652
6,816
14,241
39,947
Net restructuring charge (h)
11,182
-
11,182
-
Transaction expenses (d)
-
10,975
-
20,948
Amortization of intangible assets (b)
4,091
7,161
16,364
28,641
Amortization or write-off of debt issuance
costs and write-off of original issue discount
1,181
29,163
4,783
50,102
Net gain on sale of state and local transportation business (e)
-
-
(5,681)
-
Release of income tax reserves (f)
111
-
(35,022)
(10,966)
Adjustments for tax effect (g)
(7,643)
(21,646)
(18,628)
(55,855)
Adjusted Net Income
$62,201
$50,539
$227,194
$157,511
Adjusted Diluted Earnings Per Share
Weighted-average number of diluted shares outstanding
141,716,480
140,718,057
140,812,012
127,448,700
Adjusted Net Income per diluted share
$0.44
$0.36
$1.61
$1.24
Free Cash Flow
Net cash provided by operating activities
$108,027
$15,534
$360,046
$296,339
Less: Purchases of property and equipment
(11,367)
(27,351)
(76,925)
(88,784)
Free Cash Flow
$96,660
($11,817)
$283,121
$207,555
(a) Reflects stock-based compensation expense
for options for Class A Common Stock and
restricted shares, in each case, issued in
connection with the acquisition under the Officers’
Rollover Stock Plan that was established in
connection with the acquisition. Also reflects
stock-based compensation expense for Equity
Incentive Plan Class A Common Stock options
issued in connection with the acquisition under
the Equity Incentive Plan.
(b) Reflects amortization of intangible assets
resulting from the acquisition.
(c) Three months ended March 31, 2011 reflects
certain costs related to the modification of our
credit facilities in connection with the Refinancing
Transaction. Fiscal 2011 reflects debt refinancing
costs incurred in connection with the Refinancing
Transaction and certain external administrative
and other expenses incurred in connection with
the initial public offering.
(d) Three months ended March 31, 2011 reflects
certain costs related to the modification of our
credit facilities and prepayment fees associated
with early repayments on the mezzanine term
loan and credit facilities in connection with the
Refinancing Transaction. Fiscal 2011 reflects
debt refinancing costs and prepayment fees
incurred in connection with the Refinancing
Transaction as well as certain external
administrative and other expenses incurred in
connection with the initial public offering.
(e) Fiscal 2012 reflects the gain on sale of our
state and local transportation business, net of the
associated tax benefit of $1.6 million.
(f) Reflects the release of income tax reserves.
(g) Reflects tax effect of adjustments at an
assumed marginal tax rate of 40%.
(h) Reflects restructuring charges of
approximately $15.7 million incurred during the
three months ended March 31, 2012, net of
approximately $4.5 million of revenue recognized
on recoverable expenses, associated with the
cost restructuring plan to reduce certain personnel
and infrastructure costs. |