Attached files
| file | filename |
|---|---|
| 8-K - FORM 8-K - BROADVIEW NETWORKS HOLDINGS INC | d358640d8k.htm |
Exhibit 99.1
Exhibit 99.1
Broadview Networks®
Beyond Service. Beyond Software. Beyond Solutions.
Company Presentation
Quarter Ended March 31, 2012
© 2012 Broadview Networks Holdings, Inc.
Safe Harbor Statement
This presentation may contain forward-looking statements, including statements regarding, among other items, the Company’s expected financial position, business, risk factors and financing plans. These statements may be identified by the use of forward-looking terminology such as “believes,” “expects,” “may,” “will,” “should,” “estimates,” or “anticipates” or the negative thereof or other variations thereon or comparable terminology, or by discussions of strategy that involve risks and uncertainties. These forward-looking statements are subject to a number of uncertainties and risks, many of which are outside of Broadview’s control that could cause actual results to differ materially from such statements. Some of these risks can be found in Broadview’s Annual Report on Form 10-K, Quarterly Reports on Form 10-Q and other reports filed with the Securities and Exchange Commission.
Adjusted EBITDA, Free Cash Flow and other financial measures as presented herein are not necessarily comparable with those of other companies. Adjusted EBITDA as presented herein represents net loss before depreciation and amortization, interest income and expense, other income, provision for income taxes, share-based compensation, severance and related separation and retention costs, costs associated with initial public offering, costs associated with early lease terminations and professional fees related to strategic initiatives. Adjusted EBITDA is not a measure of financial performance under GAAP. Adjusted EBITDA is a non-GAAP financial measure used by our management, together with financial measures prepared in accordance with GAAP such as net loss, income from operations and revenues, to assess our historical and prospective operating performance.
Readers are cautioned not to place undue reliance on these forward-looking statements, which speak only as of the date they are made. The Company undertakes no obligation to publicly update or revise any forward-looking statements, whether as of a result of new information, future events or otherwise.
© 2012 Broadview Networks Holdings, Inc.
Broadview NETWORKS®
| 1 |
|
Highlights
Leading Provider of Next-Generation Communications Solutions
T-1 and Cloud based products represented 79% of new retail sales in 1Q 2012
Cloud communications represented 14% of retail revenue and 34% of new sales in 1Q 2012
State-of-the-Art Network Infrastructure
Advanced, IP / MPLS network and over 3 years of experience deploying Ethernet-over-Copper 3,000 fiber route miles, 3 data centers, 260 colocations
Large & Diversified Customer Base
Approximately 36K SMB customers with a significant opportunity to sell into the base 86% of retail revenue is from customers with greater than $500 MRR
Target market represents the largest concentration of communications spending in the U.S.
Strong and Improving Key Operating Metrics
Steadily increasing revenue per customer Churn rates are at pre-recession levels
Recurring FCF and Increasing Profitability Margins
Over 75% of revenue under contract
350 basis point improvement in adjusted EBITDA margin in past 3 years
Experienced Management
Senior management has on average 24 years of industry expertise
© 2012 Broadview Networks Holdings, Inc.
Broadview NETWORKS®
2

Company Overview
© 2012 Broadview Networks Holdings, Inc.
Broadview NETWORKS®
3
Regional Focus With National Coverage
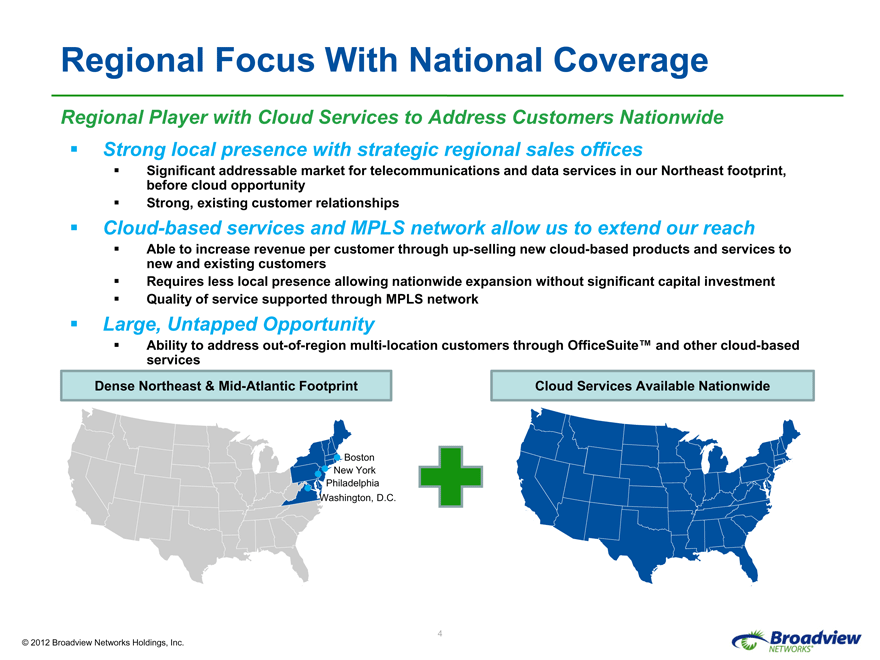
Regional Player with Cloud Services to Address Customers Nationwide Strong local presence with strategic regional sales offices
Significant addressable market for telecommunications and data services in our Northeast footprint, before cloud opportunity Strong, existing customer relationships
Cloud-based services and MPLS network allow us to extend our reach
Able to increase revenue per customer through up-selling new cloud-based products and services to new and existing customers Requires less local presence allowing nationwide expansion without significant capital investment Quality of service supported through MPLS network
Large, Untapped Opportunity
Ability to address out-of-region multi-location customers through OfficeSuite™ and other cloud-based services
Dense Northeast & Mid-Atlantic Footprint
Boston
New York
Philadelphia Washington, D.C.
Cloud Services Available Nationwide
© 2012 Broadview Networks Holdings, Inc.
Broadview NETWORKS®
4
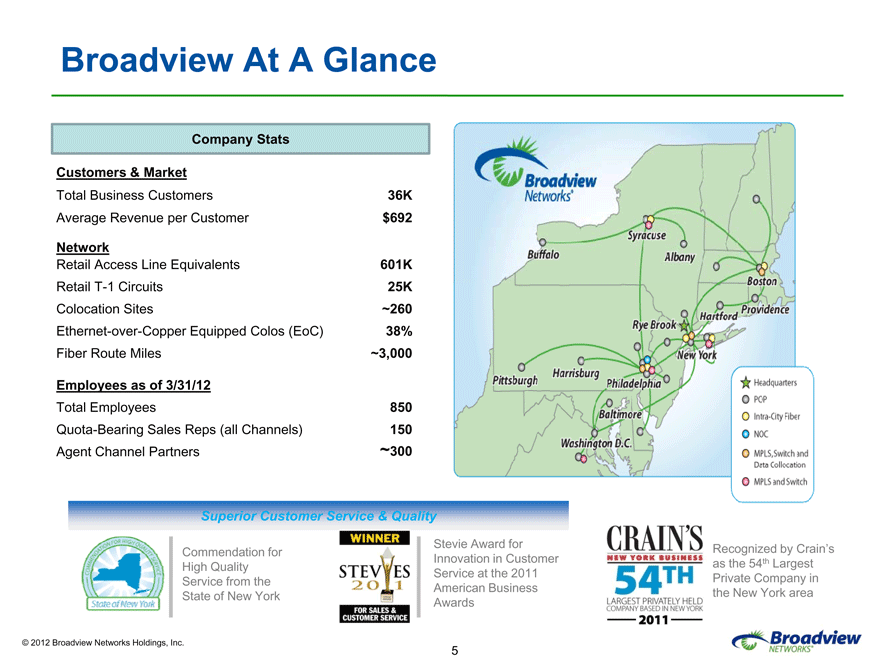
Broadview At A Glance
Company Stats
Customers & Market
Total Business Customers 36K
Average Revenue per Customer $692
Network
Retail Access Line Equivalents 601K
Retail T-1 Circuits 25K
Colocation Sites ~260
Ethernet-over-Copper Equipped Colos (EoC) 38%
Fiber Route Miles ~3,000
Employees as of 3/31/12
Total Employees 850
Quota-Bearing Sales Reps (all Channels) 150
Agent Channel Partners ~300
Superior Customer Service & Quality
WINNER
Commendation for
High Quality Service from the State of New York
Stevie Award for Innovation in Customer Service at the 2011 American Business Awards
Recognized by Crain’s as the 54th Largest Private Company in the New York area
© 2012 Broadview Networks Holdings, Inc.
Broadview NETWORKS®
5
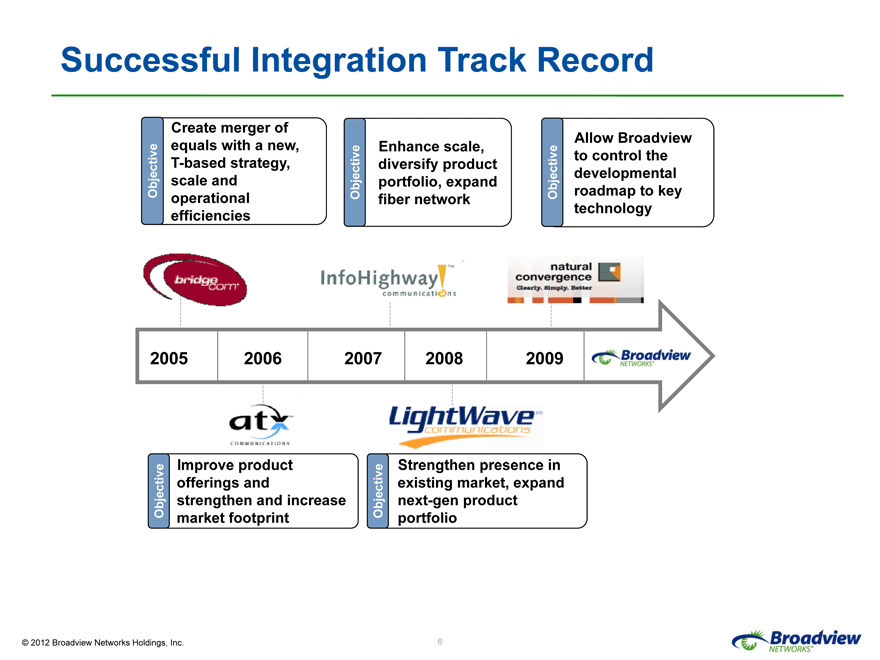
Successful Integration Track Record
Objective
Create merger of equals with a new, T-based strategy, scale and operational efficiencies
Objective
Enhance scale, diversify product portfolio, expand fiber network
Objective
Allow Broadview to control the developmental roadmap to key technology
2005 2006 2007 2008 2009
Objective
Improve product offerings and strengthen and increase market footprint
Objective
Strengthen presence in existing market, expand next-gen product portfolio
© 2012 Broadview Networks Holdings, Inc.
Broadview NETWORKS®
6
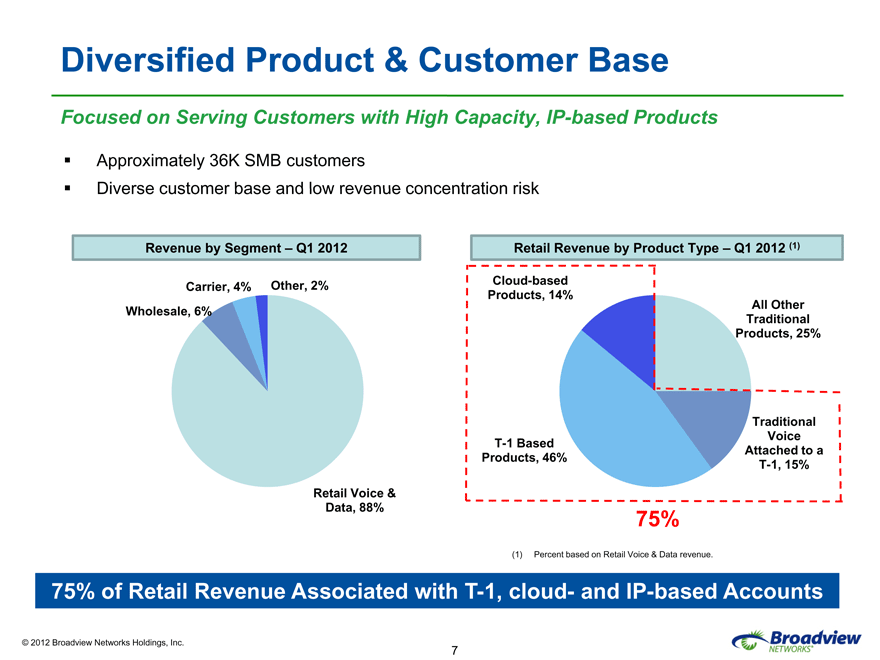
Diversified Product & Customer Base
Focused on Serving Customers with High Capacity, IP-based Products
Approximately 36K SMB customers
Diverse customer base and low revenue concentration risk
Revenue by Segment – Q1 2012
Retail Revenue by Product Type – Q1 2012 (1)
Carrier, 4% Other, 2%
Wholesale, 6%
Retail Voice & Data, 88%
Cloud-based Products, 14%
T-1 Based Products, 46%
All Other Traditional Products, 25%
Traditional Voice Attached to a T-1, 15%
75%
(1) Percent based on Retail Voice & Data revenue.
75% of Retail Revenue Associated with T-1, cloud- and IP-based Accounts
© 2012 Broadview Networks Holdings, Inc.
Broadview NETWORKS®
7
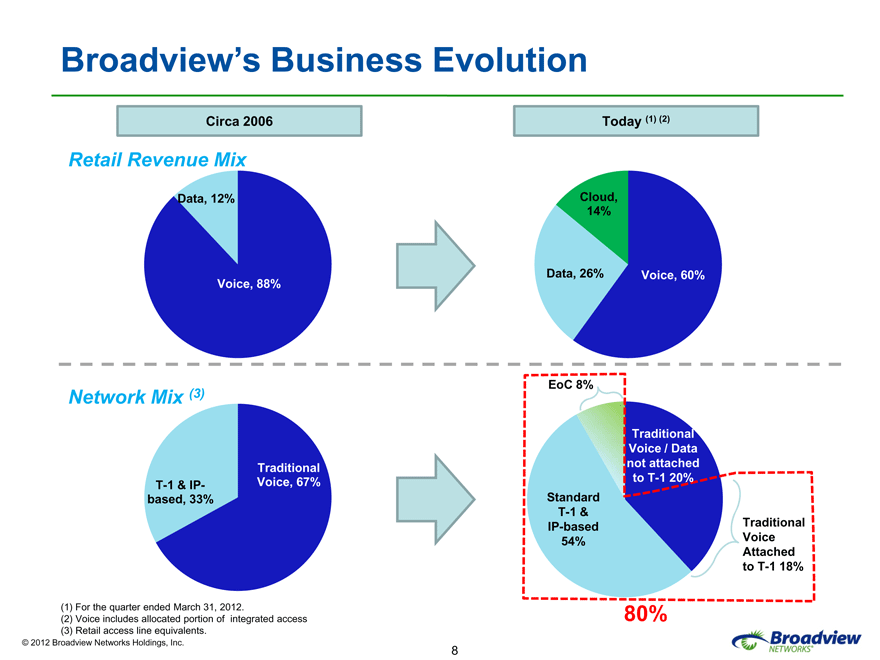
Broadview’s Business Evolution
Circa 2006
Today (1) (2)
Retail Revenue Mix
Data, 12%
Voice, 88%
Cloud, 14%
Data, 26%
Voice, 60%
Network Mix (3)
T-1 & IP-based, 33%
Traditional Voice, 67%
EoC 8%
Standard T-1 & IP-based 54%
Traditional Voice / Data not attached to T-1 20%
Traditional Voice Attached to T-1 18%
80%
(1) For the quarter ended March 31, 2012.
(2) Voice includes allocated portion of integrated access (3) Retail access line equivalents.
© 2012 Broadview Networks Holdings, Inc.
Broadview NETWORKS®
8
Growing Revenues From Larger Customers
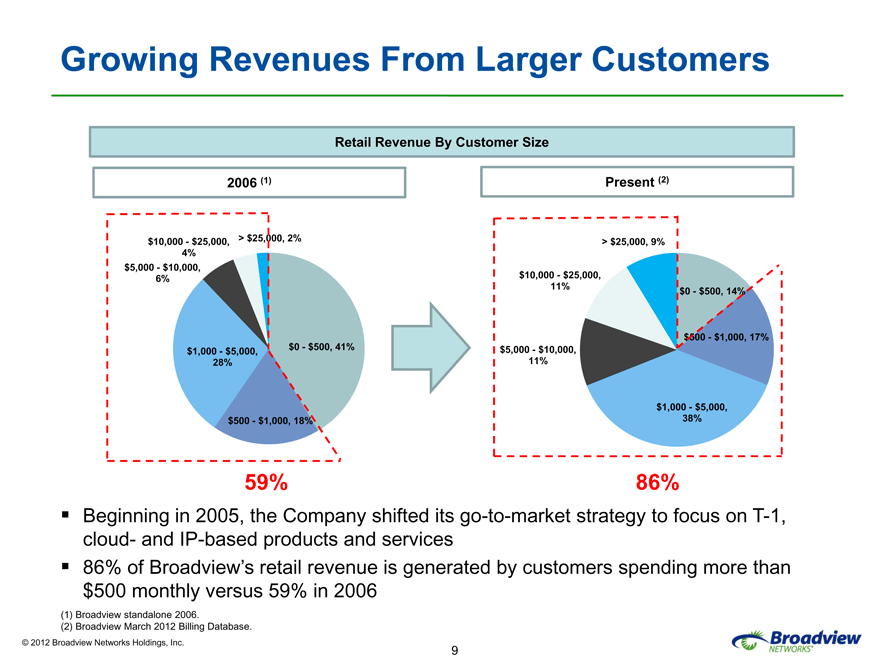
Retail Revenue By Customer Size
2006 (1)
Present (2)
> $25,000, 2%
$10,000—$25,000, 4%
$5,000—$10,000, 6%
$1,000—$5,000, 28%
$0—$500, 41%
$500—$1,000, 18%
59%
> $25,000, 9%
$10,000—$25,000, 11%
$5,000—$10,000, 11%
$0—$500, 14%
$500—$1,000, 17%
$1,000—$5,000, 38%
86%
Beginning in 2005, the Company shifted its go-to-market strategy to focus on T-1, cloud- and IP-based products and services 86% of Broadview’s retail revenue is generated by customers spending more than $500 monthly versus 59% in 2006
(1) Broadview standalone 2006.
(2) Broadview March 2012 Billing Database.
© 2012 Broadview Networks Holdings, Inc.
Broadview NETWORKS®
9
Steady Growth In Revenue Per Customer
Focus on Next-Gen Products and Services
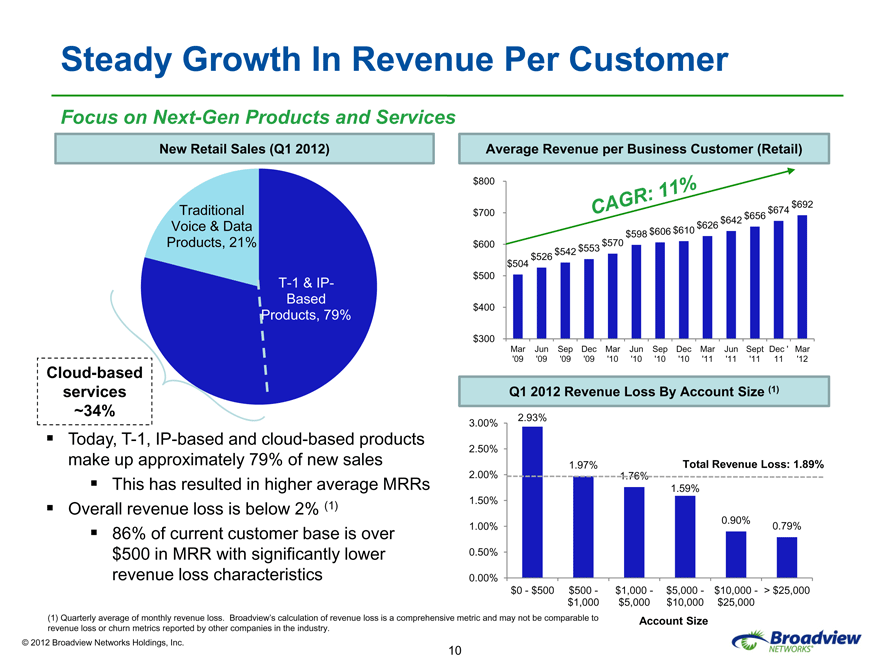
New Retail Sales (Q1 2012)
Average Revenue per Business Customer (Retail)
Traditional Voice & Data Products, 21%
T-1 & IP-Based Products, 79%
$800 $700 $600 $500 $400 $300
CAGR: 11%
$692 $674 $642 $656 $626 $598 $606 $610 $570 $526 $542 $553 $504
Mar Jun Sep Dec Mar Jun Sep Dec Mar Jun Sept Dec ‘ Mar ‘09 ‘09 ‘09 ‘09 ‘10 ‘10 ‘10 ‘10 ‘11 ‘11 ‘11 11 ‘12
Q1 2012 Revenue Loss By Account Size (1)
3.00% 2.50% 2.00% 1.50% 1.00% 0.50% 0.00%
Total Revenue Loss: 1.89%
2.93%
1.97%
1.76%
1.59%
0.90%
0.79%
$0—$500 $500—$1,000—$5,000—$10,000—> $25,000 $1,000 $5,000 $10,000 $25,000
Account Size
Cloud-based services ~34%
Today, T-1, IP-based and cloud-based products make up approximately 79% of new sales This has resulted in higher average MRRs Overall revenue loss is below 2% (1) 86% of current customer base is over $500 in MRR with significantly lower revenue loss characteristics
(1) Quarterly average of monthly revenue loss. Broadview’s calculation of revenue loss is a comprehensive metric and may not be comparable to revenue loss or churn metrics reported by other companies in the industry.
© 2012 Broadview Networks Holdings, Inc.
Broadview NETWORKS®
10
Focused Sales Strategy
Targeting Mid-sized SMB, Single and Multi-location Companies
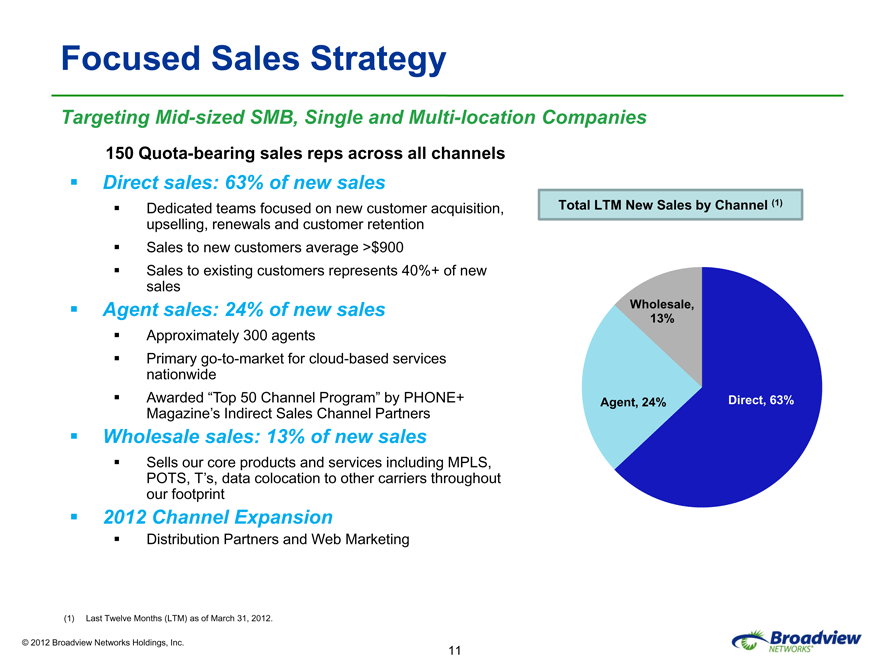
150 Quota-bearing sales reps across all channels
Direct sales: 63% of new sales
Dedicated teams focused on new customer acquisition, upselling, renewals and customer retention Sales to new customers average >$900 Sales to existing customers represents 40%+ of new sales
Agent sales: 24% of new sales
Approximately 300 agents
Primary go-to-market for cloud-based services nationwide Awarded “Top 50 Channel Program” by PHONE+ Magazine’s Indirect Sales Channel Partners
Wholesale sales: 13% of new sales
Sells our core products and services including MPLS, POTS, T’s, data colocation to other carriers throughout our footprint
2012 Channel Expansion
Distribution Partners and Web Marketing
Total LTM New Sales by Channel (1)
Wholesale, 13%
Agent, 24%
Direct, 63%
(1) Last Twelve Months (LTM) as of March 31, 2012.
© 2012 Broadview Networks Holdings, Inc.
Broadview NETWORKS®
11
Leveraging Our Customer Base
Increasing Walletshare Through New Cloud-based Products and Services
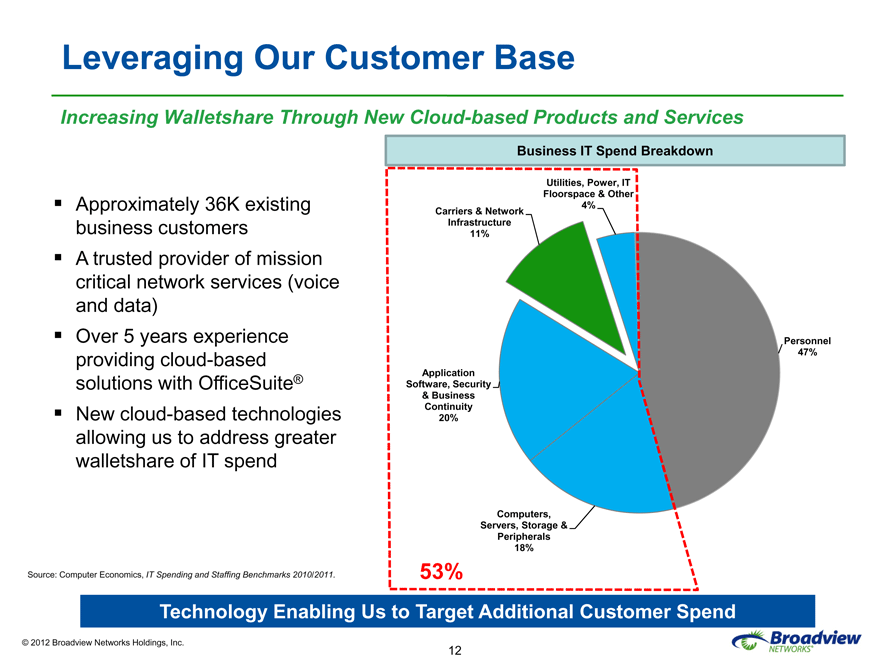
Approximately 36K existing business customers A trusted provider of mission critical network services (voice and data) Over 5 years experience providing cloud-based solutions with OfficeSuite® New cloud-based technologies allowing us to address greater walletshare of IT spend
Business IT Spend Breakdown
Utilities, Power, IT Floorspace & Other 4%
Carriers & Network Infrastructure 11%
Application Software, Security
& Business Continuity 20%
Personnel 47%
Computers, Servers, Storage & Peripherals 18%
53%
Source: Computer Economics, IT Spending and Staffing Benchmarks 2010/2011.
Technology Enabling Us to Target Additional Customer Spend
© 2012 Broadview Networks Holdings, Inc.
Broadview NETWORKS®
12
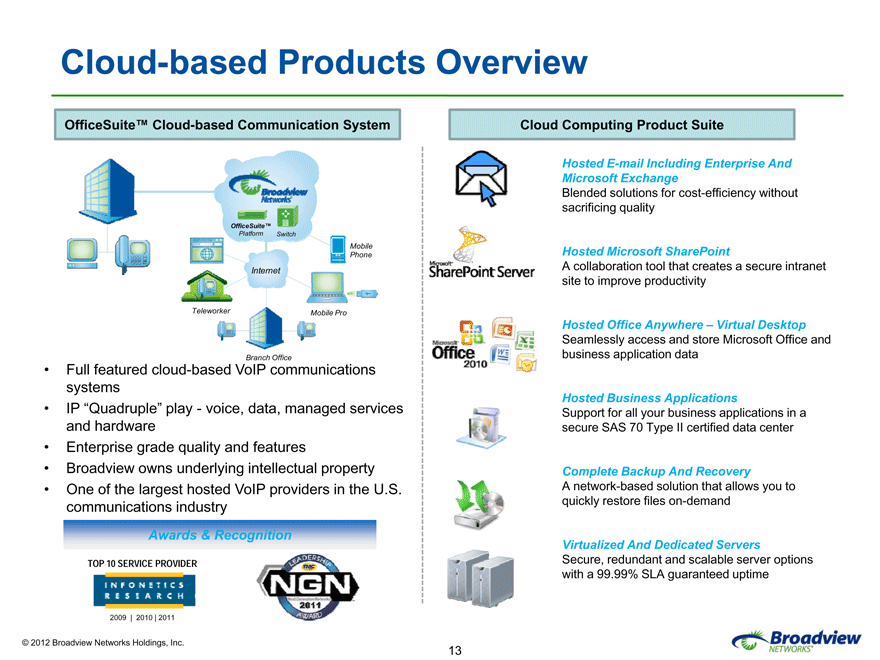
Cloud-based Products Overview
OfficeSuite™ Cloud-based Communication System
OfficeSuite™
Platform Switch
Mobile Phone Internet
Teleworker Mobile Pro
Branch Office
Branch Office
• Full featured cloud-based VoIP communications systems
• IP “Quadruple” play—voice, data, managed services and hardware
• Enterprise grade quality and features
• Broadview owns underlying intellectual property
• One of the largest hosted VoIP providers in the U.S. communications industry
Awards & Recognition
TOP 10 SERVICE PROVIDER
2009 | 2010 | 2011
Infonetics
Research
Leadership
TMC
NGN
2011 Award
Cloud Computing Product Suite
Hosted E-mail Including Enterprise And Microsoft Exchange
Blended solutions for cost-efficiency without sacrificing quality
Microsoft
SharePoint Server
Hosted Microsoft SharePoint
A collaboration tool that creates a secure intranet site to improve productivity
Microsoft
Office 2010
Hosted Office Anywhere – Virtual Desktop
Seamlessly access and store Microsoft Office and business application data
Hosted Business Applications
Support for all your business applications in a secure SAS 70 Type II certified data center
Complete Backup And Recovery
A network-based solution that allows you to quickly restore files on-demand
Virtualized And Dedicated Servers
Secure, redundant and scalable server options with a 99.99% SLA guaranteed uptime
© 2012 Broadview Networks Holdings, Inc.
Broadview
Networks®
13
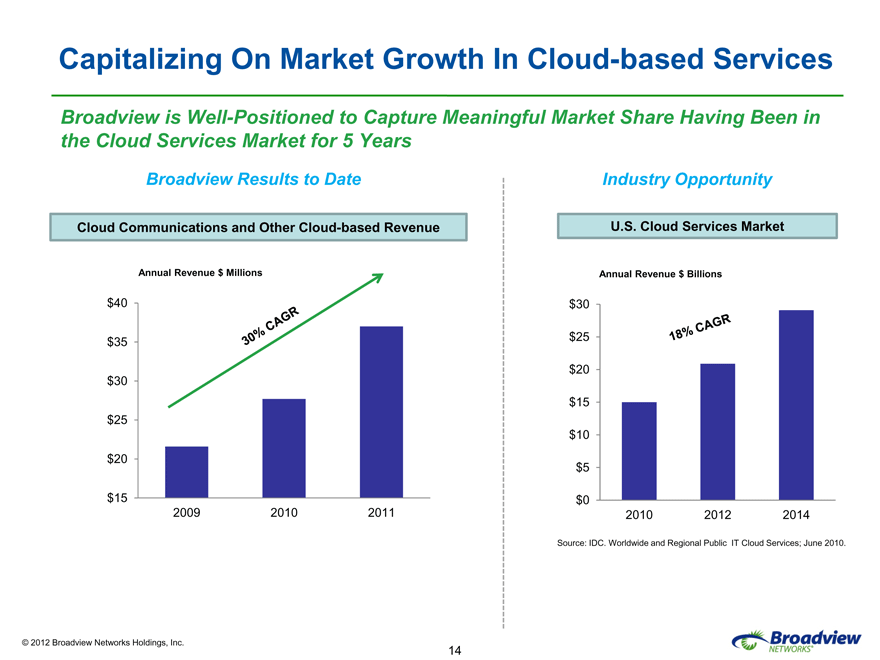
Capitalizing On Market Growth In Cloud-based Services
Broadview is Well-Positioned to Capture Meaningful Market Share Having Been in the Cloud Services Market for 5 Years
Broadview Results to Date
Cloud Communications and Other Cloud-based Revenue
Annual Revenue $ Millions
$40 $35 $30 $25 $20
$15
2009 2010 2011 30% Cagr
Industry Opportunity
U.S. Cloud Services Market
Annual Revenue $ Billions
$30
$25
$20
$15
$10
$5
$0
2010 2012 2014
Source: IDC. Worldwide and Regional Public IT Cloud Services; June 2010.
18% Cagr
© 2012 Broadview Networks Holdings, Inc.
Broadview
Network®
14

Financial Overview
© 2012 Broadview Networks Holdings, Inc.
Broadview
Networks®
15
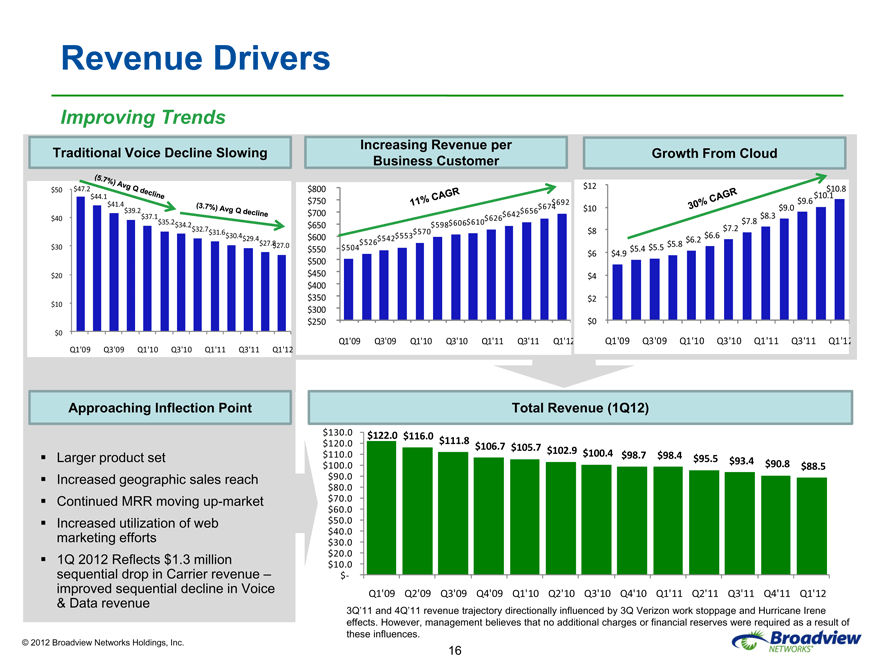
Revenue Drivers
Improving Trends
Traditional Voice Decline Slowing
$50 $47.2
$44.1
$41.4
$39.2
$40 $37.1
$35.2 $34.2
$32.7
$31.6
$30.4 $29.4
$30 $27.8 $27.0
$20
$10
$0
Q1’09 Q3’09 Q1’10 Q3’10 Q1’11 Q3’11 Q1’12
(5.7%) Avg Q decline (3.7%) Avg Q decline
Approaching Inflection Point
Larger product set
Increased geographic sales reach Continued MRR moving up-market Increased utilization of web marketing efforts 1Q 2012 Reflects $1.3 million sequential drop in Carrier revenue –improved sequential decline in Voice
& Data revenue
Increasing Revenue per Business Customer
$800 $750 $692 $674 $700 $656 $642 $626 $650 $598$ 606$610 $570 $600 $526$ 542$ 553 $550 $504 $500 $450 $400 $350 $300 $250
Q1’09 Q3’09 Q1’10 Q3’10 Q1’11 Q3’11 Q1’12
11% Cagr
Growth From Cloud
$12 $10.8
$10.1
$9.6
$10 $9.0
$8.3
$7.8
$8 $7.2
$6.6
$6.2
$5.4 $5.5 $5.8
$6 $4.9
$4
$2
$0
Q1’09 Q3’09 Q1’10 Q3’10 Q1’11 Q3’11 Q1’12
30% Cagr
Total Revenue (1Q12)
$130.0 $122.0 $116.0 $111.8 $120.0 $106.7 $105.7 $110.0 $102.9 $100.4 $98.7 $98.4 $95.5 $93.4 $90.8 $100.0 $88.5 $90.0 $80.0 $70.0 $60.0 $50.0 $40.0 $30.0 $20.0 $10.0 $
Q1’09 Q2’09 Q3’09 Q4’09 Q1’10 Q2’10 Q3’10 Q4’10 Q1’11 Q2’11 Q3’11 Q4’11 Q1’12
3Q’11 and 4Q’11 revenue trajectory directionally influenced by 3Q Verizon work stoppage and Hurricane Irene effects. However, management believes that no additional charges or financial reserves were required as a result of these influences.
© 2012 Broadview Networks Holdings, Inc.
Broadview
Networks®
16
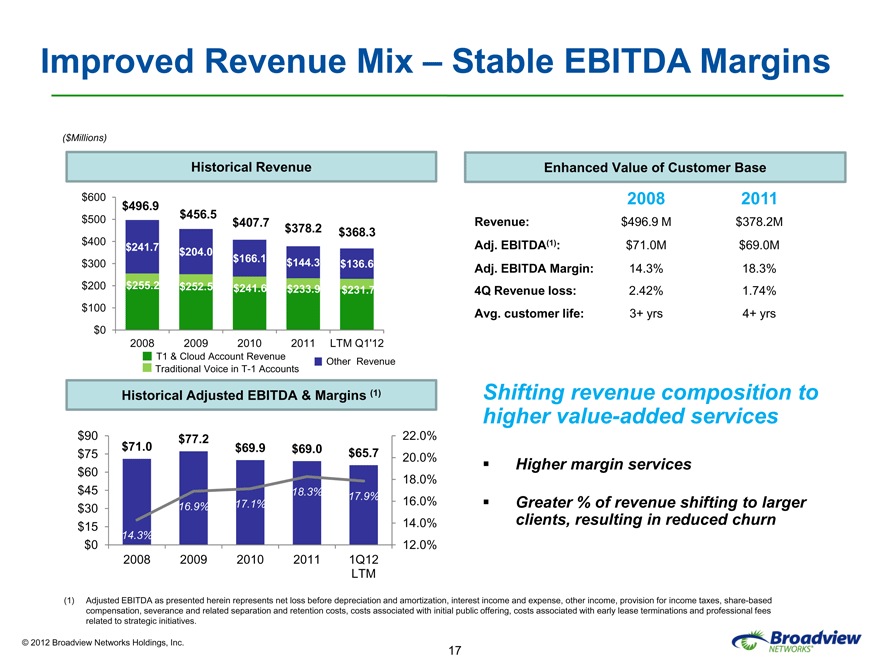
Improved Revenue Mix – Stable EBITDA Margins
($Millions)
Historical Revenue
$600 $496.9 $500 $456.5 $407.7 $378.2 $368.3 $400 $241.7 $204.0 $166.1 $144.3 $300 $136.6 $200 $255.2 $252.5 $241.6 $233.9 $231.7 $100 $0 2008 2009 2010 2011 LTM Q1’12 T1 & Cloud Account Revenue Other Revenue Traditional Voice in T-1 Accounts
Historical Adjusted EBITDA & Margins (1)
$90 $71.0 $77.2 22.0% $69.9 $69.0 $65.7
$75 20.0% $60
$45 18.0%
18.3% 17.9%
16.9% 17.1% 16.0% $30
$15 14.0%
14.3%
$0 12.0% 2008 2009 2010 2011 1Q12 LTM
Enhanced Value of Customer Base
2008 2011
Revenue: $496.9 M $378.2M
Adj. EBITDA(1): $71.0M $69.0M Adj. EBITDA Margin: 14.3% 18.3%
4Q Revenue loss: 2.42% 1.74% Avg. customer life: 3+ yrs 4+ yrs
Shifting revenue composition to higher value-added services
Higher margin services
Greater % of revenue shifting to larger clients, resulting in reduced churn
(1) Adjusted EBITDA as presented herein represents net loss before depreciation and amortization, interest income and expense, other income, provision for income taxes, share-based compensation, severance and related separation and retention costs, costs associated with initial public offering, costs associated with early lease terminations and professional fees related to strategic initiatives.
© 2012 Broadview Networks Holdings, Inc.
Broadview
Networks®
17
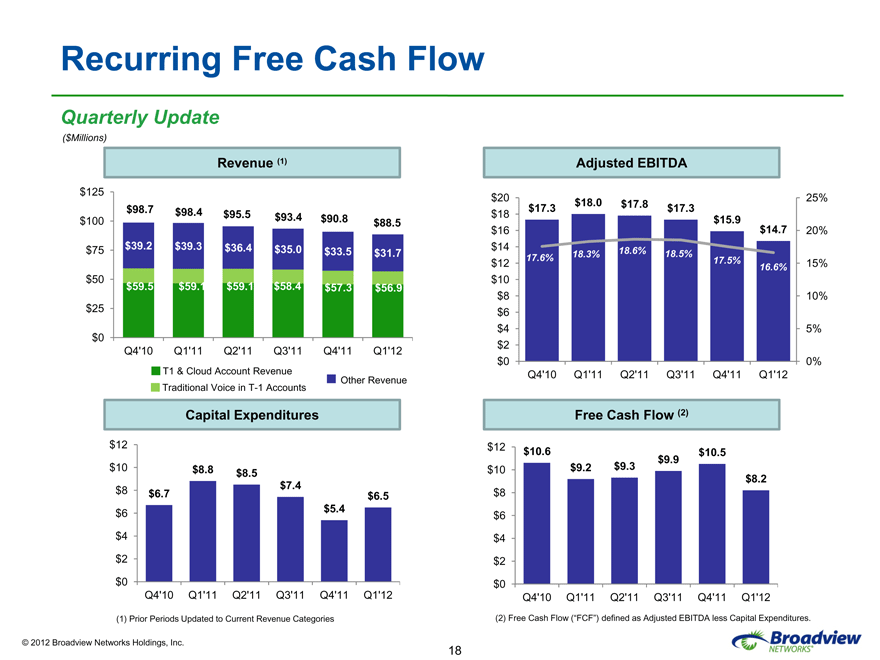
Recurring Free Cash Flow
Quarterly Update
($Millions)
($Millions)
Revenue (1)
$125
$100 $98.7 $98.4 $95.5 $93.4 $90.8 $88.5
$75 $39.2 $39.3 $36.4 $35.0 $33.5 $31.7
$50 $59.5 $59.1 $59.1 $58.4 $57.3 $56.9
$25
$0
Q4’10 Q1’11 Q2’11 Q3’11 Q4’11 Q1’12
T1 & Cloud Account Revenue
Other Revenue
Traditional Voice in T-1 Accounts
Capital Expenditures
$12
$10 $8.8 $8.5
$8 $6.7 $7.4 $6.5
$6 $5.4
$4
$2
$0
Q4’10 Q1’11 Q2’11 Q3’11 Q4’11 Q1’12
(1) Prior Periods Updated to Current Revenue Categories
Adjusted EBITDA
$20 $18.0 $17.8 25%
$17.3 $17.3
$18 $15.9
$16 $14.7 20%
$14 18.6%
$12 17.6% 18.3% 18.5% 17.5% 15%
16.6%
$10
$8 10%
$6
$4 5%
$2
$0 0%
Q4’10 Q1’11 Q2’11 Q3’11 Q4’11 Q1’12
Free Cash Flow (2)
$12 $10.6 $10.5
$9.9
$10 $9.2 $9.3
$8.2
$8
$6
$4
$2
$0
Q4’10 Q1’11 Q2’11 Q3’11 Q4’11 Q1’12
(2) Free Cash Flow (“FCF”) defined as Adjusted EBITDA less Capital Expenditures.
© 2012 Broadview Networks Holdings, Inc.
Broadview
Networks®
18
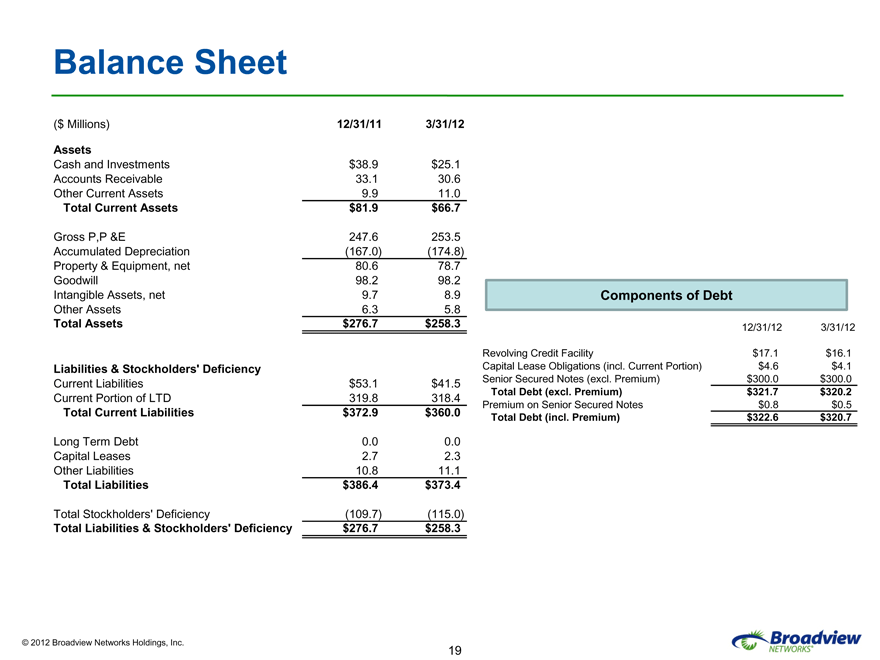
Balance Sheet
($ Millions) 12/31/11 3/31/12
Assets
Cash and Investments $38.9 $25.1 Accounts Receivable 33.1 30.6 Other Current Assets 9.9 11.0
Total Current Assets $81.9 $66.7
Gross P,P &E 247.6 253.5 Accumulated Depreciation (167.0) (174.8) Property & Equipment, net 80.6 78.7 Goodwill 98.2 98.2 Intangible Assets, net 9.7 8.9 Other Assets 6.3 5.8
Total Assets $276.7 $258.3
Liabilities & Stockholders’ Deficiency
Current Liabilities $53.1 $41.5 Current Portion of LTD 319.8 318.4
Total Current Liabilities $372.9 $360.0
Long Term Debt 0.0 0.0 Capital Leases 2.7 2.3
Other Liabilities 10.8 11.1
Total Liabilities $386.4 $373.4
Total Stockholders’ Deficiency (109.7) (115.0)
Total Liabilities & Stockholders’ Deficiency $276.7 $258.3
Components of Debt
12/31/12 3/31/12
Revolving Credit Facility $17.1 $16.1 Capital Lease Obligations (incl. Current Portion) $4.6 $4.1
Senior Secured Notes (excl. Premium) $300.0 $300.0
Total Debt (excl. Premium) $321.7 $320.2
Premium on Senior Secured Notes $0.8 $0.5
Total Debt (incl. Premium) $322.6 $320.7
© 2012 Broadview Networks Holdings, Inc.
Broadview
Networks®
19
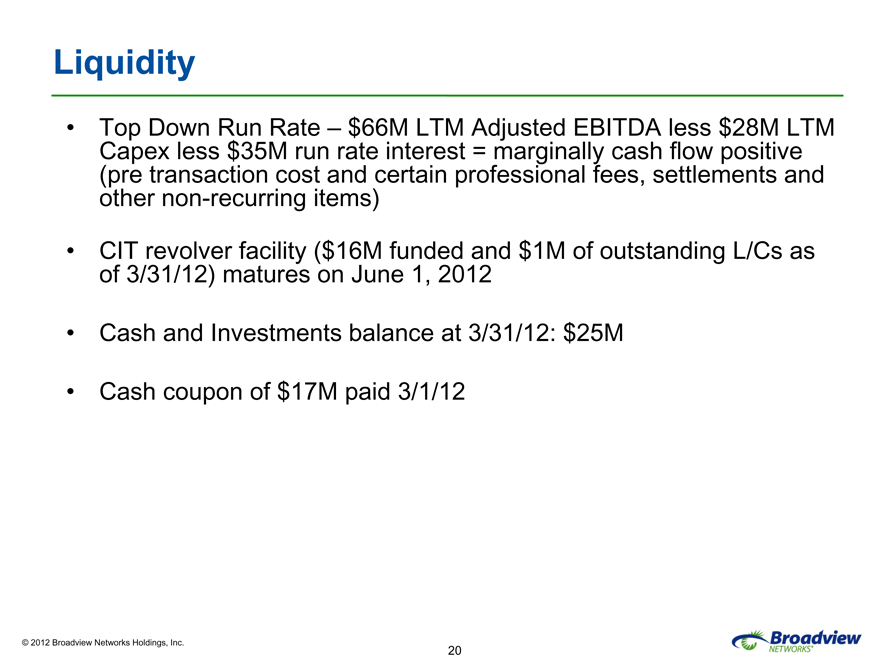
Liquidity
• Top Down Run Rate – $66M LTM Adjusted EBITDA less $28M LTM Capex less $35M run rate interest = marginally cash flow positive (pre transaction cost and certain professional fees, settlements and other non-recurring items)
• CIT revolver facility ($16M funded and $1M of outstanding L/Cs as of 3/31/12) matures on June 1, 2012
• Cash and Investments balance at 3/31/12: $25M
• Cash coupon of $17M paid 3/1/12
© 2012 Broadview Networks Holdings, Inc.
Broadview
Networks®
20
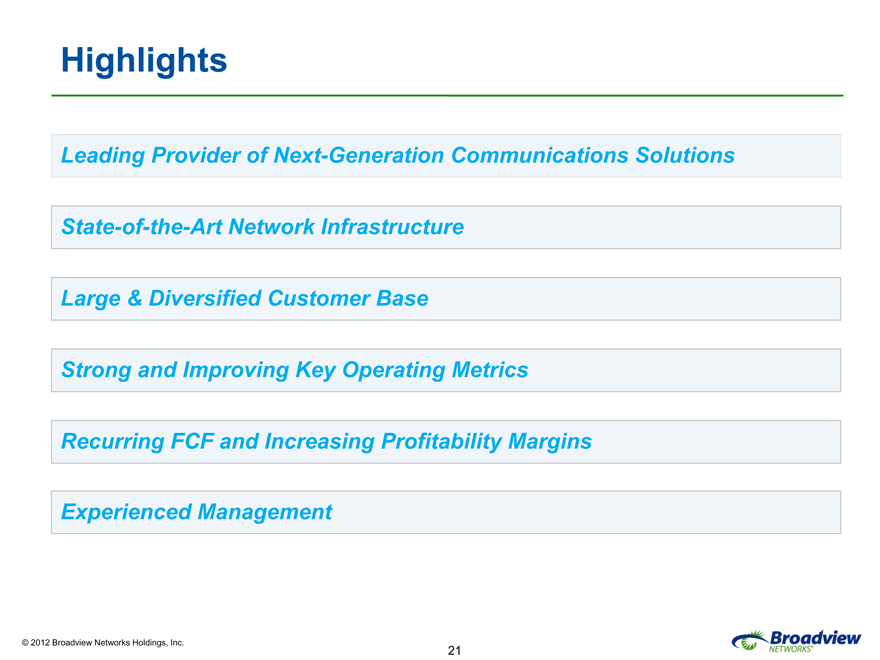
Highlights
Leading Provider of Next-Generation Communications Solutions State-of-the-Art Network Infrastructure Large & Diversified Customer Base Strong and Improving Key Operating Metrics Recurring FCF and Increasing Profitability Margins Experienced Management
© 2012 Broadview Networks Holdings, Inc.
Broadview
Networks®
21
Appendix
© 2012 Broadview Networks Holdings, Inc.
Broadview
Networks®
22
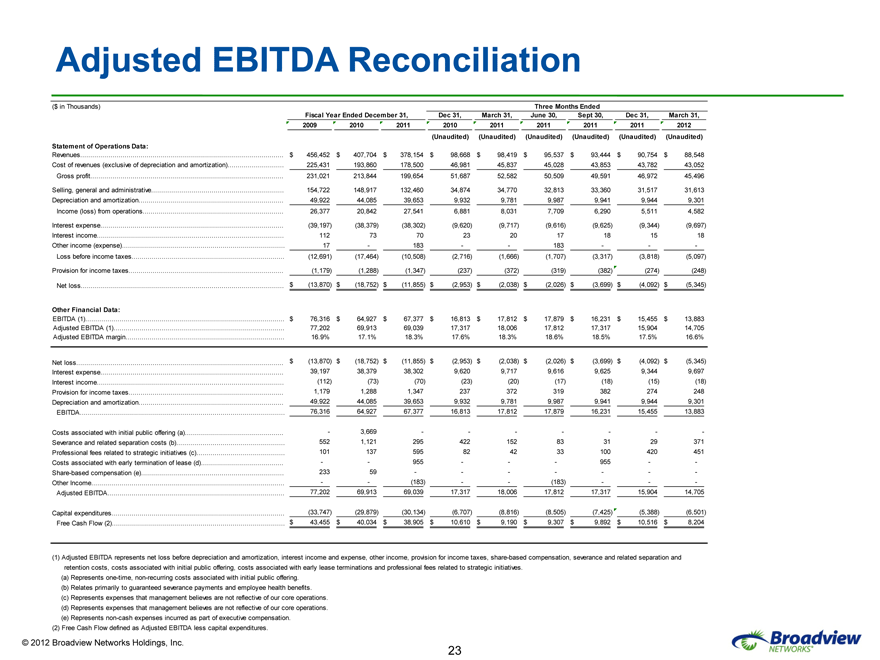
Adjusted j EBITDA Reconciliation
($ in Thousands) Three Months Ended
Fiscal Year Ended December 31, Dec 31, March 31, June 30, Sept 30, Dec 31, March 31,
2009 2010 2011 2010 2011 2011 2011 2011 2012
(Unaudited) (Unaudited) (Unaudited) (Unaudited) (Unaudited) (Unaudited)
Statement of Operations Data:
Revenues $ 456,452 $ 407,704 $ 378,154 $ 98,668 $ 98,419 $ 95,537 $ 93,444 $ 90,754 $ 88,548
Cost of revenues (exclusive of depreciation and amortization) 225,431 193,860 178,500 46,981 45,837 45,028 43,853 43,782 43,052
Gross profit 231,021 213,844 199,654 51,687 52,582 50,509 49,591 46,972 45,496
Selling, general and administrative 154,722 148,917 132,460 34,874 34,770 32,813 33,360 31,517 31,613
Depreciation and amortization 49,922 44,085 39,653 9,932 9,781 9,987 9,941 9,944 9,301
Income ((loss)) from operationsp 26,377, 20,842, 27,541, 6,881, 8,031, 7,709, 6,290, 5,511, 4,582,
Interest expense (39,197) (38,379) (38,302) (9,620) (9,717) (9,616) (9,625) (9,344) (9,697)
Interest income 112 73 70 23 20 17 18 15 18
Other income (expense)( p ) 17 - 183 - - 183 - - -
Loss before income taxes (12,691) (17,464) (10,508) (2,716) (1,666) (1,707) (3,317) (3,818) (5,097)
Provision for income taxes (1,179)( ) (1,288)( ) (1,347)( ) (237)( ) (372)( ) (319)( ) (382)( ) (274)( ) (248)( )
Net loss $ (13,870) $ (18,752) $ (11,855) $ (2,953) $ (2,038) $ (2,026) $ (3,699) $ (4,092) $ (5,345)
Other Financial Data:
EBITDA (1) $ 76,316 $ 64,927 $ 67,377 $ 16,813 $ 17,812 $ 17,879 $ 16,231 $ 15,455 $ 13,883
Adjusted EBITDA (1) 77,202 69,913 69,039 17,317 18,006 17,812 17,317 15,904 14,705
Adjusted EBITDA margin 16.9% 17.1% 18.3% 17.6% 18.3% 18.6% 18.5% 17.5% 16.6%
Net loss $ (13,870) $ (18,752) $ (11,855) $ (2,953) $ (2,038) $ (2,026) $ (3,699) $ (4,092) $ (5,345)
Interest expense 39,197 38,379 38,302 9,620 9,717 9,616 9,625 9,344 9,697
Interest income (112) (73) (70) (23) (20) (17) (18) (15) (18)
Provision for income taxes 1,179, 1,288, 1,347, 237 372 319 382 274 248
Depreciation and amortization 49,922 44,085 39,653 9,932 9,781 9,987 9,941 9,944 9,301
EBITDA 76,316 64,927 67,377 16,813 17,812 17,879 16,231 15,455 13,883
Costs associated with initial public offering (a) - 3,669 - - - - - - -
Severance and related separationp costs (b)( ) 552 1,121 295 422 152 83 31 29 371
Professional fees related to strategic initiatives (c) 101 137 595 82 42 33 100 420 451
Costs associated with early termination of leaselease (d) - - 955 - - - 955 - -
Share-based compensation (e) 233 59 - - - - - - -
Other Income - - (183) - - (183) - - -
Adjustedj EBITDA 77,202 69,913 69,039 17,317 18,006 17,812 17,317 15,904 14,705
Capital expenditures (33,747) (29,879) (30,134) (6,707) (8,816) (8,505) (7,425) (5,388) (6,501)
Free Cash Flow (2) $ 43,455 $ 40,034 $ 38,905 $ 10,610 $ 9,190 $ 9,307 $ 9,892 $ 10,516 $ 8,204
(1) Adjusted EBITDA represents net loss before depreciation and amortization amortization, interest income and expense, other income, provision provision for income taxes, share-based compensation, severance and related separation and retention costs, costs associated with initial public offering, costs associated with early lease terminations and professional fees related to strategic initiatives.
(a) Represents one-time, non-recurring costs associated with initial public offering. (b) ( ) Relates primarily p y to guaranteed g severance payments p y and employee p y health benefits.
(c) Represents expenses that management believes are not reflective of our core operations. (d) Represents expenses that management believes are not reflective of our core operations. (e) Represents non-cash expenses incurred as part of executive compensation.
(2) Free Cash Flow defined as Adjusted EBITDA less capital expenditures.
© 2012 Broadview Networks Holdings, Inc.
23
