Attached files
| file | filename |
|---|---|
| 8-K - VERIFONE SYSTEMS, INC. | q2fy12earningsrelease8k.htm |
| EX-99.1 - PRESS RELEASE, DATED MAY 24, 2012, TITLED "VERIFONE REPORTS RESULTS FOR THE SECOND QUARTER OF FISCAL 2012" - VERIFONE SYSTEMS, INC. | q22012pressrelease.htm |

Financial Results for the Quarter Ended April 30, 2012 1 Exhibit 99.2

F O R WAR D - L O O K I N G S TAT E M E N T S Today’s discussion may include “forward-looking statements” within the meaning of the Private Securities Litigation Reform Act of 1995. Such statements relate to future events and expectations and involve known and unknown risks and uncertainties. VeriFone’s actual results or actions may differ materially from those projected in the forward-looking statements. For a summary of the specific risk factors that could cause results to differ materially from those expressed in the forward-looking statements, please refer to VeriFone’s filings with the Securities and Exchange Commission, including its annual report on Form 10-K and quarterly reports on Form 10-Q. VeriFone is under no obligation to, and expressly disclaims any obligation to, update or alter its forward-looking statements, whether as a result of new information, future events, changes in assumptions or otherwise. 2

N O N - G A A P F I N AN C I A L M E AS U R E S With respect to any Non-GAAP financial measures presented in the information, reconciliations of Non-GAAP to GAAP financial measures may be found in VeriFone’s quarterly earnings release as filed with the Securities and Exchange Commission as well as the Appendix to these slides. Management uses Non-GAAP financial measures only in addition to and in conjunction with results presented in accordance with GAAP. Management believes that these Non-GAAP financial measures help it to evaluate VeriFone’s performance and to compare VeriFone’s current results with those for prior periods as well as with the results of peer companies. These Non-GAAP financial measures contain limitations and should be considered as a supplement to, and not as a substitute for, or superior to, disclosures made in accordance with GAAP. 3

N O N - G A A P P R O F I T & L O S S O V E R V I E W * 4 * A reconciliation of our GAAP to Non-GAAP profit & loss can be found on slides 15 and 16 ($ in thousands, except EPS) Q211 Q112 Q212 % SEQ Inc(Dec) % YoY Inc(Dec) Revenue 292,776 425,200 479,364 12.7% 63.7% Gross Margin 127,191 182,533 214,018 17.2% 68.3% Gross Margin % 43.4% 42.9% 44.6% Operating Expense 71,034 95,334 111,868 17.3% 57.5% Operating Expense % 24.3% 22.4% 23.3% Operating Profit 56,157 87,199 102,150 17.1% 81.9% Operating Margin % 19.2% 20.5% 21.3% Net Interest and Other (2,527) (8,465) (15,030) 77.6% 494.8% Pre-tax Profit 53,630 78,734 87,120 10.7% 62.4% Taxes 10,726 14,689 15,683 6.8% 46.2% Net Income 42,904 64,045 71,437 11.5% 66.5% Net Income % 14.7% 15.1% 14.9% EPS 0.46 0.58 0.64 10.3% 39.1% Q212

N O N - G A A P R E V E N U E P R O F I L E * 5 * A reconciliation of our GAAP to Non-GAAP revenue can be found on slide 17 ($ in thousands) Q211 Q112 Q212 % SEQ Inc(Dec) % YoY Inc(Dec) % of Total North America 120,628 119,965 129,205 7.7% 7.1% 27.0% EMEA 93,697 159,003 205,073 29.0% 118.9% 42.8% Latin America 56,217 100,289 96,205 -4.1% 71.1% 20.0% Asia Pacific 22,234 45,943 48,881 6.4% 119.8% 10.2% Total 292,776 425,200 479,364 12.7% 63.7% 100.0% Q212 ($ in millions) Q211 Q212 % YoY Inc (Dec) Non-GAAP Net Revenues VeriFone Organic North America 120.6$ 120.5$ -0.1% EMEA [a] 87.3 96.2 10.1% Latin America 56.2 82.2 46.1% Asia Pacific 22.2 29.4 32.3% Total Organic 286.4 328.2 14.6% Acquisitions Date of Acquisition Hypercom 8/4/2011 81.0 Point 12/30/2011 6.4 [a] 57.5 Others 12.7 Total Acquisitions 6.4 151.2 Total Non-GAAP Revenues 292.8 479.4 63.7% Deferred Revenue Adj. (0.3) (7.3) GAAP Net Revenues 292.4$ 472.0$ [a] Sales by VeriFone to Point in periods twelve months prior to the acquisition are not included in Organic revenues. Point was a customer of VeriFone prior to the acquisition. This presentation provides consistency and comparability between periods because such sales post acquisition from VeriFone to Point would have been considered intercompany sales and thus would not have been included in consolidated results.

L I F T R E TA I L 6 Interactive Digital Marketing Hub Drives Incremental Purchases Intelligent personalized suggestive selling Network connected affinity engine makes smart upsell recommendation Digital consumer messaging coordinated with smart cashier script Cashier and consumer touchscreens makes it efficient to add items Compatible with all leading C-Store Point-Of-Sale Strong distribution channel interest generated from VeriFone’s April Customer Forum Advertiser funded model Increases store sales by 2 to 5% Offer conversion rates as high as 40%

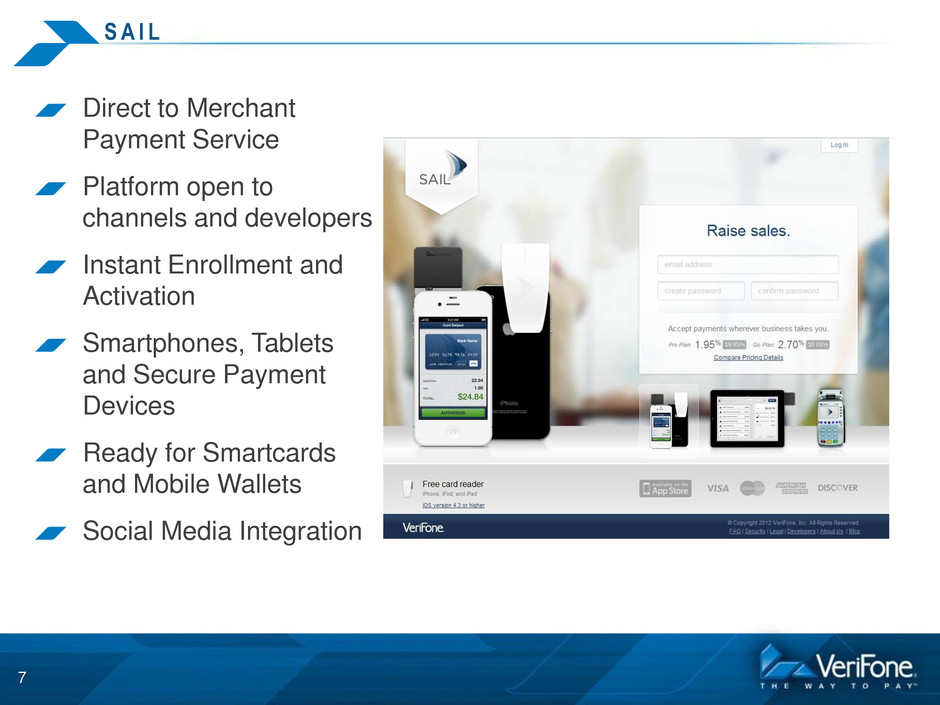
S A I L Direct to Merchant Payment Service Platform open to channels and developers Instant Enrollment and Activation Smartphones, Tablets and Secure Payment Devices Ready for Smartcards and Mobile Wallets Social Media Integration 7

FINANCIAL RESULTS AND GUIDANCE 8

N O N - G A A P G R O S S M A R G I N * 9 * A reconciliation of our GAAP to Non-GAAP gross margin can be found on slide 18 Q211 Q112 Q212 System Solutions 43.2% 42.8% 44.6% Services 44.5% 43.4% 44.8% Total 43.4% 42.9% 44.6% % of Revenue

N O N - G A A P O P E R AT I N G E X P E N S E S * 10 * A reconciliation of our GAAP to Non-GAAP operating expenses can be found on slide 19 % of Revenue Q211 Q112 Q212 Research and Development 8.4% 7.5% 7.4% Sales and Marketing 9.4% 8.2% 8.6% General and Administrative 6.5% 6.7% 7.3% Total 24.3% 22.4% 23.3%

C AS H F L O W AN D B AL A N C E S H E E T 11 ($ in thousands, except Days) $ $ $ Cash Flow from Operations before Changes in Working Capital 46,454 35,722 79,548 Cash Flow from Operations 38,422 32,168 18,083 Key Balance Sheet Items: Cash 531,542 379,979 361,037 Accounts Receivables, net 208,373 66 302,559 67 336,671 68 Accounts Receivables Reserves (5,333) (5,613) (6,004) Inventories, net 106,411 59 171,414 58 162,107 57 Inventories Reserves (28,270) (56,296) (55,555) Accounts Payable 93,367 51 152,279 56 138,107 47 Deferred Revenue, net 82,232 130,893 130,144 Note: Accounts Receivable Days Sales Outstanding is calculated based on Gross Accounts Receivable Net of Reserve for Product Returns. Days in Inventory is calculated as Average Net Inventory divided by Total Non-GAAP Cost of Net Revenues. Days in Accounts Payable is calculated as Accounts Payable divided by Total Non-GAAP Cost of Net Revenues. Q212 Days Q112 Days Q211 Days

G U I D AN C E • For the third quarter ending July 31, 2012, VeriFone expects to report non-GAAP net revenues in the range of $495 million to $500 million. Non-GAAP net income per diluted share is projected to be in the range of $0.68 to $0.70. • For the full year of fiscal 2012, VeriFone expects to report non-GAAP net revenues, including ten months of Point revenue, in the range of $1.900 billion to $1.925 billion. Non-GAAP net income per diluted share is projected to be in the range of $2.60 to $2.66 for the same time period. 12

Q & A SESSION 13

APPENDIX 14

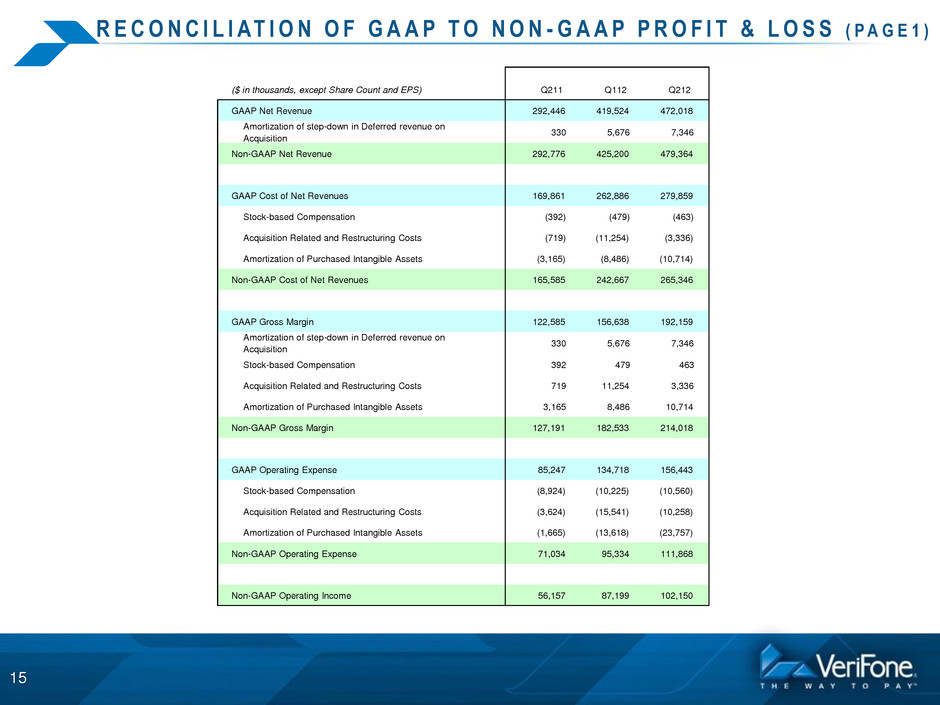
R E C O N C I L I AT I O N O F G A A P T O N O N - G A A P P R O F I T & L O S S ( P A G E 1 ) 15 ($ in thousands, except Share Count and EPS) Q211 Q112 Q212 GAAP Net Revenue 292,446 419,524 472,018 Amortization of step-down in Deferred revenue on Acquisition 330 5,676 7,346 Non-GAAP Net Revenue 292,776 425,200 479,364 GAAP Cost of Net Revenues 169,861 262,886 279,859 Stock-based Compensation (392) (479) (463) Acquisition Related and Restructuring Costs (719) (11,254) (3,336) Amortization of Purchased Intangible Assets (3,165) (8,486) (10,714) Non-GAAP Cost of Net Revenues 165,585 242,667 265,346 GAAP Gross Margin 122,585 156,638 192,159 Amortization of step-down in Deferred revenue on Acquisition 330 5,676 7,346 Stock-based Compensation 392 479 463 Acquisition Related and Restructuring Costs 719 11,254 3,336 Amortization of Purchased Intangible Assets 3,165 8,486 10,714 Non-GAAP Gross Margin 127,191 182,533 214,018 GAAP Operating Expense 85,247 134,718 156,443 Stock-based Compensation (8,924) (10,225) (10,560) Acquisition Related and Restructuring Costs (3,624) (15,541) (10,258) Amortization of Purchased Intangible Assets (1,665) (13,618) (23,757) Non-GAAP Operating Expense 71,034 95,334 111,868 Non-GAAP Operating Income 56,157 87,199 102,150

R E C O N C I L I AT I O N O F G A A P T O N O N - G A A P P R O F I T & L O S S ( P A G E 2 ) 16 ($ in thousands, except Share Count and EPS) Q211 Q112 Q212 Non-GAAP Operating Income (from page 1) 56,157 87,199 102,150 GAAP Net Interest and Other (9,052) (34,825) (19,205) Acquisition Related Costs and Interest Charges 2,763 20,085 (17) Non-Cash Interest Expense 3,762 6,227 4,094 Non-Operating Gains 0 48 98 Non-GAAP Net Interest and Other (2,527) (8,465) (15,030) Non-GAAP Pre-tax Profit 53,630 78,734 87,120 GAAP Provision for (Benefit from) Income Taxes 3,086 (9,782) 2,025 Income Tax Effect of Non-GAAP Exclusions 7,640 24,471 13,658 Non-GAAP Provision for Income Taxes 10,726 14,689 15,683 Non-GAAP Net Income 42,904 64,045 71,437 88,418 105,833 106,898 93,434 105,833 111,148 Additional Shares dilutive for non-GAAP net income (387) 3,728 (371) Non-GAAP Diluted Shares 93,047 109,561 110,777 Non-GAAP Diluted EPS 0.46 0.58 0.64 GAAP Basic Shares Weighted average shares used in computing net income (loss) per share: GAAP Diluted Shares

R E C O N C I L I AT I O N O F G A A P T O N O N - G A A P R E V E N U E 17 ($ in thousands) Q211 Q112 Q212 GAAP Net Revenue: North America 120,734 119,630 128,907 Amortization of step-down in Deferred revenue on Acquisition (106) 335 298 Non-GAAP Net Revenue: North America 120,628 119,965 129,205 GAAP Net Revenue: Europe 93,263 154,907 198,941 Amortization of step-down in Deferred revenue on Acquisition 434 4,096 6,132 Non-GAAP Net Revenue: Europe 93,697 159,003 205,073 GAAP Net Revenue: Latin America 56,217 100,289 96,205 Amortization of step-down in Deferred revenue on Acquisition 0 0 0 Non-GAAP Net Revenue: Latin America 56,217 100,289 96,205 GAAP Net Revenue: Asia 22,232 44,698 47,965 Amortization of step-down in Deferred revenue on Acquisition 2 1,245 916 Non-GAAP Net Revenue: Asia 22,234 45,943 48,881 GAAP Net Revenue 292,446 419,524 472,018 Amortization of step-down in Deferred revenue on Acquisition 330 5,676 7,346 Non-GAAP Net Revenue 292,776 425,200 479,364

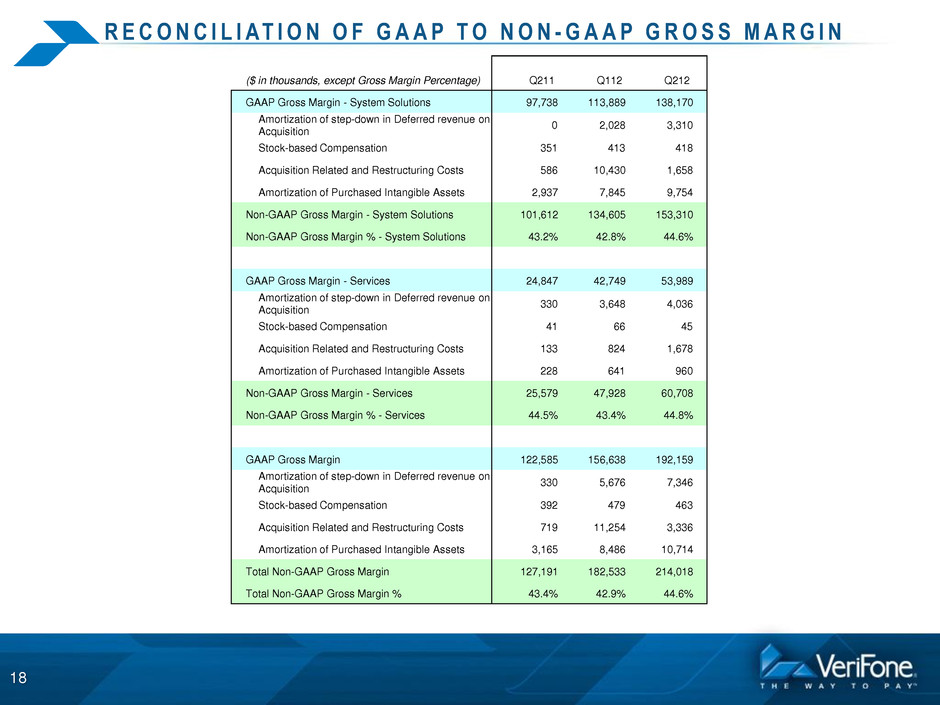
R E C O N C I L I AT I O N O F G A A P T O N O N - G A A P G R O S S M A R G I N 18 ($ in thousands, except Gross Margin Percentage) Q211 Q112 Q212 GAAP Gross Margin - System Solutions 97,738 113,889 138,170 Amortization of step-down in Deferred revenue on Acquisition 0 2,028 3,310 Stock-based Compensation 351 413 418 Acquisition Related and Restructuring Costs 586 10,430 1,658 Amortization of Purchased Intangible Assets 2,937 7,845 9,754 Non-GAAP Gross Margin - System Solutions 101,612 134,605 153,310 Non-GAAP Gross Margin % - System Solutions 43.2% 42.8% 44.6% GAAP Gross Margin - Services 24,847 42,749 53,989 Amortization of step-down in Deferred revenue on Acquisition 330 3,648 4,036 Stock-based Compensation 41 66 45 Acquisition Related and Restructuring Costs 133 824 1,678 Amortization of Purchased Intangible Assets 228 641 960 Non-GAAP Gross Margin - Services 25,579 47,928 60,708 Non-GAAP Gross Margin % - Services 44.5% 43.4% 44.8% GAAP Gross Margin 122,585 156,638 192,159 Amortization of step-down in Deferred revenue on Acquisition 330 5,676 7,346 Stock-based Compensation 392 479 463 Acquisition Related and Restructuring Costs 719 11,254 3,336 Amortization of Purchased Intangible Assets 3,165 8,486 10,714 Total Non-GAAP Gross Margin 127,191 182,533 214,018 Total Non-GAAP Gross Margin % 43.4% 42.9% 44.6%

R E C O N C I L I AT I O N O F G A A P T O N O N - G A A P O P E R AT I N G E X P E N S E S 19 ($ in thousands, except Percentage) Q211 Q112 Q212 GAAP R&D 25,402 35,079 37,849 Stock-based Compensation (939) (1,253) (1,201) Acquisition Related and Restructuring Costs (7) (1,859) (1,043) Non-GAAP R&D 24,456 31,967 35,605 Non-GAAP R&D as % of Revenue 8.4% 7.5% 7.4% GAAP S&M 31,139 39,986 46,141 Stock-based Compensation (3,550) (4,262) (4,405) Acquisition Related and Restructuring Costs (93) (820) (278) Amortization of Purchased Intangible Assets (3) 0 Non-GAAP S&M 27,496 34,901 41,458 Non-GAAP S&M as % of Revenue 9.4% 8.2% 8.6% GAAP G&A 28,706 59,653 72,453 Stock-based Compensation (4,435) (4,710) (4,954) Acquisition Related and Restructuring Costs (3,524) (12,862) (8,937) Amortization of Purchased Intangible Assets (1,665) (13,615) (23,757) Non-GAAP G&A 19,082 28,466 34,805 Non-GAAP G&A as % of Revenue 6.5% 6.7% 7.3% Total Non-GAAP Operating Expenses 71,034 95,334 111,868 Total Non-GAAP Operating Expenses as % of Revenue 24.3% 22.4% 23.3%

Financial Results for the Quarter Ended April 30, 2012 20
