Attached files
| file | filename |
|---|---|
| 8-K - FORM 8-K - PSS WORLD MEDICAL INC | d357787d8k.htm |
 PSS WORLD
MEDICAL INVESTOR DAY 2012
May 24, 2012
InterContinental Hotel -
Times Square
New York, NY
EXHIBIT 99.1 |
 FORWARD-LOOKING
STATEMENTS During this meeting and its replay, we may make a number of forward-looking
statements regarding revenue, gross margin, operating expenses, operating margins,
earnings per share and other matters that are not historical facts. Additionally, we may
include statements regarding the plans, strategies and objectives of management for
future operations, including execution of our restructuring plans, and the additional
investment in, and disposition of, certain business operations; statements or projections of
cost savings, growth rates, profitability, investment levels or other financial items;
statements regarding anticipated operational results and management’s estimate of
pro forma financial results, and any statements of assumptions underlying any of the
foregoing. Those statements involve a number of risks and uncertainties that could cause
actual results to differ materially from what is expressed or forecasted. For a list and
descriptions of certain of these risks and uncertainties, we refer you to the
forward-looking statement disclosure and other information provided in our most
recent Form 10-K and other SEC filings, copies of which are available from the SEC,
from the investor relations section of our website, or requested from us in investor
relations. The Company wishes to caution listeners of the conference and its replay and/or
participants in this meeting not to place undue reliance on any such forward-looking
statements, which statements are made pursuant to the Private Securities Litigation
Reform Act of 1995 and, as such, speak only as of the date made. The Company also wishes
to caution listeners and participants that it undertakes no duty or is under no
obligation to update or revise any forward-looking statements, except as may be
required by law.
We may reference certain non-GAAP financial measures in an effort to provide additional
information to investors. All non-GAAP measures have been reconciled to the related
GAAP measures in accordance with SEC rules. You'll find reconciliation charts in this
presentation and in the Financial Supplement on our website, at www.pssworldmedical.com.
2 |
 AGENDA
3
INDUSTRY OVERVIEW AND
STRATEGIC TRANSFORMATION
FINANCIAL TRANSFORMATION
GO TO MARKET STRATEGIES
OPERATIONS OVERVIEW
SUMMARY
QUESTIONS AND ANSWERS
Gary Corless, President & CEO
David Bronson, EVP & CFO
Eddie Dienes, President, PSS
Brad Hilton, Chief Service Officer
Gary Corless, President & CEO |
 INDUSTRY OVERVIEW
AND STRATEGIC TRANSFORMATION
4
Gary Corless, President & CEO |
 5
Healthcare Costs as % of U.S. GDP
Source: Centers for Medicare & Medicaid Services
16%
17%
18%
20%
2005
2010
2015
2020
THE HEALTHCARE INDUSTRY MUST CHANGE |
 Time
Reimbursement
Pressures
Healthcare
Reform
Consolidation
Economic
Environment
Unemployment
Lower Utilization
RAPID CHANGE REQUIRES BOLD ACTION
6 |
 OUR VISION FOR
MOVING FORWARD 7
Common Distribution Infrastructure
World-Class Shared Services Team
Information Technology Platform
1 |
 RATIONALE FOR FOUR
VERTICALS 8
Payer & Patient Preferred
Higher Growth
Demonstrated Core Competency
Higher Profitability |
 FOCUSED ON GROWTH
AND MARGIN 9
Market Growth Rate (%)
$ in Billions
2
0
2
4
6
8
10
12
-
$8
$8
Physician
Laboratory
In-Office
Dispensing
Skilled Nursing
Facilities
Home Care
& Hospice
$8
$5
$1.5
16
14
12
10
8
6
4
2
0
Specialty Dental |
 FOCUSED STRUCTURE
FOR GROWTH Physician
Business
Extended
Care
10
POST-TRANSFORMATION
Skilled
Nursing
Specialty
Dental
PRE-TRANSFORMATION |
 TARGET
MARKET
OPPORTUNITY
11
STRATEGIC
OBJECTIVE
•
Size: $7-9 Billion
•
Historic growth
rate: 2-4%
•
Number of sites:
>200,000
•
Current market
share: 15%
Accelerate revenue growth through innovative and
differentiated solutions that strengthen primary care and front
line specialists in a range of practices including health systems
COMPETITIVE
ADVANTAGES
•
Large, well-trained
sales force
•
Differentiated
service model
•
Industry-leading
private label
offering
PHYSICIAN
5 Year Market Share Goal: 25% |
 TARGET
MARKET
OPPORTUNITY
12
STRATEGIC
OBJECTIVE
•
Size: $6-9 Billion
•
Historic growth
rate: 5-6%
•
Number of sites:
100,000 physician
office laboratories
•
Current market
share: 6-8%
Market-leading distributor of laboratory products and services
to physician offices, independent clinical labs & small hospitals
COMPETITIVE
ADVANTAGES
•
Laboratory
expertise
•
Breadth of offering
•
Size and knowledge
of sales force
LABORATORY
5 Year Market Share Goal: 15% |
 TARGET
MARKET
OPPORTUNITY
13
STRATEGIC
OBJECTIVE
•
Size: $1-2 Billion
•
Historic growth
rate: 10-15%
•
Number of sites:
40,000
•
Current market
share: 6-8%
Market leader for in-office dispensing solutions for physician
offices, urgent care, work-site clinics and community health
centers
COMPETITIVE
ADVANTAGES
•
Industry-leading
customer technology
platform
•
Full service turnkey
dispensing solutions
•
Size and knowledge
of sales force
DISPENSING
5 Year Market Share Goal: 20-25% |
 TARGET
MARKET
OPPORTUNITY
14
STRATEGIC
OBJECTIVE
•
Size: $1-5 Billion
•
Historic growth
rate: 7-8%
•
Number of sites:
12,000 agencies and
3,500 hospice sites
•
Current market
share: 10%
Market leader for innovative products and services for home
care agencies and hospice providers
COMPETITIVE
ADVANTAGES
•
Broad product and
service offering
•
Differentiated
service model
•
Customer
technology
solutions
HOME CARE & HOSPICE
5 Year Market Share Goal: 10-15% |
 5 YEAR VISION
15
2X
Revenues
10%
Operating Margin |
 FOCUSED FOR
GROWTH 16
“External opportunities met with
internal competencies in a unique way.” |
 FINANCIAL
TRANSFORMATION 17
David Bronson, EVP & CFO |
 2011 INVESTOR DAY
REPORT CARD 18
FY12 Goal
FY12 Actual
Revenue Growth
7-9%
3.3%
EPS
$1.46-1.50
$1.38
Operating Cash Flow
$115-120 million
$128.4 million |
 TRANSFORMING FOR
GROWTH 19
Focused
Growth
Leadership Team
Experience
Strong Financial Base |
 ($ in
millions) Revenue
Gross Profit
Gross Percentage
SG&A
Operating Income
Operating Percentage
Interest/Other
Pre-tax
Taxes
Net Income
EPS
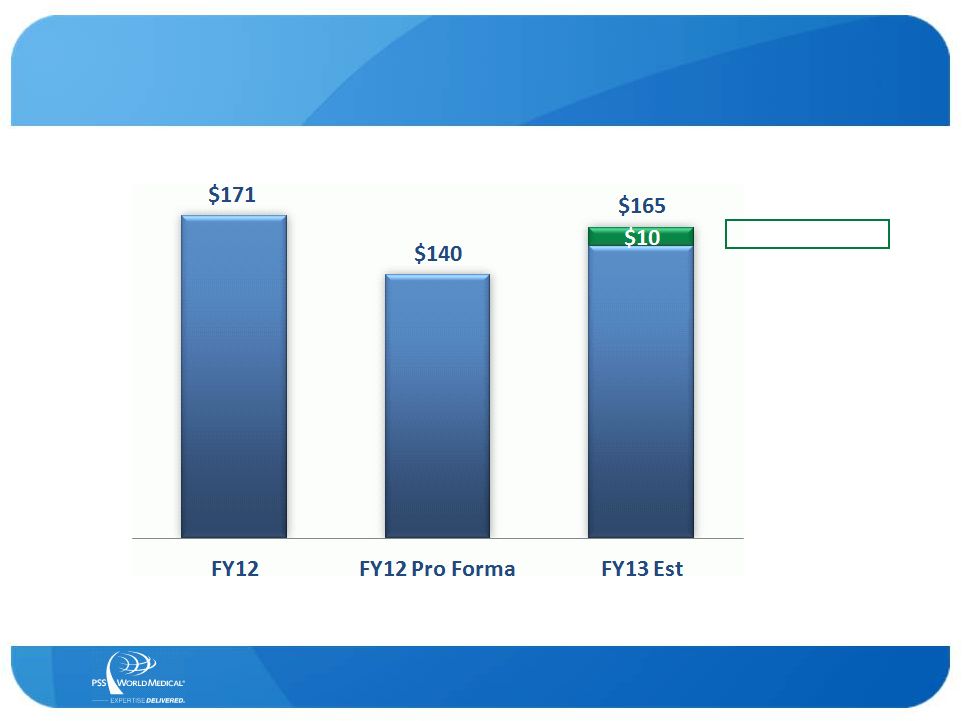
EBITDA
FY12
PRO
FORMA
CARVE-OUT
INCOME
STATEMENT
20
* Pro forma financial information excludes Skilled Nursing and Specialty Dental businesses and
represents management’s best estimate as of the date of this presentation and may
differ materially from actual pro forma financial results. Skilled
Nursing
$ 485
137
28.3%
120
17
3.6%
-
17
6
11
$ 0.21
$ 23
FY12
(As Reported)
Consolidated
$ 2,102
674
32.1%
541
133
6.3%
18
115
41
74
$ 1.38
$ 171
FY12
Pro Forma
$ 1,571
522
33.2%
413
109
6.9%
18
91
32
59
$ 1.08
$ 141
Specialty
Dental
$ 46
15
33.0%
8
7
15.8%
-
7
3
4
$ 0.09
$ 7 |
 FY11-12 PRO
FORMA INCOME STATEMENT 21
* Pro forma financial information excludes Skilled Nursing and Specialty Dental businesses and
represents management’s best estimate as of the date of this presentation and may
differ materially from actual pro forma financial results. ($ in millions)
FY12
Pro Forma
FY11
Pro Forma
Percent
Change
Revenue
$ 1,571
$ 1,485
5.8%
Gross Profit
522
478
Gross Percentage
33.2%
32.2%
98 bp
SG&A
413
379
Operating Income
109
99
9.5%
Operating Percentage
6.9%
6.7%
23 bp
Interest/Other
18
15
Pre-tax
91
84
Taxes
32
31
Net Income
59
53
EPS
$ 1.08
$ 0.94
15.6%
EBITDA
$ 141
$ 127 |
 GROWTH EXPECTATIONS
BY VERTICAL 22
* Baseline is estimated FY12 pro forma financial information adjusted for recent acquisitions.
Physician
$ 1,030
12-13%
3-5%
9-10%
Total
$ 1,700
13-15%
5-7%
10%
($ in millions)
BASELINE
Revenue
5 YEAR TARGET
Revenue CAGR
% Revenue Growth from M&A
Operating Margin
Laboratory
$ 460
15-16%
5-10%
10-12%
Dispensing
$ 110
25-30%
5-10%
10-12%
Home Care
& Hospice
$ 100
18-20%
10-12%
8-10% |
 OPERATING MARGIN
EXPANSION 23
* Base is FY12 Pro Forma income statement operating margin. Pro forma financial information
excludes Skilled Nursing and Specialty Dental businesses and represents
management’s best estimate as of the date of this presentation and may differ materially from actual pro forma financial results. |
 EBITDA
ANALYSIS 24
$ in millions
FY13 M&A to Date
* Pro forma financial information excludes Skilled Nursing and Specialty Dental businesses and
represents management’s best estimate as of the date of this presentation and may
differ materially from actual pro forma financial results. |
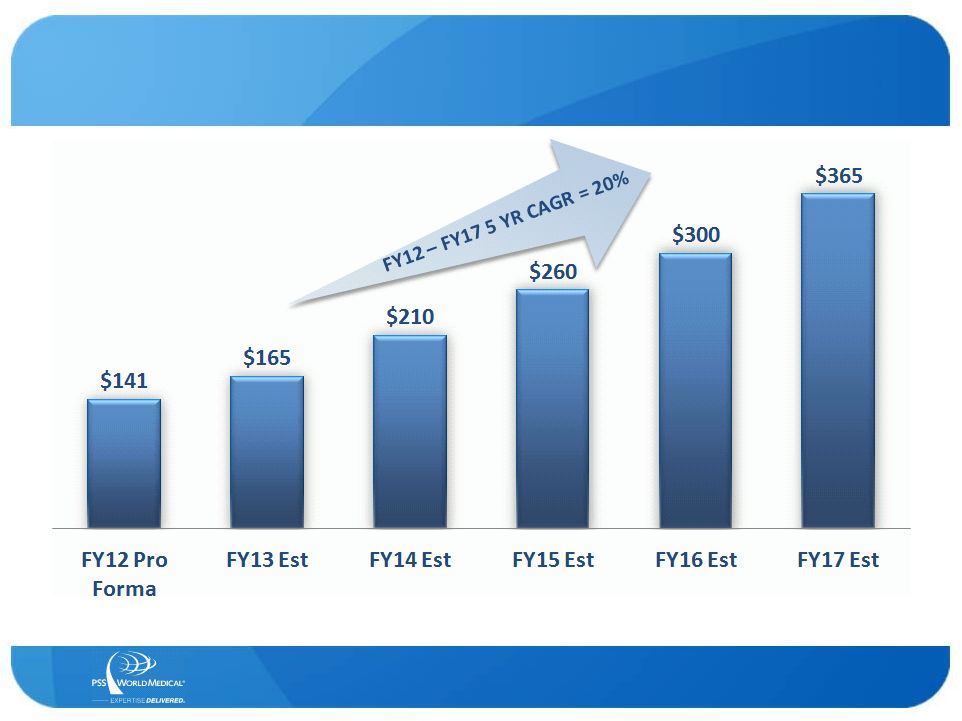 EBITDA
LONG-TERM OUTLOOK 25
* Pro forma financial information excludes Skilled Nursing and Specialty Dental businesses and
represents management’s best estimate as of the date of this presentation and may
differ materially from actual pro forma financial results. |
 FINANCIAL RESOURCES
26
($ in millions)
FY13 Est
FY14 Est
FY15 Est
FY16 Est
FY17 Est
Operating Cash Flow
$ 105
$ 125
$ 150
$ 185
$ 220
Capital Expenditures
(25)
(27)
(30)
(33)
(37)
Free Cash Flow
80
98
120
152
183
Debt
Gross
465
475
250
250
250
Net
120
210
260
215
155
Leverage
Gross
2.8x
2.3x
1.0x
0.8x
0.7x
Net
0.7x
1.0x
1.0x
0.7x
0.4x
•
Includes estimated divestiture proceeds, M&A activity, share repurchases to offset annual
dilution and convertible debt repayment in 2014. This represents management’s best
estimate as of the date of this presentation which may differ materially from actual results. |
 Skilled
Nursing Goldman Sachs
$480 million
$30 million
6 –
9x
6 –
9 months
Strategic or Financial
DIVESTITURE PROCESS
Advisor
Revenues
Adjusted EBITDA*
Expected multiple
Expected timing
Expected buyer
27
Use of Proceeds:
M&A strategy
Share repurchases
Pay down debt
* Information represents management’s best estimate as of the date of this presentation
and may differ materially from actual results. Adjusted EBITDA includes estimated stand
alone business synergies. Specialty Dental
William Blair
$47 million
$7 –
8 million
8 –
10x
3 –
6 months
Strategic or Financial |
 FY13 FINANCIAL
GUIDANCE 28
10-12%
Consolidated
Revenue
Growth From FY12
Pro Forma
$1.11-1.15
EPS From Continuing
Operations
$100-110 mm
Consolidated
Operating
Cash Flow |
 GO TO MARKET
STRATEGIES 29
Eddie Dienes, President, PSS |
 OUR VISION FOR
MOVING FORWARD 30
Common Distribution Infrastructure
World-Class Shared Services Team
Information Technology Platform
1 |
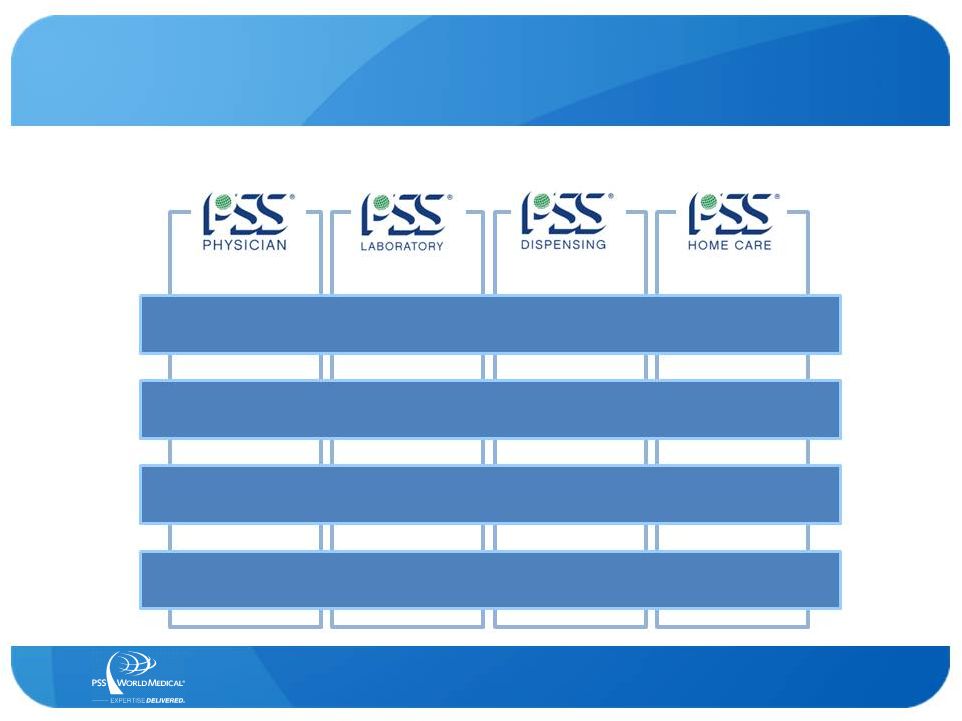
 GO TO MARKET
STRATEGY 31
PSS Generalist Sales Force
PSS Home
Care &
Hospice
Sales Force
PSS Specialist
Health Systems
PSS Specialist
Laboratory
Consultant
PSS Specialist
Dispensing
Solutions
Manufacturer’s
Specialist
Manufacturer’s
Specialist
Manufacturer’s
Specialist |
 2013 SALES FORCE
FOCUS Improve Caregivers
Efficiencies
REACH
OUR HEALTH
STRENGTHEN
SALES FORCE
PRODUCTIVITY
HEALTH SYSTEMS
Online Penetration
Programs
Sales Force Expansion
Workflow
Improvements
Total Customer
Solutions
Online Sales Growth
Increase Caregivers
Revenues
Reduce Caregivers
Expenses
Margin Expansion
Compensation Plan
Our Brands
Strategic Partnerships
Efficiency Programs
Reach
Programs
Business
Conversations
Our Brands
Reach Programs
Defined Rep And
Leader Roles
M & A
Lower the Cost to
Serve
Dramatically
increase and
penetrate the
number of
caregivers we
Significantly
increase sales
representatives
selling time
Dramatically
increase our
share of Health
Systems
Maximize our
profitability through
strategic products,
pricing, a lower cost
to serve and a fully
aligned comp plan
Strengthen the clinical
success & financial
health of our caregivers
by improving their
financial performance
by 20%
serve
32 |
 •
Consultative selling
•
Account penetration
•
Expanding sales force
•
Increased national
account expertise
33
KEYS TO SUCCESS
•
Build a focused leadership team
•
Align compensation programs
•
Continue growth of Our Brands
•
Complete expansion of our
health systems resources
FY13 MILESTONES
PHYSICIAN
33 |
 HEALTH SYSTEMS:
IMPACT OF CONSOLIDATION 34
Ownership
Caregiver
Locations
34 |
 LARGE AND GROWING
CUSTOMER BASE 35
35
PSS Serves a
Broad Range of
Health Systems |
 HEALTH SYSTEM
COMPETITIVE ADVANTAGES •
High Level Service Model of Distribution
–
Ease of ordering & returns; late cut off times
–
Next day delivery by PSS Delivery Professionals
•
Product & Pricing Standardization
–
Product formularies
–
GPO relationships
•
Breadth of Products
–
Our Brands
•
Large, Well Trained Sales Force
–
Generalists & Specialists
36 |
 FOCUSED INVESTMENT
IN HEALTH SYSTEMS 37
FY12
FY13
Strategic Account Executives
6
12
Strategic Account Managers
0
4
GPO Directors
1
3
Health System Analysts
0
2
Dedicated Marketing Managers
0
2
Total
7
23 |
 SUPERIOR LEVEL OF
SERVICE 38
LISA BOYD
Account Representative
Health System with 55,000 employees,
including several thousand physicians;
PSS ships to more than 400 locations in
12 states in the South and Midwest
“The reason I prefer PSS is
simple. It is the level of
service we receive from your
support staff…
With these
individuals in place as well as
many others, I have a
confidence level with PSS that
no other company has been
able to match.” |
 “Baptist
Health System cemented a partnership with PSS to streamline
and standardize the supply
acquisition process in our clinics.
PSS turned out to be the perfect
partner to bring the necessary
resources to help BHS make changes
to be successful.
From electronic
ordering to standardizing product to
utilizing generic products, the
program was solid.”
39
MICHAEL LOUVIERE
Vice President, Supply Chain
Health System with 85 physicians;
PSS ships to more than 45 locations
in Alabama
OUR BRANDS PROVIDE ATTRACTIVE SOLUTION |
 “CFMG chose
PSS as a service provider because of their
quality medical products and
outstanding customer service.
Our physician’s network
benefits tremendously from
the size of their medical
services inventory and
participating manufacturers.”
BREADTH OF INVENTORY
40
LENDA TOWNSEND-WILLIAMS, MBA
Chief Operating Officer
Health System with 500 physicians;
PSS ships to more than 60 locations
in the greater Oakland, CA, area |
 “For the
nurses dealing with the PSS drivers –
in-stock
items, next-day delivery of
orders placed by 8:00 pm, a
reliable delivery fleet and a
promise to understand each
physician customer –
made
the difference.”
EASY TO DO BUSINESS WITH
41
MICHAEL REICH
Director for Lab & Medical Sourcing
Health System with 1,200 physicians;
PSS ships to more than 60 locations
in the New York region |
 “Private
Practice Doctors and PSS share the vision
of preserving high quality
patient care through
private practice
medicine. PPD is thrilled
to be working with PSS.”
FOCUS ON SUPPORTING CAREGIVERS
42
ALEXANDRA BROUSSEAU, PHD
PPD Membership
Management Services Organization
with 180 physicians;
PSS ships to more than 60 locations
in the greater Los Angeles area |
 OUR VISION FOR
MOVING FORWARD 43
Common Distribution Infrastructure
World-Class Shared Services Team
Information Technology Platform
1 |
 44
LABORATORY
•
Laboratory expertise
•
Competency in complex
capital equipment sales
•
Differentiated offering
•
Sourcing and Our Brands
•
Build a focused leadership team
•
Define and realign roles for
sales force
•
Expand product offering
•
Establish key GPO relationships
•
Integrate acquired businesses
KEYS TO SUCCESS
FY13 MILESTONES |
 45
DISPENSING
•
Turnkey installation and
solution management
•
Claims processing
expertise
•
Repackaging and
fulfillment capabilities
•
Leveraging generalist
sales force
•
Build a focused leadership team
•
Integrate acquired businesses
•
Implement branding of offering
•
Train and engage sales reps
•
Expand customer reach
FY13 MILESTONES
KEYS TO SUCCESS |
 46
EASY TO USE SOLUTION |
 •
Dedicated, experienced
sales force
•
Logistics expertise
•
Differentiated service
model
•
Navigation of
reimbursement and
competitive bidding
47
KEYS TO SUCCESS
•
Build a focused leadership team
•
Transition to separate sales
team split from Skilled Nursing
Facilities business
•
Integrate operations and
distribution
•
Realign and brand the offering
FY13 MILESTONES
HOME CARE & HOSPICE |
 SUPERIOR
COMBINATION OF SERVICES 48
BONNIE ALKEMA
Executive Director
Hospice Agency based in Miami, FL
with 4 branches servicing 600+ patients;
Supplies are shipped to more than 700,000
patient’s homes across the country each year
“We are very excited to have
chosen your Company as our
supplier for our Hospice
program. Your combination of
better Service, Online
Technology, Patient Home
Delivery and Cost Savings
versus your competition drove
us to you. We choose our
partners carefully and you are
now one of them.” |
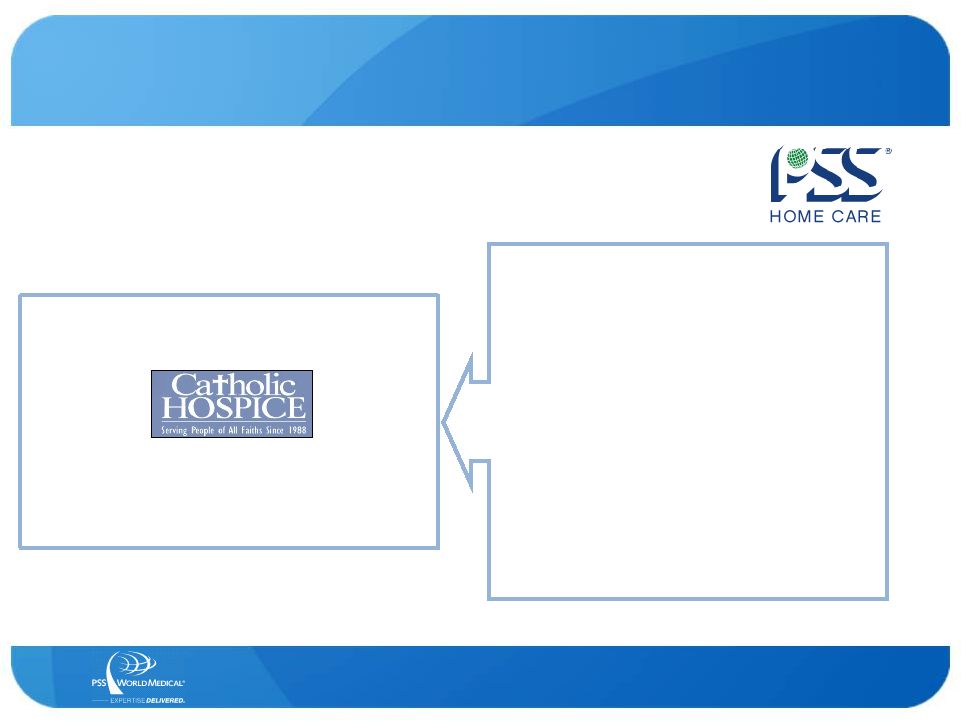
 ROBUST TECHNOLOGY
INTEGRATION 49
BARRY DAVIS
Chief Operation Officer
Home Health and Hospice Agency based
in Jackson, MS with 35 branches
“Sta-Home chose your
Company because of the cost
containment program, sales
rep support and most
importantly, because you were
fully interfaced with our Point-
of-Care software system,
Homecare Homebase. Being
able to interface to our Home
Care software system is critical
for our Operational Efficiency.” |
 OUR VISION FOR
MOVING FORWARD 50
Common Distribution Infrastructure
World-Class Shared Services Team
Information Technology Platform
1 |
 OPERATIONS
OVERVIEW 51
Brad Hilton, Chief Service Officer |
 OUR VISION FOR
MOVING FORWARD 52
Common Distribution Infrastructure
World-Class Shared Services Team
Information Technology Platform
1 |
 53
Customer Solutions
Professional Delivery
Order Fulfillment
ONE COMMON DISTRIBUTION INFRASTRUCTURE |
 ONE WORLD-CLASS
SHARED SERVICES TEAM 54
Customer Service
Supplier Services
Team Member Services
Financial
Legal & Compliance
Information Technology |
 ONE INFORMATION
TECHNOLOGY PLATFORM 55
Customer Experience Systems
Order Processing Systems
IT Infrastructure
Business Information & Reporting Systems |
 OUR VISION FOR
MOVING FORWARD 56
Common Distribution Infrastructure
World-Class Shared Services Team
Information Technology Platform |
 SUMMARY
57
Gary Corless, President & CEO |
 EXPERIENCED TEAM
REDUCES RISK 2003 Strategic Transformation:
•
Divested imaging business
•
Consolidated distribution infrastructure,
rationalizing half of existing locations
•
Implemented standardized ERP system
•
Launched global sourcing effort
58
Then
Now
Revenues
$1.1 bn
$2.1 bn
Margins
2%
6%
ROCC
7%
35%
Fiscal year end stock price
$9.80
$25.34
RESULTS
•
Designed shared service approach
for back office
•
Instituted long-term strategic
planning process
•
Implemented long-term incentive
programs |
 TRANSFORMATION
DRIVEN BY OUR PURPOSE AND MISSION 59
PURPOSE
Strengthen the clinical
success and financial health
of caregivers by solving
their biggest problems.
MISSION
Improve caregivers’
financial performance
by 20%. |
 OUR VISION FOR
MOVING FORWARD 60
Common Distribution Infrastructure
World-Class Shared Services Team
Information Technology Platform
1 |
 PSS WORLD
MEDICAL INVESTOR DAY 2012
May 24, 2012
InterContinental Hotel -
Times Square
New York, NY |
 APPENDIX
62 |
 63
FY11 PRO FORMA
CONTINUING OPERATIONS RECONCILIATION
* Pro forma financial information excludes Skilled Nursing and Specialty Dental businesses and
represents management’s best estimate as of the date of this presentation and may
differ materially from actual pro forma financial results. ($ in millions)
FY11
(As Reported)
Consolidated
Skilled
Nursing
Specialty
Dental
FY11
Pro Forma
Continuing
Operations
Revenue
$ 2,035
$ 506
$ 44
$ 1,485
Gross Profit
636
144
14
478
Gross Margin
31.2%
28.4%
31.0%
32.2%
SG&A
502
116
7
379
Operating Income
134
28
7
99
Operating Margin
6.6%
5.5%
14.4%
6.7%
Interest/Other
15
-
-
15
Pre-tax
119
28
7
84
Taxes
44
11
2
31
Net Income
$ 75
$ 17
$ 5
$ 53
EPS
$ 1.32
$ 0.31
$ 0.07
$ 0.94
EBITDA
$ 168
$ 34
$ 7
$ 127 |
 64
($ in millions)
FY12
FY11
Revenues
$ 531
$ 550
Gross Profit
152
158
Gross Percentage
28.7%
28.6%
SG&A
128
123
Operating Income
24
35
Operating Percentage
4.6%
6.2%
Net Income
15
22
EPS
$ 0.30
$ 0.38
EBITDA
$ 30
$ 41
FY11-12 PRO FORMA SKILLED NURSING & SPECIALTY DENTAL
* Pro forma financial information for Skilled Nursing and Specialty Dental businesses
which represents management’s best estimate as of the date of this
presentation and may differ materially from actual pro forma financial results. |
 FY12 EBITDA
CALCULATION ($ in millions)
FY12
(as reported)
Skilled
Nursing
Specialty
Dental
FY12
Pro Forma
NET INCOME
$ 74
$ 11
$ 4
$ 59
Plus: Interest expense
20
-
-
20
Less: Interest and investment income
-
-
-
-
Plus: Provision for income taxes
41
6
3
32
Plus: Depreciation
27
5
-
22
9
1
-
8
EBITDA
$ 171
$ 23
$ 7
$ 141
65
* Pro forma financial information excludes Skilled Nursing and Specialty Dental businesses and
represents management’s best estimate as of the date of this presentation and may
differ materially from actual pro forma financial results. Plus: Amortization of
intangible assets |
 FY11 EBITDA
CALCULATION ($ in millions)
FY11
(as reported)
Skilled
Nursing
Specialty
Dental
FY11
Pro Forma
NET INCOME
$ 75
$ 17
$ 5
$ 53
Plus: Interest expense
17
-
-
17
Less: Interest and investment income
-
-
-
-
Plus: Provision for income taxes
44
11
2
31
Plus: Depreciation
25
4
-
21
7
2
-
5
EBITDA
66
* Pro forma financial information excludes Skilled Nursing and Specialty Dental businesses and
represents management’s best estimate as of the date of this presentation and may
differ materially from actual pro forma financial results. Plus: Amortization of
intangible assets $ 168
$ 34
$ 7
$ 127 |