Attached files
| file | filename |
|---|---|
| 8-K - 8-K - LRR Energy, L.P. | a12-12701_18k.htm |
Exhibit 99.1
|
|
LRR Energy, L.P. May 24, 2012 NAPTP MLP Investor Conference |
|
|
This presentation contains "forward-looking statements" — that is, statements related to future events. Forward-looking statements are based on the current expectations of LRR Energy, L.P. ("LRR Energy") and include any statement that does not directly relate to a current or historical fact. In this context, forward-looking statements often address expected future business and financial performance, and often contain words such as "may," "predict," "pursue," "expect," "estimate," "project," "plan," "believe," "intend," "achievable," "anticipate," "target," "continue," "potential," "should," "could" and other similar words. Actual results and future events could differ materially from those anticipated or implied in such statements. Forward-looking statements involve certain risks and uncertainties, and ultimately may not prove to be accurate. These risks and uncertainties include, among other things, a decline in oil, natural gas or NGL prices, the risk and uncertainties involved in producing oil and natural gas, competition in the oil and natural gas industry, governmental regulations and other factors. Actual results could differ materially from those anticipated or implied in the forward-looking statements due to the factors described under the captions "Risk Factors" in LRR Energy's Annual Report on Form 10-K for the year ended December 31, 2011 and LRR Energy's subsequent filings with the Securities and Exchange Commission. All forward-looking statements speak only as of the date of this presentation. LRR Energy does not intend to update or revise any forward-looking statements as a result of new information, future events or otherwise. All forward-looking statements are qualified in their entirety by this cautionary statement. Forward Looking Statements LRR Energy, L.P. |
|
|
Lime Rock Management "Lime Rock" Who is Lime Rock? LRR Energy, L.P. Formed in 2005 ~$1.0 billion invested in 12 major acquisitions $497 million of additional acquisition capacity 18.3 MMBoe of proved reserves1 Owns 52% of LRE's LP interests Mature producing oil and natural gas properties 30.6 MMBoe of proved reserves2 Three operating regions $3.0 billion capital under management Consists of six funds Founded in 1998 Manages $3.9 billion of private capital LRR Energy, L.P. "LRE" Lime Rock Resources "LRR" Lime Rock Partners "LRP" Estimated proved reserves as of 12/31/2011 based on SEC pricing, pro forma for recently announced sale of properties to LRE. LRE existing properties based on third party reserve reports as of 12/31/11 using 12/31/11 SEC pricing. Recently announced acquisition based on third party reserve reports as of 3/1/12 using 1/31/12 pricing. |
|
|
LRR Energy, L.P. LRR Energy, L.P. Upstream MLP formed in November 2011 (NYSE: LRE) Operate, acquire, exploit and develop mature oil and gas properties Experienced team with proven acquisition, operational and exploitation track record, and strong industry relationships Growth strategy supported by multiple acquisition avenues Conservative financial strategy – maintenance capital, balance sheet, hedge program, distribution coverage Market Valuation2 30.6 MMBoe proved reserves 86% proved developed April 2012E production: 6,646 Boe/d (42% liquids) Reserve life: 12.6 years Equity market cap: $370 MM Net debt: $213 MM Enterprise value: $583 MM Current yield: 11.5% Key Statistics1 LRE existing properties based on third party reserve reports as of 12/31/11 using 12/31/11 SEC pricing. Recently announced acquisition based on third party reserve reports as of 3/1/12 using 1/31/12 pricing. Market data based on 5/17/12 unit price of $16.46. Enterprise value assumes $6.8 million of cash and $220.1 million of debt as of 3/31/12, pro forma for recently announced acquisition. |
|
|
Recent Acquisition Transaction Summary Acquisition Overview Seller: Lime Rock Resources Operating Areas: Permian Basin and onshore Gulf Coast region Purchase Price: $67.0 million ($87,582/Boe/d, 4.5x trailing cash flow) Immediately accretive to distributable cash flow per unit Financed with 100% debt (existing bank credit facility) Expected closing date on or around June 1, 2012(1) Hedged ~ 85% of expected PDP production through 2016 Note: LRE existing properties based on third party reserve reports as of 12/31/11 using 12/31/11 SEC pricing. Recently announced acquisition based on third party reserve reports as of 3/1/12 using 1/31/12 pricing. Subject to closing conditions. Asset Overview Bolt-on acquisition of concentrated, low-cost, predictable, and primarily operated assets April 2012E production of 765 Boe/d Primarily Oil: 83% of production is oil or natural gas liquids Proved reserves of 1,728 Mboe Mostly Developed: 92% PDP Primarily Operated: 88% of PV10 value 31 gross (20 net) producing wells LRR Energy, L.P. |
|
|
Recent Acquisition Property Summary Total Package April 2012E Production (Boe/d) 765 Proved Reserves (MBoe) 1,728 % Proved Developed Producing 92% % Liquids 83% Total Proved Reserve Life (R/P) 6.2 % Operated By Value 88% Corral Canyon April 2012E Production (Boe/d) 606 Proved Reserves (MBoe) 1,409 % Proved Developed Producing 90% % Liquids 93% Total Proved Reserve Life (R/P) 6.4 % Operated By Value 100% Existing LRE Properties New Years Ridge Non-Op April 2012E Production (Boe/d) 160 Proved Reserves (MBoe) 319 % Proved Developed Producing 100% % Liquids 37% Total Proved Reserve Life (R/P) 5.5 % Operated By Value 0% Corral Canyon New Years Ridge LRR Energy, L.P. Note: Reserves based on third party reserve reports as of 3/1/12 using 1/31/12 pricing. |
|
|
Pro Forma Property Summary LRR Energy, L.P. Note: LRE existing properties based on third party reserve reports as of 12/31/11 using 12/31/11 SEC pricing. Recently announced acquisition based on third party reserve reports as of 3/1/12 using 1/31/12 pricing. Approximately 71% of total estimated proved reserves were proved developed producing and approximately 15% were proved developed non-producing. Permian Mid Continent April 2012E Production (Boe/ d) 3,583 Proved Reserves (MMBoe) 16.8 % Proved Developed 80% % Liquids 63% Total Proved Reserve Life (R/ P) 12.8 Gulf Coast LRE Total April 2012E Production (Boe/ d) 1,025 Proved Reserves (MMBoe) 3.8 % Proved Developed 89% % Liquids 31% Total Proved Reserve Life (R/ P) 10.1 April 2012E Production (Boe/ d) 2,038 Proved Reserves (MMBoe) 10.0 % Proved Developed 94% % Liquids 0% Total Proved Reserve Life (R/ P) 13.5 |
|
|
Quality Assets Low Risk, Mature Assets Focused Portfolio Control Development Low-Cost Operator Developmental Inventory Shallow production decline 86% proved developed reserves 12.6 R/P Focused operations and diversified geographically Three operating areas with scale Operate 93% of proved reserves Nearly all acreage is held by production Control project selection, timing and costs All major fields in primary production 1Q 2012 field level cash costs of $13.27/Boe1 Low-risk, balanced proved inventory 207 gross development projects 215 gross drilling locations LRR Energy, L.P. 1Q 2012 field level cash cost per Boe based on expenses of $6.518 million divided by 491 MBoe (see page 19 of the 3/31/2012 10-Q SEC filing). Expenses include Lease Operating Expenses of $5.032 million, and Production and Ad Valorem Taxes of $1.486 million. |
|
|
Permian Basin Region1 Key fields: Red Lake, Pecos Slope, Corral Canyon Proved reserves: 16.8 MMBoe (55% of total) R/P Ratio: 12.8 years LRE operated: 93% of value 152 gross development projects & 174 gross drilling locations 703 gross (582 net) producing wells Red Lake Field Oil-weighted field located in Eddy County, New Mexico Majority of production from San Andres and Yeso formations at 2,000 to 4,500 feet Current development drilling on 10-acre spacing 2012 development plans Drill 16 wells, complete or recomplete 13 wells Expand SWD system for increased capacity Capex of $17.0MM LRR Energy, L.P. LRE existing properties based on third party reserve reports as of 12/31/11 using 12/31/11 SEC pricing. Recently announced acquisition based on third party reserve reports as of 3/1/12 using 1/31/12 pricing. |
|
|
Mid-Continent & Gulf Coast Regions Mid-Continent Summary Overview1 Key fields: Potato Hills Proved reserves: 10.0 MMBoe (33% of total) Net production: 2,038 Boe/d (31% of total) R/P Ratio: 13.5 years LRE operated: 92% of value 44 gross development projects & 40 gross drilling locations Gulf Coast Summary Overview1 Key fields: New Years Ridge, GW-Stratton Proved reserves: 3.8 MMBoe (12% of total) Net production: 1,025 Boe/d (15% of total) R/P Ratio: 10.1 years LRE operated: 92% of value 11 gross development projects & 1 gross drilling location LRR Energy, L.P. LRE base properties based on third party reserve reports as of 12/31/11 using 12/31/11 SEC pricing. Recent acquisition based on third party reserve reports as of 3/1/12 using 1/31/12 pricing. |

|
|
LRR Energy, L.P. Significant Growth Potential – Acquisition Sources 18.3 MMBoe proved reserves1 $497 million of current acquisition capacity Strategy includes future LRR funds $3.0 billion of capital under management Potential asset acquisitions from portfolio companies Attractive market conditions Producers continue to fund shale growth with conventional asset sales Drop-downs from Lime Rock Resources Joint Bids with Lime Rock Resources Acquisitions from Lime Rock Partners Acquisitions from Third Parties Expands LRE acquisition universe Supports ultimate drop-down strategy 12 major acquisitions since 2006 for ~ $1.0 billion Estimated proved reserves as of 12/31/2011 based on SEC pricing, pro forma for recent sale of properties to LRE. |
|
|
Conservative Financial Strategy Maintain Strong Balance Sheet Active Hedge Program Maintenance Capital Reduces cash flow volatility, and protects distributions, borrowing base and capital program Hedge target of 85% of estimated PDP production for 3-5 years Layer on additional hedges with future acquisitions Strategy includes regional basis and interest rate hedges Target debt/Adjusted EBITDA of <3.0x (pro forma 2.7x) Maintain adequate liquidity Fund acquisitions with prudent leverage Capital required to maintain production over long term Estimated $18 million per year on existing assets Will be updated shortly after acquisition closes LRR Energy, L.P. |
|
|
Hedge Portfolio LRR Energy, L.P. ~84% of current PDP is hedged through 2015 Assuming flat production1, total production is hedged 75% in 2012, 64% in 2013, 51% in 2014 and 46% in 2015 Average prices: $5.69 per MMBtu, $100.78 per oil barrel and $51.71 per NGL barrel Natural Gas Hedges NGL Hedges Crude Oil Hedges Note: Does not include hedges or production associated with recent acquisition. Hedge prices based on weighted-average of swap and collar floor prices. Assumes production through 2015 remains constant at midpoint of 2012 guidance (5,900 Boe/d) and production mix of gas 65%, oil 25% and NGL 10%. ($/Bbl) 2Q - 4Q 2012 2013 2014 2015 Hedged Price $102.43 $101.30 $100.01 $98.90 0 100 200 300 400 500 600 2Q - 4Q 2012 2013 2014 2015 Production (MBbl) Hedged Volumes Production 68% 54% 46% 41% ($/Bbl) 2Q - 4Q 2012 2013 2014 2015 Hedged Price $52.11 $51.31 NA NA 0 50 100 150 200 250 2Q - 4Q 2012 2013 2014 2015 Production (MBbl) Hedged Volumes Production 57% 78% |
|
|
Upstream MLP Yields1 LRE's current yield is attractive compared to peers LRR Energy, L.P. Based on unit prices as of 5/17/2012 and most recently announced quarterly distribution. 11.5% 11.4% 11.0% 10.6% 10.2% 9.6% 8.4% 8.1% 7.9% 5.8% 0.0% 2.0% 4.0% 6.0% 8.0% 10.0% 12.0% 14.0% LRE QRE MEMP BBEP MCEP VNR LGCY LINE PSE EVEP Peer Average: 9.2% |
|
|
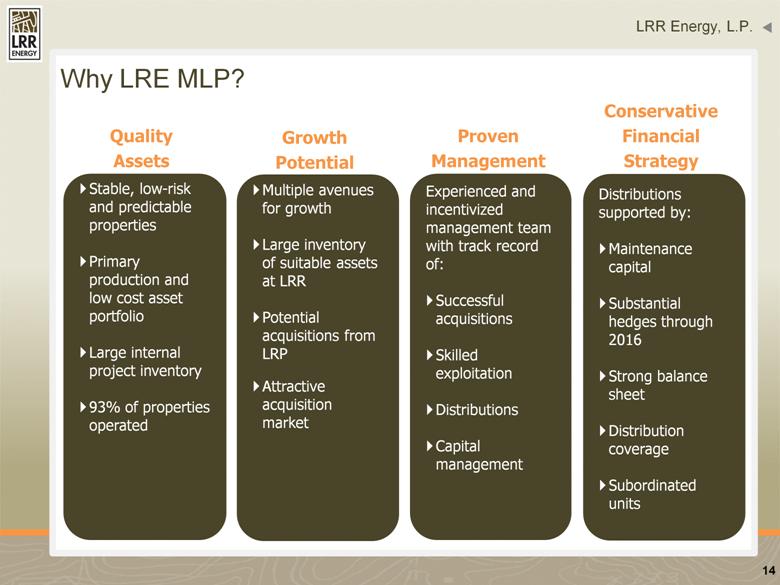
Why LRE MLP? Experienced and incentivized management team with track record of: Successful acquisitions Skilled exploitation Distributions Capital management Proven Management Stable, low-risk and predictable properties Primary production and low cost asset portfolio Large internal project inventory 93% of properties operated Quality Assets Multiple avenues for growth Large inventory of suitable assets at LRR Potential acquisitions from LRP Attractive acquisition market Growth Potential Distributions supported by: Maintenance capital hedges through 2016 Strong balance sheet Distribution coverage Subordinated units Conservative Financial Strategy LRR Energy, L.P. |
|
|
Appendix |

|
|
Management Team & Board of Directors Executive Leadership Non-Management Directors Appendix Jonathan Farber Townes Pressler, Jr. John Bailey Milton Carroll Robert O'Connell Managing Director of Lime Rock Partners Managing Director of Lime Rock Partners Independent Director Independent Director Independent Director Years of Name and Position Experience Select Prior Experience Eric Mullins Co-CEO and Chairman 21 Lime Rock Resources; Goldman Sachs Charles Adcock Co-CEO and Director 35 Lime Rock Resources; Houston Exploration; Operational roles with various E&P companies Chris Butta VP and Chief Engineer 28 Lime Rock Resources; Miller and Lents, Ltd.; ARCO Oil and Gas Company Jaime Casas VP, CFO 15 Laredo Energy; Credit Suisse; Donaldson, Lufkin & Jenrette; Accenture Tim Miller VP and COO 29 Lime Rock Resources; El Paso Corporation; Petroleum Engineer |
|
|
Lime Rock Management LP LRR Energy, L.P. (NYSE: LRE) LRE GP, LLC Incentive Distribution Rights Public Common Units Summary Organization Lime Rock Resources (“LRR”) Fund I Common Units Subordinated Units LRE Operating, LLC 100% Class A Member Interest 0.1% GP Interest 100% Interest 47.5% LP Interest 52.4% LP Interest Appendix |