Attached files
| file | filename |
|---|---|
| 8-K - FORM 8-K - PATTERSON UTI ENERGY INC | d356418d8k.htm |
 Patterson-UTI Energy, Inc.
UBS Global Oil and Gas Conference
UBS Global Oil and Gas Conference
May 23, 2012
May 23, 2012
Exhibit 99.1 |
 2
2
Forward Looking Statements
This material and any oral statements made in connection with this material
This material and any oral statements made in connection with this
material include "forward-looking statements" within the
meaning of the Securities Act of include "forward-looking
statements" within the meaning of the Securities Act of 1933 and the
Securities Exchange Act of 1934. Statements made which provide
1933 and the Securities Exchange Act of 1934. Statements made which
provide the Company’s or management’s intentions, beliefs,
expectations or predictions for the Company’s or management’s
intentions, beliefs, expectations or predictions for the future are
forward-looking statements and are inherently uncertain. The the
future are forward-looking statements and are inherently uncertain. The
opinions, forecasts, projections or other statements other than statements of
opinions, forecasts, projections or other statements other than
statements of historical fact, including, without limitation, plans and
objectives of management of historical fact, including, without
limitation, plans and objectives of management of the Company are
forward-looking statements. It is important to note that actual
the Company are forward-looking statements. It is important to note
that actual results could differ materially from those discussed in such
forward-looking results could differ materially from those discussed
in such forward-looking statements. Important factors that
could cause actual results to differ materially statements.
Important factors that could cause actual results to differ materially
include the risk factors and other cautionary statements contained from time to
include the risk factors and other cautionary statements contained from
time to time in the Company’s SEC filings, which may be obtained by
contacting the time in the Company’s SEC filings, which may be
obtained by contacting the Company
Company
or
or
the
the
SEC.
SEC.
These
These
filings
filings
are
are
also
also
available
available
through
through
the
the
Company’s
Company’s
web
web
site
site
at
at
http://www.patenergy.com
http://www.patenergy.com
or
or
through
through
the
the
SEC’s
SEC’s
Electronic
Electronic
Data
Data
Gathering
Gathering
and
and
Analysis
Analysis
Retrieval
Retrieval
System
System
(EDGAR)
(EDGAR)
at
at
http://www.sec.gov.
http://www.sec.gov.
We
We
undertake
undertake
no
no
obligation to publicly update or revise any forward-looking
statement. Statements obligation to publicly update or revise any
forward-looking statement. Statements made in this
presentation include non-GAAP financial measures. The required
made in this presentation include non-GAAP financial measures. The
required reconciliation to GAAP financial measures are included on our
website and at the reconciliation to GAAP financial measures are
included on our website and at the end of this presentation.
end of this presentation. |
 3
Presentation
•
PTEN Overview
•
The Energy Environment
•
PTEN’s Land Drilling Business
•
PTEN’s Well Stimulation Business
•
PTEN Investment Highlights
•
Conclusions
A Transformation in the Energy Industry…
A Transformation in the Energy Industry…
…A Transformation at PTEN |
 4
Overview of Patterson-UTI Energy, Inc.
•
One of the “Big 3”
US land drillers (drilling
~65% of total 2011 revenues)
•
One of the top pressure pumping companies in
the US (pressure pumping ~33% of total 2011
revenues)
•
Substantial investment in new drilling and
pressure pumping equipment
•
Strong history of creating shareholder equity
•
Trading at a substantial discount to both its
historical valuation and its peers |
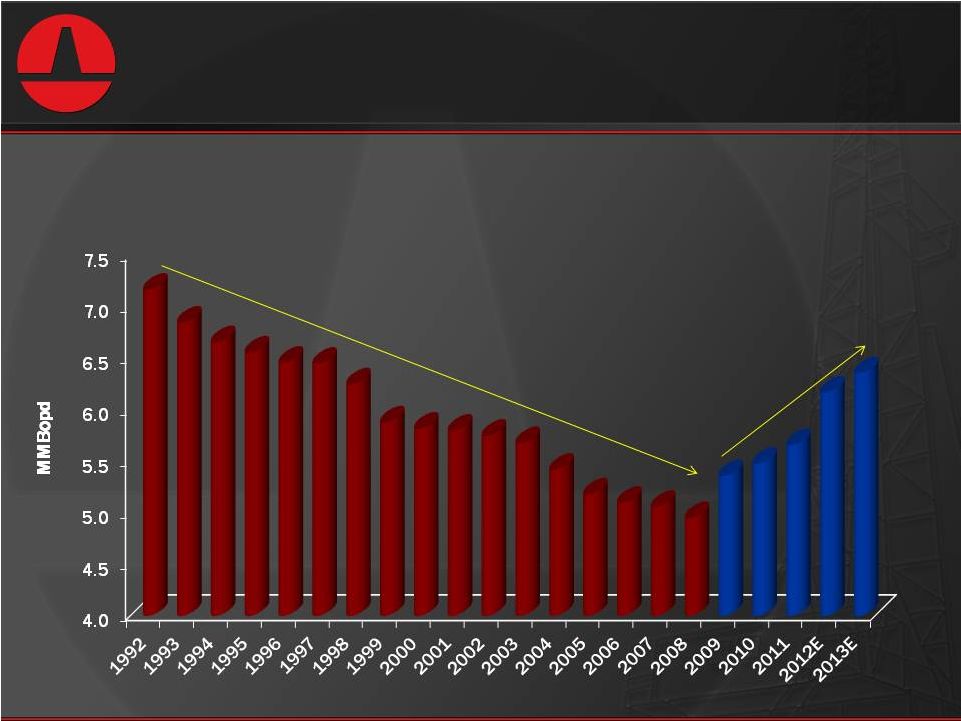 Changing Energy Environment
5
Source: US Energy Information Administration, Short-Term Energy Outlook, May 8,
2012 Decades of Declining US Crude Oil Production…
Reversed in 2009 |
 Changing Energy Environment
6
Source: US Energy Information Administration, Short-Term Energy Outlook, May 8,
2012 Petroleum Imports as a Percent of Total Consumption…
More Demand Being Satisfied With US Production |
 7
Changing Energy Environment –
North America Land-Based Energy
Unconventional drilling and well completion has
evolved:
•
A “manufacturing”
approach to drilling and
well completion
•
Focus on oil & liquids rich plays
•
Unconventional drilling and well completion
techniques being applied to historically
conventional basins |
 Changing Energy Environment –
Land-Based Drilling
PTEN’s
PTEN’s
Drilling
Drilling
Business
Business |
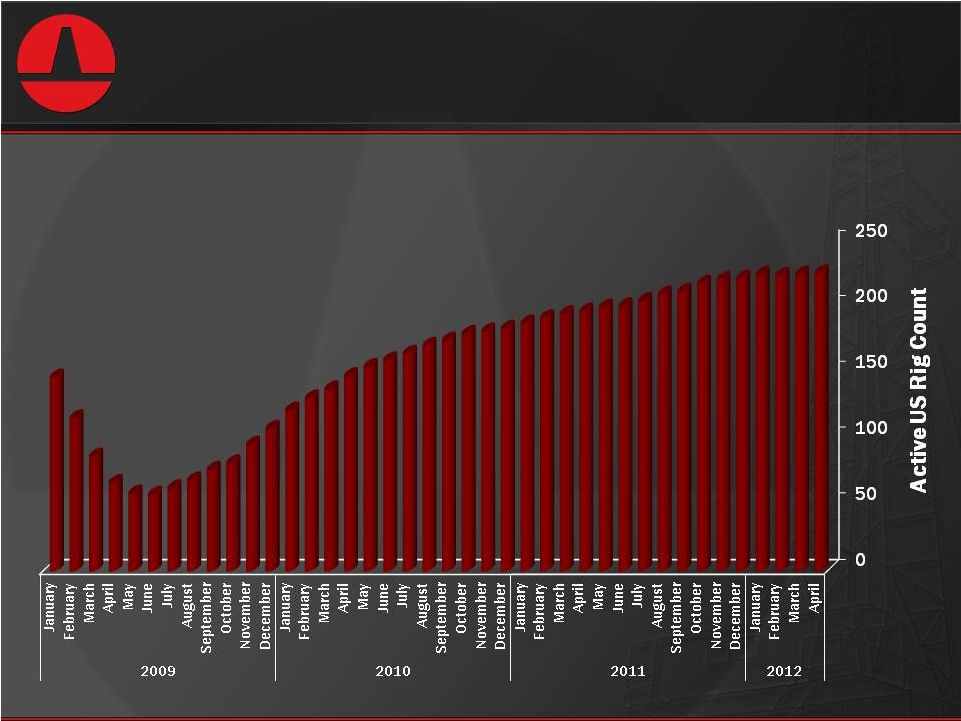 PTEN’s Drilling Business
9
Strong US Rig Count 2010 -
Current |
 10
PTEN’s Drilling Business
•
Increasing focus on oil & liquids rich plays
–
Horizontal drilling techniques developed for shale gas have
been a “game changer”
for oil and liquids rich shales
–
Approximately 68% of PTEN operating rigs are drilling for oil
or liquids
–
“Fit-for-purpose”
rigs are very active in oil & liquids rich
plays, but not all oil & liquids rich plays require
“fit-for- purpose”
rigs (i.e. Permian and Mississippi Lime)
•
Decreasing Dry Gas Exposure
–
Approximately 15 rigs in the US drilling for dry gas under
contracts that are well-to-well or that have an initial term of
less than one year
–
Expect continued rig movement from dry gas to oil and
liquids rich areas |
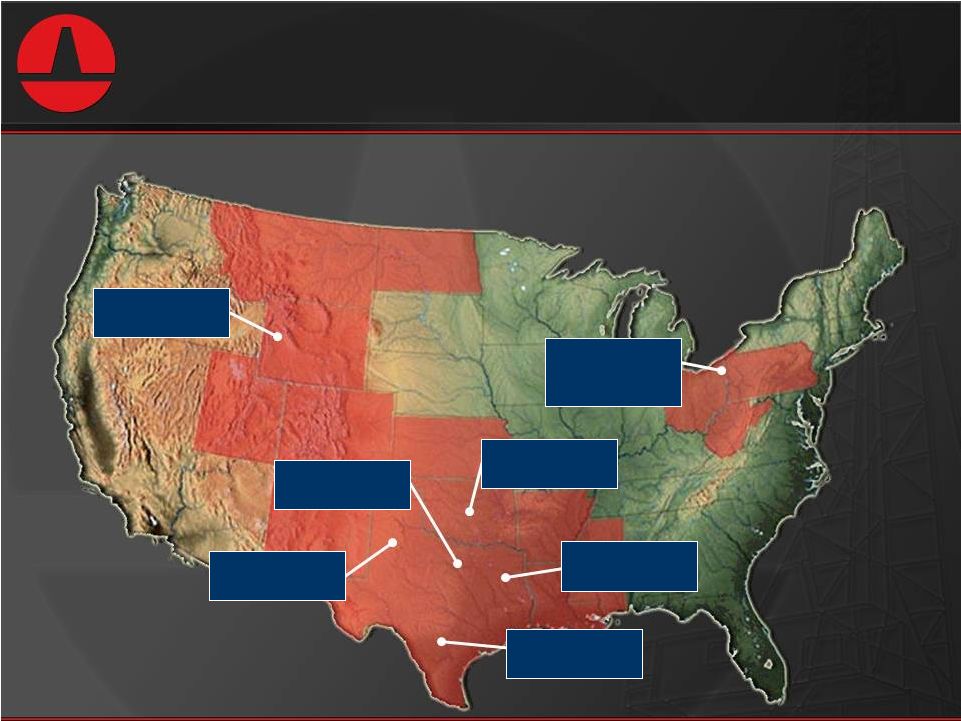 PTEN’s Drilling Business
11
PTEN’s Active U.S. Land Drilling Rigs
as of May 2012
East Texas
Appalachian
Basin
North Texas
Rockies
South Texas
38 Rigs
32 Rigs
25 Rigs
45 Rigs
16 Rigs
15 Rigs
Permian Basin
Mid-Continent
56 Rigs |
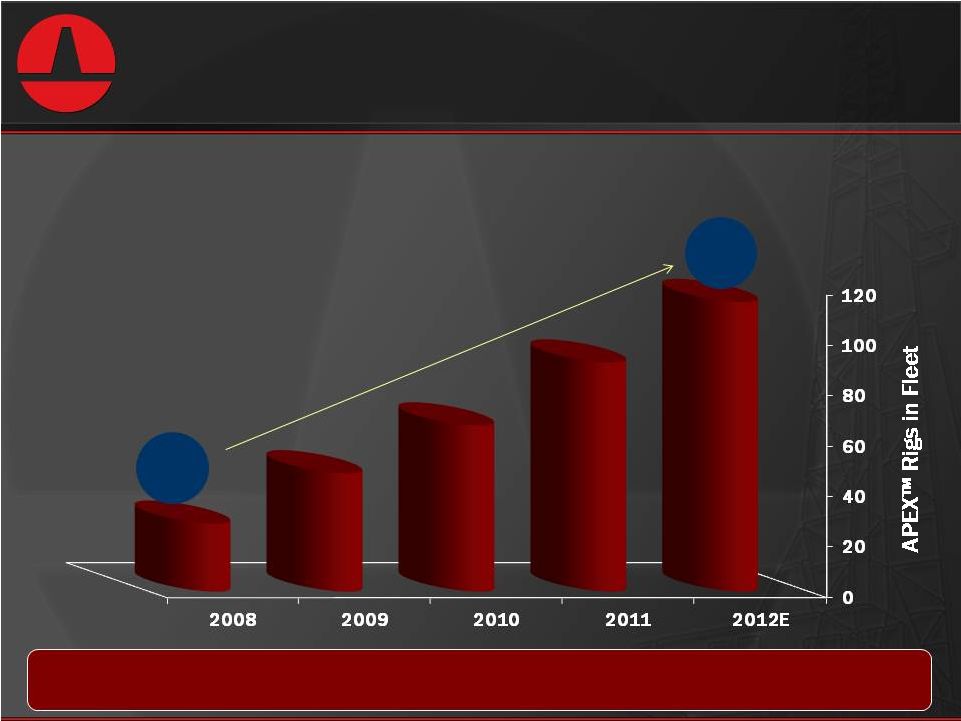 12
New APEX™
Rigs Have Significantly
Increased Fleet Quality.
PTEN’s Drilling Business
24 New Rigs expected to be added in 2012
27
115 |
 13
PTEN’s Drilling Business
PTEN has designed three types of land rigs
for these “new wells”:
•
Each designed to meet customer demands in
different markets
–
Each has specific applications for which it is “most suitable”
•
Significance:
–
Drilling is an integral part of the well “manufacturing”
business
•Fast drilling and “speedy”
rig moves
–
APEX Walking ™
rigs and APEX 1000™
rigs provide access
to certain “challenging well locations”
|
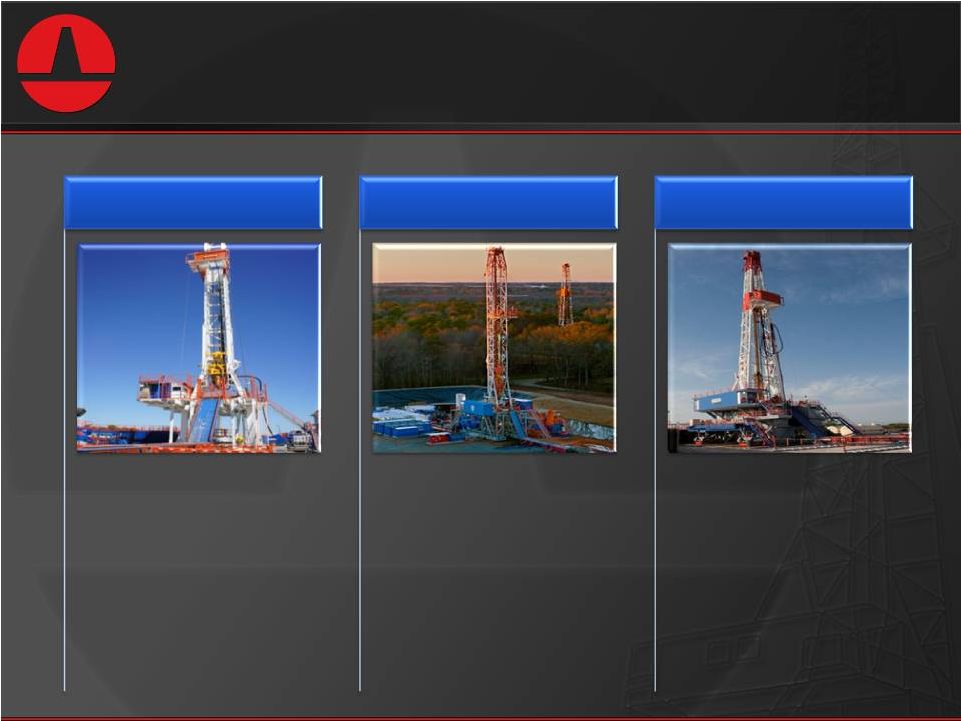 14
PTEN’s Drilling Business
•1000 HP drawworks
•Small footprint, big rig
capability
•Fast move & rig-up
•Walking system is an
optional feature
APEX 1000™
•1500 HP drawworks
•Great all purpose rig
•Fast move & rig-up
•Ideal for Eagle Ford,
Barnett, and Haynesville
APEX 1500™
•1000 to 2000 HP
drawworks
•Able to move in all
directions
•Able to “walk”
with mast
up and drill pipe/collars
in the derrick
•A leadership position in
this “fit-for-purpose”
rig
category
APEX Walking™ |
 …and Expected as of December 31, 2012
APEX 1500
APEX 1000
APEX Walking
Total New Rigs
Other Electric Rigs
Class
15
PTEN’s Drilling Business
Preferred Rigs as of March 31, 2012
54
15
46
115
54
12/31/2012
24 new rigs planned in 2012
~170 by the end of 2012
40
13
43
96
54
3/31/2012
PTEN has approximately 150 of these preferred rigs
TM
TM
TM |
 PTEN’s Drilling Business
Video of Walking Rig Moving
Video of Walking Rig Moving |
 17
PTEN’s Drilling Business
•
PTEN has approximately 180 other rigs in the
fleet of which approximately 90 are active
–
Major upgrade program has provided:
–
PTEN commitment to customers and service
•
PTEN’s large fleet provides substantial
“upside”
if drilling continues to increase
•
Improved mud systems
•
Iron roughnecks and other automation
•
Enhanced mobility
•
Major rig refurbishments |
 18
PTEN’s Drilling Business
•
Term contracts*
–
PTEN expects to average 153 rigs under term
contract in the second quarter of 2012 and 132
during the last three quarters of 2012
–
Approximately 68% of active rigs in the US are
committed under term contracts
–
Provides estimated future dayrate drilling revenue
stream of approximately $1.7 billion for 2012 and
beyond
* Term contracts are defined as having an initial duration of at
least six months. |
 Changing Energy Environment –
Well Stimulation
PTEN’s
PTEN’s
Pressure
Pressure
Pumping
Pumping
Business
Business |
 20
PTEN’s Pressure Pumping Business
•
Continuing Significance of Well Stimulation
–
Shale and other unconventional plays changed the
business
•Substantial
increases
in
horizontal
completions
•Increasing
number
of
stages
per
well
•Substantially
higher
HP
requirements
•Higher
pressures
and
higher
volumes
–
Changing equipment (“quints”) and crew
competencies
–
Key
to
unlocking
long
laterals and greatly increased
shale production |
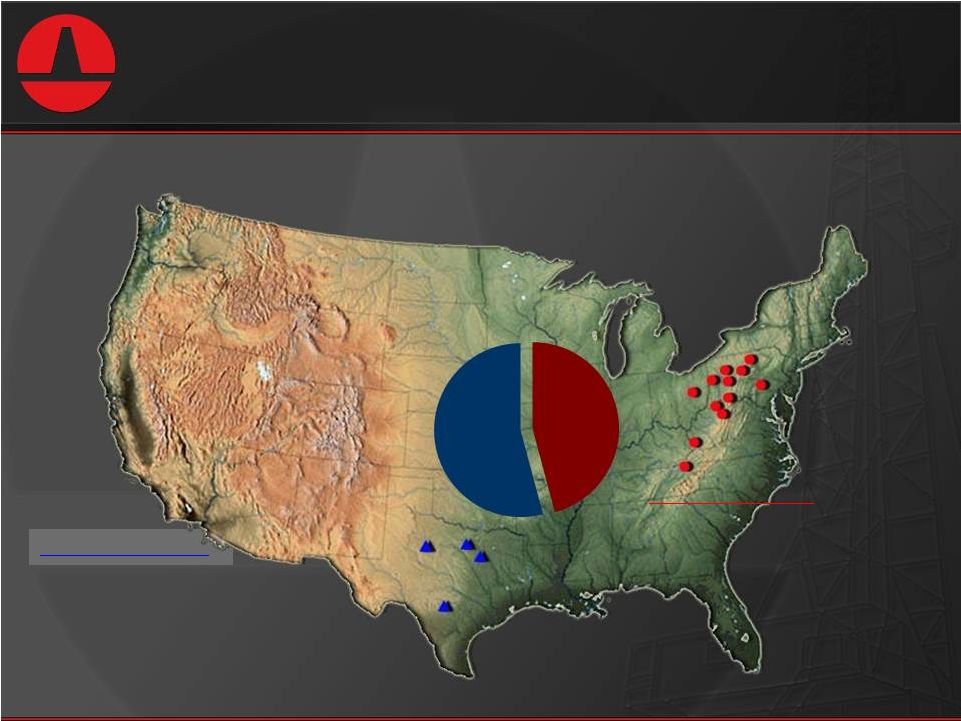 21
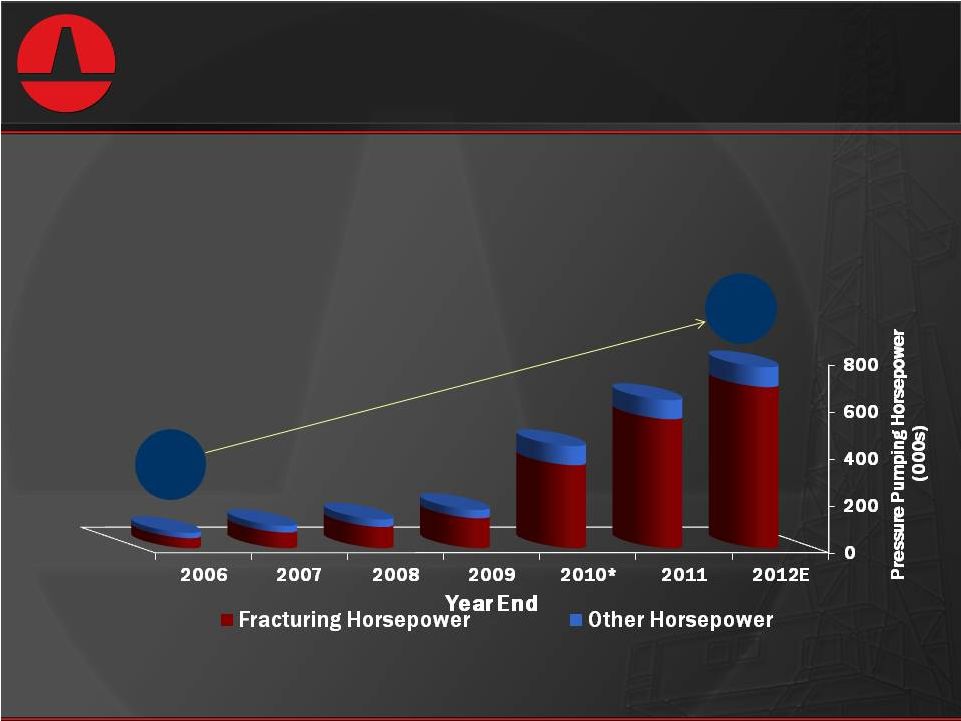
PTEN’s Pressure Pumping Business
Fracturing horsepower: 313,500
Other horsepower: 20,270
Frac Crews under contract : 3
Fracturing horsepower: 265,500
Other horsepower: 61,300
Frac Crews under contract: 2
A Significant Player in Growing Markets
Approximately 155,000 HP under term contract
46%
54%
Fracturing Horsepower
Southwest Region:
Northeast Region: |
 22
Recent Investments in Pressure Pumping…
…Have Increased Fleet
Size and Quality PTEN’s Pressure Pumping Business
* Includes acquisition of pressure pumping assets from Key Energy
65
770 |
 23
Strong Growth in Pressure Pumping
PTEN’s Pressure Pumping Business |
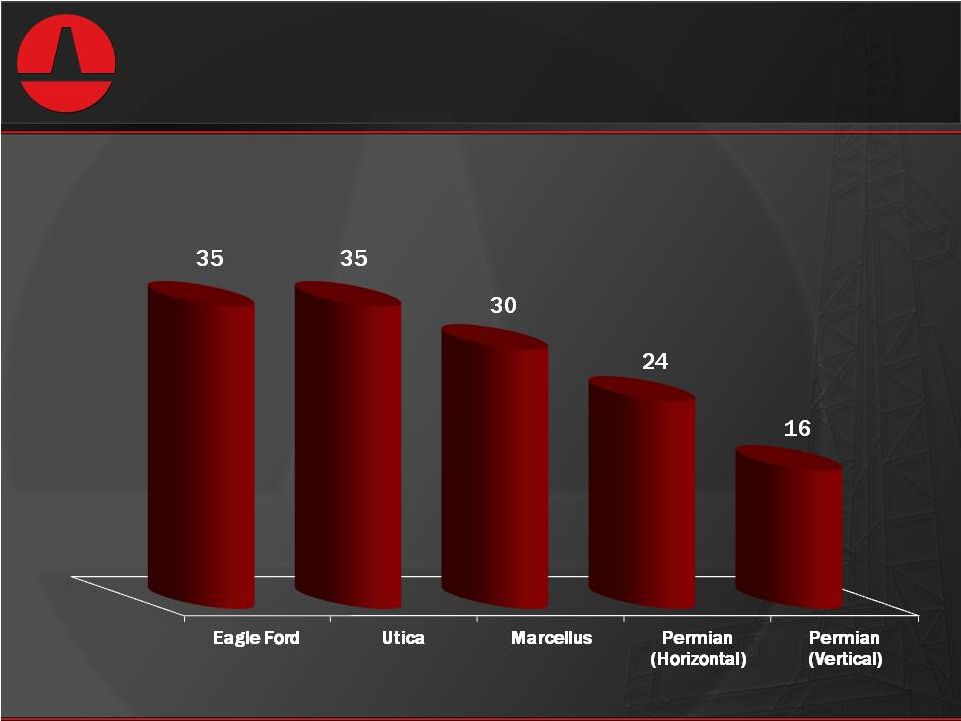 24
Service Intensity By Region
Average Horsepower Per Well (000s HP)*
PTEN’s Pressure Pumping Business
*Source: Simmons & Company Equity Research |
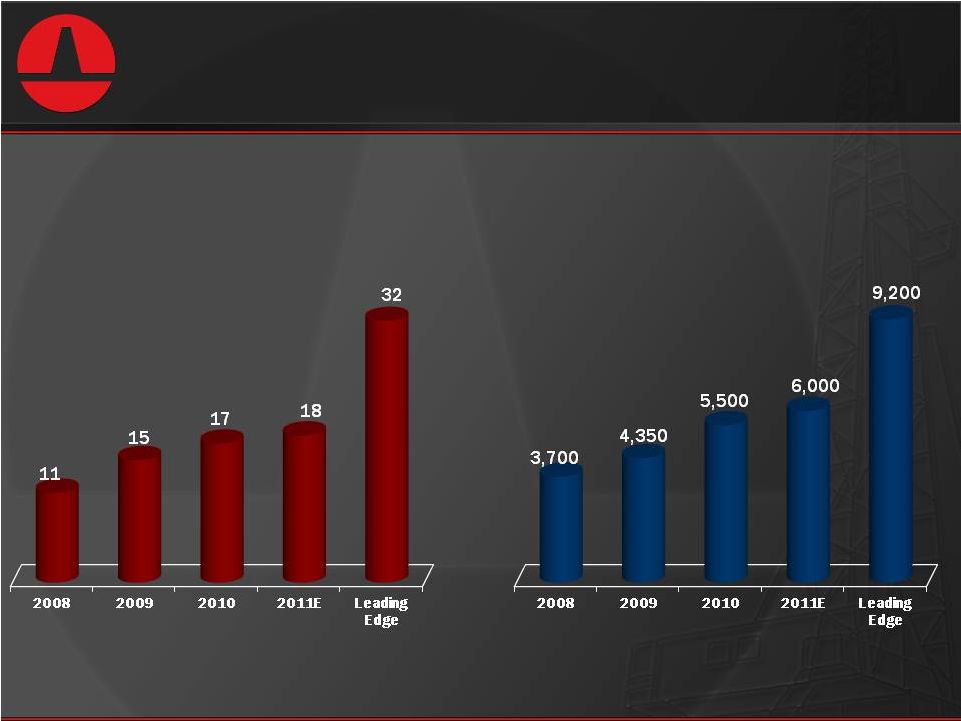 25
Increasing Service Intensity
Eagle Ford Shale
PTEN’s Pressure Pumping Business
*Source: Simmons & Company Equity Research
Lateral Length*
Frac Stages* |
 26
Increasing Service Intensity
Marcellus Shale
PTEN’s Pressure Pumping Business
*Source: Simmons & Company Equity Research |
 PTEN’s Pressure Pumping Business
27
More than two-thirds of fracturing
horsepower is less than five years old
PTEN Pressure Pumping Fleet by Age
as of December 2011
>10
Years
14%
5 -
10
Years
19%
< 5
Years
67% |
 PTEN Investment
Highlights |
 29
PTEN Investment Highlights -
Strategic Approach
•
Concentrate on two core businesses
•
Plan to continue to grow organically
–
PTEN has the balance sheet and expected cash
flow to support continued organic growth in both
businesses
–
Acquisitions
and
dispositions
only
when
the
price
is
right |
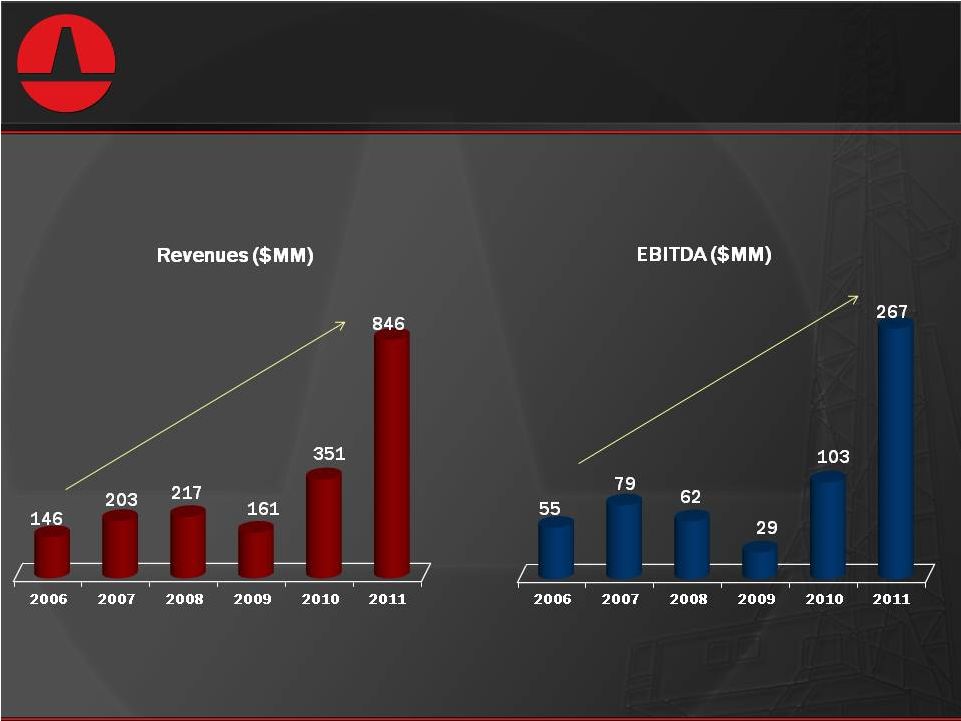
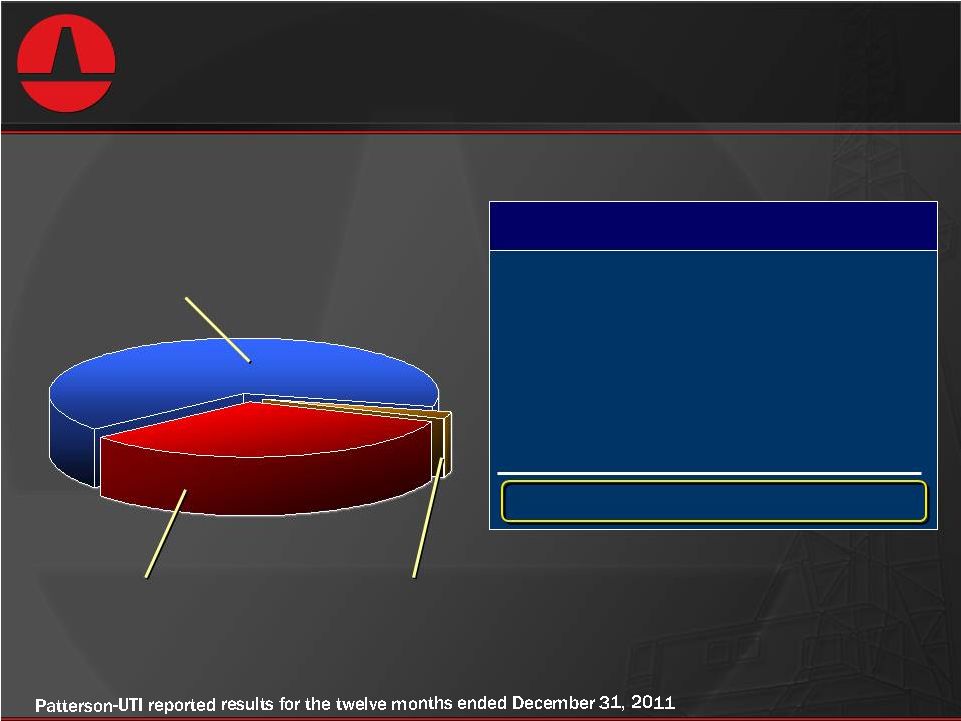 30
PTEN Investment Highlights
Components of
Total Revenue
EBITDA
EBITDA
Contract Drilling
65%
Pressure
Pumping
33%
Oil & Natural
Gas 2%
Segment ($ in 000’s)
Contract Drilling
$690,395
Pressure Pumping
266,719
Oil & Natural Gas
40,944
Corporate & Other
(34,596)
Discontinued Operations
(576)
Total
$962,886 |
 31
PTEN Investment Highlights
•
No equity sales in more than 11 years
•
History of returning capital to investors
–
Stock Buyback
•
Total of $592 million in 2006 through 2008
–
Cash Dividend
•
Initiated cash dividend in 2004
•
Quarterly dividend currently $0.05 per share |
 32
PTEN Investment Highlights
•
Leading market position
–
One of the “Big 3”
US land drillers
–
One of the largest pressure pumping companies in the US
–
Well positioned to grow organically and through
opportunistic acquisition
•
Diverse asset base
–
Drilling rigs well-matched to customers’
needs
–
Well stimulation assets that meet customers’
needs
•
Favorable industry trends
–
Emerging shale and unconventional resource plays
–
US land drilling and pressure pumping are major
beneficiaries of these trends |
 33
PTEN Investment Highlights
•
Flexible operating model
–
Maximizes earnings growth during periods of increased
activity
–
Minimizes costs during periods of low activity
–
Strong cash flow generation
•
Strong management team
–
Prudent financial management
–
Operational management that is customer responsive
–
Proven track record through numerous cycles
•
Strong financial position
–
Low leverage
–
Adequate liquidity to meet medium-term growth and capex
needs |
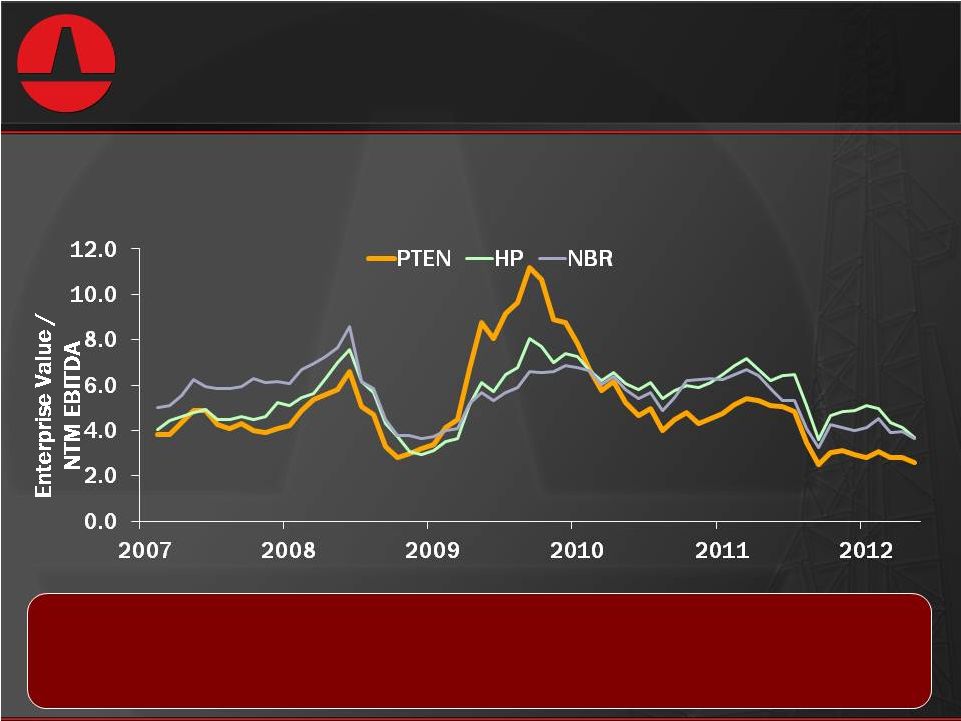 PTEN Investment Highlights
34
25 –
25 –
40% discount to both peers
40% discount to both peers
and historical trading multiples
and historical trading multiples
Low valuation relative to both peers
and historical trading multiples
Source: Thomson One Financial |
 PTEN Investment Highlights
0
500
1,000
1,500
2,000
2,500
3,000
Thousands
1999
2000
2001
2002
2003
2004
2005
2006
2007
2008
2009
2010
2011
0
500
1,000
1,500
2,000
2,500
3,000
Thousands
1999
2000
2001
2002
2003
2004
2005
2006
2007
2008
2009
2010
2011
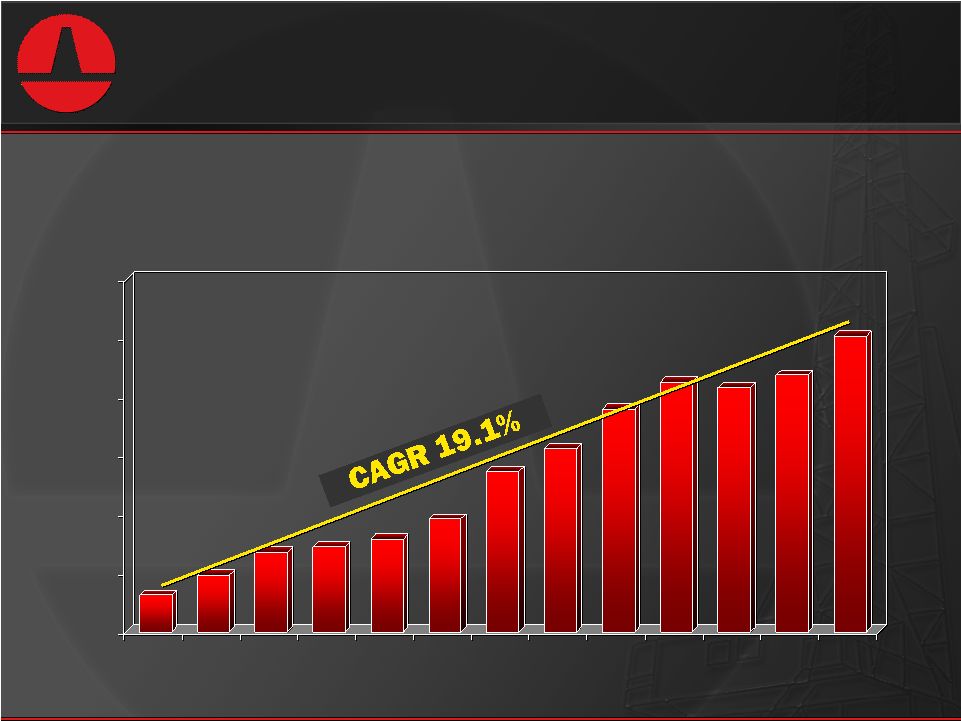
Growth in Shareholder Equity
The Warren Buffett Standard
35 |
 36
•
Favorable trends are likely to persist in North
American oil and natural gas markets
•
US Land Drilling and Pressure Pumping are major
beneficiaries of the new trends
•
Patterson-UTI has the right assets:
–
Drilling rigs well-matched to the customers’
needs
–
Well stimulation assets that meet customers’
needs
–
Operational management that is customer responsive
–
Prudent financial management
•
Long-term record of building shareholder equity
Conclusions |
 Patterson-UTI Energy, Inc.
UBS Global Oil and Gas Conference
UBS Global Oil and Gas Conference
May 23, 2012
May 23, 2012 |
 Non-GAAP Financial Measures
38
Patterson-UTI Energy, Inc.
EBITDA Reconciliation
(dollars in thousands)
2011
2010
2009
2008
2007
2006
Earnings Before Interest, Taxes, Depreciation and Amortization (EBITDA):
Net income (loss)
$ 322,413
$ 116,942
$ (38,290)
$ 347,069
$ 438,639
$ 673,254
Income tax expense (benefit)
187,938
72,856
(17,595)
193,490
229,350
360,639
Net interest expense (income)
15,465
11,098
3,767
(923)
(164)
(4,310)
Depreciation, depletion, amortization and impairment
437,279
333,493
289,847
275,990
246,346
193,664
Cumulative effect of change in accounting principle
-
-
-
-
-
(687)
Results of discontinued operations:
Income tax expense (benefit)
(209)
(543)
(2,208)
2,389
2,818
10,628
Net interest expense (income)
-
-
-
7
(4)
(13)
Depreciation
-
166
2,287
2,830
2,860
2,706
Impairment of assets held for sale
-
2,155
1,900
-
-
-
Impairment of goodwill
-
-
-
9,964
-
-
EBITDA
$ 962,886
$ 536,167
$ 239,708
$ 830,816
$ 919,845
$ 1,235,881
Total Revenue
$ 2,565,943
$ 1,462,931
$ 781,946
$ 2,063,880
$ 1,986,096
$ 2,354,228
EBITDA Margin (EBITDA/Total Revenue)
37.53%
36.65%
30.66%
40.26%
46.31%
52.50% |