Attached files
| file | filename |
|---|---|
| 8-K - CURRENT REPORT OF MATERIAL EVENTS OR CORPORATE CHANGES - NuStar GP Holdings, LLC | a12-12715_18k.htm |
Exhibit 99.1
|
|
2012 Master Limited Partnership Investor Conference Curt Anastasio, President and CEO – May 24, 2012 2012 |

|
|
Statements contained in this presentation that state management’s expectations or predictions of the future are forward-looking statements as defined by federal securities law. The words “believe,” “expect,” “should,” “targeting,” “estimates,” and other similar expressions identify forward-looking statements. It is important to note that actual results could differ materially from those projected in such forward-looking statements. We undertake no duty to update any forward-looking statement to conform the statement to actual results or changes in the company’s expectations. For more information concerning factors that could cause actual results to differ from those expressed or forecasted, see NuStar Energy L.P.’s and NuStar GP Holdings, LLC’s respective annual reports on Form 10-K and quarterly reports on Form 10-Q, filed with the Securities and Exchange Commission and available on NuStar’s websites at www.nustarenergy.com and www.nustargpholdings.com. Forward Looking Statements 2 |
|
|
NuStar Overview 3 |

|
|
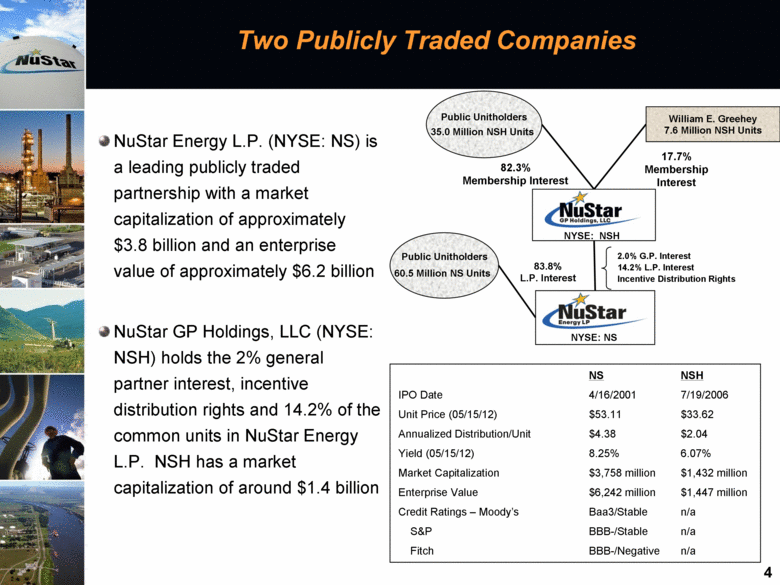
NuStar Energy L.P. (NYSE: NS) is a leading publicly traded partnership with a market capitalization of approximately $3.8 billion and an enterprise value of approximately $6.2 billion NuStar GP Holdings, LLC (NYSE: NSH) holds the 2% general partner interest, incentive distribution rights and 14.2% of the common units in NuStar Energy L.P. NSH has a market capitalization of around $1.4 billion Two Publicly Traded Companies NS NSH IPO Date 4/16/2001 7/19/2006 Unit Price (05/15/12) $53.11 $33.62 Annualized Distribution/Unit $4.38 $2.04 Yield (05/15/12) 8.25% 6.07% Market Capitalization $3,758 million $1,432 million Enterprise Value $6,242 million $1,447 million Credit Ratings – Moody’s Baa3/Stable n/a S&P BBB-/Stable n/a Fitch BBB-/Negative n/a 82.3% Membership Interest 83.8% L.P. Interest Public Unitholders 35.0 Million NSH Units Public Unitholders 60.5 Million NS Units 17.7% Membership Interest 2.0% G.P. Interest 14.2% L.P. Interest Incentive Distribution Rights William E. Greehey 7.6 Million NSH Units NYSE: NSH NYSE: NS 4 |
|
|
Large and Diverse Geographic Footprint with Assets in Key Locations Asset Stats: Operations in the U.S., Canada, Mexico, the Netherlands, including St. Eustatius in the Caribbean, the United Kingdom and Turkey. Own 84 terminal and storage facilities Approximately 96 million barrels of storage capacity 8,420 miles of crude oil and refined product pipelines 2 asphalt refineries and a fuels refinery capable of processing 118,500 bpd of crude oil 5 |

|
|
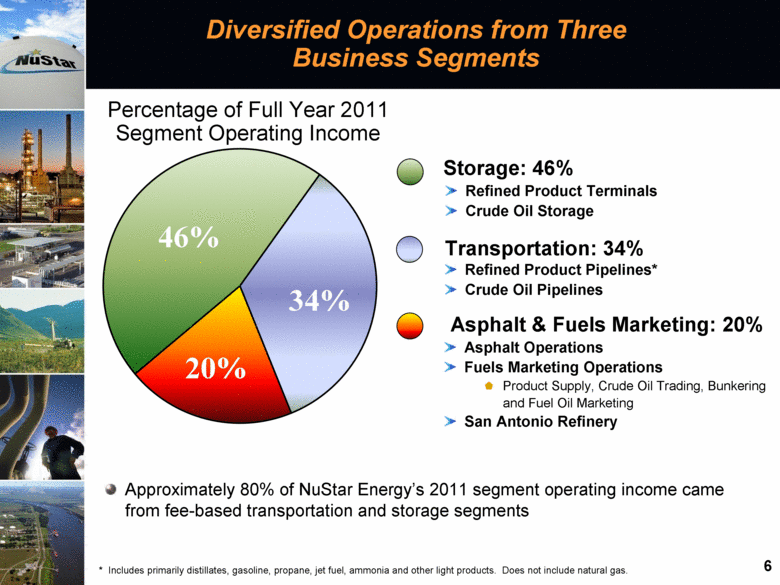
Percentage of Full Year 2011 Segment Operating Income Approximately 80% of NuStar Energy’s 2011 segment operating income came from fee-based transportation and storage segments Storage: 46% Transportation: 34% Refined Product Terminals Crude Oil Storage Refined Product Pipelines* Crude Oil Pipelines Asphalt & Fuels Marketing: 20% Asphalt Operations Fuels Marketing Operations Product Supply, Crude Oil Trading, Bunkering and Fuel Oil Marketing San Antonio Refinery Diversified Operations from Three Business Segments * Includes primarily distillates, gasoline, propane, jet fuel, ammonia and other light products. Does not include natural gas. 6 46% 34% 20% |
|
|
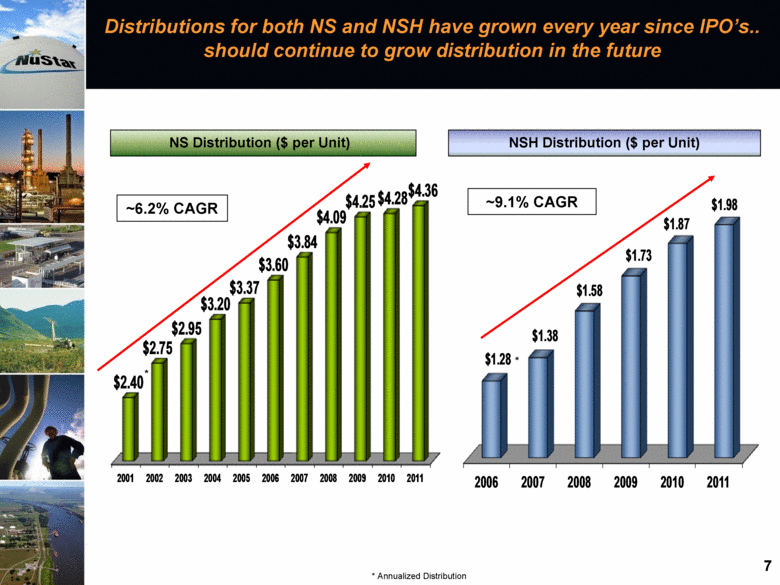
Distributions for both NS and NSH have grown every year since IPO’s.. should continue to grow distribution in the future NS Distribution ($ per Unit) NSH Distribution ($ per Unit) ~6.2% CAGR ~9.1% CAGR * Annualized Distribution * * 7 2001 2002 2003 2004 2005 2006 2007 2008 2009 2010 2011 $2.40 $2.75 $2.95 $3.20 $3.37 $3.60 $3.84 $4.09 $4.25 $4.28 $4.36 2006 2007 2008 2009 2010 2011 $1.28 $1.38 $1.58 $1.73 $1.87 $1.98 |
|
|
Storage Segment Overview 8 |
|
|
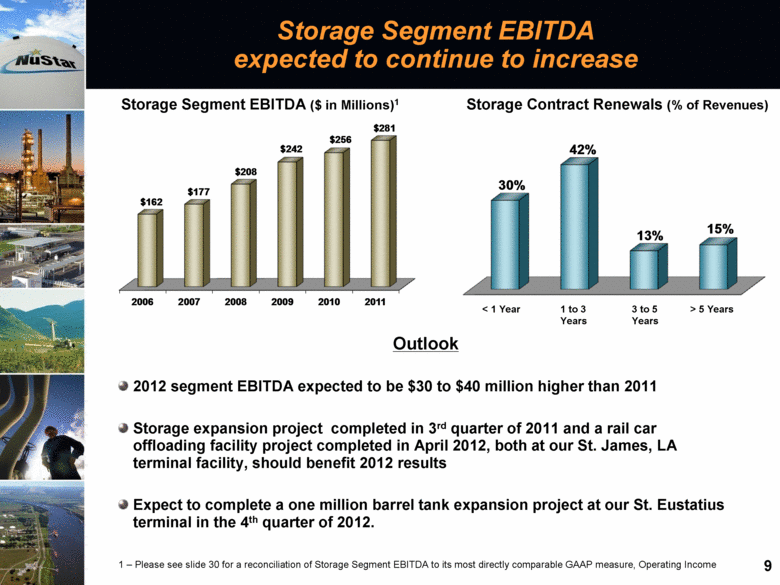
Outlook 2012 segment EBITDA expected to be $30 to $40 million higher than 2011 Storage expansion project completed in 3rd quarter of 2011 and a rail car offloading facility project completed in April 2012, both at our St. James, LA terminal facility, should benefit 2012 results Expect to complete a one million barrel tank expansion project at our St. Eustatius terminal in the 4th quarter of 2012. 1 – Please see slide 30 for a reconciliation of Storage Segment EBITDA to its most directly comparable GAAP measure, Operating Income Storage Segment EBITDA ($ in Millions)1 Storage Contract Renewals (% of Revenues) Storage Segment EBITDA expected to continue to increase 9 < 1 Year 1 to 3 Years 3 to 5 Years > 5 Years 2006 2007 2008 2009 2010 2011 $162 $177 $208 $242 $256 $281 30% 42% 13% 15% |
|
|
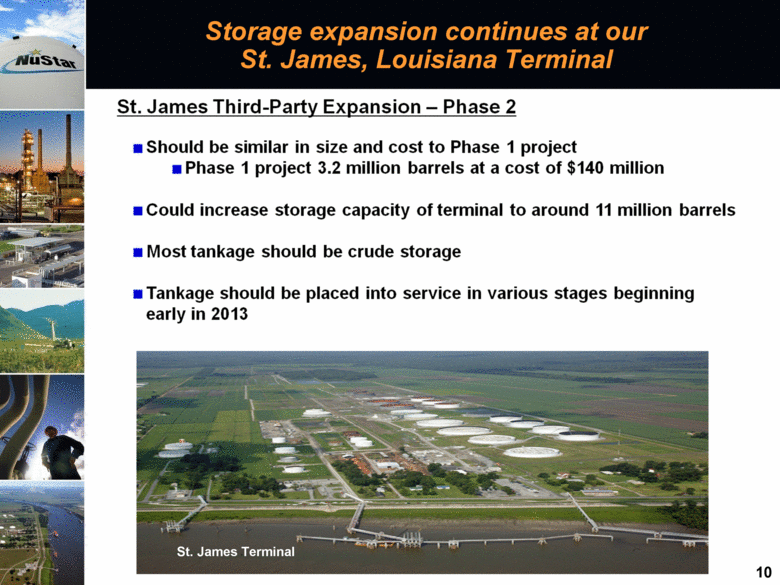
Storage expansion continues at our St. James, Louisiana Terminal St. James Terminal 10 St. James Third-Party Expansion – Phase 2 Should be similar in size and cost to Phase 1 project Phase 1 project 3.2 million barrels at a cost of $140 million Could increase storage capacity of terminal to around 11 million barrels Most tankage should be crude storage Tankage should be placed into service in various stages beginning early in 201. |
|
|
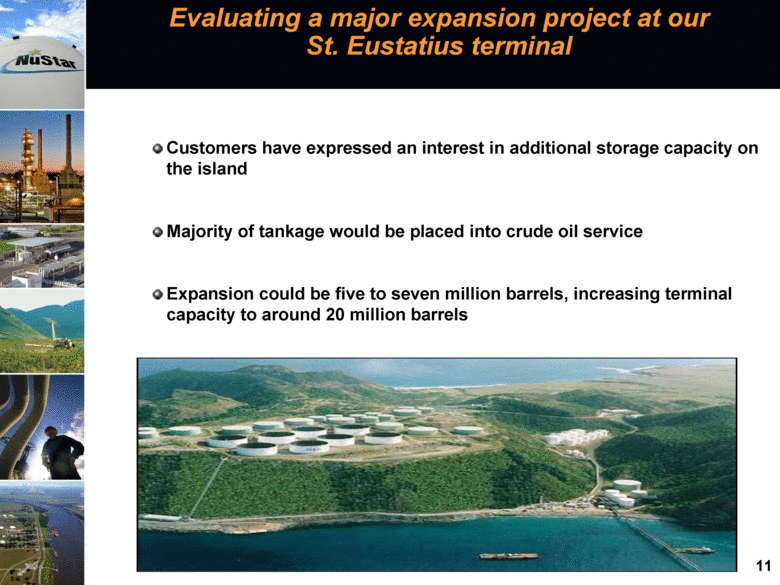
Evaluating a major expansion project at our St. Eustatius terminal Customers have expressed an interest in additional storage capacity on the island Majority of tankage would be placed into crude oil service Expansion could be five to seven million barrels, increasing terminal capacity to around 20 million barrels 11 |
|
|
Transportation Segment Overview 12 |

|
|
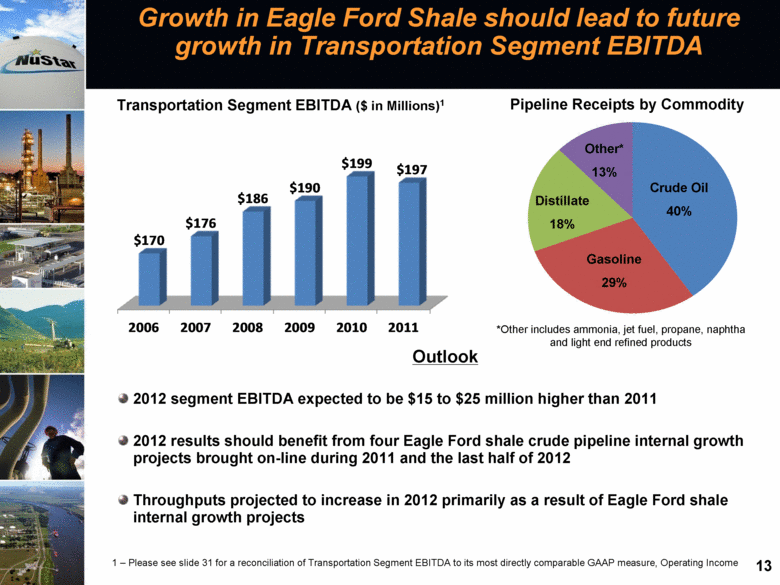
Transportation Segment EBITDA ($ in Millions)1 Pipeline Receipts by Commodity Growth in Eagle Ford Shale should lead to future growth in Transportation Segment EBITDA Gasoline 29% Other* 13% *Other includes ammonia, jet fuel, propane, naphtha and light end refined products Crude Oil 40% Distillate 18% Outlook 2012 segment EBITDA expected to be $15 to $25 million higher than 2011 2012 results should benefit from four Eagle Ford shale crude pipeline internal growth projects brought on-line during 2011 and the last half of 2012 Throughputs projected to increase in 2012 primarily as a result of Eagle Ford shale internal growth projects 13 1 – Please see slide 31 for a reconciliation of Transportation Segment EBITDA to its most directly comparable GAAP measure, Operating Income 2006 2007 2008 2009 2010 2011 $170 $176 $186 $190 $199 $197 |
|
|
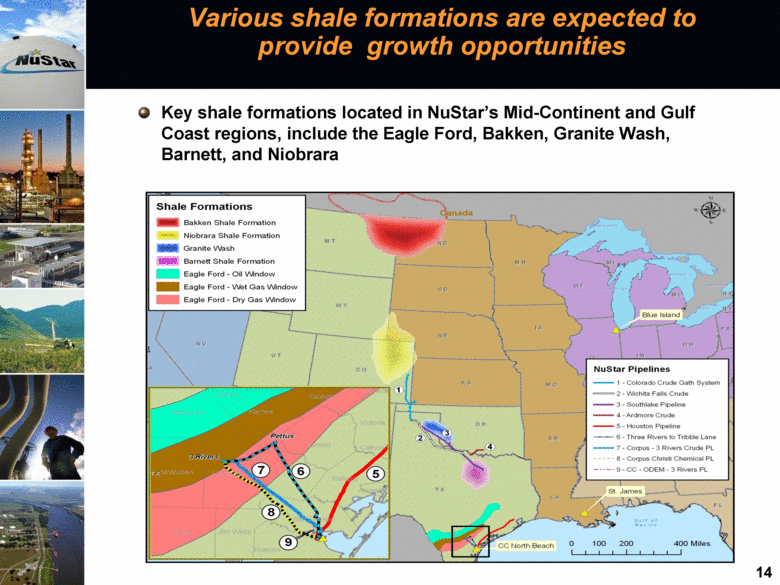
Various shale formations are expected to provide growth opportunities Key shale formations located in NuStar’s Mid-Continent and Gulf Coast regions, include the Eagle Ford, Bakken, Granite Wash, Barnett, and Niobrara There are key shale developments located in NuStar’s Mid-Continent and Gulf Coast regions, including the Eagle Ford, Bakken, Granite Wash, Barnett, and Niobrara 14 |
|
|
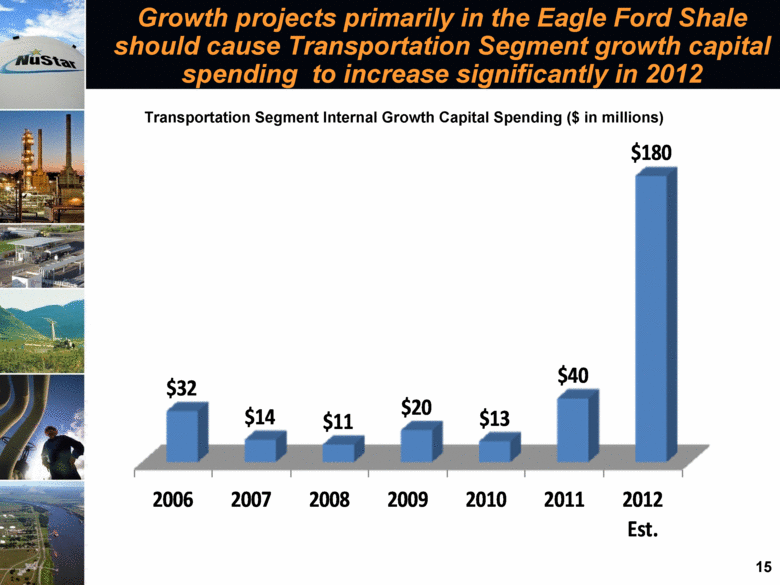
Growth projects primarily in the Eagle Ford Shale should cause Transportation Segment growth capital spending to increase significantly in 2012 15 Transportation Segment Internal Growth Capital Spending ($ in millions) 2006 2007 2008 2009 2010 2011 2012 Est. $32 $14 $11 $20 $13 $40 $180 |
|
|
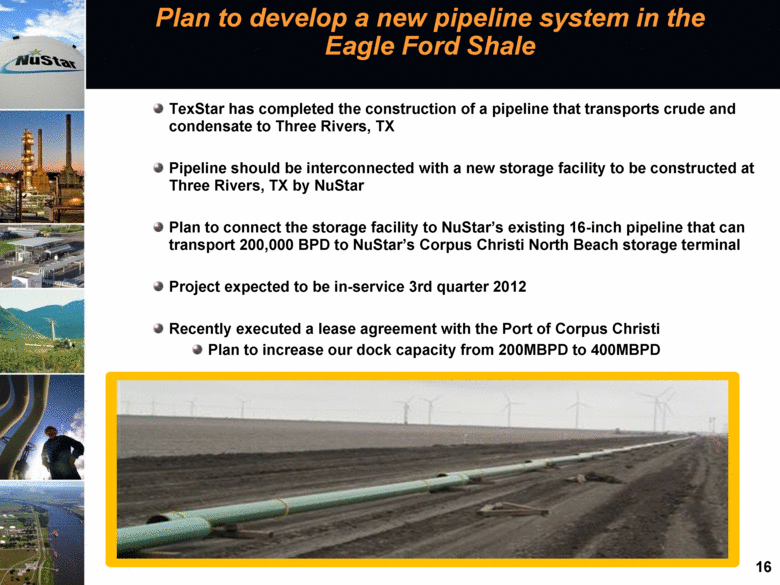
Plan to develop a new pipeline system in the Eagle Ford Shale TexStar has completed the construction of a pipeline that transports crude and condensate to Three Rivers, TX Pipeline should be interconnected with a new storage facility to be constructed at Three Rivers, TX by NuStar Plan to connect the storage facility to NuStar’s existing 16-inch pipeline that can transport 200,000 BPD to NuStar’s Corpus Christi North Beach storage terminal Project expected to be in-service 3rd quarter 2012 Recently executed a lease agreement with the Port of Corpus Christi Plan to increase our dock capacity from 200MBPD to 400MBPD 16 |
|
|
Plan to develop a new pipeline system in the Eagle Ford Shale TexStar Pipeline Existing NuStar Pipeline New NuStar Storage Facility NORTH BEACH OAKVILLE 16” line 17 |

|
|
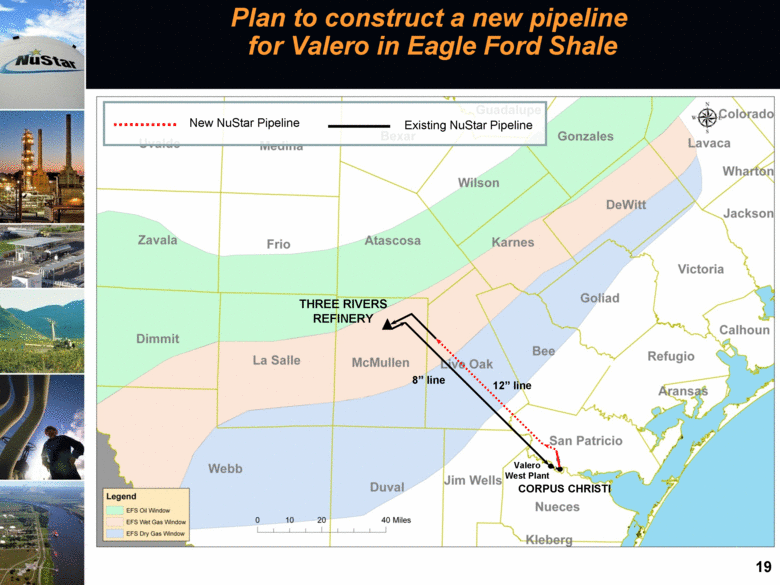
Plan to construct a new pipeline for Valero in Eagle Ford Shale 55 miles of new 12-inch pipeline that will connect to existing NuStar pipeline segments Expect to move crude and feedstocks from Corpus Christi to Valero’s Three Rivers refinery Projected cost $60 to $70 million Expected to be in service in the 3rd quarter of 2012 18 |
|
|
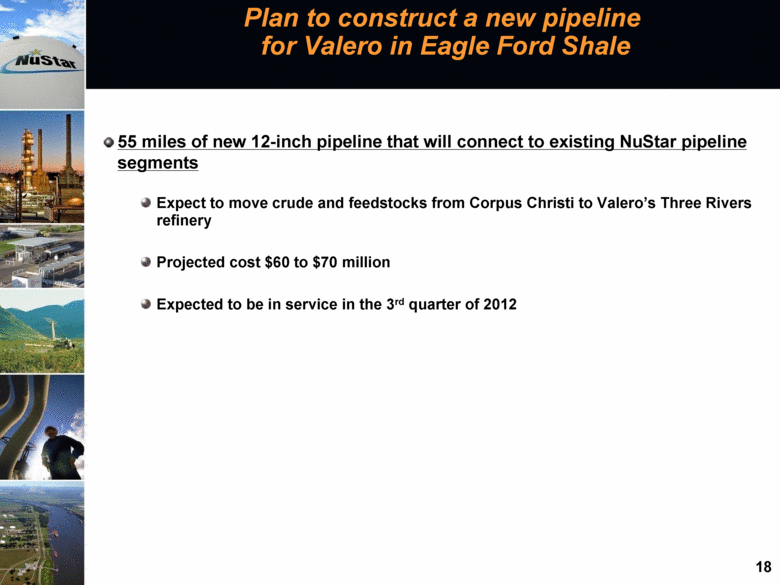
Plan to construct a new pipeline for Valero in Eagle Ford Shale New NuStar Pipeline Existing NuStar Pipeline Valero West Plant CORPUS CHRISTI 12” THREE RIVERS REFINERY 8” line 12” line 19 |
|
|
Pursuing additional projects in the Eagle Ford Shale to better utilize Houston 12” line and idle 8” line out of Pettus Potential New NuStar Pipeline Existing NuStar Pipeline New NuStar Storage Facility NORTH BEACH OAKVILLE 16” line NuStar Pipeline To Houston/ Pasadena PETTUS Underutilized Existing NuStar Pipeline NuStar Pipeline 12” line 20 |

|
|
Asphalt & Fuels Marketing Segment Overview 21 |

|
|
Asphalt & Fuels Marketing Segment 2012 EBITDA expected to be lower than 2011 Outlook U.S. asphalt demand projected to continue to be weak in 2012 NuStar Asphalt operations margins for 2012 forecasted to improve over 2011 due primarily to initiatives to reduce crude costs Hedging losses expected to cause San Antonio refinery earnings to be lower than 2011 Fuels marketing results expected to be lower than 2011 Asphalt & Fuels Marketing Segment EBITDA ($ in Millions)1 22 1 – Please see slide 32 and 33 for a reconciliation of Asphalt & Fuels Marketing Segment EBITDA to its most directly comparable GAAP measure, Operating Income 2006 2007 2008 2009 2010 2011 $127 $80 $111 $108 $27 $22 $37 $10 $37 $65 $90 $70 $74 $28 $15 San Antonio Refinery Asphalt Operations Fuels Marketing |

|
|
Financial Overview 23 |

|
|
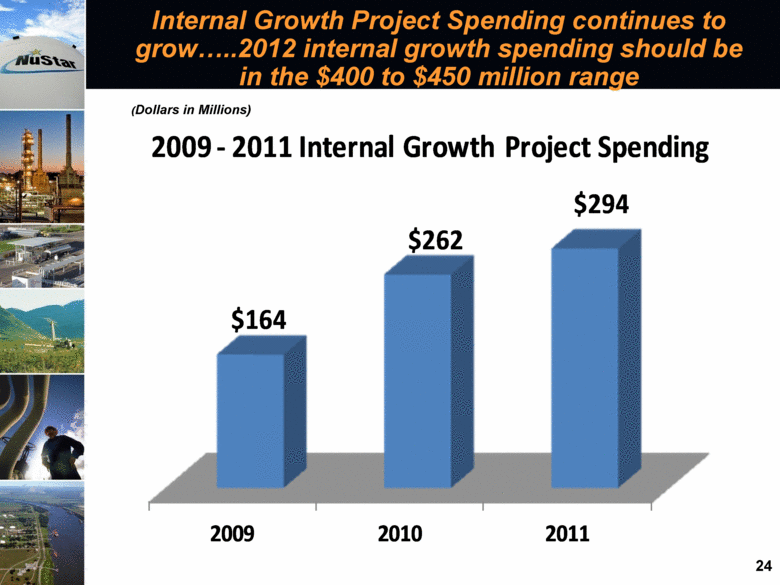
Internal Growth Project Spending continues to grow 2012 internal growth spending should be in the $400 to $450 million range (Dollars in Millions) 24 2009 2010 2011 $164 $262 $294 2009 - 2011 Internal Growth Project Spending |
|
|
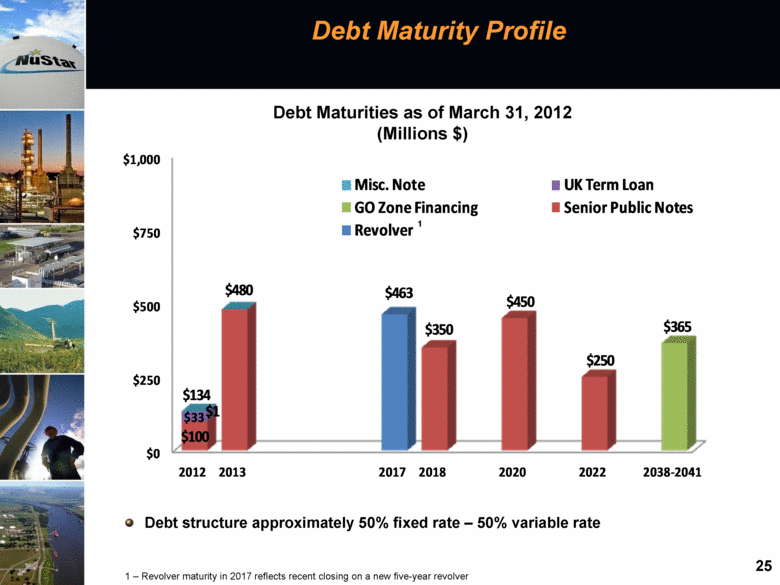
Debt Maturity Profile Debt structure approximately 50% fixed rate – 50% variable rate Debt Maturities as of March 31, 2012 (Millions $) 25 1 1 – Revolver maturity in 2017 reflects recent closing on a new five-year revolver $0 $250 $500 $750 $1,000 2012 2013 2017 2018 2020 2022 2038 - 2041 $100 $480 $350 $450 $250 $33 Misc. Note UK Term Loan GO Zone Financing Senior Public Notes Revolver $134 $365 $1 $463 |
|
|
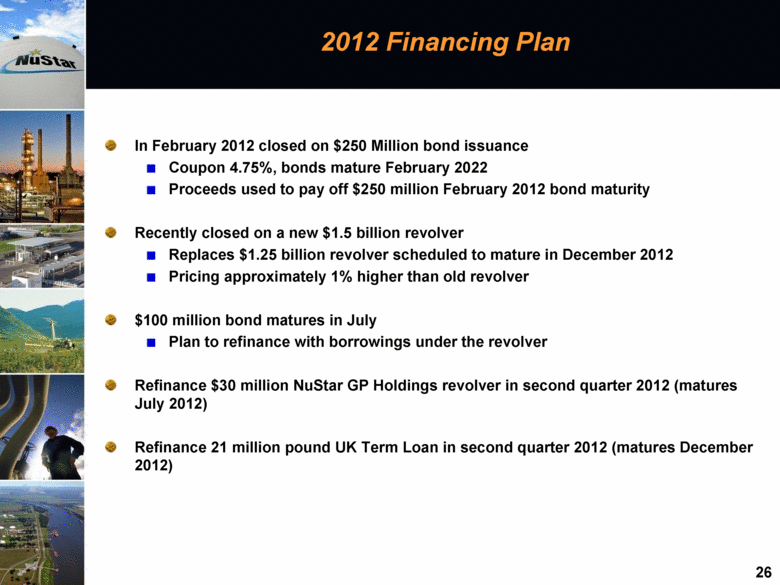
2012 Financing Plan In February 2012 closed on $250 Million bond issuance Coupon 4.75%, bonds mature February 2022 Proceeds used to pay off $250 million February 2012 bond maturity Recently closed on a new $1.5 billion revolver Replaces $1.25 billion revolver scheduled to mature in December 2012 Pricing approximately 1% higher than old revolver $100 million bond matures in July Plan to refinance with borrowings under the revolver Refinance $30 million NuStar GP Holdings revolver in second quarter 2012 (matures July 2012) Refinance 21 million pound UK Term Loan in second quarter 2012 (matures December 2012) 26 |
|
|
High quality, large and diverse asset footprint supporting energy infrastructure both in the U.S. and internationally Contracted fee-based storage and transportation assets provide stable cash flows, delivering approximately 80% of 2011 segment operating income Diverse and high quality customer base composed of large integrated oil companies, national oil companies and refiners Strong balance sheet, credit metrics and commitment to maintain investment grade credit ratings Experienced and proven management team with substantial equity ownership and industry experience Recognized nationally for safety and environmental record as well as one of the best places to work NuStar Highlights 27 |
|
|
2012 Master Limited Partnership Investor Conference Curt Anastasio, President and CEO – May 24, 2012 28 |

|
|
Appendix 29 |
|
|
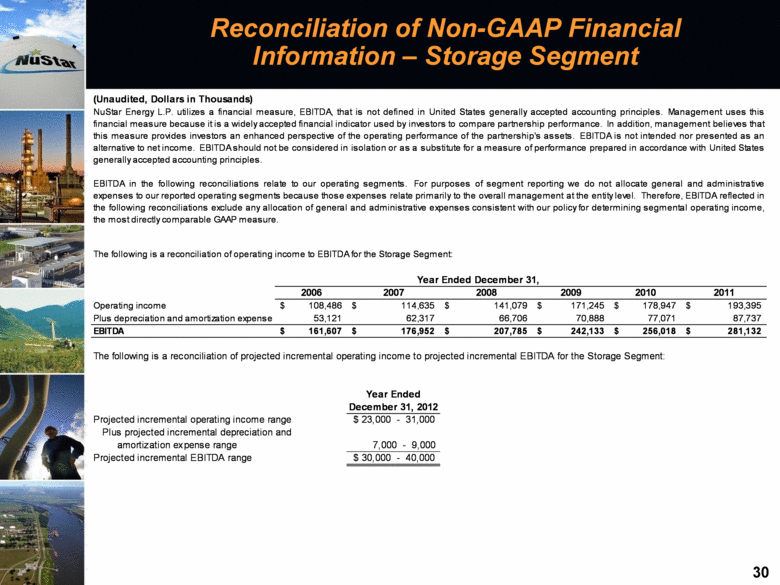
Reconciliation of Non-GAAP Financial Information – Storage Segment 30 (Unaudited, Dollars in Thousands) The following is a reconciliation of operating income to EBITDA for the Storage Segment: 2006 2007 2008 2009 2010 2011 Operating income 108,486 $ 114,635 $ 141,079 $ 171,245 $ 178,947 $ 193,395 $ Plus depreciation and amortization expense 53,121 62,317 66,706 70,888 77,071 87,737 EBITDA 161,607 $ 176,952 $ 207,785 $ 242,133 $ 256,018 $ 281,132 $ Year Ended December 31, 2012 Projected incremental operating income range $ 23,000 - 31,000 Plus projected incremental depreciation and amortization expense range 7,000 - 9,000 Projected incremental EBITDA range $ 30,000 - 40,000 NuStar Energy L.P. utilizes a financial measure, EBITDA, that is not defined in United States generally accepted accounting principles. Management uses this financial measure because it is a widely accepted financial indicator used by investors to compare partnership performance. In addition, management believes that this measure provides investors an enhanced perspective of the operating performance of the partnership's assets. EBITDA is not intended nor presented as an alternative to net income. EBITDA should not be considered in isolation or as a substitute for a measure of performance prepared in accordance with United States generally accepted accounting principles. EBITDA in the following reconciliations relate to our operating segments. For purposes of segment reporting we do not allocate general and administrative expenses to our reported operating segments because those expenses relate primarily to the overall management at the entity level. Therefore, EBITDA reflected in the following reconciliations exclude any allocation of general and administrative expenses consistent with our policy for determining segmental operating income, the most directly comparable GAAP measure. Year Ended December 31, The following is a reconciliation of projected incremental operating income to projected incremental EBITDA for the Storage Segment: |
|
|
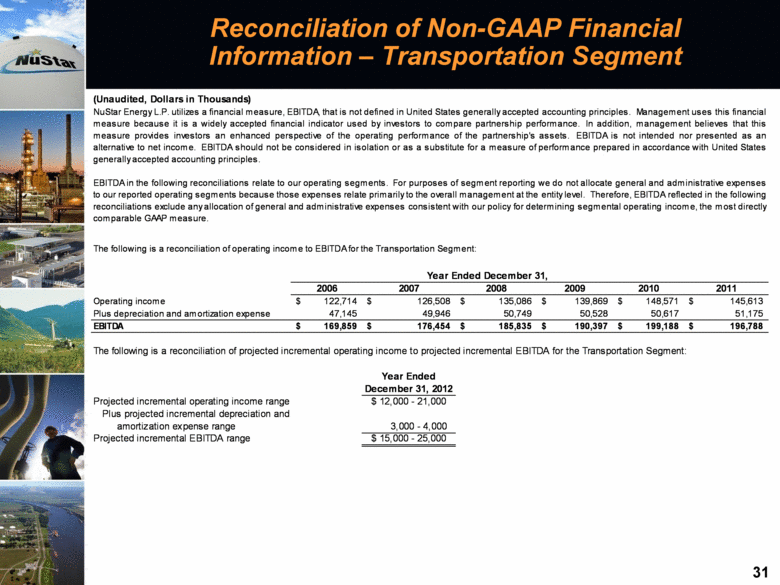
Reconciliation of Non-GAAP Financial Information – Transportation Segment 31 (Unaudited, Dollars in Thousands) The following is a reconciliation of operating income to EBITDA for the Transportation Segment: 2006 2007 2008 2009 2010 2011 Operating income 122,714 $ 126,508 $ 135,086 $ 139,869 $ 148,571 $ 145,613 $ Plus depreciation and amortization expense 47,145 49,946 50,749 50,528 50,617 51,175 EBITDA 169,859 $ 176,454 $ 185,835 $ 190,397 $ 199,188 $ 196,788 $ The following is a reconciliation of projected incremental operating income to projected incremental EBITDA for the Transportation Segment: Year Ended December 31, 2012 Projected incremental operating income range $ 12,000 - 21,000 Plus projected incremental depreciation and amortization expense range 3,000 - 4,000 Projected incremental EBITDA range $ 15,000 - 25,000 NuStar Energy L.P. utilizes a financial measure, EBITDA, that is not defined in United States generally accepted accounting principles. Management uses this financial measure because it is a widely accepted financial indicator used by investors to compare partnership performance. In addition, management believes that this measure provides investors an enhanced perspective of the operating performance of the partnership's assets. EBITDA is not intended nor presented as an alternative to net income. EBITDA should not be considered in isolation or as a substitute for a measure of performance prepared in accordance with United States generally accepted accounting principles. EBITDA in the following reconciliations relate to our operating segments. For purposes of segment reporting we do not allocate general and administrative expenses to our reported operating segments because those expenses relate primarily to the overall management at the entity level. Therefore, EBITDA reflected in the following reconciliations exclude any allocation of general and administrative expenses consistent with our policy for determining segmental operating income, the most directly comparable GAAP measure. Year Ended December 31, |
|
|
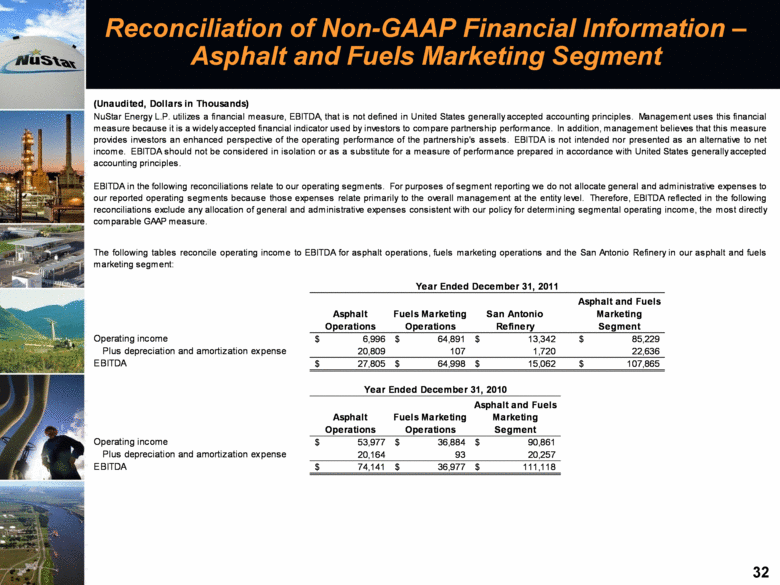
Reconciliation of Non-GAAP Financial Information – Asphalt and Fuels Marketing Segment 32 (Unaudited, Dollars in Thousands) Asphalt Operations Fuels Marketing Operations San Antonio Refinery Asphalt and Fuels Marketing Segment Operating income 6,996 $ 64,891 $ 13,342 $ 85,229 $ Plus depreciation and amortization expense 20,809 107 1,720 22,636 EBITDA 27,805 $ 64,998 $ 15,062 $ 107,865 $ Asphalt Operations Fuels Marketing Operations Asphalt and Fuels Marketing Segment Operating income 53,977 $ 36,884 $ 90,861 $ Plus depreciation and amortization expense 20,164 93 20,257 EBITDA 74,141 $ 36,977 $ 111,118 $ Year Ended December 31, 2011 NuStar Energy L.P. utilizes a financial measure, EBITDA, that is not defined in United States generally accepted accounting principles. Management uses this financial measure because it is a widely accepted financial indicator used by investors to compare partnership performance. In addition, management believes that this measure provides investors an enhanced perspective of the operating performance of the partnership's assets. EBITDA is not intended nor presented as an alternative to net income. EBITDA should not be considered in isolation or as a substitute for a measure of performance prepared in accordance with United States generally accepted accounting principles. EBITDA in the following reconciliations relate to our operating segments. For purposes of segment reporting we do not allocate general and administrative expenses to our reported operating segments because those expenses relate primarily to the overall management at the entity level. Therefore, EBITDA reflected in the following reconciliations exclude any allocation of general and administrative expenses consistent with our policy for determining segmental operating income, the most directly comparable GAAP measure. Year Ended December 31, 2010 The following tables reconcile operating income to EBITDA for asphalt operations, fuels marketing operations and the San Antonio Refinery in our asphalt and fuels marketing segment: |
|
|
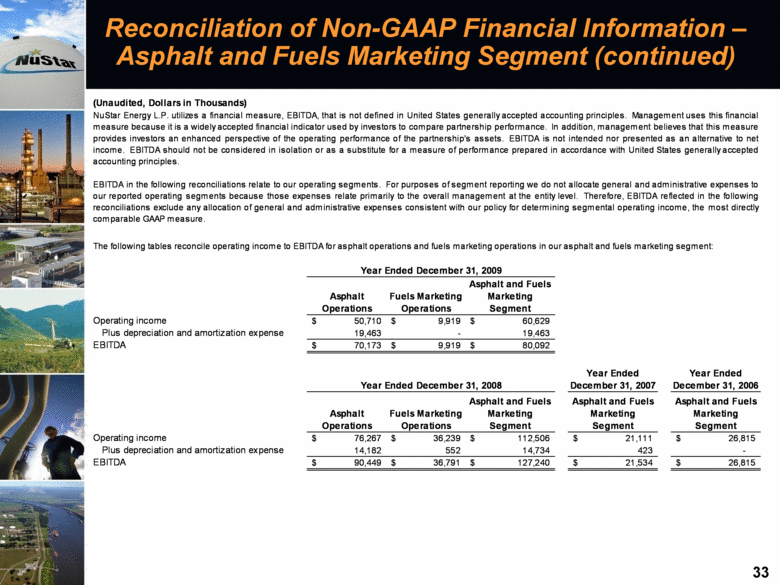
Reconciliation of Non-GAAP Financial Information – Asphalt and Fuels Marketing Segment (continued) 33 (Unaudited, Dollars in Thousands) Asphalt Operations Fuels Marketing Operations Asphalt and Fuels Marketing Segment Operating income 50,710 $ 9,919 $ 60,629 $ Plus depreciation and amortization expense 19,463 - 19,463 EBITDA 70,173 $ 9,919 $ 80,092 $ Year Ended December 31, 2007 Year Ended December 31, 2006 Asphalt Operations Fuels Marketing Operations Asphalt and Fuels Marketing Segment Asphalt and Fuels Marketing Segment Asphalt and Fuels Marketing Segment Operating income 76,267 $ 36,239 $ 112,506 $ 21,111 $ 26,815 $ Plus depreciation and amortization expense 14,182 552 14,734 423 - EBITDA 90,449 $ 36,791 $ 127,240 $ 21,534 $ 26,815 $ Year Ended December 31, 2008 NuStar Energy L.P. utilizes a financial measure, EBITDA, that is not defined in United States generally accepted accounting principles. Management uses this financial measure because it is a widely accepted financial indicator used by investors to compare partnership performance. In addition, management believes that this measure provides investors an enhanced perspective of the operating performance of the partnership's assets. EBITDA is not intended nor presented as an alternative to net income. EBITDA should not be considered in isolation or as a substitute for a measure of performance prepared in accordance with United States generally accepted accounting principles. EBITDA in the following reconciliations relate to our operating segments. For purposes of segment reporting we do not allocate general and administrative expenses to our reported operating segments because those expenses relate primarily to the overall management at the entity level. Therefore, EBITDA reflected in the following reconciliations exclude any allocation of general and administrative expenses consistent with our policy for determining segmental operating income, the most directly comparable GAAP measure. Year Ended December 31, 2009 The following tables reconcile operating income to EBITDA for asphalt operations and fuels marketing operations in our asphalt and fuels marketing segment: |