Attached files
| file | filename |
|---|---|
| 8-K - 8-K - MACOM Technology Solutions Holdings, Inc. | d356928d8k.htm |
 M/A-COM Technology Solutions
Holdings
May 22, 2012
Exhibit 99.1 |
 2
Forward-Looking Statement Safe Harbor and Use of Non-GAAP
Financial Measures
This presentation will include forward-looking statements by us within the
meaning of the Private Securities Litigation Reform Act of 1995, and any
related Q&A discussion may include such statements as well.
Forward-looking statements are statements about future results or events. These statements may
relate to, among other things, our future growth, net revenue, gross margin,
operating margin, earnings, cash flow, capital expenditures, working capital
and other financial items, or our target operating model, business strategy,
goals and expectations concerning our market position, future operations or other
topics. We may use the words "anticipate", "believe",
"could", "estimate", "expect", "intend", "may", "plan",
"predict",
"project",
"will”,
“forecast”,
“guidance”,
“target
model”
and
similar
terms
and
phrases
when
making forward-looking statements.
Our forward-looking statements are subject to assumptions, risks and
uncertainties, and are not guarantees of future results. Actual
results may differ materially from the outcomes stated or implied by our
forward-looking statements based on any assumptions and risk factors we may mention today or
otherwise,
and
based
on
the
risk
factors
set
forth
in
our
Quarterly
Report
on
Form
10-Q
filed
with
the
SEC
on May 10, 2012, which is publicly-available on the SEC's EDGAR database.
We undertake no obligation to update any information contained in these
statements at a later date. Any
references
we
make
to
our
projected
future
financial
results
“announced
as
of
May
8,
2012”
are
not
intended to update, revise or reaffirm that projection as of today.
We will make references in this presentation to certain financial information
calculated on a basis other than
in
accordance
with
accounting
principles
generally
accepted
in
the
United
States
(GAAP),
including
certain gross margin and operating margin figures calculated to exclude
amortization, non-cash compensation expense, accretion of contingent
consideration and/or restructuring charges required to be included by
GAAP. An appendix at the end of this presentation includes a reconciliation of each non-
GAAP
figure
presented
herein
to
the
most
comparable
GAAP
figure.
Our
fiscal
year
end
is
the
Friday
closest
to
September
30
.
th |
 3
•
60-year heritage of innovation
•
$310M of FY 2011 revenue
•
2,700+ products across 38 product lines
•
6,000+ customers worldwide
•
Global, multi-channel sales strategy
•
Differentiated “Fab-Lite”
model
Provider of high-performance analog semiconductor solutions for use in wireless
and wireline applications across the RF, microwave & millimeterwave
spectrum M/A-COM Tech Snapshot
Broad
End-Markets /
Applications
Strong
Product
Portfolio
Global
Presence
Diverse
Customer
Base
3 |
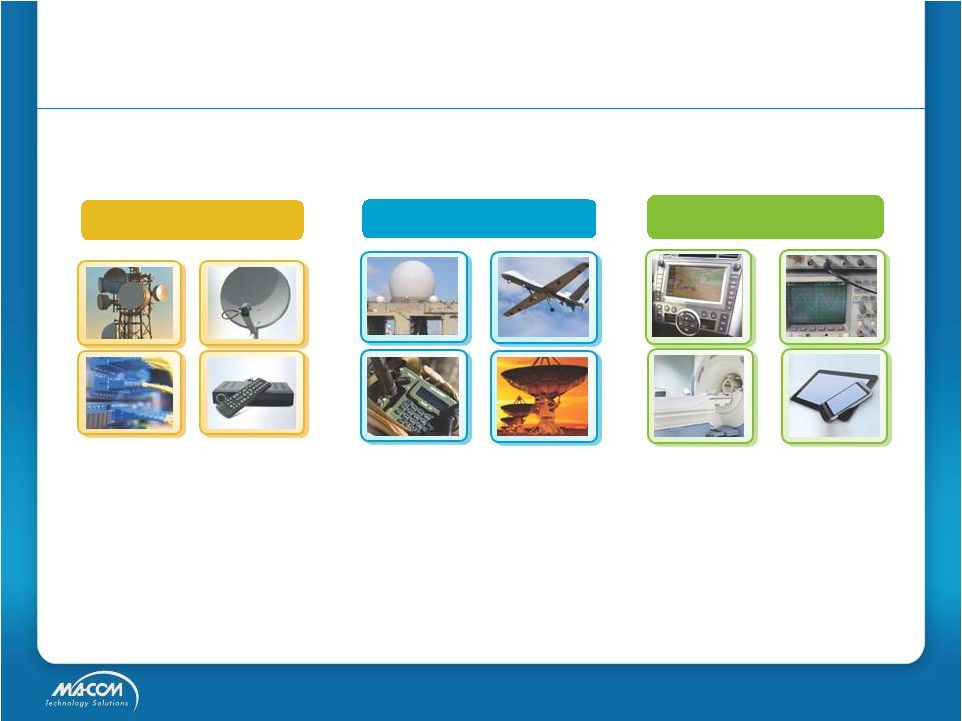 Large
and Growing End Markets CATV / Broadband
Wireless Backhaul
VSAT Terminals
Fiber Optics
Military Communications
Electronic warfare
Space & Hi-Rel
Industrial & Medical
Radar –
Air, Ground & Sea
Test & Measurement
Mobile Devices
Automotive
•
Numerous applications in each primary market
•
>$30
B
market
opportunity
with
projected
14%
CAGR
(1)
A&D –
36%
Multi-market –
39%
Networks –
25%
Note: Percent of Q2 FY 2012 revenue shown for primary markets.
1. Source: Frost & Sullivan, 2010-2017
4 |
 5
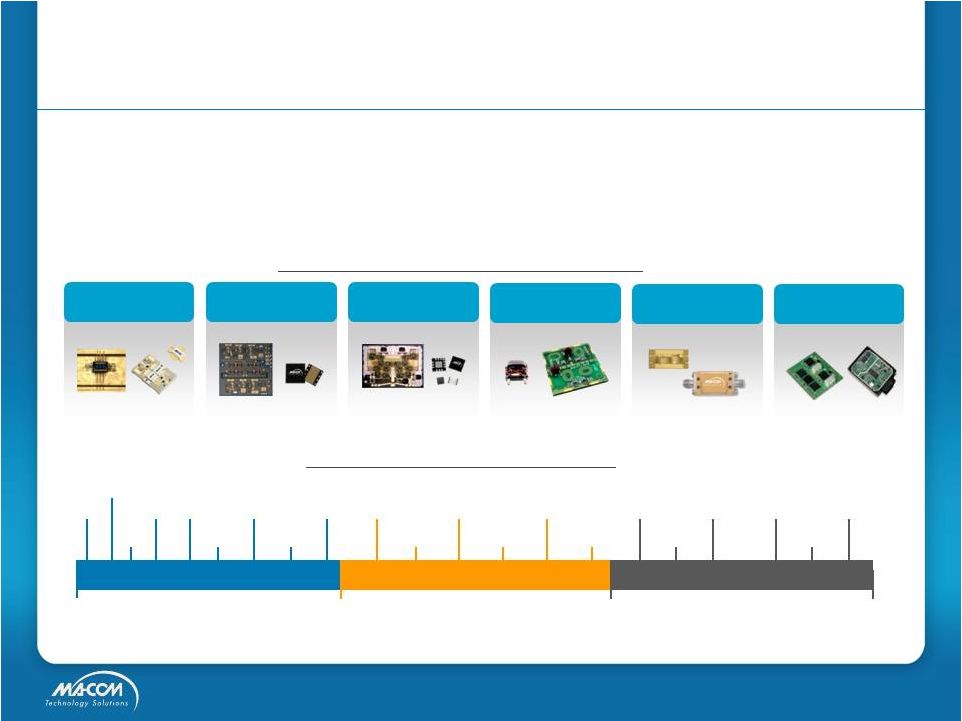
Broad & Innovative Product Portfolio
Integrated
Circuits
Power Pallets
& Transistors
Passive
Components
Switch Limiters,
Switches, Diodes
Active
Components
Multi-Chip
Modules
1 MHz
Radio Frequency
6 GHz
Microwave
20 GHz
110 GHz
Millimeter Wave
Industrial
Broad-
band
Wireless Data,
Toll Tags
GPS,
Avionic,
Radar
Cellular
DVB,
Satellite
Radio
WiMAX, WLAN,
Access Points
Test
Equipment
Microwave
Radio Links
DBS,
Industrial
Imaging
Satellite Payload
Communications
Industrial
VSAT
Millimeter
Wave Radio
Links
UAV
Datalink
SATCOM
Terminal
Communication
Tracking and
Jamming
Adaptive
Cruise
Control
Scientific
Imaging and
Measurement
Radar
Communications
Broadcast
•
Over 2,700 products across 38 product lines
•
High performance analog products up to 100 GHz
•
Long
product
lifecycles
ranging
from
5
–
10
years
Diverse
Array
of
Products
and
Form
Factors
Serving
a
Broad
Frequency
Spectrum
5 |
 6
Growth Strategy with Multiple Drivers
NEW PRODUCTS /
PRODUCT LINES
OPPORTUNISTIC
ACQUISITIONS
NEW ADJACENT
MARKETS
INTEGRATED
SOLUTIONS
GaN Transistors
& Smart Pallets
40G / 100G
Optoelectronics
38 GHz SmartSet |
 MARKET OVERVIEW |
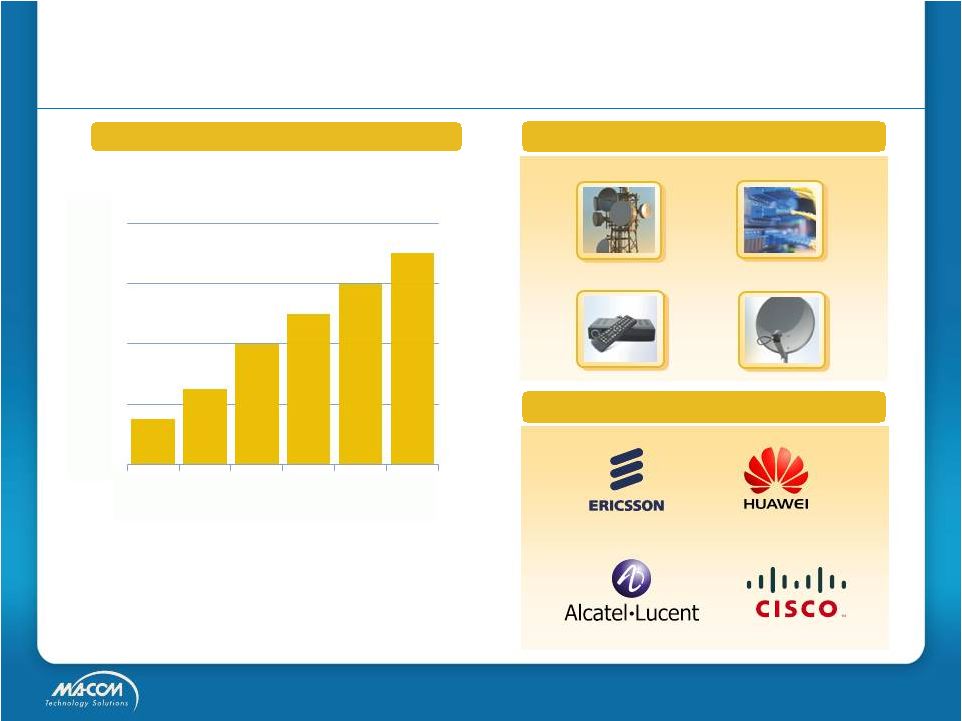 Networks Overview
1.
2010 Cisco Visual Networking index.
Wireless Backhaul
Satellite Internet
CATV / Broadband
Fiber Optics
•
Proliferation of smartphones, tablets,
video on demand services
•
Infrastructure expansion & upgrades for
greater capacity and faster speeds
Exabytes
8
0
20
40
60
80
2010
2011
2012
2013
2014
2015
8
Applications
By 2015 Total Internet Traffic will be
4X
Larger
than
2010
(1)
Market Drivers
Key Customers |
 9
•
Multiple design wins for modulator driver
and TIA products for 100G
•
Ramp in production with 100G long haul
customer
•
At OFC, our EML driver used in customer
demonstration of 100GbE CFP2
•
Ovum forecasts double digit CAGR for
100G ramping in late CY 2012 thru 2013
Networks Product Highlight: Optoelectronics |
 10
Aerospace & Defense Overview
1.
The Teal Group.
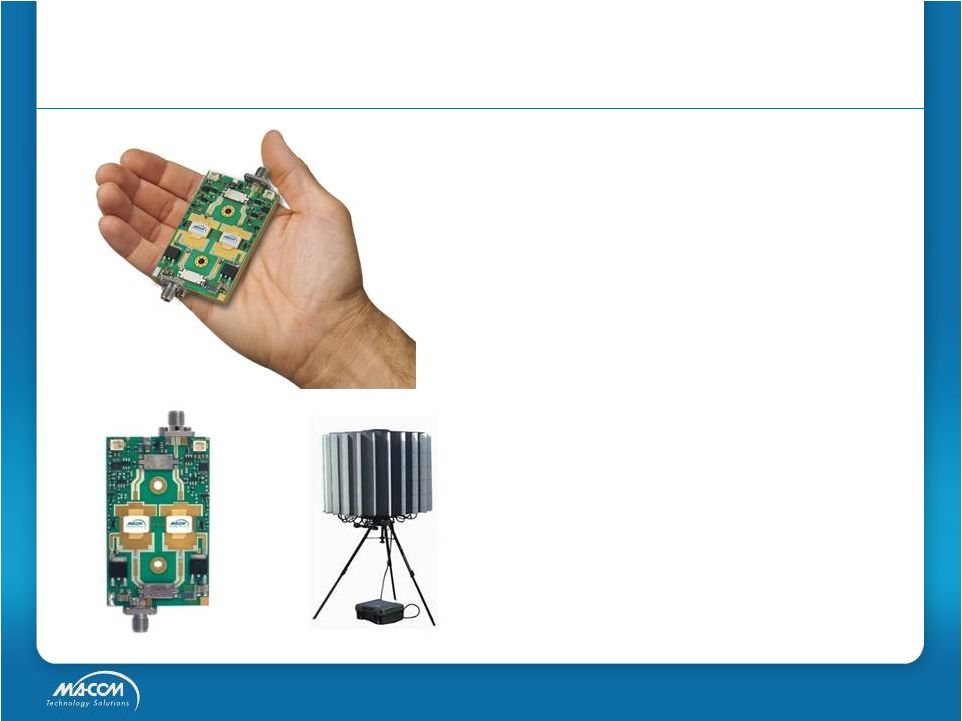
•
UAV
market
to
double
over
next
decade
(1)
•
Electronic
content
growth
in
A&D
–
phased
array radars with 1000s of T/R modules
Radar
Electronic Warfare
Military Communications
Space & Hi-Rel
Market Drivers
World Unmanned Aerial Vehicle
Forecast
(1)
Applications
Key Customers
0
3
6
9
12
2011
2012
2013
2014
2015
2016
($ Billions) |
 11
•
GaN Smart Pallet incorporates hybrid PA
technologies & intelligent bias circuitry
•
Compact module optimizes performance,
reliability and cost for customer
•
Sole source design win with US Defense
customer for mortar locating radar
•
20 units to be delivered this year with full
rate production slated for CY 2014
A&D Product Highlight: GaN Smart Pallet |
 12
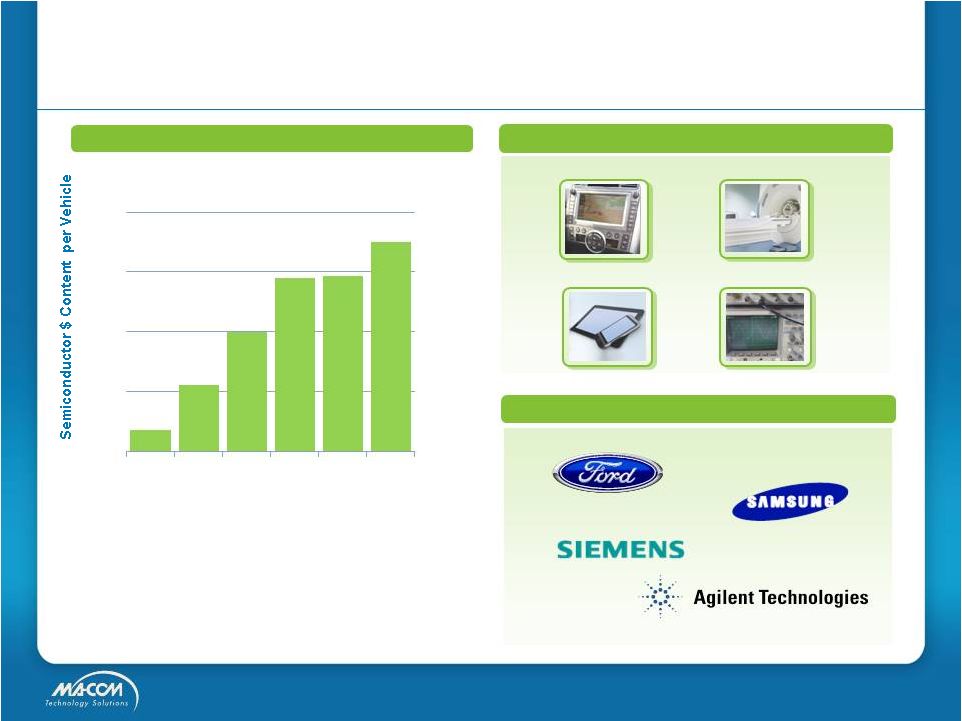
Multi-market Overview
1.
IC Insights. 9% CAGR from 2010-2014.
•
Increasing semiconductor content per
automobile
–
9%
CAGR
(1)
•
Solutions for medical imaging, life
sciences, and test & measurement
•
Broad portfolio of catalog products
Automotive
Mobile Devices
Test & Measurement
Industrial & Medical
Market Drivers
Applications
Avg. Semiconductor Content in
Automobiles
(1)
Key Customers
250
300
350
400
450
2009
2010
2011
2012
2013
2014 |
 13
•
Ford is only >10% customer for patented
GPS “Sync”
Module
•
Module enables dead reckoning feature &
eliminates need for antenna fin
•
Marketing ADAS prototype with NAVTEQ
for energy efficiency & enhanced safety
•
Other automotive applications include
sensor products for short range radar
Multi-market Highlight: Automotive
ADAS Prototype with NAVTEQ Maps
Ford “Sync”
GPS Module |
 COMPETITIVE ADVANTAGE |
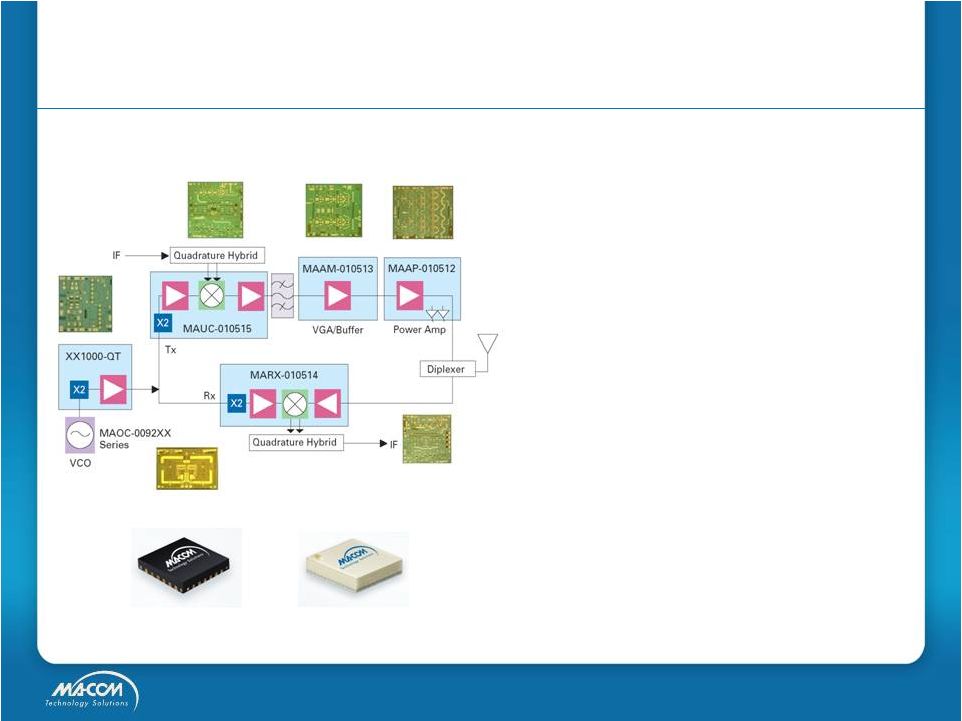 Advanced R&D Capabilities
•
System level approach to solutions that
enable fast time to market for customer
•
Combines unique modeling, IC design,
integration & packaging capabilities
•
A leader in RF front end architecture for
wireless
backhaul
with
“SmartSet”
solution
•
Innovation in surface mount packaging
allows use of high volume manufacturing
42 GHz SmartSet for Wireless Backhaul
QFN Packages
Laminate Packages
15 |
 AlGaAs Diodes
GaAs MESFET
GaAs pHEMT
HMIC Technology
Silicon Bipolar
Silicon Diodes
Silicon LDMOS
Silicon MOSFET
GaAs HBT
GaAs HFET
GaAs MESFET
GaAs pHEMT
GaN on SiC
InP HBT
RF CMOS
SiGe
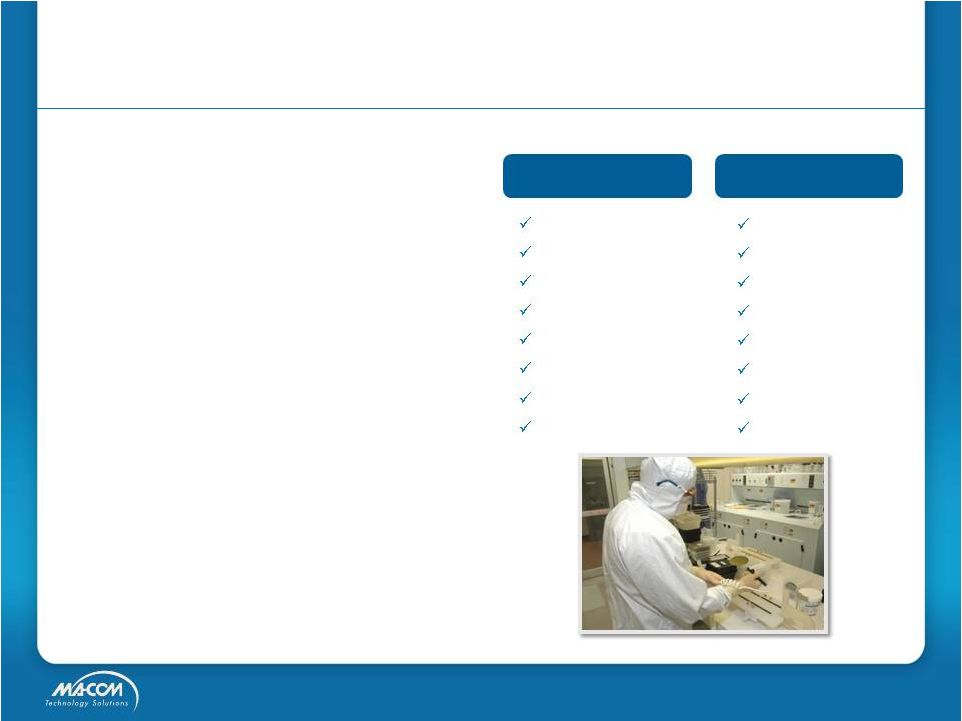
•
Owning a fab is a competitive advantage
–
Proprietary process technologies
–
Assurance of supply
–
Control over quality
–
Strategic for US A&D customers
•
Outsourcing enhances attractiveness of
financial model
–
Variable cost structure
–
Outsourcing of excess demand
–
Low capital expenditures
Differentiated “Fab-Lite”
Model
Internal Process
Technologies
External Process
Technologies
16 |
 FINANCIAL OVERVIEW |
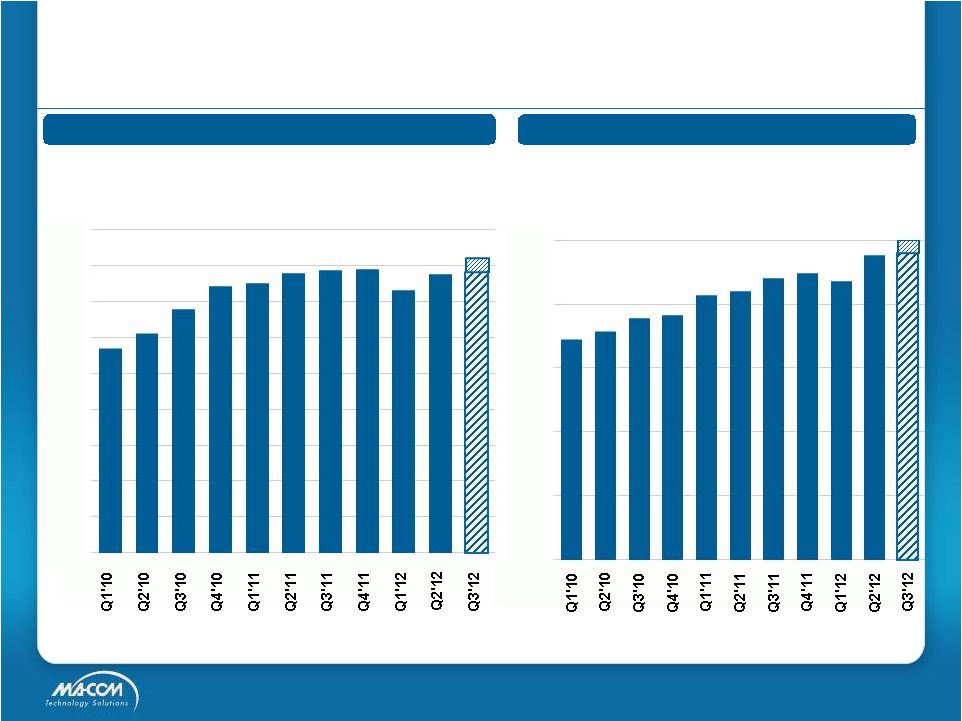 Revenue by Fiscal Quarter
($ in millions)
Gross Margin** by Fiscal Quarter
Revenue and Gross Margin Expansion
* Q3 FY 2012 guidance announced as of May 8, 2012
** Non-GAAP: Excludes amortization and
non-cash compensation expenses. $78-82*
48-50%*
$57
$61
$68
$74
$75
$78
$79
$79
$73
$77
$0
$10
$20
$30
$40
$50
$60
$70
$80
$90
34%
36%
38%
38%
41%
42%
44%
45%
44%
48%
0%
10%
20%
30%
40%
50%
18 |
 19
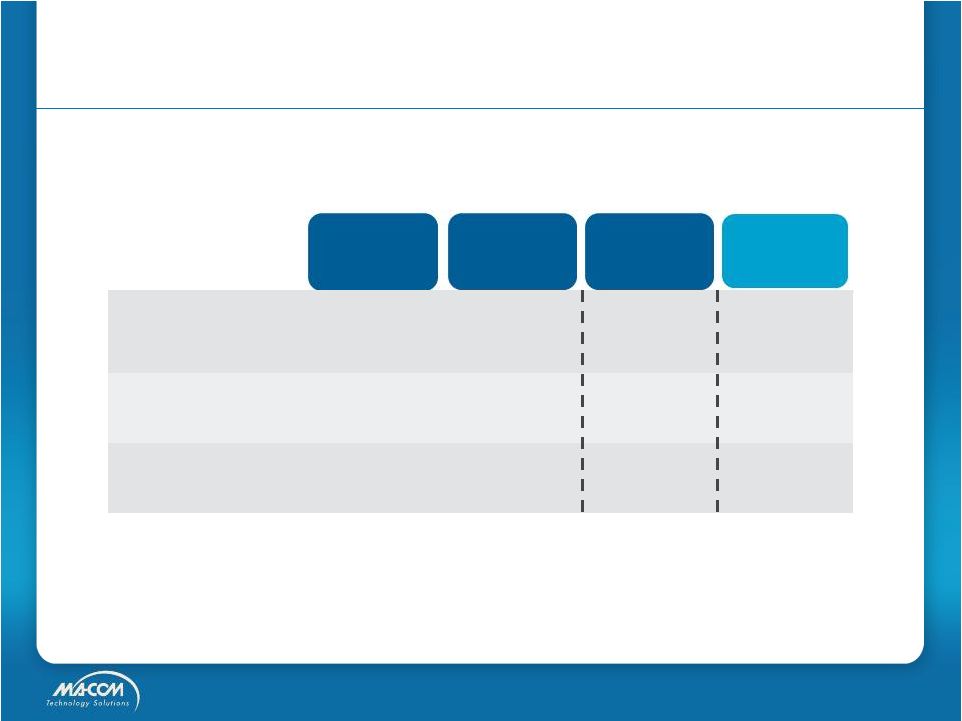
2-Year Target Operating Model
($ in millions / % of revenue)
Revenue
$260
$310
$77
Above
Market
Growth
Gross Margin
(1)
37%
43%
48%
55% –
60%
Operating
Margin
(1)(2)
10%
17%
23%
30% –
35%
1.
Non-GAAP: Excludes amortization and non-cash compensation expenses.
2. Non-GAAP: Also excludes accretion of contingent
consideration and restructuring charges. FY 2010
FY 2011
Q2 FY 2012
Target
Model |
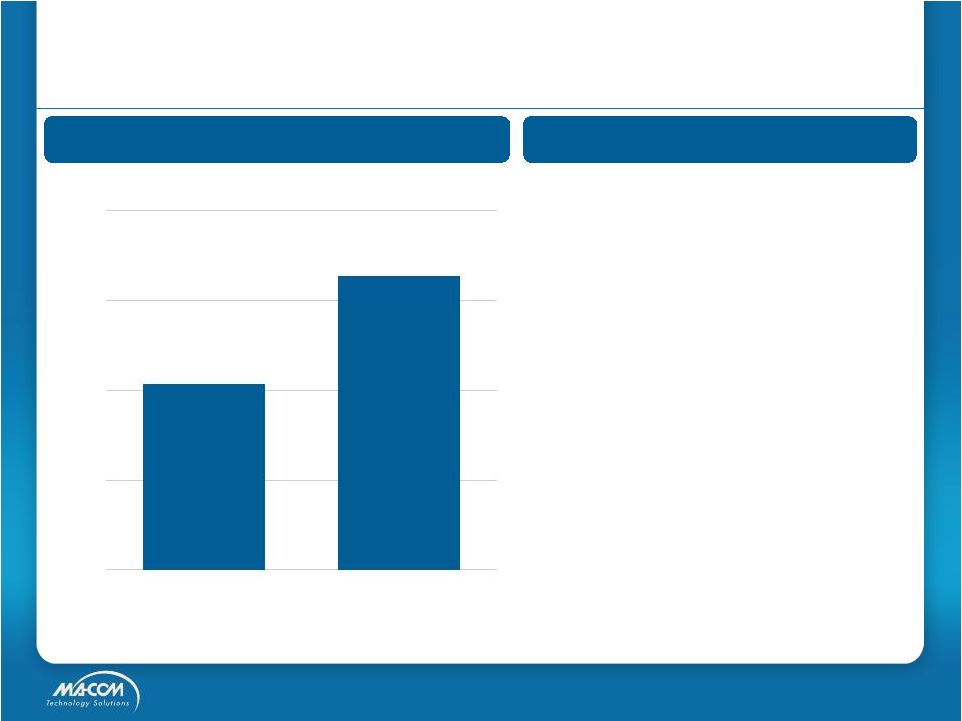 20
Annual Operating Cash Flow
Strong Cash Flow & Balance Sheet
First Half FY’12 Operating
Cash Flow -
$18.2
Cash & Equivalents -
$74.7
Working Capital -
$130.6
Debt Free
Unused and Available
Line of Credit -
$125.0
As of March 30, 2012
($ in millions)
$20.7
$32.8
$
-
$10
$20
$30
$40
FY 2010
FY 2011 |
 Appendix |
 22
Reconciliation of GAAP to Non-GAAP Results
($ in thousands)
Q1 2010
Q2 2010
Q3 2010
Q4 2010
Q1 2011
Q2 2011
Q3 2011
Q4 2011
Q1 2012
Q2 2012
FY 2010
FY 2011
Revenue
$57,405
$61,014
$67,705
$74,173
$74,909
$77,884
$78,700
$78,802
$73,035
$77,480
$260,297
$310,295
GAAP Gross Profit
$19,419
$21,315
$25,126
$27,883
$30,614
$32,245
$34,118
$34,883
$31,415
$36,549
$93,743
$131,860
GAAP Gross Margin
34%
35%
37%
38%
41%
41%
43%
44%
43%
47%
36%
42%
Amortization expense
399
397
398
400
382
382
443
381
382
382
1,594
1,588
Non-cash compensation expense
(16)
54
101
55
54
102
134
45
36
42
194
335
Non-GAAP Gross Profit
$19,802
$21,766
$25,625
$28,338
$31,050
$32,729
$34,695
$35,309
$31,833
$36,973
$95,531
$133,783
Non-GAAP Gross Margin
34%
36%
38%
38%
41%
42%
44%
45%
44%
48%
37%
43%
GAAP Operating Profit
$17,983
$17,854
$45,927
GAAP Operating Margin
23%
7%
15%
COGS Amortization expense
382
1,594
1,588
COGS Non-cash compensation expense
42
194
335
R&D Non-cash compensation expense
118
208
258
SG&A Amortization expense
257
1,095
1,069
SG&A Non-cash compensation expense
303
1,143
964
Accretion of contingent consideration
(1,247)
2,000
210
Restructuring charges
-
2,234
1,499
Non-GAAP Operating Profit
$17,838
$26,322
$51,850
Non-GAAP Operating Margin
23%
10%
17% |