Attached files
| file | filename |
|---|---|
| 8-K - COPANO ENERGY, LLC FORM 8-K - Copano Energy, L.L.C. | form8-k.htm |
| EX-99.2 - PRESS RELEASE - Copano Energy, L.L.C. | ex99-2.htm |
Exhibit 99.1

1
NAPTP 2012 MLP Investor
Conference
Conference
May 23 - 24, 2012
NASDAQ: CPNO

2
Disclaimer
This presentation includes “forward-looking statements,” as defined in the federal securities laws. Statements that
address activities or events that Copano believes will or may occur in the future are forward-looking statements. These
statements include, but are not limited to, statements about future producer activity and Copano’s total distributable
cash flow and distribution coverage. These statements are based on management’s experience and perception of
historical trends, current conditions, expected future developments and other factors management believes are
reasonable.
Important factors that could cause actual results to differ materially from those in the forward-looking statements
include the following risks and uncertainties, many of which are beyond Copano’s control: the volatility of prices and
market demand for natural gas and natural gas liquids; Copano’s ability to continue to obtain new sources of natural
gas supply and retain its key customers; the impact on volumes and resulting cash flow of technological, economic
and other uncertainties inherent in estimating future production, producers’ ability to drill and successfully complete
and attach new natural gas supplies and the availability of downstream transportation systems and other facilities for
natural gas and NGLs; mechanical failures and other operational risks affecting the performance of Copano’s
processing plants and other facilities, higher construction costs or project delays due to inflation, limited availability of
required resources, or the effects of environmental, legal or other uncertainties; general economic conditions; the
effects of government regulations and policies; and other financial, operational and legal risks and uncertainties
detailed from time to time in Copano’s quarterly and annual reports filed with the Securities and Exchange
Commission.
Copano undertakes no obligation to update any forward-looking statements, whether as a result of new information or
future events.
future events.

3
Eagle Ford Shale
Update
Eagle Ford Shale
Growth Projects
Business Segment
Outlook
Agenda
Eagle Ford Shale
Update
Eagle Ford Shale
Growth Projects
Business Segment
Outlook

4
Long-term Value of Eagle Ford Strategy Unchanged
Eagle Ford Shale play considered one of the best in North America
• Size, quality and proximity to markets
Copano assets well positioned
• Existing pipes and processing capacity with significant tailgate market access
• New, large-diameter pipelines in service
Created and investing $1 billion in organic projects
• Capital invested at 5x multiple
Executed producer contracts totaling up to 1,000,000 MMBtu/d of committed
volumes
volumes
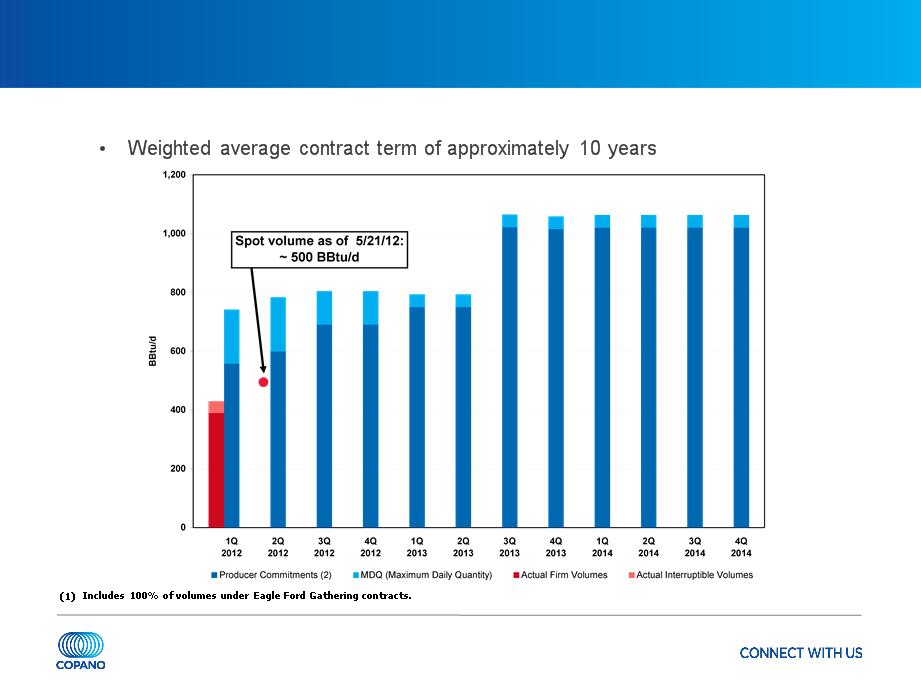
• Weighted average term of approximately 10 years
• Committed volumes over the terms of the agreements total approximately 3.3 Tcf of rich
Eagle Ford Shale gas
Eagle Ford Shale gas
Increasing contribution from fee-based cash flows
• Vast majority of our Eagle Ford shale contracts include fixed fees for gathering,
processing, transportation and fractionation services, and producer volume commitments
with deficiency payments
processing, transportation and fractionation services, and producer volume commitments
with deficiency payments
Based on today’s operating environment, we expect to maintain current
distribution level in the near-term, and our long-term view of distribution
growth is unchanged
distribution level in the near-term, and our long-term view of distribution
growth is unchanged

5
Eagle Ford Shale Processing
We expect combined actual NGL recoveries to remain above or near
contractually fixed recoveries for the balance of the year
contractually fixed recoveries for the balance of the year
• Margins from fixed recovery contract terms are in addition to the fixed fees we collect for our
midstream services
midstream services
Houston Central performance
• 200 MMcf/d cryo achieving better than designed recoveries since late April
• While lean oil plant has been achieving lower NGL recoveries from richer natural gas, overall
recoveries at the Houston Central complex (cryo plus lean oil) are ranging from slightly above to
slightly below weighted-average fixed-recovery contract levels
recoveries at the Houston Central complex (cryo plus lean oil) are ranging from slightly above to
slightly below weighted-average fixed-recovery contract levels
• Upon completion of new, highly efficient cryo expansion:
-Copano’s margins benefit from upside under fixed-recovery contracts
-Copano retains most of the margin benefit from ethane rejection capability
Third-party plant performance
• Eagle Ford Gathering’s recoveries at third-party plants are above fixed recovery contract levels
• Net impact to Copano of recoveries at third-party plants offsets lower Houston Central recoveries
High NGL content creates near-term liquids-handling constraints but ultimately
results in long-term value for Copano
results in long-term value for Copano

6
Houston Central Complex Expansion Projects
New 400 MMcf/d cryogenic expansion expected in service 1Q 2013
• Average recoveries will improve when the new cryogenic expansion comes online
• When Formosa’s new fractionator becomes operational in 2Q 2013, recoveries will
further improve with access to additional NGL handling capacity
further improve with access to additional NGL handling capacity
The second 400 MMcf/d cryogenic expansion further enhances recoveries
when placed in service in 2014
when placed in service in 2014
• Supported by recently announced producer contract and higher recovery rates
• Lean oil plant will be used for overflow or interruptible volume services
• Expected capital investment of $190 million at a 5x multiple
- Major capital spending begins 2H 2013
These expansions will provide Copano 1 Bcf/d of highly efficient
processing capacity backed by long-term producer commitments
processing capacity backed by long-term producer commitments
• Key driver to creating long-term unitholder value from rich Eagle Ford Shale play
7
Long-term Eagle Ford Shale Gas Contracts(1)
Eagle Ford Shale will drive shift to fee-based volumes
(2) Includes substantial, long-term acreage dedication from GeoSouthern in northern Eagle Ford Shale.

8
Eagle Ford Shale
Update
Eagle Ford Shale
Growth Projects
Business Segment
Outlook
Agenda
Eagle Ford Shale
Update
Eagle Ford Shale
Growth Projects
Business Segment
Outlook
9
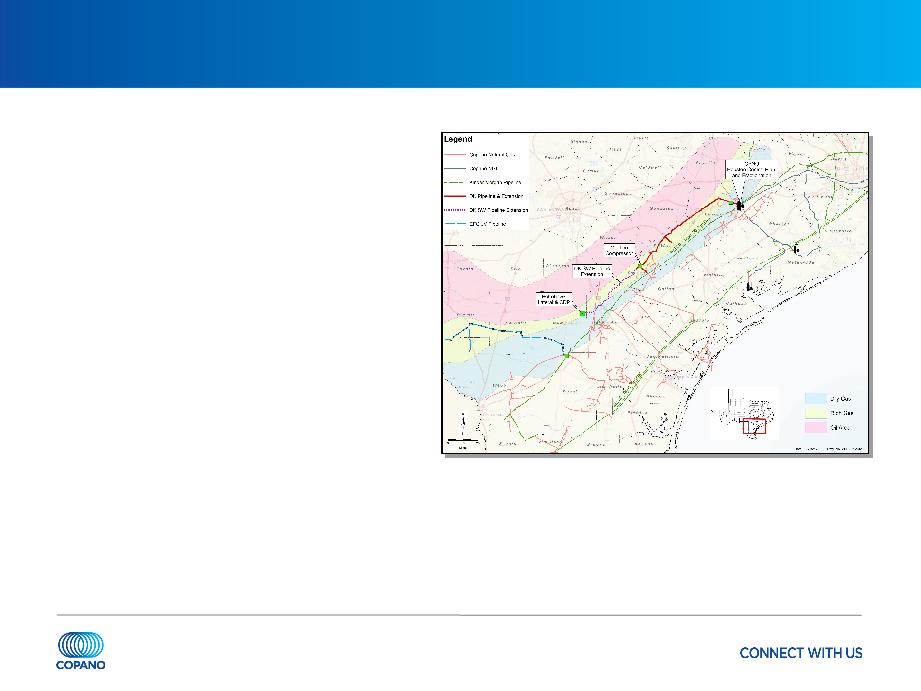
DK Pipeline Southwest Extension
Further extend DK pipeline by adding
approximately 65 miles of 24” pipeline
southwest into McMullen County
approximately 65 miles of 24” pipeline
southwest into McMullen County
• Provides access to significant new
Eagle Ford Shale volumes
Eagle Ford Shale volumes
• Ties additional existing Copano
gathering systems directly to Houston
Central complex
gathering systems directly to Houston
Central complex
• Supported by new, long-term volume
commitment from Petrohawk Energy
commitment from Petrohawk Energy
Expect to begin service 2Q 2013
Estimated capital investment of
approximately $120 million
approximately $120 million
10
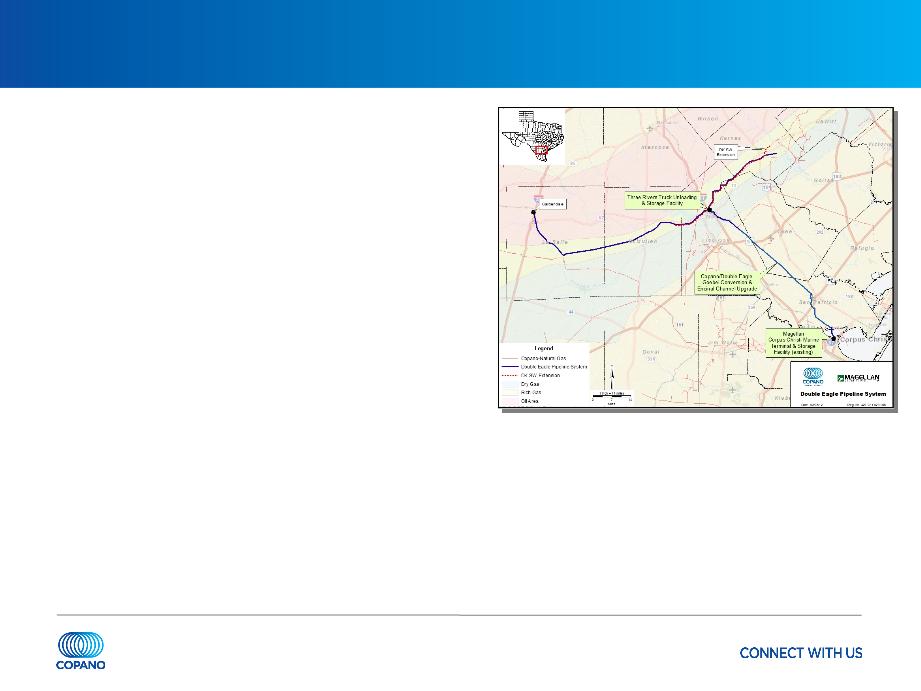
Double Eagle Condensate Pipeline Joint Venture
50/50 JV with Magellan Midstream
• Construct 140-mile condensate gathering
system
system
• Utilizes Copano’s existing 14” Copano
Goebel pipeline and dual-line rights of way
Goebel pipeline and dual-line rights of way
• 100,000 Bbls/d of nominal capacity
• Ties into existing and expanded Magellan
storage and loading docks at the Port of
Corpus Christi
storage and loading docks at the Port of
Corpus Christi
• Interconnected to local petrochemical plants
and refineries via Magellan terminal
and refineries via Magellan terminal
• Pipeline from Three Rivers to Corpus Christi
expected to begin service as early as 1Q
2013; remaining assets 2Q 2013
expected to begin service as early as 1Q
2013; remaining assets 2Q 2013
Executed long-term, fee-based contracts with Talisman and Statoil
Estimated capital investment of approximately $100 million (includes Copano’s net
JV costs and costs to convert Goebel pipeline)
JV costs and costs to convert Goebel pipeline)
11
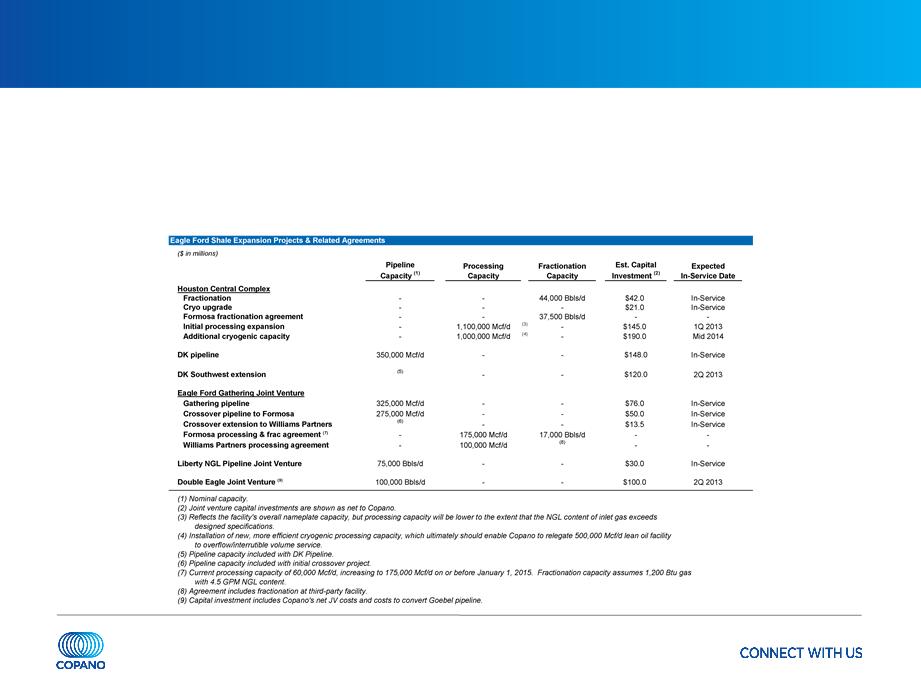
Summary of Eagle Ford Shale Infrastructure
Announced total capital investment of over $930 million
In excess of 1 Bcf/d of pipeline and processing capacity
Greater than 100,000 Bbls/d of fractionation capacity

12
Eagle Ford Shale
Update
Eagle Ford Shale
Growth Projects
Business Segment
Outlook
Agenda
Eagle Ford Shale
Update
Eagle Ford Shale
Growth Projects
Business Segment
Outlook
13
Texas Recent Developments
Saint Jo system - north Barnett Shale
Combo
Combo
• Plant fully committed under long-term,
fee-based contracts
fee-based contracts
• Plant running at or above nameplate
capacity
capacity
• Treating capacity expansion at Saint Jo
plant completed March 2012
plant completed March 2012
- Provides for a maximum of 110 MMcf/d of
inlet capacity
inlet capacity
- Capital investment of $12 million
- Increased contract fees for treating
• Southeast extension of Saint Jo
gathering system
gathering system
- Gathering incremental to current processed
volume at Saint Jo
volume at Saint Jo
- Expect initial service beginning 3Q 2012
- Capital investment of $12.5 million
(includes pipe and compression)
(includes pipe and compression)

14
Texas Recent Developments
Eagle Ford Shale
• Copano’s total Eagle Ford Shale volumes (including Eagle Ford Gathering volumes)
averaged approximately 430,000 MMBtu/d in 1Q 2012
averaged approximately 430,000 MMBtu/d in 1Q 2012
Lake Charles plant
• Processed approximately 133,000 MMBtu/d in 1Q 2012
- Currently running on an opportunistic basis
- At current pricing, anticipated monthly net gross margin of approximately $500K -
$900K
$900K

15
Texas Outlook
Saint Jo system
• Copano’s largest producer continues an active drilling program in the area
• Leasing activity continues
Eagle Ford Shale
• Approximately 240 rigs currently running in the Eagle Ford Shale
• Continue to expect volume increases on both wholly owned and joint venture assets for
the balance of 2012 and beyond
the balance of 2012 and beyond
Expect segment gross margin in 2Q 2012 to be higher by $3 - $5 million
compared to 1Q 2012 due to successful repair of the cryo at Houston Central
and volume growth from the Eagle Ford Shale
compared to 1Q 2012 due to successful repair of the cryo at Houston Central
and volume growth from the Eagle Ford Shale

16
Oklahoma Recent Developments
Woodford Shale
• Volumes on the Cyclone Mountain system up in 2Q 2012 from 1Q 2012
• Treating and compression capacity optimization ongoing
Mississippi Lime
• Drilling near Copano infrastructure continues to be active
• Expanding Osage system gathering footprint by installing approximately 34 miles of 8”
and 12” pipe to provide additional gathering, processing and nitrogen treating services to
Mississippi Lime producers
and 12” pipe to provide additional gathering, processing and nitrogen treating services to
Mississippi Lime producers

17
Oklahoma Outlook
Rich gas (primarily Hunton dewatering and Mississippi Lime)
• Drilling activity remains steady in 2Q 2012 compared to 1Q 2012
• 3 rigs running in the Hunton, 6 rigs in the Mississippi Lime and 10 rigs in other rich gas
areas
areas
• In the Mississippi Lime, volume growth expected as drilling activity increases
Lean gas (primarily Woodford Shale)
• Modest volume increases due to wells drilled in 1Q 2012; however, production should
decline in the second half of the year due to normal well decline and reduced drilling
activity
decline in the second half of the year due to normal well decline and reduced drilling
activity
• No active rigs
Expect gross margin to be flat to slightly lower in 2Q 2012 compared to 1Q
2012 due to lower commodity prices, partly offset by volume growth in the
Woodford Shale and continued development in the Mississippi Lime
2012 due to lower commodity prices, partly offset by volume growth in the
Woodford Shale and continued development in the Mississippi Lime

18
Rocky Mountains Outlook
Drilling and dewatering activity will be driven by commodity prices and
producer economics
producer economics
• 2Q 2012 volumes for Bighorn expected to be lower compared to 1Q 2012
• 2Q 2012 volumes for Fort Union expected to be lower compared to 1Q 2012
2Q 2012 Adjusted EBITDA expected to be $3 million higher compared to 1Q
2012, as distribution from Fort Union should include Copano’s share of annual
payments for treating deficiency fees Fort Union earned in 2011
2012, as distribution from Fort Union should include Copano’s share of annual
payments for treating deficiency fees Fort Union earned in 2011

19
Appendix

20
Introduction to Copano
Independent midstream company founded in 1992
• Producer focused
• Entrepreneurial approach
• Focus on long-term accretive growth
• Publicly traded LLC
- No general partner or incentive distribution rights
- Tax benefits similar to MLPs, but with corporate governance of a C-corp
Service throughput volumes approximate 2,232,000 MMBtu/d of natural gas(1)
Over 7,000 miles of active pipelines
10 natural gas processing plants with over 1.2 Bcf/d of combined processing
capacity
capacity
One NGL fractionation facility with total capacity of 44,000 Bbls/d
(1) Based on 1Q 2012 results. Includes unconsolidated affiliates.
21
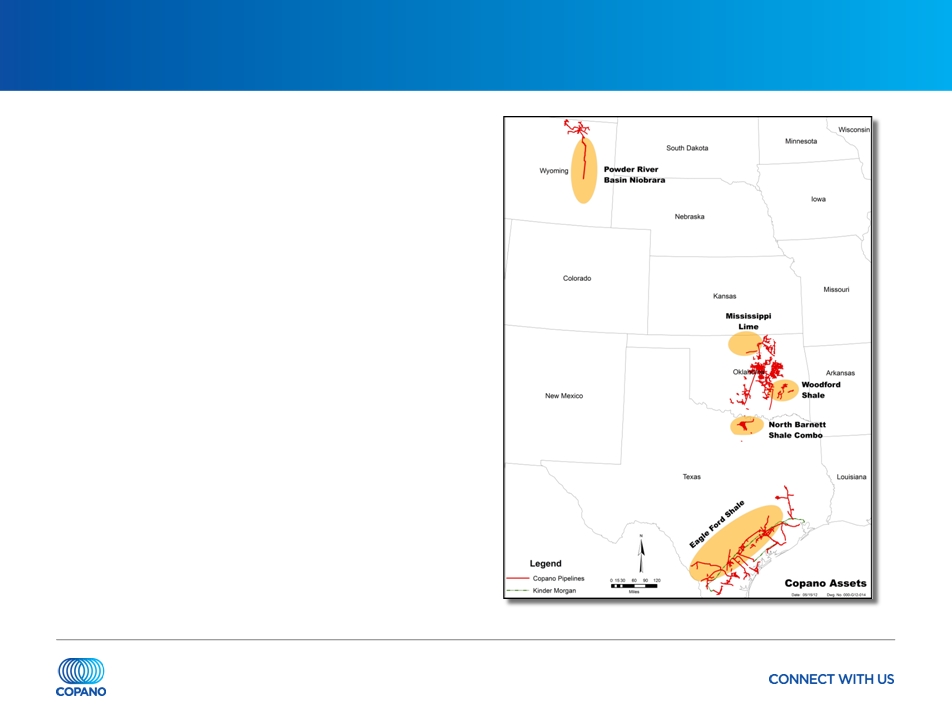
Area of Operations
Operating segments
• Texas
• Oklahoma
• Rocky Mountains
Copano currently has assets in five
U.S. resource plays
U.S. resource plays
• Eagle Ford Shale
• North Barnett Shale Combo
• Woodford Shale
• Mississippi Lime
• Powder River Basin Niobrara
22
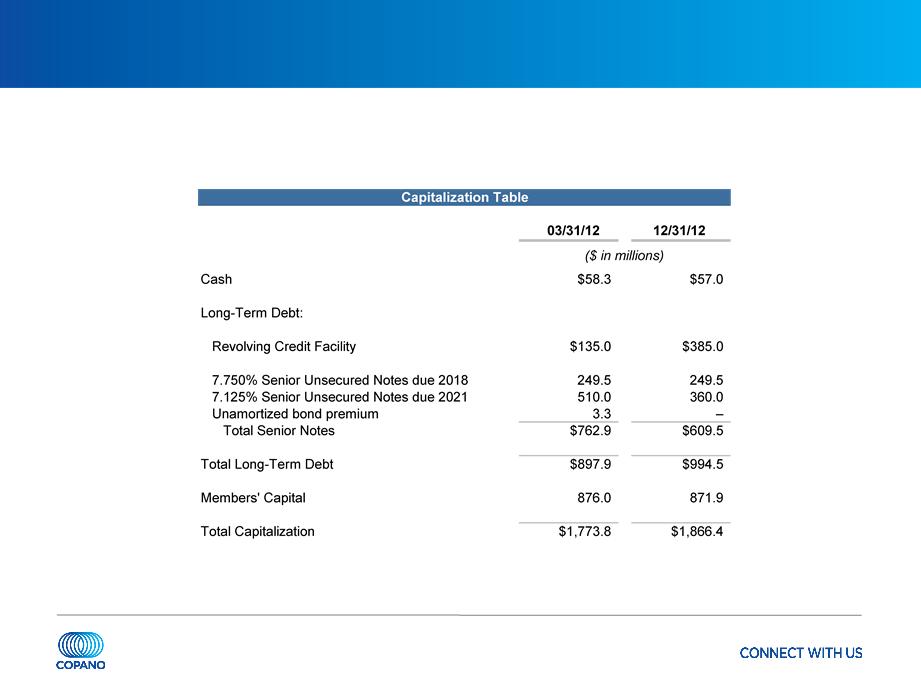
Liquidity and Capitalization
As of March 31, 2012, total available liquidity approximately $385 million
23
Shifting Contract Mix
Continued shift towards a more fee-based mix
• Eagle Ford Shale and north Barnett Shale Combo volume growth are key drivers
|
Contract Mix as a % of Gross Margin
|
|||
|
|
1Q 2010
|
4Q 2011
|
1Q 2012
|
|
Fee-based
|
27%
|
47%
|
58%
|
|
|
|
|
|
|
Percentage-of-
proceeds |
39%
|
27%
|
26%
|
|
Keep-
whole/Other |
36%
|
41%
|
22%
|
|
Net hedging
|
-2%
|
-15%
|
-6%
|
|
Net commodity
exposed |
73%
|
53%
|
42%
|
Note: Includes Copano’s share of gross margin from unconsolidated affiliates. Approximate percentages based on Copano internal financial planning models.
24
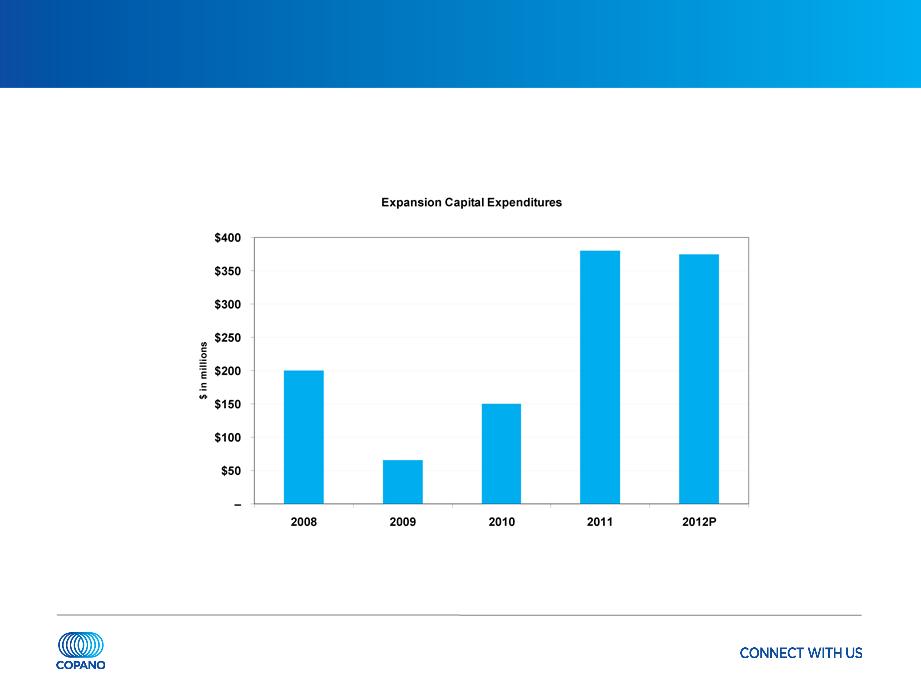
Expansion Capital Expenditures
Board approved 2012 expansion capex of approximately $375 million

25
Hedging Strategy
Continued shift towards a more fee-based contract mix
• Reliance on hedging will decrease as contract mix changes over time
2012 hedged near policy limits for all products except ethane
• Approximately 90% of propane, butane, natural gasoline and condensate exposure
hedged
hedged
• Approximately 40% of ethane exposure hedged
2013 hedging positions continue to be added
• Between 60% and 80% of butane, natural gasoline and condensate exposure hedged
• Approximately 75% of propane exposure hedged
• No ethane hedges for 2013
26
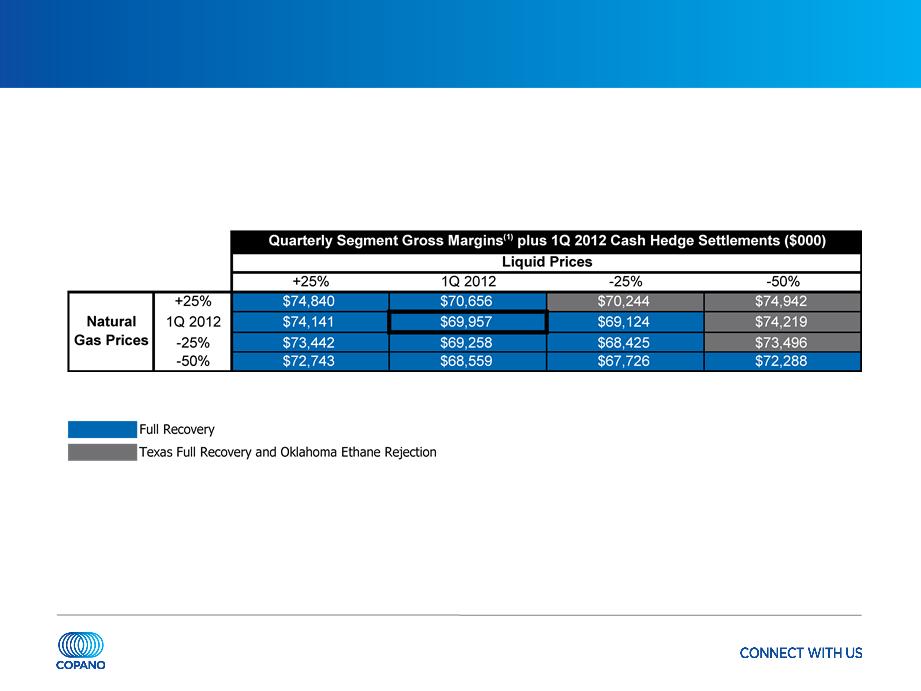
Commodity-Related Margin Sensitivities
Matrix reflects 1Q 2012 wellhead and plant inlet volumes, adjusted using
Copano’s 2012 planning model
Copano’s 2012 planning model
(1) Consists of Texas and Oklahoma Segment gross margins.
27
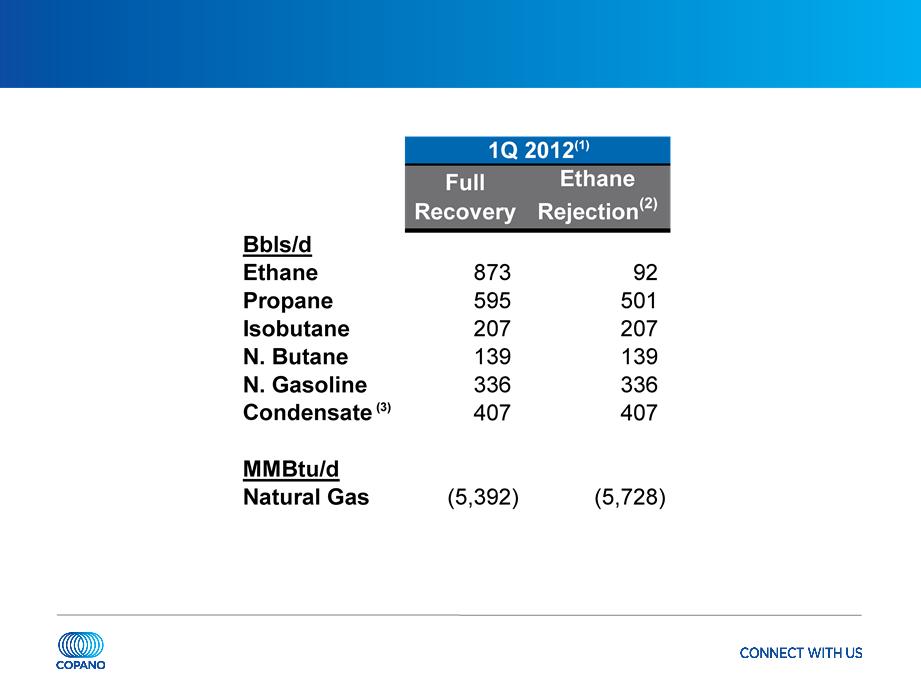
Texas Net Commodity Exposure
Note: See explanation of processing modes in this Appendix.
(1) Source: Copano Energy internal financial planning models. Based on 1Q 2012 daily wellhead/plant inlet volumes.
(2) Fractionation at Houston Central complex permits significant reductions in ethane recoveries in ethane rejection mode. To optimize profitability, plant operations can also be adjusted
to partial recovery mode.
(3) At the Houston Central complex, pentanes+ may be sold as condensate.
28
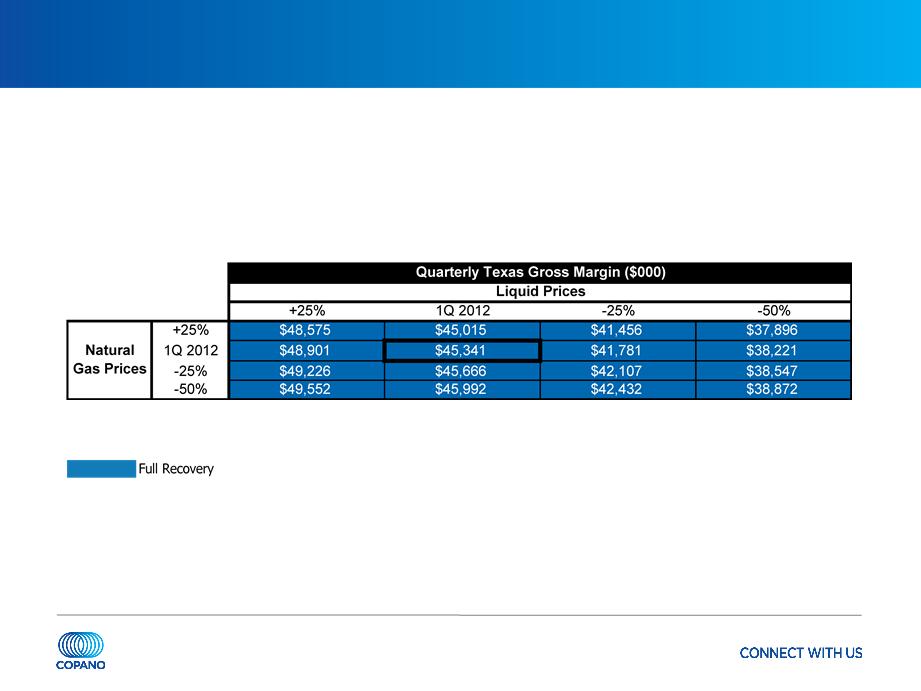
Texas Commodity Price Sensitivities
Texas segment gross margins excluding hedge settlements
• Matrix reflects 1Q 2012 volumes and operating conditions, adjusted using Copano’s
2012 planning model
2012 planning model
Note: Please see this Appendix for definitions of processing modes and additional details.
29
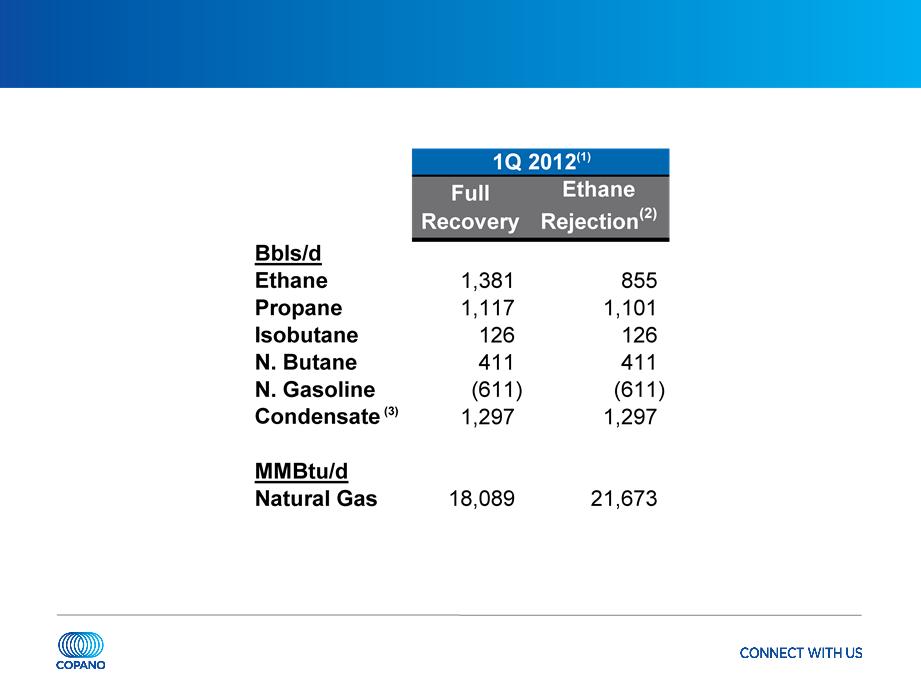
Oklahoma Net Commodity Exposure
Note: See explanation of processing modes in this Appendix. Values reflect rounding.
(1) Source: Copano Energy internal financial planning models.
(2) Ethane rejection at Paden plant is limited by nitrogen rejection facilities.
(3) Reflects impact of producer delivery point allocations, offset by field condensate collection and stabilization.
30
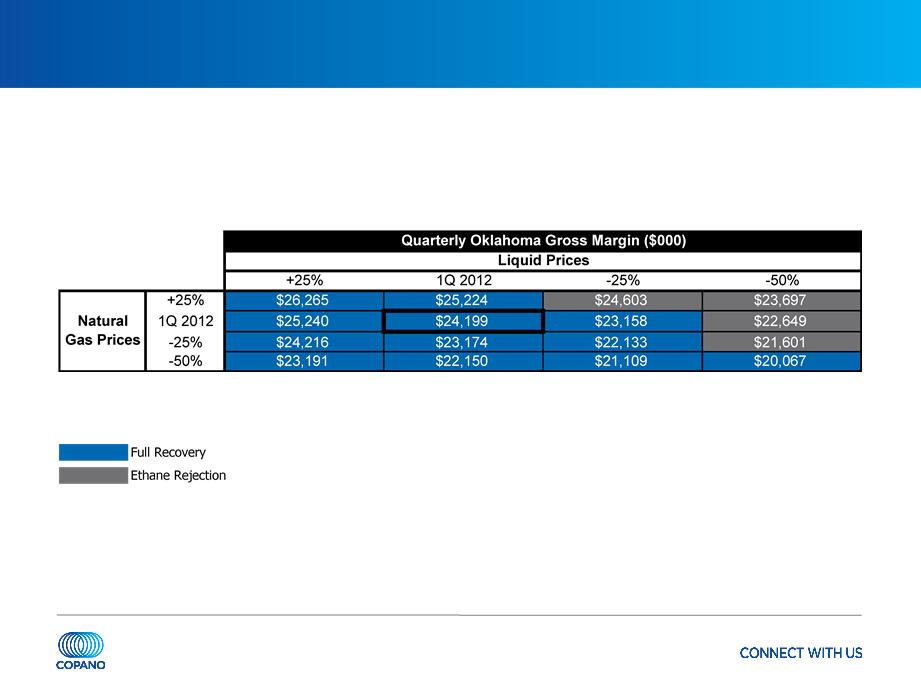
Oklahoma Commodity Price Sensitivities
Oklahoma segment gross margins excluding hedge settlements
• Matrix reflects 1Q 2012 volumes, adjusted using Copano’s 2012 planning model
Note: Please see this Appendix for definitions of processing modes and additional details.

31
Rocky Mountains Sensitivities
1Q 2012 Adjusted EBITDA volume sensitivity (positive or negative impact)
• Bighorn: 10,000 MMBtu/d = $250,000(1)
• Fort Union: 10,000 MMBtu/d = immaterial impact until physical volumes exceed long-term
contractual volume commitments
contractual volume commitments
- 1Q 2012 pipeline throughput: 658,874 MMBtu/d
- 1Q 2012 revenue based on 786,377 MMBtu/d of volume commitments
Note: See this Appendix for reconciliation of Adjusted EBITDA. Values reflect rounding.
(1) Impact on Adjusted EBITDA based on Copano’s interest in the unconsolidated affiliate.
32
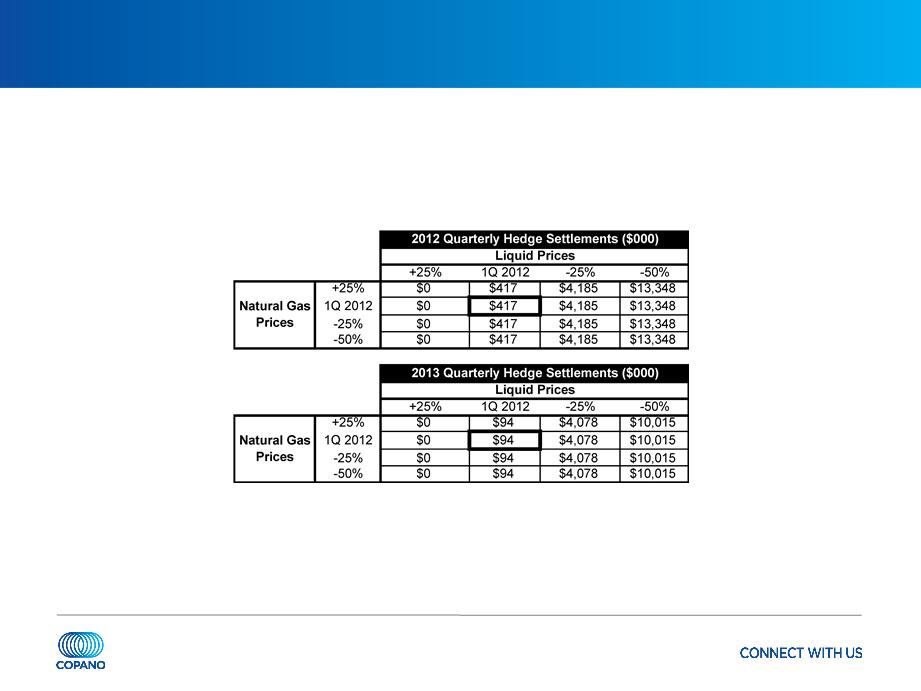
Hedging Impact of Commodity Price Sensitivities
Commodity hedging program supplements cash flow in 2012 through 2013
during less favorable commodity price periods
during less favorable commodity price periods
33
Processing Modes
|
Full Recovery
|
|
|
|
Texas and Oklahoma - If the value of
recovered NGLs exceeds the fuel and gas shrinkage costs of recovering NGLs |
|
Ethane Rejection
|
|
|
|
Texas and Oklahoma - If the value of ethane
is less than the fuel and shrinkage costs to recover ethane (in Oklahoma, ethane rejection at Paden plant is limited by nitrogen rejection facilities) |
34
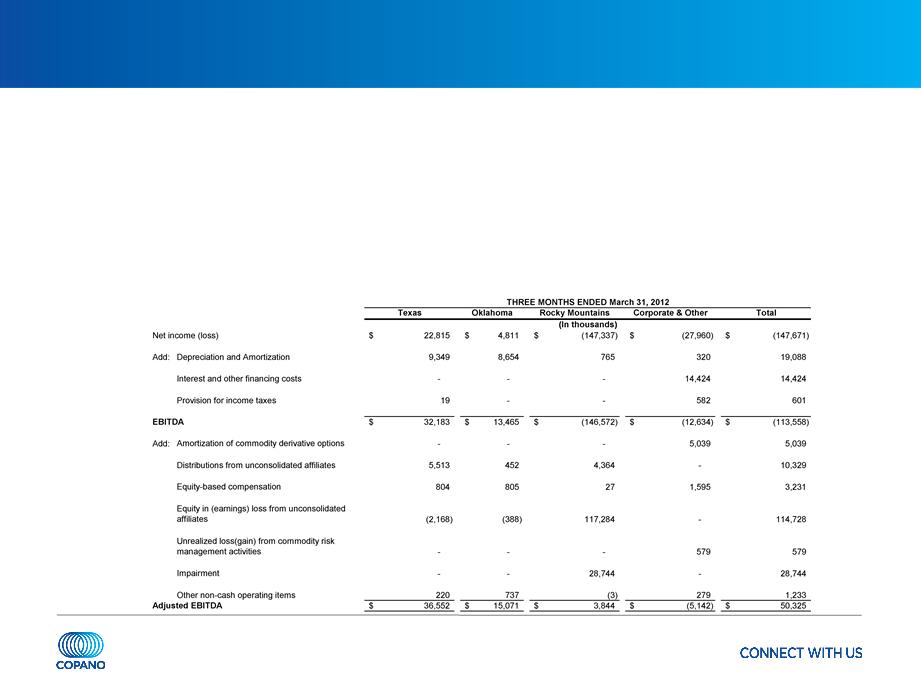
Reconciliation of Non-GAAP Financial Measures
Adjusted EBITDA
• We define adjusted EBITDA as:
- net income (loss);
- plus interest and other financing costs, provision for income taxes, depreciation, amortization and impairment expense, non-cash
amortization expense associated with our commodity derivative instruments, distributions from unconsolidated affiliates, loss on
refinancing of unsecured debt and equity-based compensation expense;
amortization expense associated with our commodity derivative instruments, distributions from unconsolidated affiliates, loss on
refinancing of unsecured debt and equity-based compensation expense;
- minus equity in earnings (loss) from unconsolidated affiliates and unrealized gains (losses) from commodity risk management
activities; and
activities; and
- plus or minus other miscellaneous non-cash amounts affecting net income (loss) for the period.
• The following table presents a reconciliation of the portion of our EBITDA and Adjusted EBITDA attributable to each of our segments to
the GAAP financial measure of net income (loss).
the GAAP financial measure of net income (loss).