Attached files
| file | filename |
|---|---|
| 8-K - FORM 8-K - JUNIATA VALLEY FINANCIAL CORP | d356480d8k.htm |
Exhibit 99.1
| Annual Shareholders Meeting 2012 |
| The presentation may contain "forward looking" information as defined by the Private Securities Litigation Reform Act of 1995. When words such as "believes", "expects", "anticipates" or similar expressions are used in this release, Juniata Valley is making forward-looking statements. Such information is based on Juniata Valley's current expectations, estimates and projections about future events and financial trends affecting the financial condition of its business. These statements are not historical facts or guarantees of future performance, events or results. Such statements involve potential risks and uncertainties and, accordingly, actual results may differ materially from this "forward looking" information. Juniata Valley undertakes no obligation to publicly update or revise forward looking information, whether as a result of new or updated information, future events, or otherwise. Many factors could affect future financial results including, without limitation, the current disruptions in the financial and credit markets, changes in interest rates and their impact on the level of deposits, loan demand and value of loan collateral, increased competition from other financial institutions, market value deterioration in the financial services sector, FDIC deposit insurance premiums, governmental monetary policy, legislation and changes in banking regulations, risks associated with the effect of opening a new branch, the ability to control costs and expenses, and general economic conditions. For a more complete discussion of certain risks and uncertainties affecting Juniata Valley, please see the sections entitled "Risk Factors" and "Management's Discussion and Analysis of Financial Condition and Results of Operations - Forward-Looking Statements" set forth in the Juniata Valley's filings with the Securities and Exchange Commission. |
| Chairman of the Board of Directors Philip E. Gingerich, Jr. |
| Building Shareholder Value In the New Banking World Chief Executive Officer Marcie Barber |
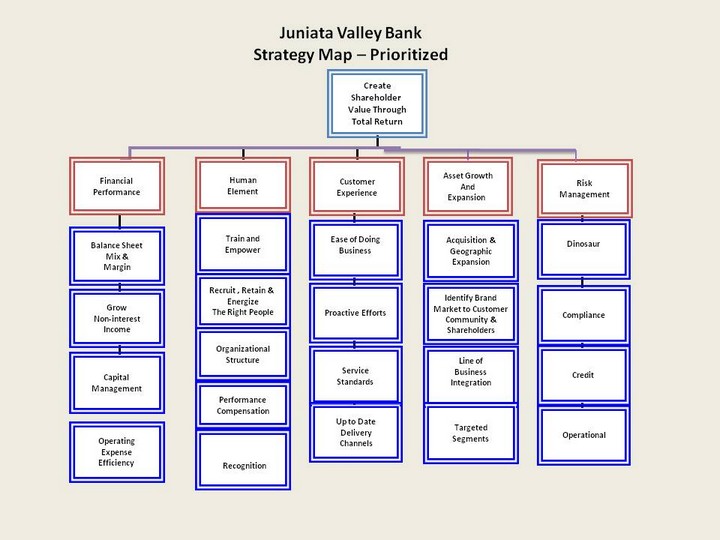
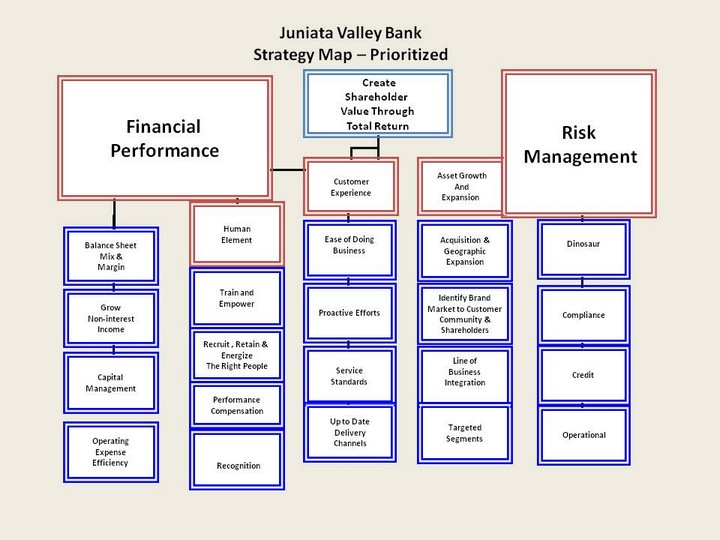
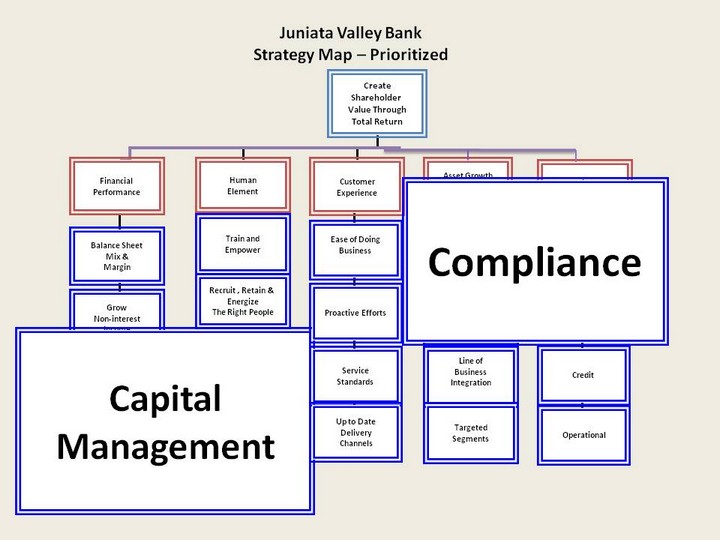
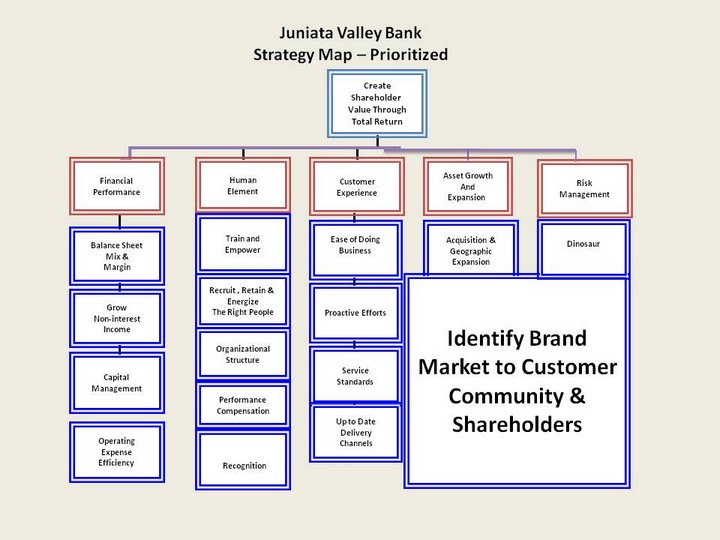
| Create Shareholder Value Through Total Return Financial Performance Human Element Asset Growth And Expansion Customer Experience Balance Sheet Mix & Margin Grow Non-interest Income Capital Management Train and Empower Recruit , Retain & Energize The Right People Organizational Structure Performance Compensation Acquisition & Geographic Expansion Identify Brand Market to Customer Community & Shareholders Line of Business Integration Targeted Segments Ease of Doing Business Proactive Efforts Service Standards Up to Date Delivery Channels Operating Expense Efficiency Juniata Valley Bank Strategy Map - Prioritized Risk Management Dinosaur Compliance Credit Operational Recognition |
| Create Shareholder Value Through Total Return ? |
| 'Shareholder Value' - The value delivered to shareholders because of management's ability to grow earnings, dividends and share price. |
| Consistency and Strength In: Financial Performance Balance Sheet Stability Asset Quality Capital Stockholder Value Chief Financial Officer JoAnn McMinn |
| Strength in Financial Performance |
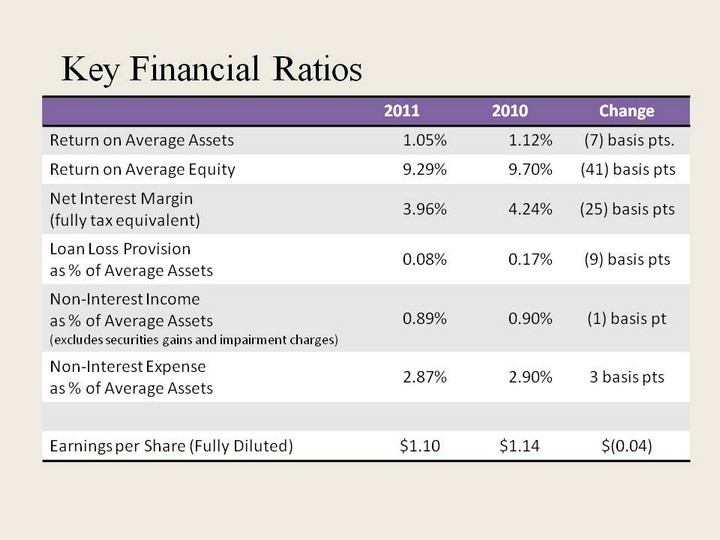
| Juniata Valley Financial Corp. 2011 2010 Change Return on Average Assets 1.05% 1.12% (7) basis pts. Return on Average Equity 9.29% 9.70% (41) basis pts Net Interest Margin (fully tax equivalent) 3.96% 4.24% (25) basis pts Loan Loss Provision as % of Average Assets 0.08% 0.17% (9) basis pts Non-Interest Income as % of Average Assets (excludes securities gains and impairment charges) 0.89% 0.90% (1) basis pt Non-Interest Expense as % of Average Assets 2.87% 2.90% 3 basis pts Earnings per Share (Fully Diluted) $1.10 $1.14 $(0.04) Key Financial Ratios |
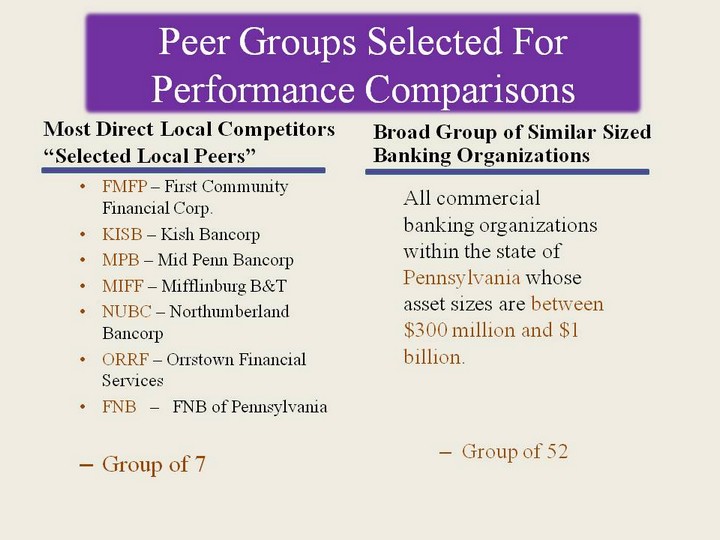
| Peer Groups Selected For Performance Comparisons Most Direct Local Competitors "Selected Local Peers" FMFP - First Community Financial Corp. KISB - Kish Bancorp MPB - Mid Penn Bancorp MIFF - Mifflinburg B&T NUBC - Northumberland Bancorp ORRF - Orrstown Financial Services FNB - FNB of Pennsylvania Group of 7 Broad Group of Similar Sized Banking Organizations All commercial banking organizations within the state of Pennsylvania whose asset sizes are between $300 million and $1 billion. Group of 52 |
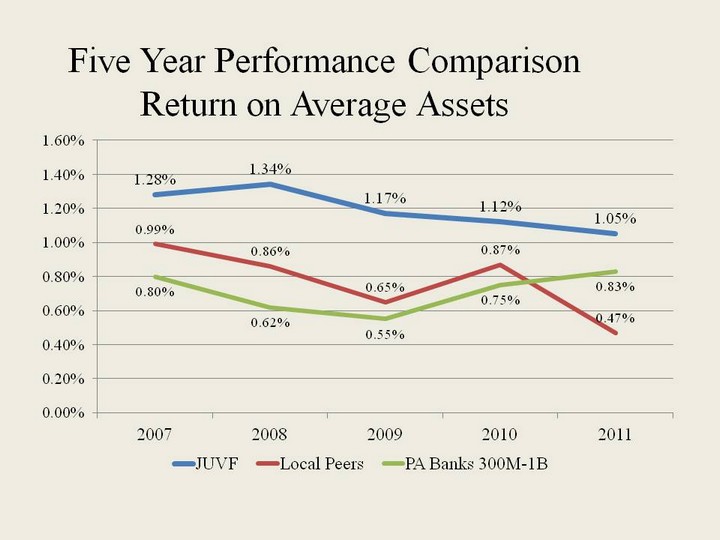
| Five Year Performance Comparison Return on Average Assets |
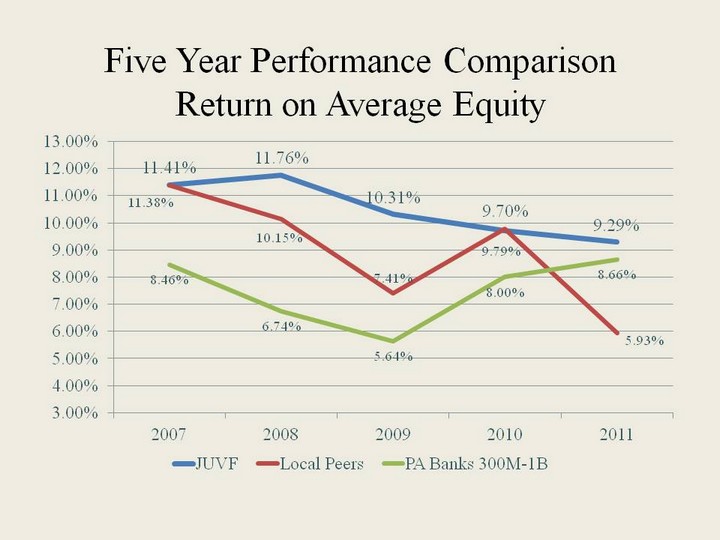
| Five Year Performance Comparison Return on Average Equity |
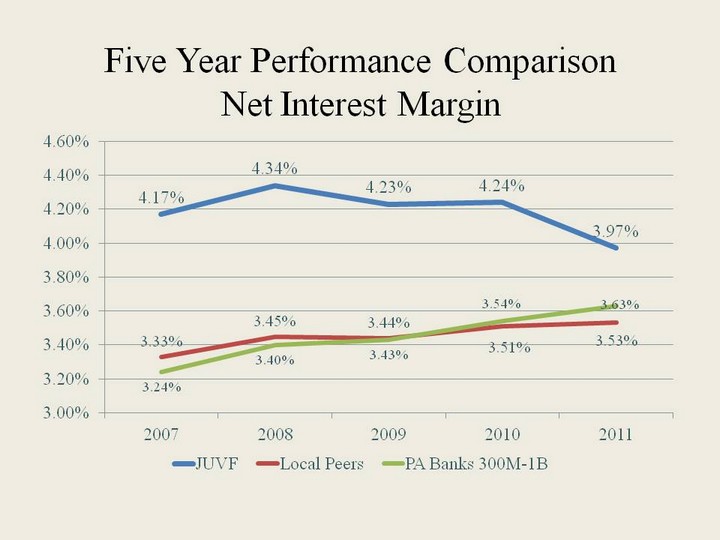
| Five Year Performance Comparison Net Interest Margin |
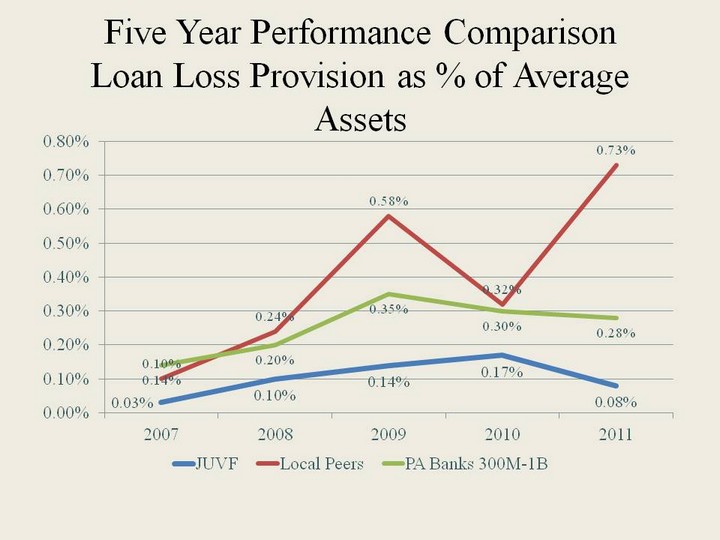
| Five Year Performance Comparison Loan Loss Provision as % of Average Assets |
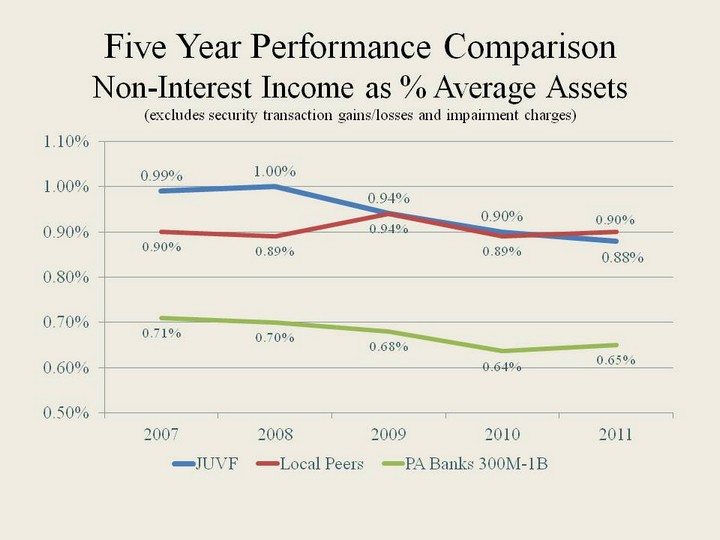
| Five Year Performance Comparison Non-Interest Income as % Average Assets (excludes security transaction gains/losses and impairment charges) |
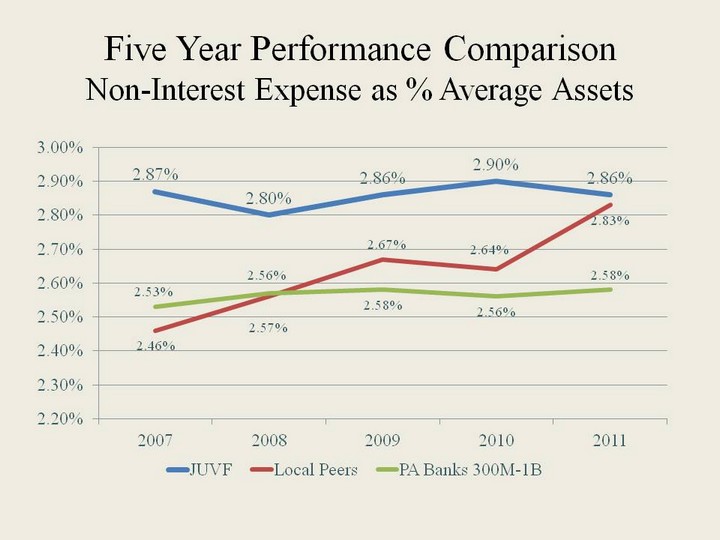
| Five Year Performance Comparison Non-Interest Expense as % Average Assets |
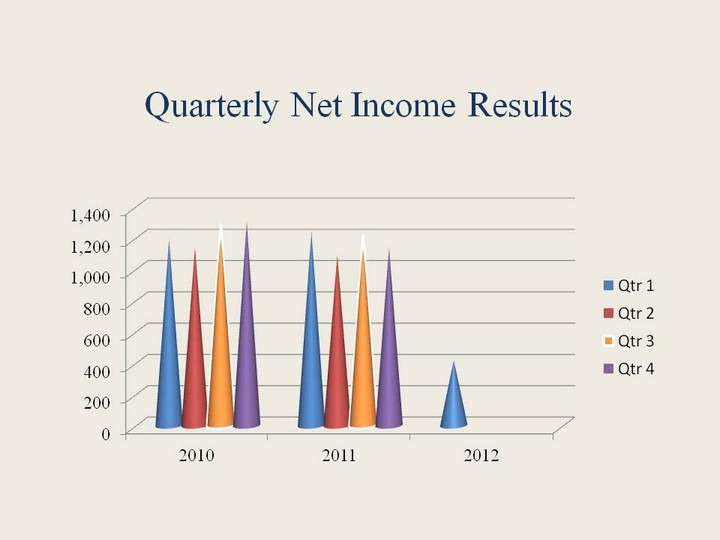
| Quarterly Net Income Results |
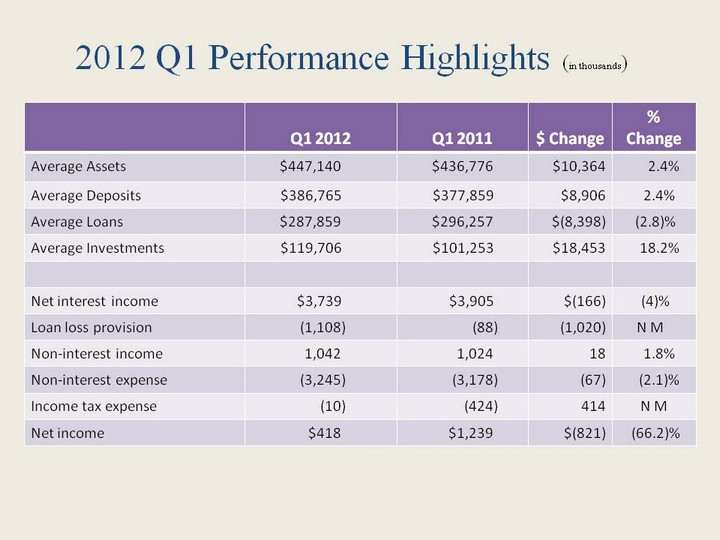
| 2012 Q1 Performance Highlights (in thousands) Q1 2012 Q1 2011 $ Change % Change Average Assets $447,140 $436,776 $10,364 2.4% Average Deposits $386,765 $377,859 $8,906 2.4% Average Loans $287,859 $296,257 $(8,398) (2.8)% Average Investments $119,706 $101,253 $18,453 18.2% Net interest income $3,739 $3,905 $(166) (4)% Loan loss provision (1,108) (88) (1,020) N M Non-interest income 1,042 1,024 18 1.8% Non-interest expense (3,245) (3,178) (67) (2.1)% Income tax expense (10) (424) 414 N M Net income $418 $1,239 $(821) (66.2)% |
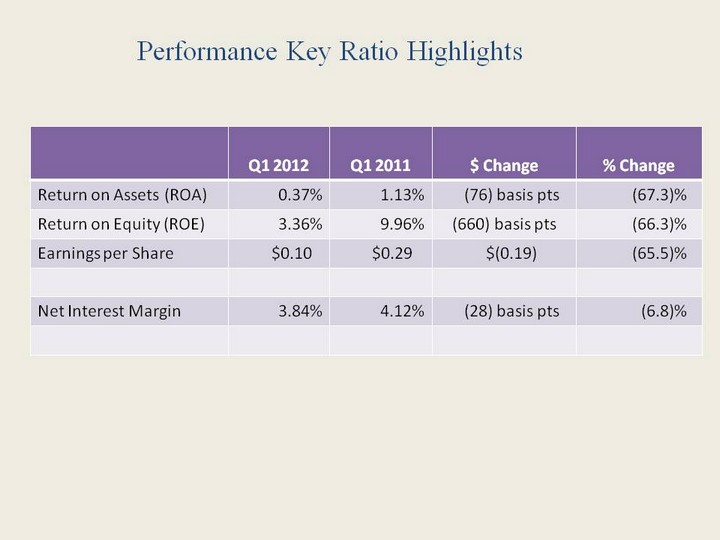
| Performance Key Ratio Highlights Q1 2012 Q1 2011 $ Change % Change Return on Assets (ROA) 0.37% 1.13% (76) basis pts (67.3)% Return on Equity (ROE) 3.36% 9.96% (660) basis pts (66.3)% Earnings per Share $0.10 $0.29 $(0.19) (65.5)% Net Interest Margin 3.84% 4.12% (28) basis pts (6.8)% |
| Press Release - April 27, 2012 "While the provision for loan losses was significantly higher than in the past, it is important to note that the increase resulted primarily from specific provisions relating to two loan relationships." |
| Press Release - April 27, 2012 "We do not believe that this adjustment to the allowance for loan losses is indicative of the condition of the credit quality of the loan portfolio as a whole." |

| Press Release - April 27, 2012 "We believe that the factors which negatively impacted earnings in the first quarter are unlikely to recur and we are optimistic about prospects for the remainder of the year and beyond." |
| Strength in: Financial Condition Asset Quality |
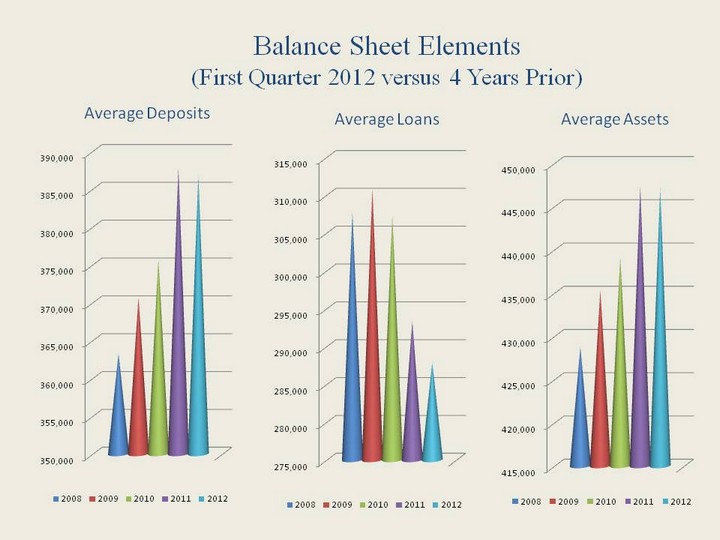
| Average Deposits Average Loans Average Assets Balance Sheet Elements (First Quarter 2012 versus 4 Years Prior) |
| Credit Quality Statistics Like most banks, Juniata Valley has been challenged with increased non-performing assets. Definition of Non-Performing Asset Loan that has been placed in non-accrual status. Loan that is accruing but is more than 90 days delinquent in scheduled payments. Performing loan that is a troubled-debt restructure. Properties owned by the Bank as a result of loan foreclosures (Other Real Estate Owned - OREO). |

| Five Year Performance Comparison Non-Performing Assets as % of Assets (includes Non-Accrual, OREO and 90 Day Delinquencies still Accruing) |
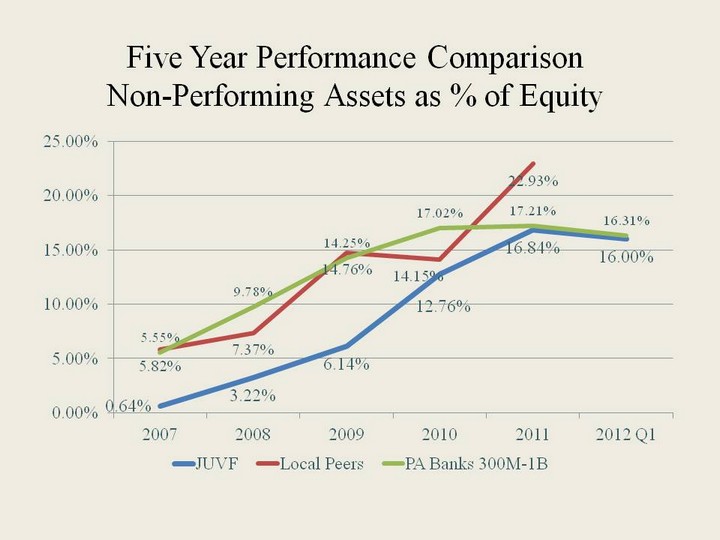
| Five Year Performance Comparison Non-Performing Assets as % of Equity |
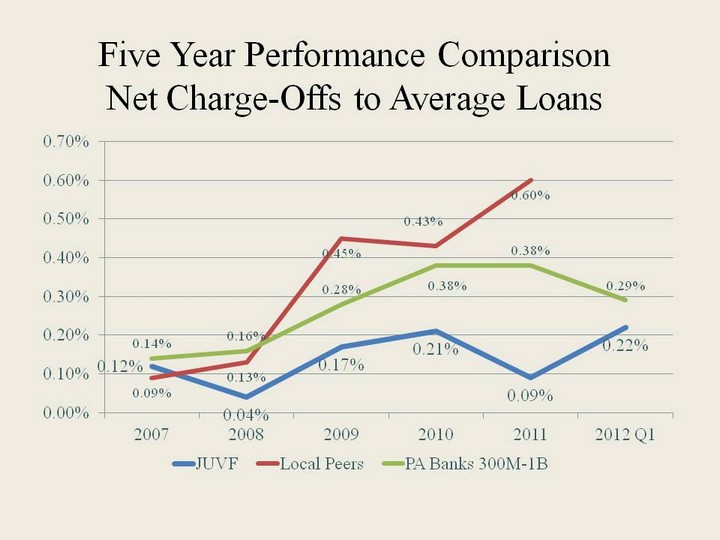
| Five Year Performance Comparison Net Charge-Offs to Average Loans |
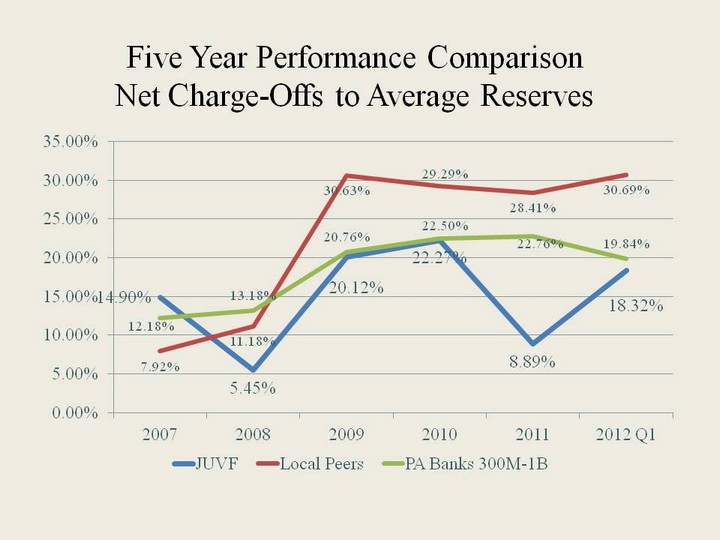
| Five Year Performance Comparison Net Charge-Offs to Average Reserves |
| Strength in Capital |

| Five Year Performance Comparison Risk Based Capital Ratio (well capitalized minimum = 10%) |
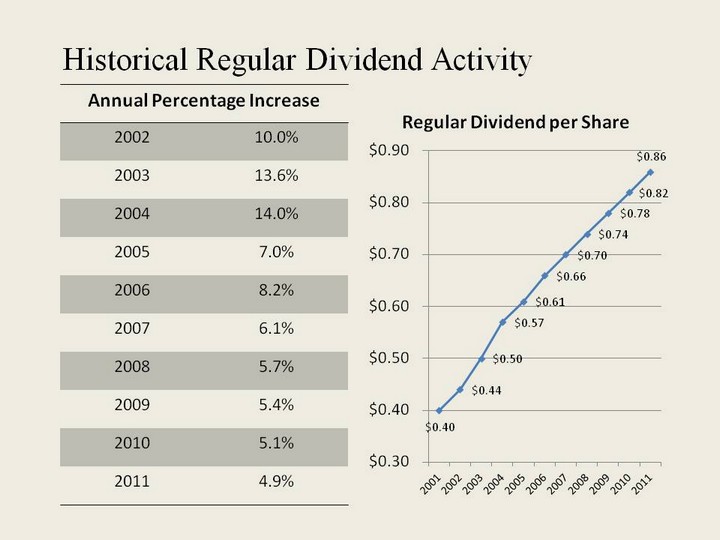
| Historical Regular Dividend Activity Annual Percentage Increase Annual Percentage Increase 2002 10.0% 2003 13.6% 2004 14.0% 2005 7.0% 2006 8.2% 2007 6.1% 2008 5.7% 2009 5.4% 2010 5.1% 2011 4.9% |
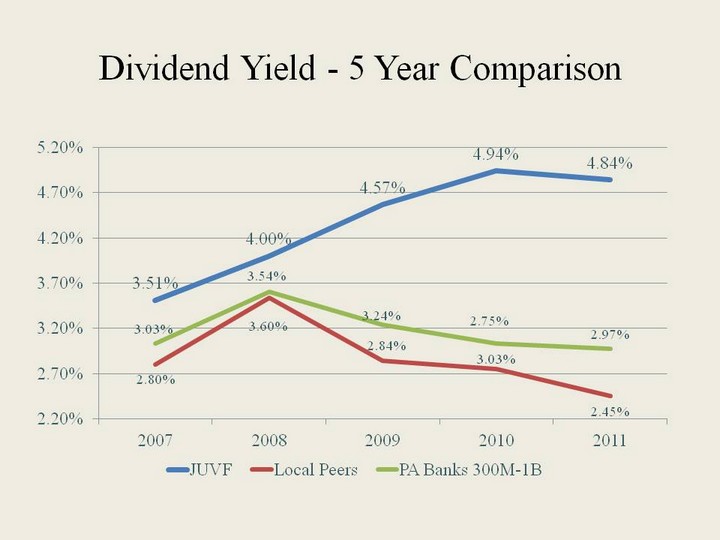
| Dividend Yield - 5 Year Comparison |
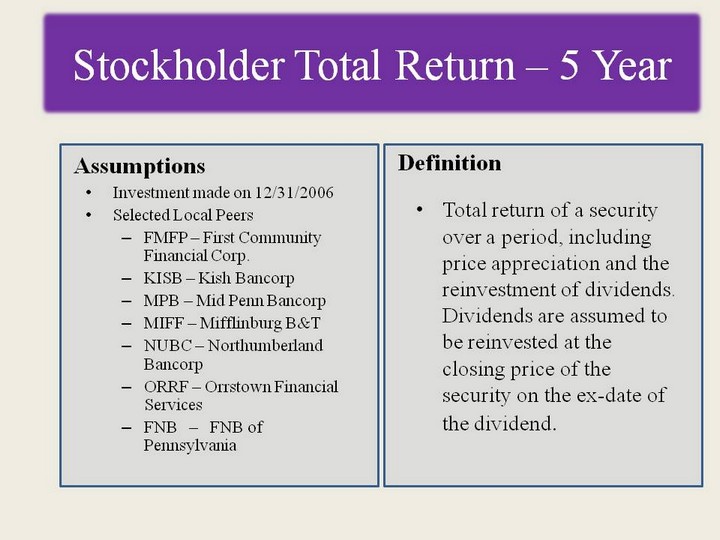
| Stockholder Total Return - 5 Year Assumptions Investment made on 12/31/2006 Selected Local Peers FMFP - First Community Financial Corp. KISB - Kish Bancorp MPB - Mid Penn Bancorp MIFF - Mifflinburg B&T NUBC - Northumberland Bancorp ORRF - Orrstown Financial Services FNB - FNB of Pennsylvania Definition Total return of a security over a period, including price appreciation and the reinvestment of dividends. Dividends are assumed to be reinvested at the closing price of the security on the ex-date of the dividend. |
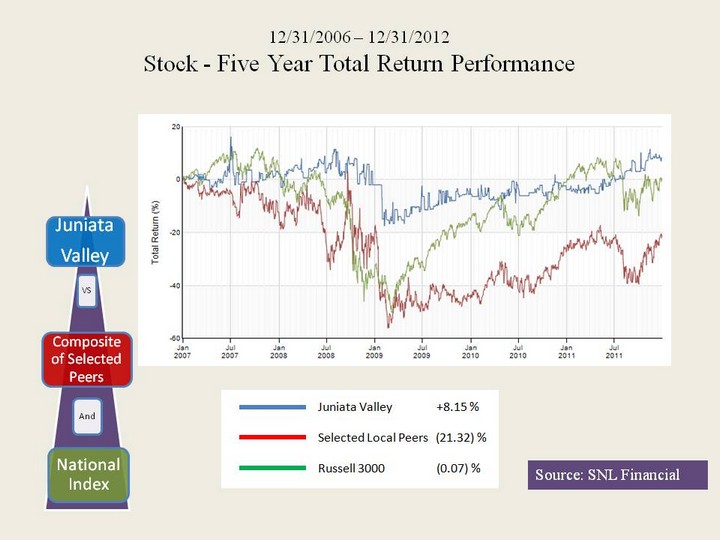
| Source: SNL Financial Source: SNL Financial 12/31/2006 - 12/31/2012 Stock - Five Year Total Return Performance |
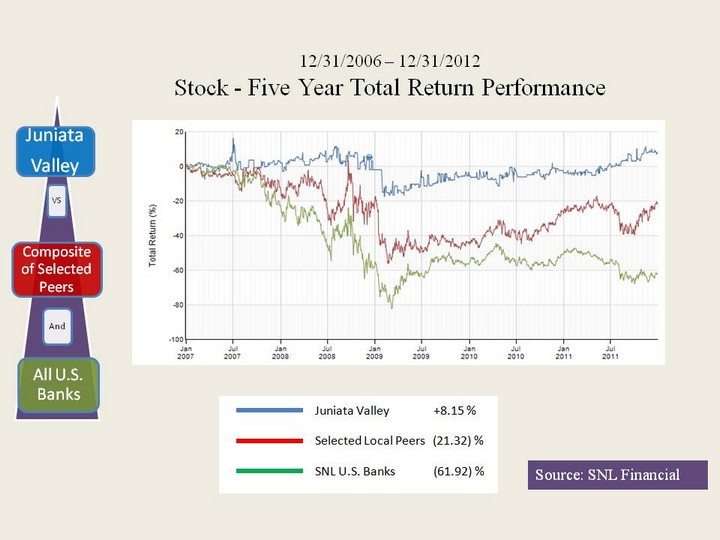
| 12/31/2006 - 12/31/2012 Stock - Five Year Total Return Performance Performance Performance Performance Source: SNL Financial |
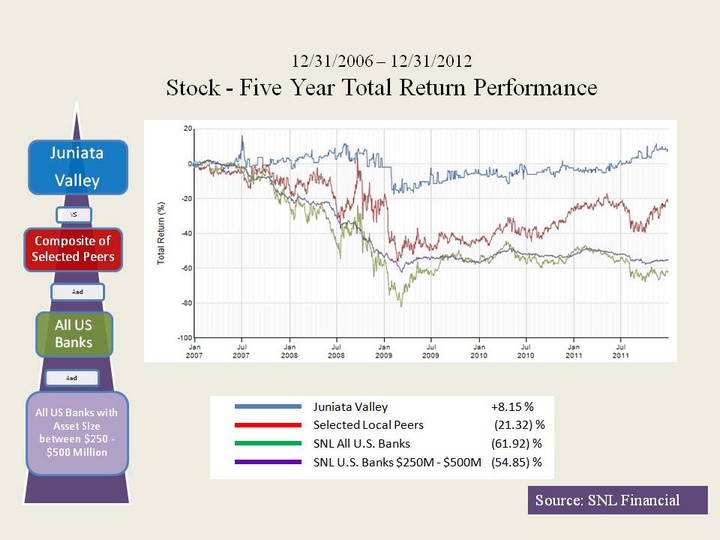
| 12/31/2006 - 12/31/2012 Stock - Five Year Total Return Performance Performance Performance Performance Source: SNL Financial |
| Banking in a New World Chief Executive Officer Marcie Barber |
| Create Shareholder Value Through Total Return Financial Performance Human Element Asset Growth And Expansion Customer Experience Balance Sheet Mix & Margin Grow Non-interest Income Capital Management Train and Empower Recruit , Retain & Energize The Right People Performance Compensation Acquisition & Geographic Expansion Identify Brand Market to Customer Community & Shareholders Line of Business Integration Targeted Segments Ease of Doing Business Proactive Efforts Service Standards Up to Date Delivery Channels Operating Expense Efficiency Juniata Valley Bank Strategy Map - Prioritized Risk Management Dinosaur Compliance Credit Operational Recognition |

| Higher Non- Performing Loans Lower Loans/Mix of Earning Assets. Non-Interest Income Challenges Regulatory controls Economy related Money Money Money Money ^ Non Interest Expenses Financial Performance |
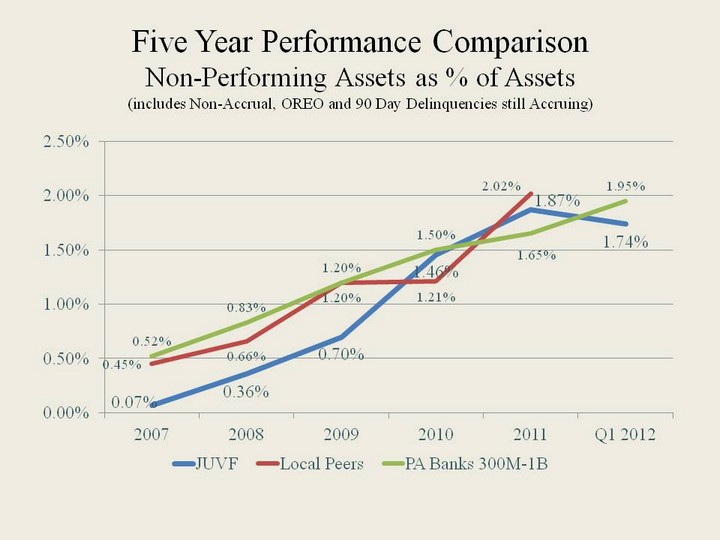
| Five Year Performance Comparison Non-Performing Assets as % of Assets (includes Non-Accrual, OREO and 90 Day Delinquencies still Accruing) |
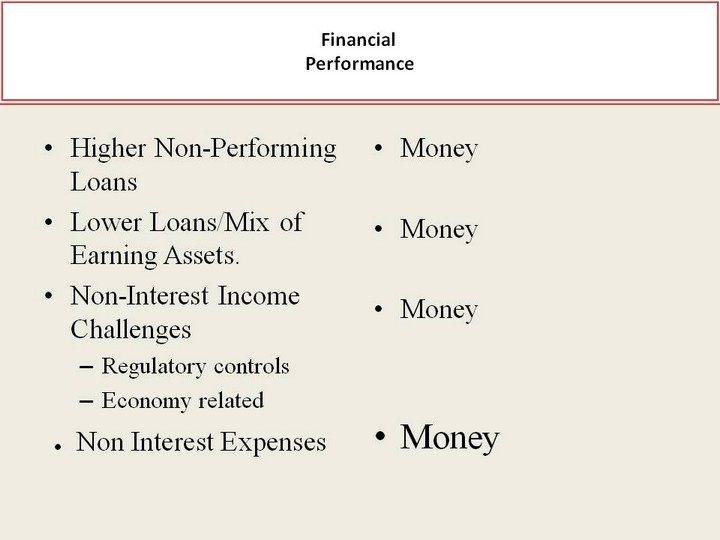
| Higher Non- Performing Loans Lower Loans/Mix of Earning Assets. Non-Interest Income Challenges Regulatory controls Economy related Money Money Money Money ^ Non Interest Expenses Financial Performance |
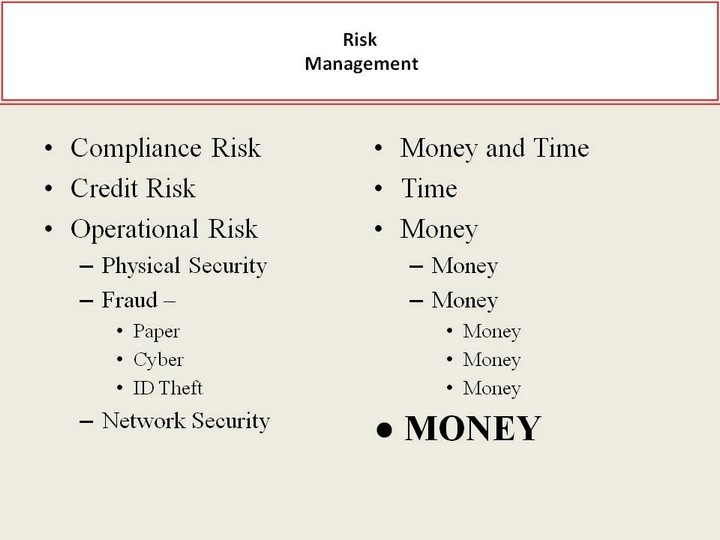
| Compliance Risk Credit Risk Operational Risk Physical Security Fraud - Paper Cyber ID Theft Network Security Money and Time Time Money Money Money Money Money Money ^ MONEY Risk Management |
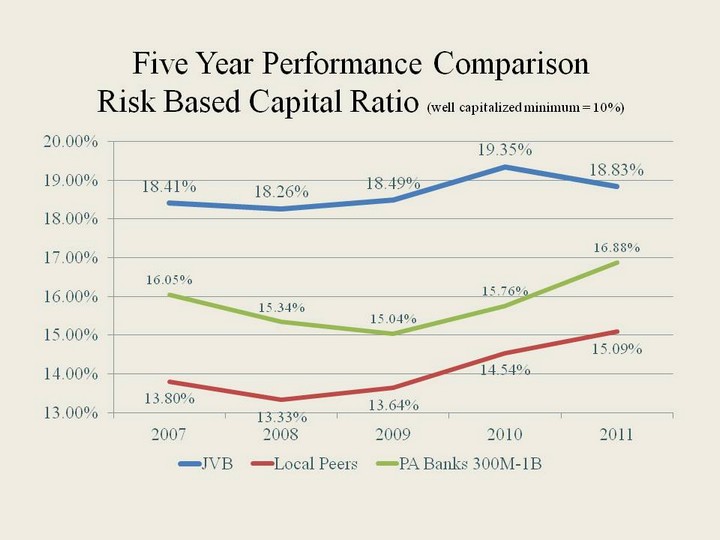
| Five Year Performance Comparison Risk Based Capital Ratio (well capitalized minimum = 10%) |
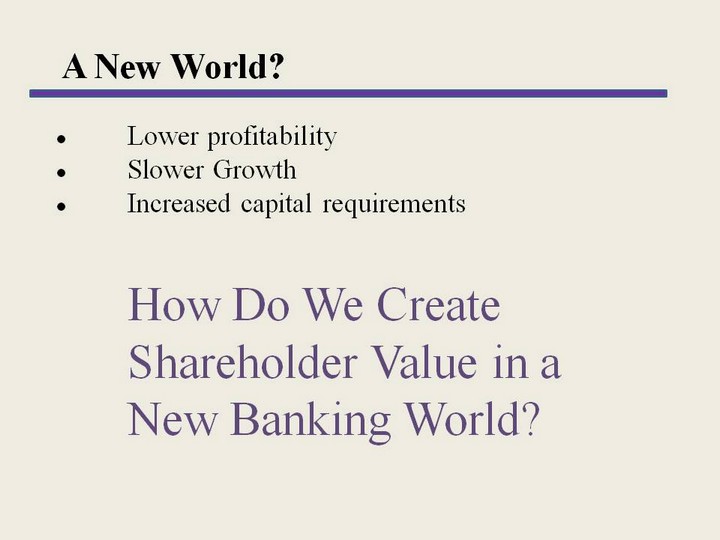
| A New World? How Do We Create Shareholder Value in a New Banking World? ^ Lower profitability ^ Slower Growth ^ Increased capital requirements |
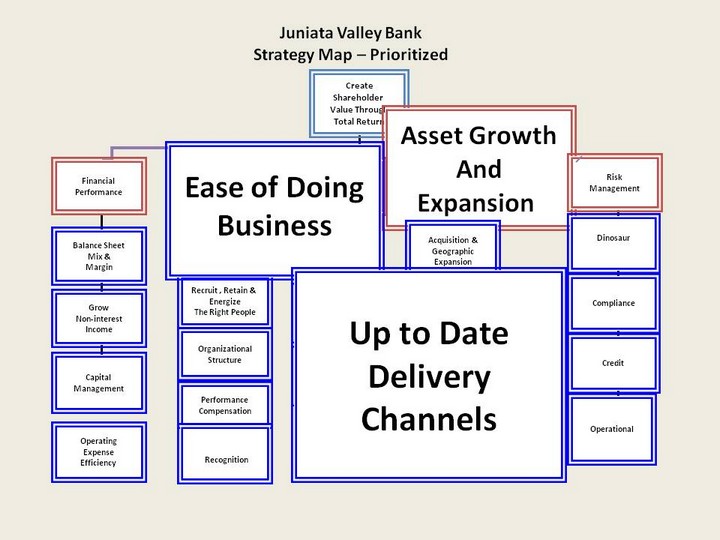
| Create Shareholder Value Through Total Return Financial Performance Human Element Asset Growth And Expansion Customer Experience Balance Sheet Mix & Margin Grow Non-interest Income Capital Management Train and Empower Recruit , Retain & Energize The Right People Organizational Structure Performance Compensation Acquisition & Geographic Expansion Identify Brand Market to Customer Community & Shareholders Line of Business Integration Targeted Segments Ease of Doing Business Proactive Efforts Service Standards Up to Date Delivery Channels Operating Expense Efficiency Juniata Valley Bank Strategy Map - Prioritized Risk Management Dinosaur Compliance Credit Operational Recognition |

| Mobile Banking Remote Deposit Capture Internet Banking Loans On Line On Line Statements POP Money Funds Transfer Up to Date Delivery Channels |
| Create Shareholder Value Through Total Return Financial Performance Human Element Asset Growth And Expansion Customer Experience Balance Sheet Mix & Margin Grow Non-interest Income Capital Management Train and Empower Recruit , Retain & Energize The Right People Acquisition & Geographic Expansion Identify Brand Market to Customer Community & Shareholders Line of Business Integration Targeted Segments Ease of Doing Business Proactive Efforts Service Standards Up to Date Delivery Channels Juniata Valley Bank Strategy Map - Prioritized Risk Management Dinosaur Compliance Credit Operational |
| Create Shareholder Value Through Total Return Financial Performance Human Element Asset Growth And Expansion Customer Experience Balance Sheet Mix & Margin Grow Non-interest Income Capital Management Train and Empower Recruit , Retain & Energize The Right People Organizational Structure Performance Compensation Acquisition & Geographic Expansion Identify Brand Market to Customer Community & Shareholders Ease of Doing Business Proactive Efforts Service Standards Up to Date Delivery Channels Operating Expense Efficiency Juniata Valley Bank Strategy Map - Prioritized Risk Management Dinosaur Recognition |
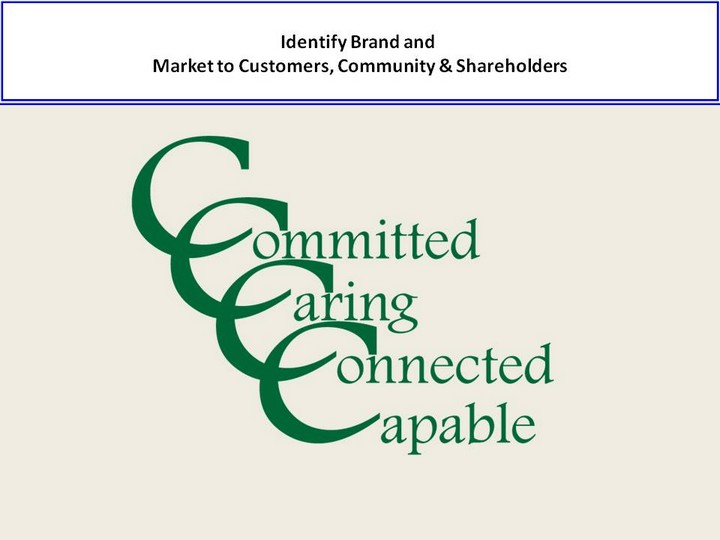
| Identify Brand and Market to Customers, Community & Shareholders |

| Mann Edge Terrace Connected....... Committed and... |


| Create Shareholder Value Through Total Return Financial Performance Human Element Asset Growth And Expansion Customer Experience Balance Sheet Mix & Margin Grow Non-interest Income Capital Management Train and Empower Recruit , Retain & Energize The Right People Performance Compensation Acquisition & Geographic Expansion Identify Brand Market to Customer Community & Shareholders Line of Business Integration Targeted Segments Ease of Doing Business Proactive Efforts Service Standards Up to Date Delivery Channels Operating Expense Efficiency Juniata Valley Bank Strategy Map - Prioritized Risk Management Dinosaur Compliance Credit Operational Recognition |
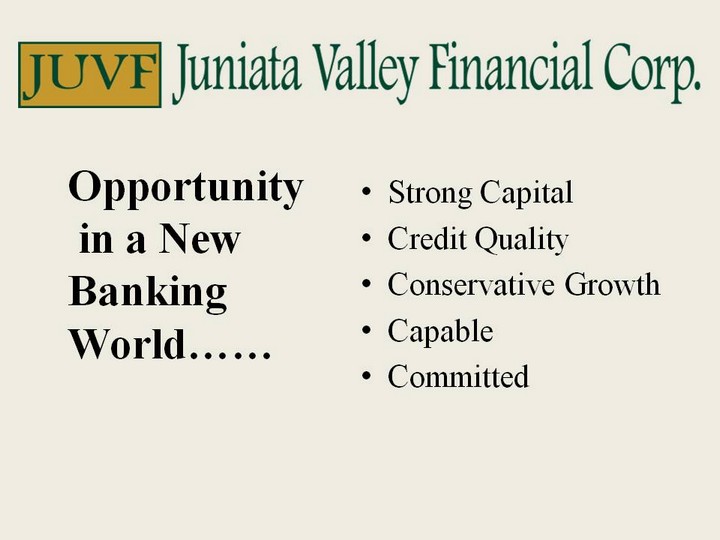
| Opportunit y in a New Banking World...... Strong Capital Credit Quality Conservative Growth Capable Committed |