Attached files
| file | filename |
|---|---|
| 8-K - FORM 8-K - PEABODY ENERGY CORP | btu8k20120517.htm |
Exhibit 99.1

Energizing The World One BTU At A Time
Bank of America - Merrill Lynch Global Metals and Mining Conference
Gregory H. Boyce Chairman and Chief Executive Officer
May 17, 2012
Peabody Energy
Statement on Forward-Looking Information
Peabody Energy
Some of the following information contains forward-looking statements within the meaning of Section 27A of the Securities Act of 1933 and Section 21E of the Securities Exchange Act of 1934, as amended, and is intended to come within the safe-harbor protection provided by those sections. Our forward-looking statements are based on numerous assumptions that the company believes are reasonable, but they are open to a wide range of uncertainties and business risks that may cause actual results to differ materially from expectations as of April 19, 2012. These factors are difficult to accurately predict and may be beyond the company's control. The company does not undertake to update its forward-looking statements. Factors that could affect the company's results include, but are not limited to: global demand for coal, including the seaborne thermal and metallurgical coal markets; price volatility, particularly in higher-margin products and in our trading and brokerage businesses; impact of alternative energy sources, including natural gas and renewables; impact of weather and natural disasters on demand, production and transportation; reductions and/or deferrals of purchases by major customers and ability to renew sales contracts; credit and performance risks associated with customers, suppliers, contract miners, co-shippers, and trading, banks and other financial counterparties; geologic, equipment, permitting and operational risks related to mining; transportation availability, performance and costs; availability, timing of delivery and costs of key supplies, capital equipment or commodities such as diesel fuel, steel, explosives and tires; integration of the newly acquired Macarthur Coal operations; successful implementation of business strategies; negotiation of labor contracts, employee relations and workforce availability; changes in postretirement benefit and pension obligations and funding requirements; replacement and development of coal reserves; availability, access to and related cost of capital and financial markets; effects of changes in interest rates and currency exchange rates (primarily the Australian dollar); effects of acquisitions or divestitures; economic strength and political stability of countries in which we have operations or serve customers; legislation, regulations and court decisions or other government actions, including new environmental and mine safety requirements; changes in income tax regulations or other regulatory taxes; litigation, including claims not yet asserted; and other risks detailed in the company's reports filed with the Securities and Exchange Commission (SEC). The use of “Peabody,” “the company,” and “our” relate to Peabody, its subsidiaries and majority-owned affiliates.
Adjusted EBITDA is defined as income from continuing operations before deducting net interest expense, income taxes, asset retirement obligation expense, depreciation, depletion and amortization, and amortization of basis difference associated with equity method investments. Adjusted EBITDA, which is not calculated identically by all companies, is not a substitute for operating income, net income or cash flow as determined in accordance with United States generally accepted accounting principles. Management uses Adjusted EBITDA as a key measure of operating performance and also believes it is a useful indicator of the company's ability to meet debt service and capital expenditure requirements.
Adjusted Income from Continuing Operations and Adjusted EPS are defined as income from continuing operations and diluted earnings per share excluding the impact of the remeasurement of foreign income tax accounts. Management has included these measures because, in management's opinion, excluding such impact is a better indicator of the company's ongoing effective tax rate and diluted earnings per share, and is therefore more useful in comparing the company's results with prior and future periods.
5/17/12
2
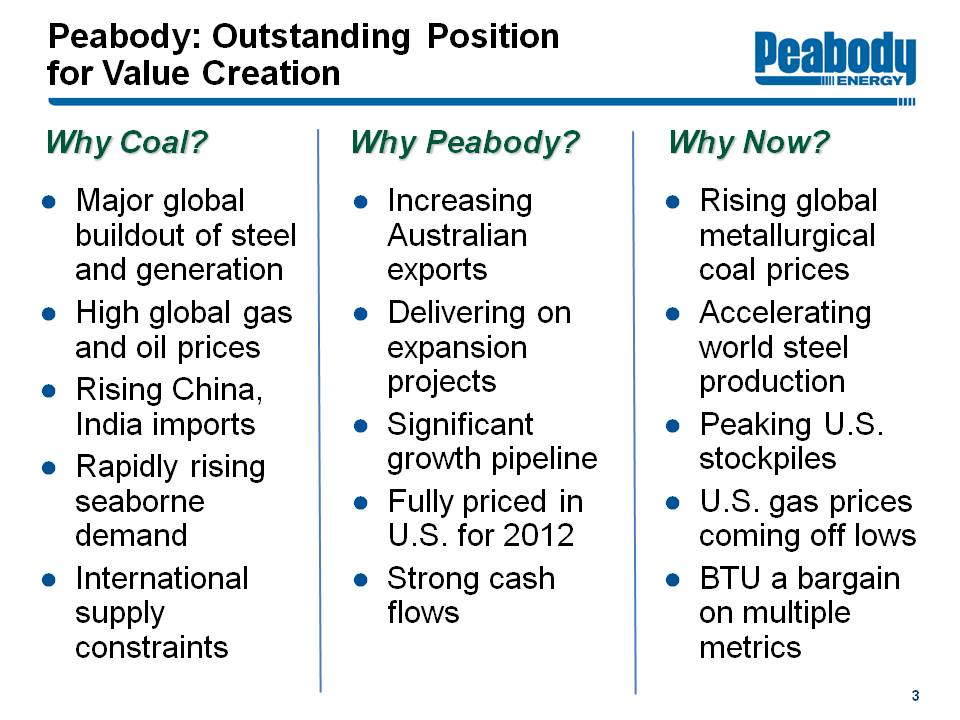
Peabody: Outstanding Position for Value Creation
Peabody Energy
Why Coal?
Major global buildout of steel and generation
High global gas and oil prices
Rising China, India imports
Rapidly rising seaborne demand
International supply constraints
Why Peabody?
Increasing Australian exports
Delivering on expansion projects
Significant growth pipeline
Fully priced in U.S. for 2012
Strong cash flows
Why Now?
Rising global metallurgical coal prices
Accelerating world steel production
Peaking U.S. stockpiles
U.S. gas prices coming off lows
BTU a bargain on multiple metrics
3
The Global Coal Supercycle is Alive and Well
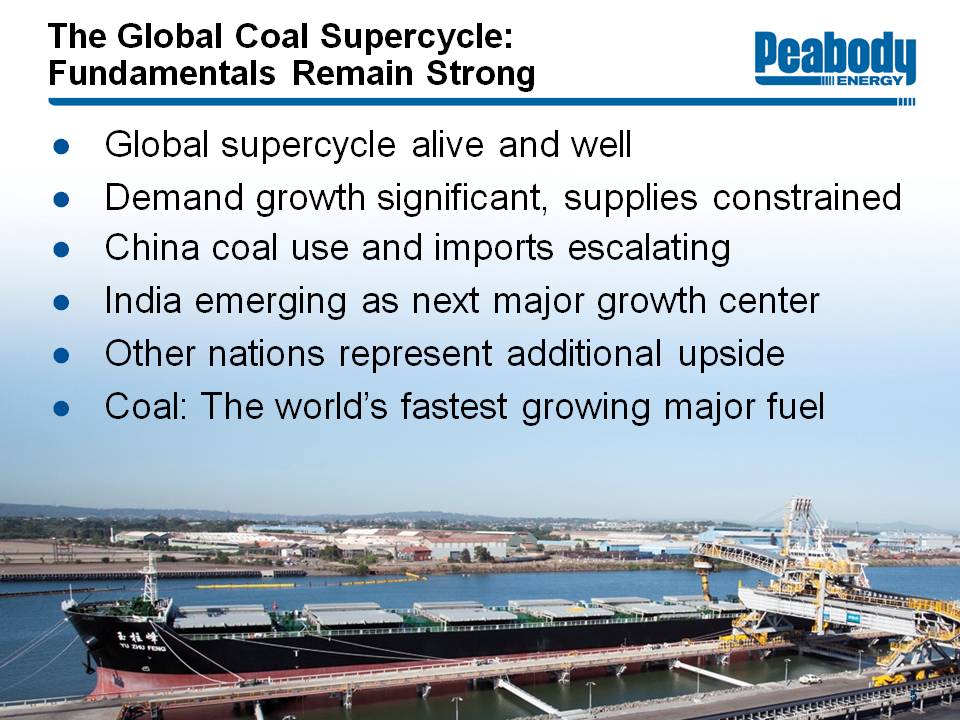
The Global Coal Supercycle: Fundamentals Remain Strong
Peabody Energy
Global supercycle alive and well
Demand growth significant, supplies constrained
China coal use and imports escalating
India emerging as next major growth center
Other nations represent additional upside
Coal: The world's fastest growing major fuel
5
Recent Data Supports Coal Supercycle Thesis for Both Met and Thermal Coal
Peabody Energy
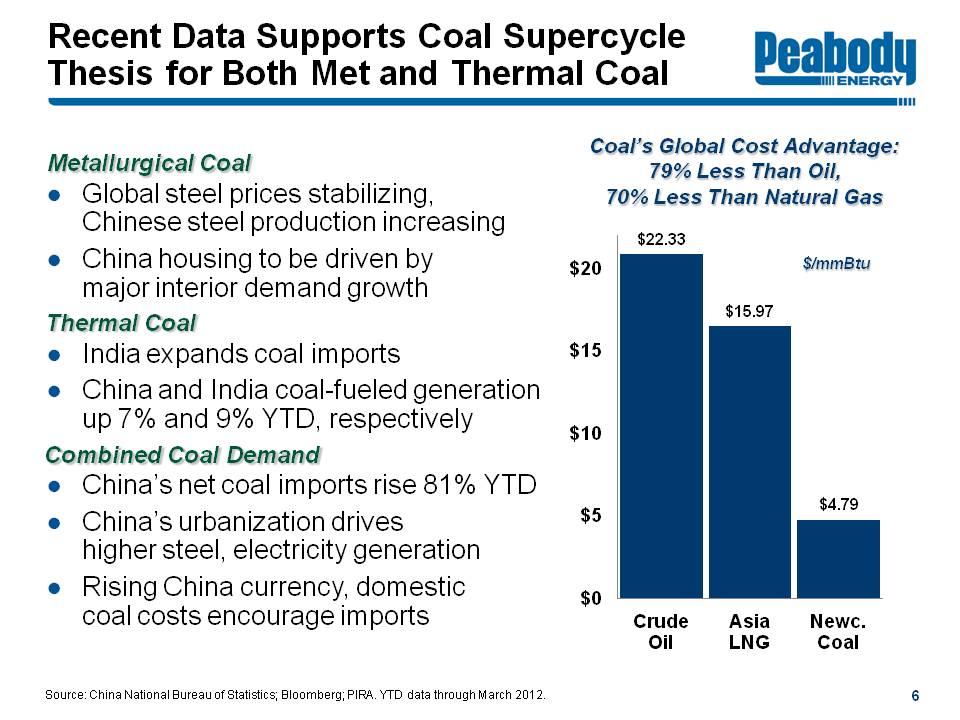
Metallurgical Coal
Global steel prices stabilizing, Chinese steel production increasing
China housing to be driven by major interior demand growth
Thermal Coal
India expands coal imports
China and India coal-fueled generation up 7% and 9% YTD, respectively
Combined Coal Demand
China's net coal imports rise 81% YTD
China's urbanization drives higher steel, electricity generation
Rising China currency, domestic coal costs encourage imports
Coal's Global Cost Advantage: 79% Less Than Oil, 70% Less Than Natural Gas
Crude Oil $22.33
Asia LNG $15.97
Newc. Coal $4.79
$/mmBtu
Source: China National Bureau of Statistics; Bloomberg; PIRA. YTD data through March 2012.
6
Major Markets: Build Out of Coal Generation Drives Thermal Coal Growth
Peabody Energy
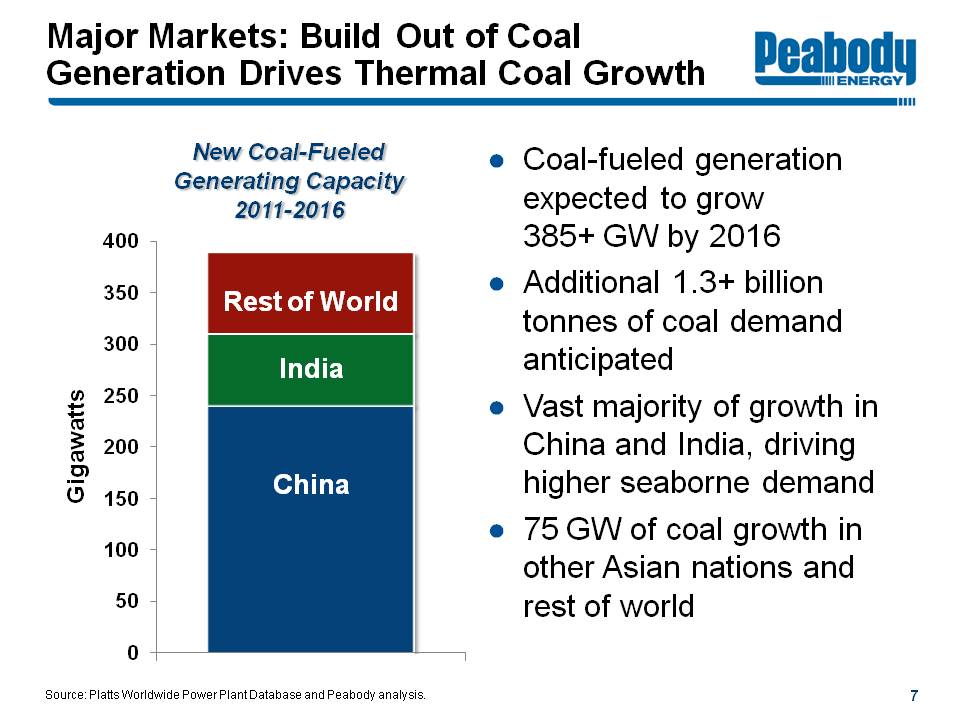
New Coal-Fueled Generating Capacity 2011-2016
Gigawatts
Rest of World
India
China
Coal-fueled generation expected to grow 385+ GW by 2016
Additional 1.3+ billion tonnes of coal demand anticipated
Vast majority of growth in China and India, driving higher seaborne demand
75 GW of coal growth in other Asian nations and rest of world
Source: Platts Worldwide Power Plant Database and Peabody analysis.
7
Major Markets: Steel Production Growth Drives Ongoing Met Coal Increases
Peabody Energy
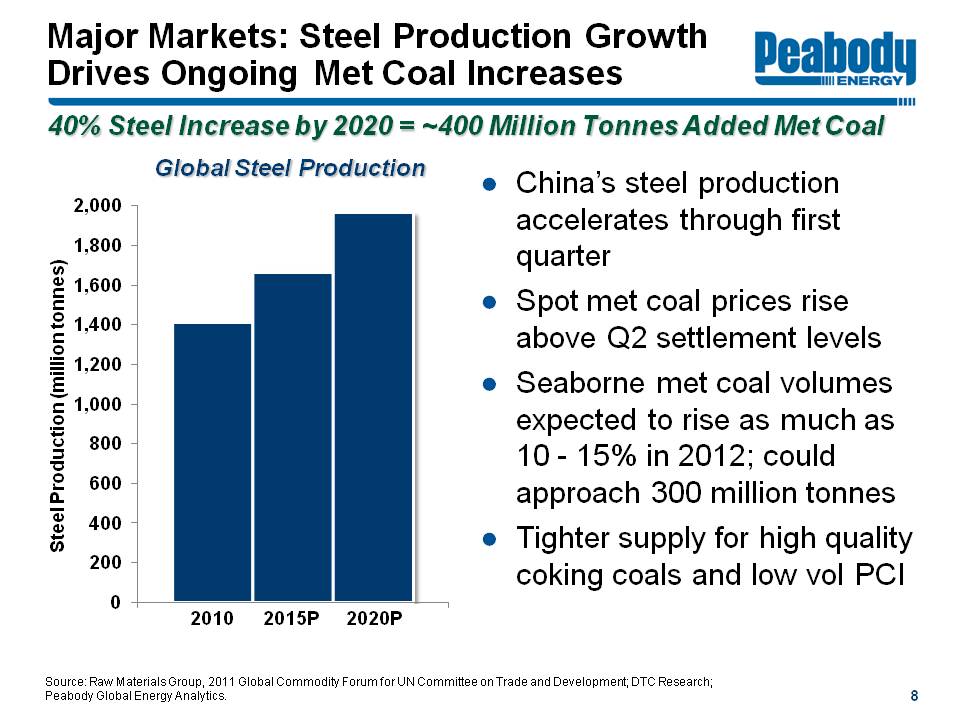
40% Steel Increase by 2020 = ~400 Million Tonnes Added Met Coal
Global Steel Production
Steel Production (million tonnes)
2010 2015P 2020P
China's steel production accelerates through first quarter
Spot met coal prices rise above Q2 settlement levels
Seaborne met coal volumes expected to rise as much as 10 - 15% in 2012; could approach 300 million tonnes
Tighter supply for high quality coking coals and low vol PCI
Source: Raw Materials Group, 2011 Global Commodity Forum for UN Committee on Trade and Development; DTC Research; Peabody Global Energy Analytics.
8
China, India and Brazil Have Large Upside to Steel Intensity Potential
Peabody Energy
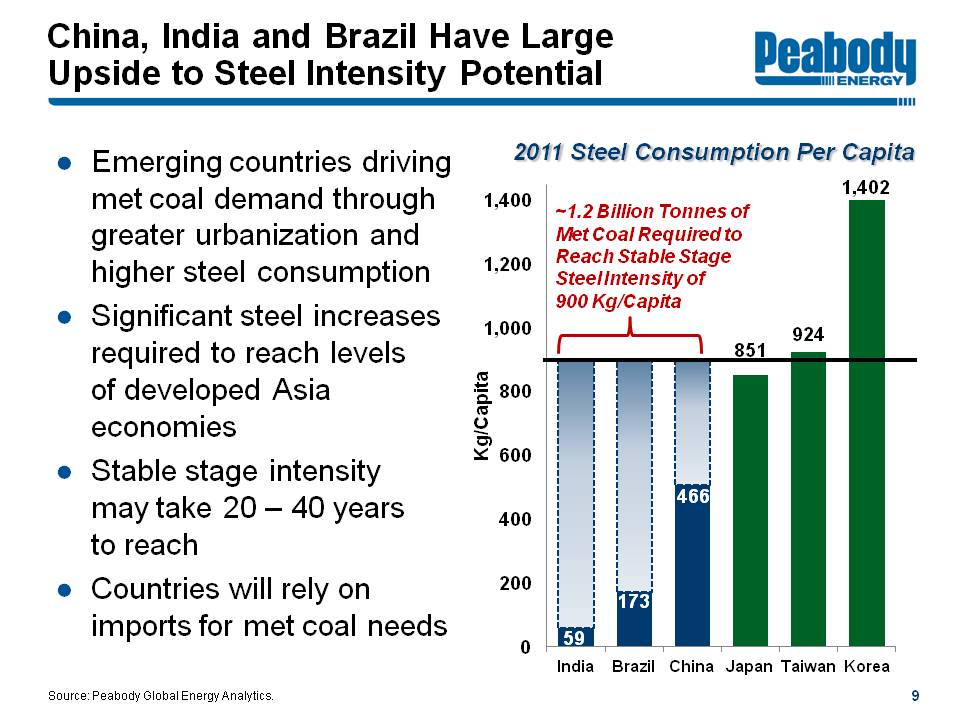
Emerging countries driving met coal demand through greater urbanization and higher steel consumption
Significant steel increases required to reach levels of developed Asia economies
Stable stage intensity may take 20 - 40 years to reach
Countries will rely on imports for met coal needs
2011 Steel Consumption Per Capita
~1.2 Billion Tonnes of Met Coal Required to Reach Stable Stage Steel Intensity of 900 Kg/Capita
Kg/Capita
India 59
Brazil 173
China 466
Japan 851
Taiwan 924
Korea 1,402
Source: Peabody Global Energy Analytics.
9
China's Urbanization Rising Yet Still Far Below Other Developed Countries
Peabody Energy
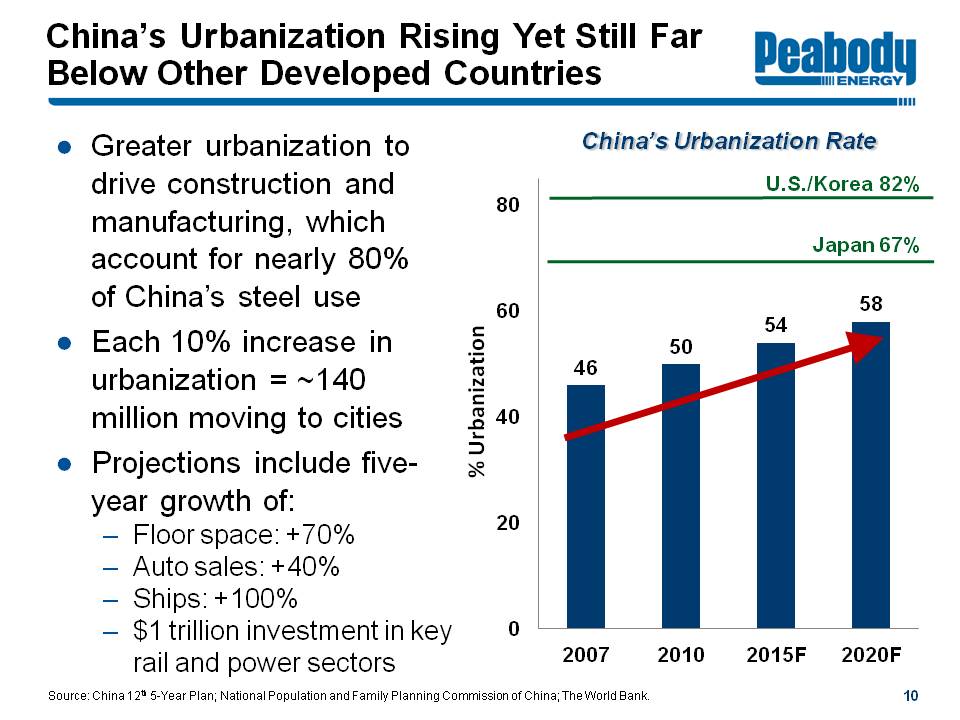
Greater urbanization to drive construction and manufacturing, which account for nearly 80% of China's steel use
Each 10% increase in urbanization = ~140 million moving to cities
Projections include five-year growth of:
Floor space: +70%
Auto sales: +40%
Ships: +100%
$1 trillion investment in key rail and power sectors
China's Urbanization Rate
% Urbanization
U.S./Korea 82%
Japan 67%
2007 46%
2010 50%
2015F 54%
2020F 58%
Source: China 12th 5-Year Plan; National Population and Family Planning Commission of China; The World Bank.
10
China Coal Use Consistently Exceeds National Targets
Peabody Energy
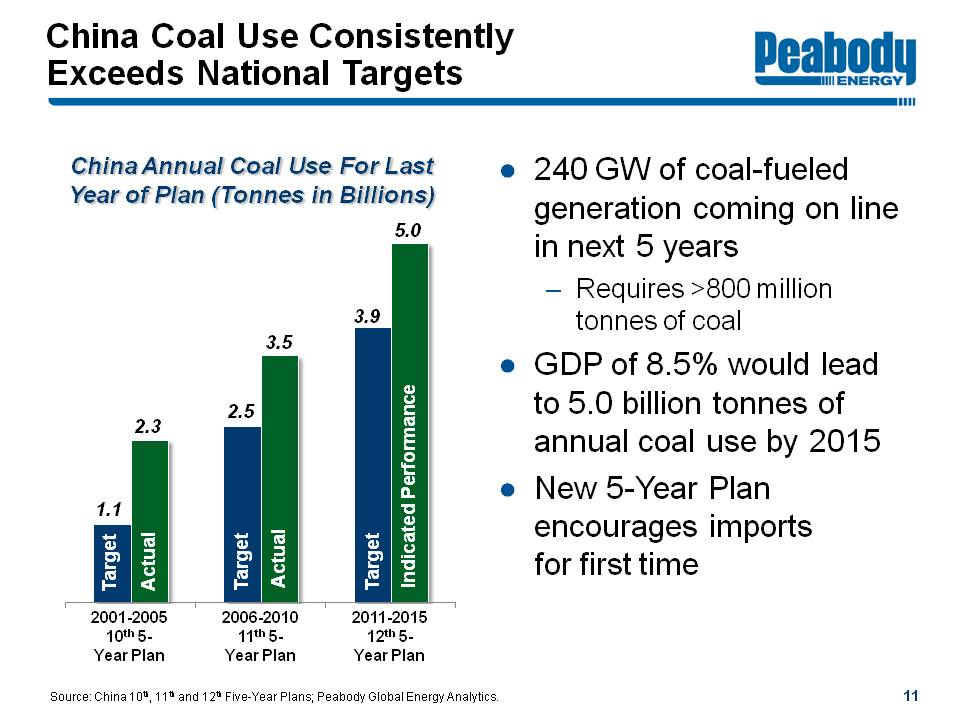
China Annual Coal Use For Last Year of Plan (Tonnes in Billions)
2001-2005 10th 5-Year Plan Target 1.1 Actual 2.3
2006-2010 11th 5-Year Plan Target 2.5 Actual 3.5
2011-2015 12th 5-Year Plan Target 3.9 Indicated Performance 5.0
240 GW of coal-fueled generation coming online in next 5 years
Requires >800 million tonnes of coal
GDP of 8.5% would lead to 5.0 billion tonnes of annual coal use by 2015
New 5-Year Plan encourages imports for first time
Source: China 10th, 11th and 12th Five-Year Plans; Peabody Global Energy Analytics.
11
China's Expected to Drive Major Growth in Seaborne Coal
Peabody Energy
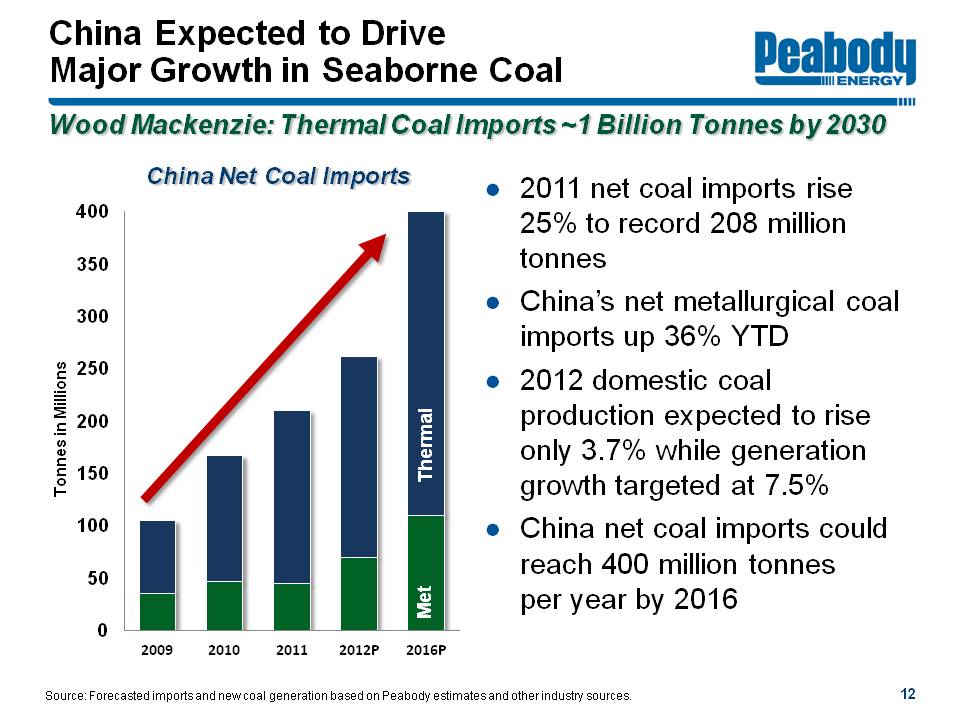
Wood Mackenzie: Thermal Coal Imports ~1 Billion Tonnes by 2030
China Net Coal Imports
Tonnes in Millions
2009 2010 2011 2012P 2016P Met Thermal
2011 net coal imports rise 25% to record 208 million tonnes
China's net metallurgical imports up 36% YTD
2012 domestic coal production expected to rise only 3.7% while generation growth targeted at 7.5%
China net coal imports could reach 400 million tonnes per year by 2016
Source: Forecasted imports and new coal generation based on Peabody estimates and other industry sources.
12
India Likely to Be World's Fastest Growing Coal Importer
Peabody Energy
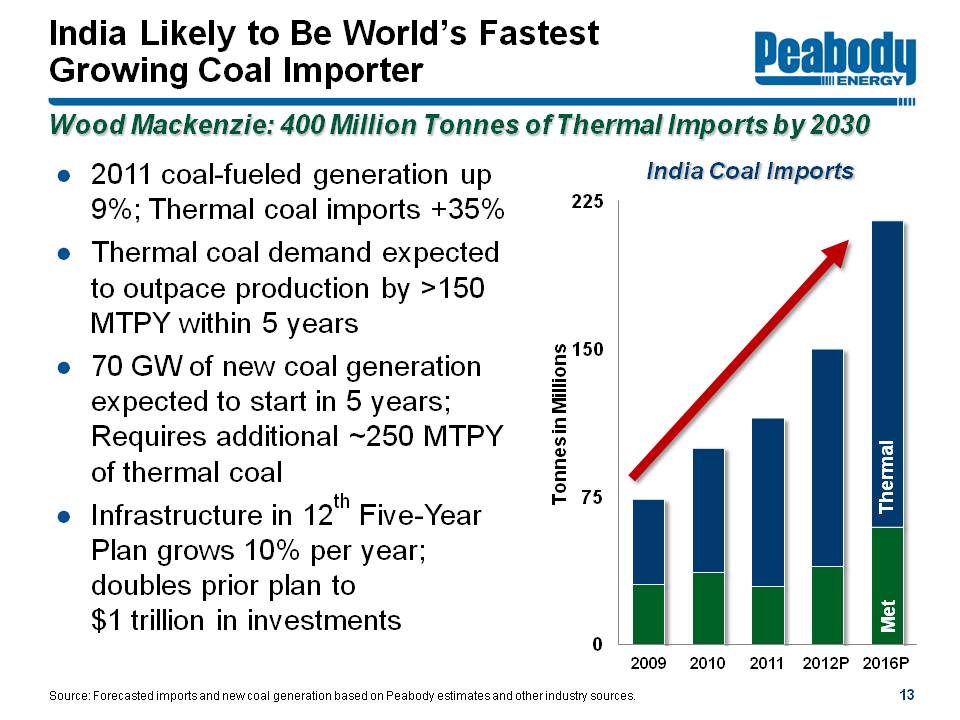
Wood Mackenzie: 400 Million Tonnes of Thermal Imports by 2030
2011 Coal-Fueled Generation up 9%; Thermal Coal Imports +35%
Thermal coal demand expected to outpace production by >150 MTPY within 5 years
70 GW of new coal generation expected to start in 5 years; Requires additional ~250 MTPY of thermal coal
Infrastructure in 12th Five-Year Plan grows 10% per year; doubles prior plan to $1 trillion in investments
India Coal Imports
Tonnes in Millions
2009 2010 2011 2012P 2016P Met Thermal
Source: Forecasted imports and new coal generation based on Peabody estimates and other industry sources.
13
Major Supply Constraints Tighten Global Coal Markets
Peabody Energy
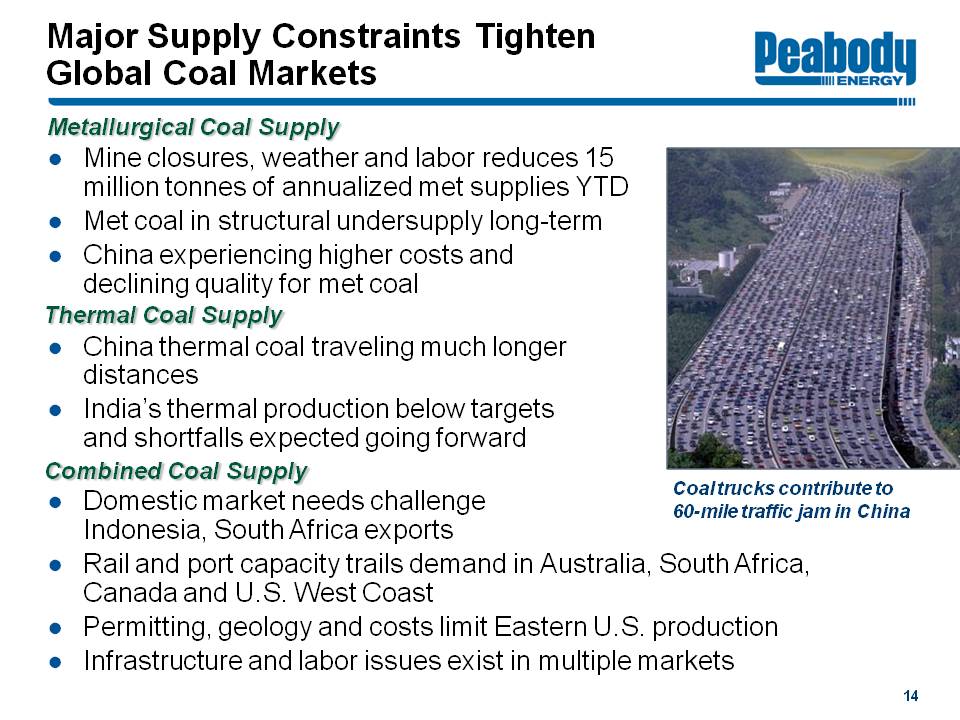
Metallurgical Coal Supply
Mine closures, weather and labor reduces 15 million tones of annualized met supplies YTD
Met coal in structural undersupply long-term
China experiencing higher costs and declining quality for met coal
Thermal Coal Supply
China thermal coal traveling much longer distances
India's thermal production below targets and shortfalls expected going forward
Combined Coal Supply
Domestic market needs challenge Indonesia, South Africa exports
Rail and port capacity trails demand in Australia, South Africa, Canada and U.S. West Coast
Permitting, geology and costs limit Eastern U.S. production
Infrastructure and labor issues exist in multiple markets
Coal trucks contribute to 60-mile traffic jam in China
14
Australia to Supply Half the Growth in Seaborne Market Demand in 2012
Peabody Energy
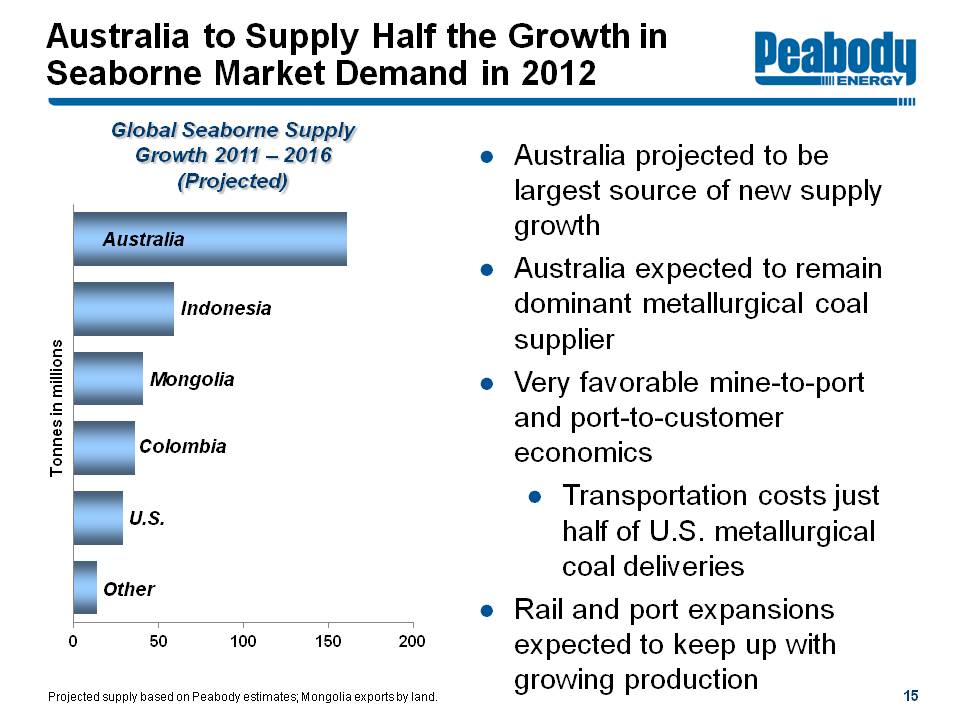
Global Seaborne Supply Growth 2011 - 2016 (Projected)
Tonnes in millions
Australia
Indonesia
Mongolia
Colombia
U.S.
Other
Australia projected to be largest source of new supply growth
Australia expected to remain dominant metallurgical coal supplier
Very favorable mine-to-port and port-to-customer economics
Transportation costs just half of U.S. metallurgical coal deliveries
Rail and port expansions expected to keep up with growing production
Projected supply based on Peabody estimates; Mongolia exports by land.
15
PRB and Illinois Basin Expected to Dual-Serve U.S. and Global Markets
Peabody Energy
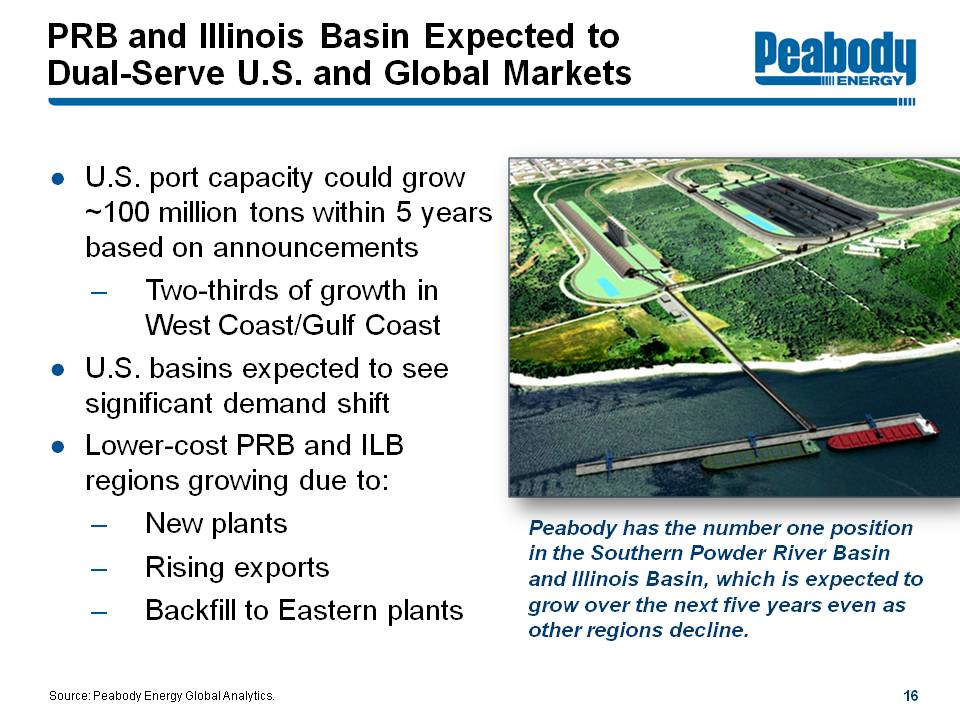
U.S. port capacity could grow ~100 million tons within 5 years based on announcements
Two-thirds of growth in West Coast/Gulf Coast
U.S. basins expected to see significant demand shift
Lower-cost PRB and ILB regions growing due to:
New plants
Rising exports
Backfill to Eastern plants
Peabody has the number one position in the Southern Powder River Basin and Illinois Basin, which is expected to grow over the next five years even as other regions decline.
Source: Peabody Energy Global Analytics.
16
U.S. Coal Production Cuts Accelerating
Peabody Energy
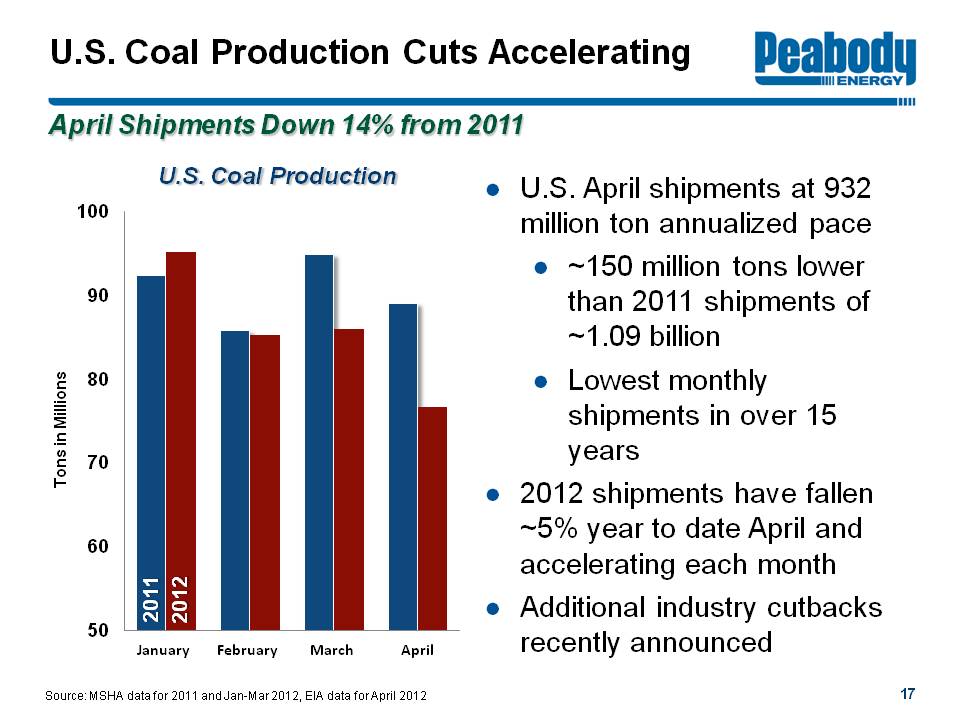
U.S. April Shipments Down 14% from 2011
U.S. Coal Production
Tons in Millions
2011 2012
January February March April
April shipments at 932 million ton annualized pace
~150 million tons lower than 2011 shipments of ~1.09 billion
Lowest monthly shipments in over 15 years
2012 shipments have fallen ~5% year to date April and accelerating each month
Additional industry cutbacks recently announced
Source: MSHA data for 2011 and Jan-Mar 2012, EIA data for April 2012
17
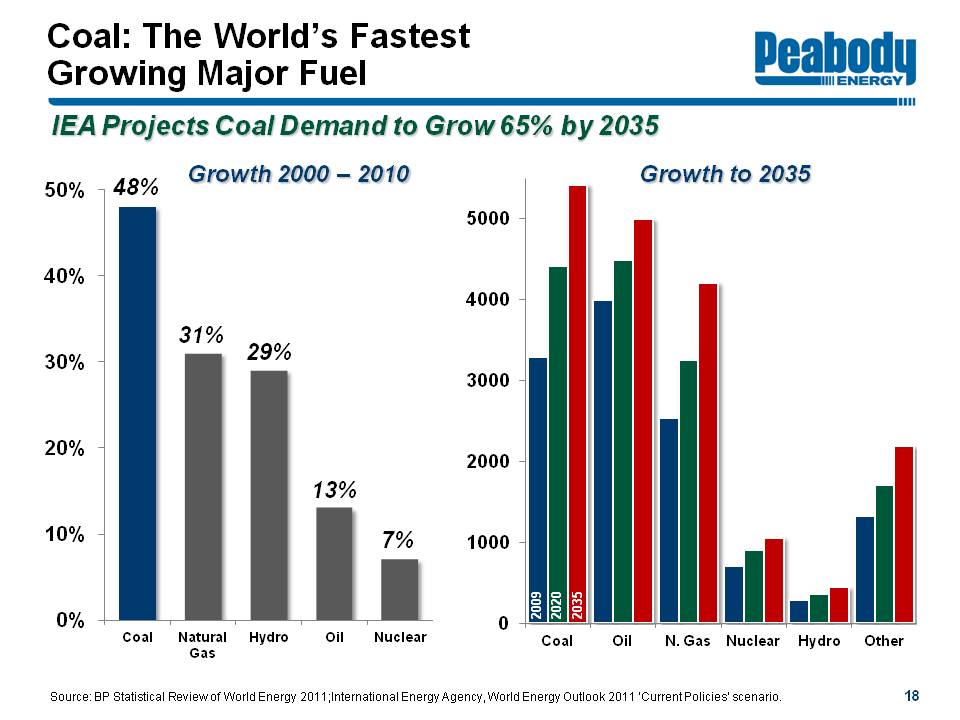
Coal: The World's Fastest Growing Major Fuel
Peabody Energy
IEA Projects Coal Demand to Grow 65% by 2035
Growth 2000-2010
Coal 48% Natural Gas 31% Hydro 29% Oil 13% Nuclear 7%
Growth to 2035
2009 2020 2035
Coal Oil N. Gas Nuclear Hydro Other
Source: BP Statistical Review of World Energy 2011; International Energy Agency, World Energy Outlook 2011 'Current Policies' scenario.
18
Peabody's Global Platform Drives Results
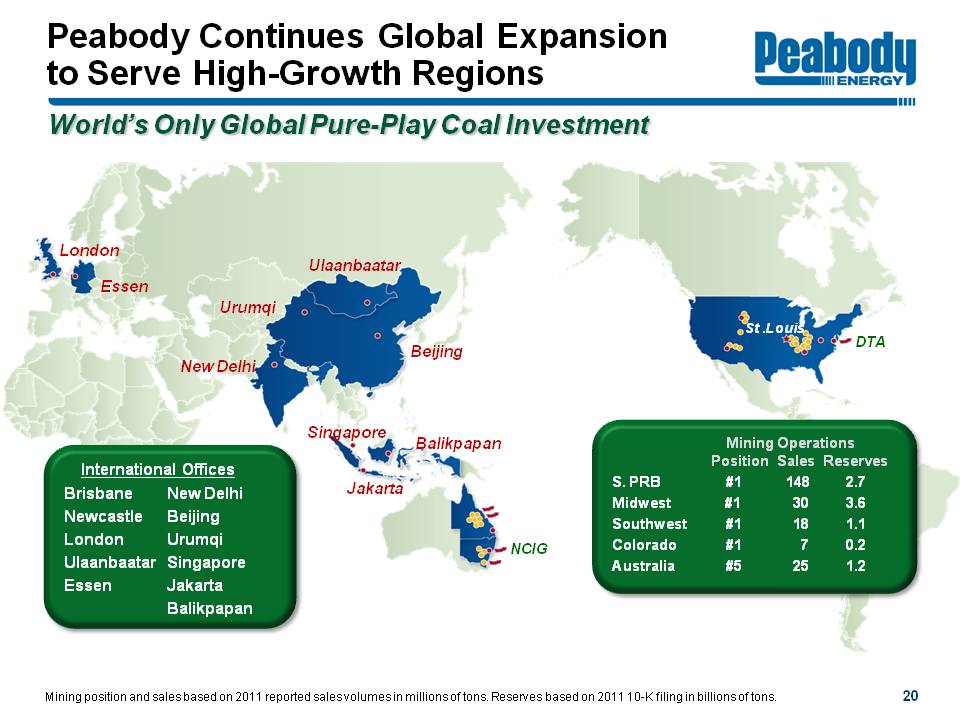
Peabody Continues Global Expansion to Serve High-Growth Regions
Peabody Energy
World's Only Global Pure-Play Coal Investment
London Essen New Delhi Urumqi Ulaanbaatar Beijing Singapore Jakarta Balikpapan NCIG St. Louis DTA
International Offices
Brisbane New Delhi Newcastle Beijing London Urumqi Ulaanbaatar Singapore Essen Jakarta Balikpapan
Mining Operations
Position S. PRB #1 Midwest #1 Southwest #1 Colorado #1 Australia #5
Sales S. PRB 148 Midwest 30 Southwest 18 Colorado 7 Australia 25
Reserves S. PRB 2.7 Midwest 3.6 Southwest 1.1 Colorado 0.2 Australia 1.2
Mining position and sales based on 2011 reported sales volumes in millions of tons. Reserves based on 2011 10-K filing in billions of tons.
20
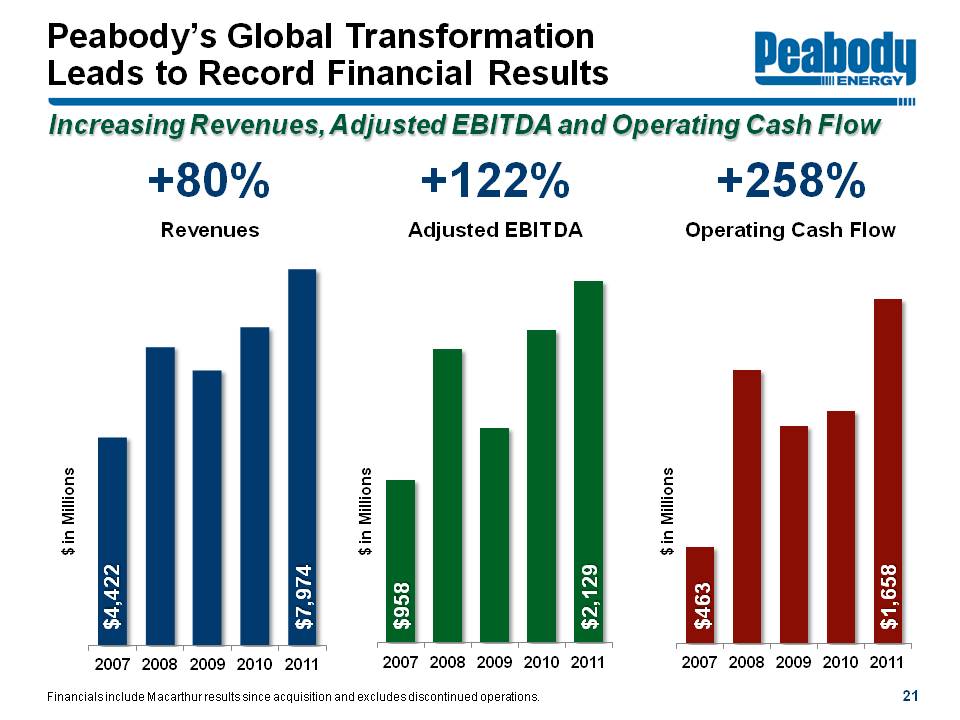
Peabody's Global Transformation Leads to Record Financial Results
Peabody Energy
Increasing Revenues, Adjusted EBITDA and Operating Cash Flow
+80% Revenues $ in Millions 2007 $4,422 2008 2009 2010 2011 $7,974
+122% Adjusted EBITDA $ in Millions 2007 $958 2008 2009 2010 2011 $2,129
+258% Operating Cash Flow $ in Millions 2007 $463 2008 2009 2010 2011 $1,658
Financials include Macarthur results since acquisition and excludes discontinued operations.
21
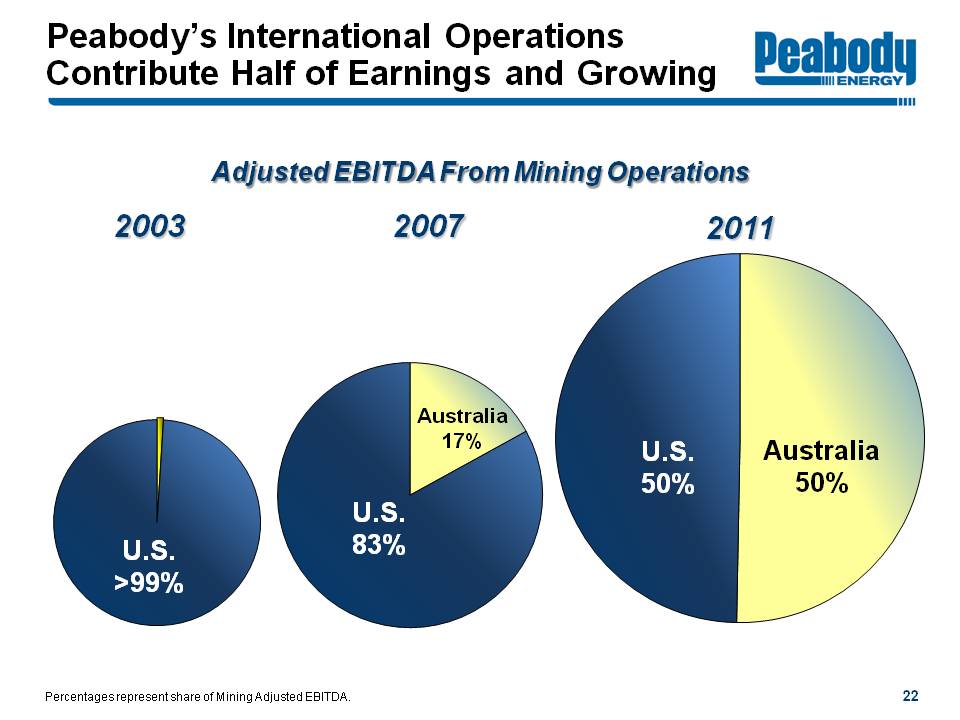
Peabody's International Operations Contribute Half of Earnings and Growing
Peabody Energy
Adjusted EBITDA From Mining Operations
2003 U.S. > 99%
2007 U.S. 83% Australia 17%
2011 U.S. 50% Australia 50%
Percentages represent share of Mining Adjusted EBITDA.
22
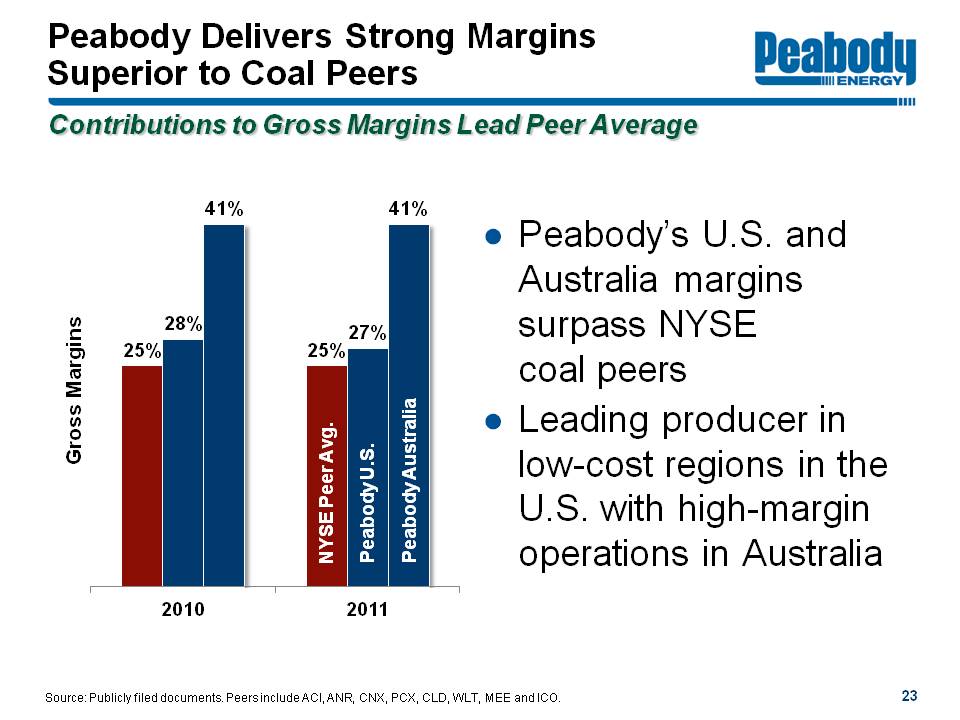
Peabody Delivers Strong Margins Superior to Coal Peers
Peabody Energy
Contributions to Gross Margins Lead Peer Average
Gross Margins
2010 25% 28% 41% 2011 NYSE Peer Avg. 25% Peabody U.S. 27% Peabody Australia 41%
Peabody's U.S. and Australia margins surpass NYSE coal peers
Leading producer in low-cost regions in the U.S. with high-margin operations in Australia
Source: Publicly filed documents. Peers include ACI, ANR, CNX, PCX, CLD, WLT, MEE and ICO.
23
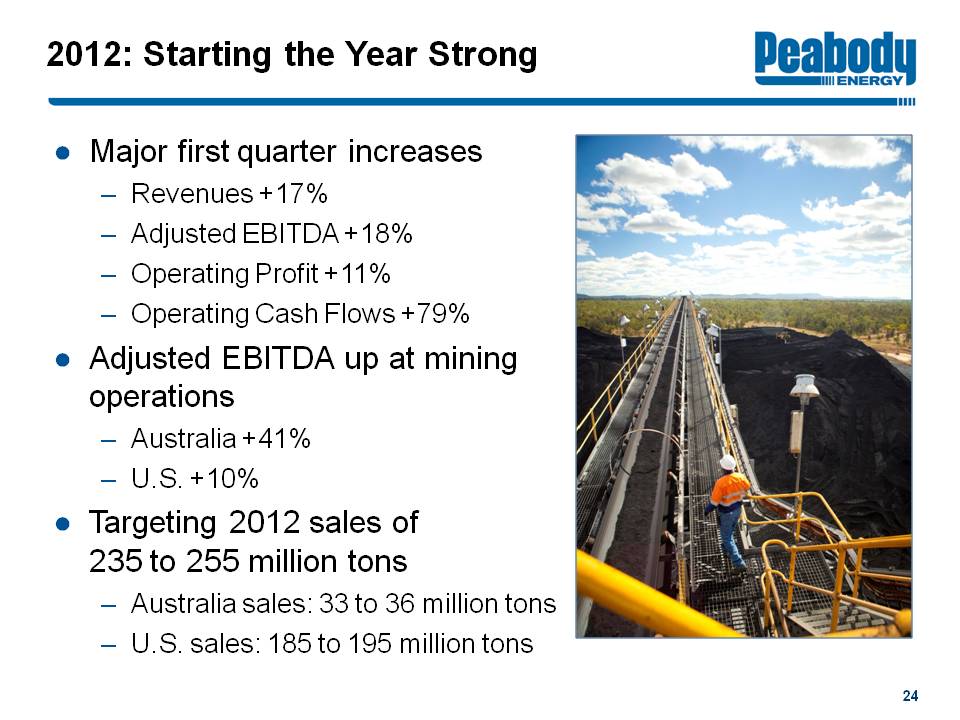
2012: Starting the Year Strong
Peabody Energy
Major first quarter increases
Revenues +17%
Adjusted EBITDA +18%
Operating Profit +11%
Operating Cash Flows +79%
Adjusted EBITDA up at mining operations
Australia +41%
U.S. +10%
Targeting 2012 sales of 235 to 255 million tons
Australia sales: 33 to 36 million tons
U.S. sales: 185 to 195 million tons
24
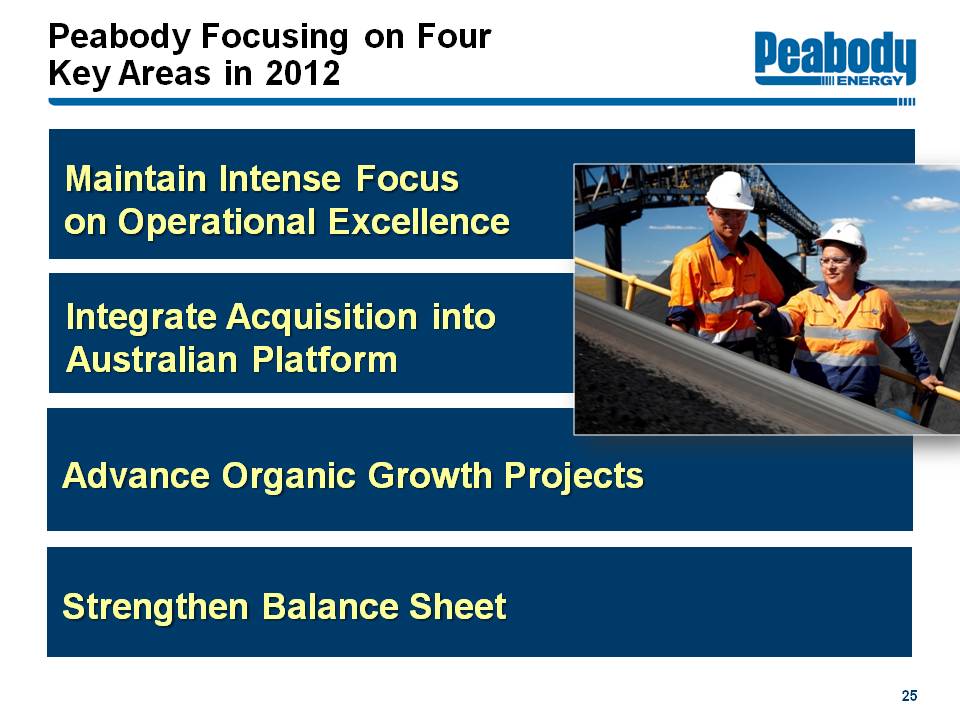
Peabody Focusing on Four Key Areas in 2012
Peabody Energy
Maintain Intense Focus on Operational Excellence
Integrate Acquisition into Australian Platform
Advance Organic Growth Projects
Strengthen Balance Sheet
25
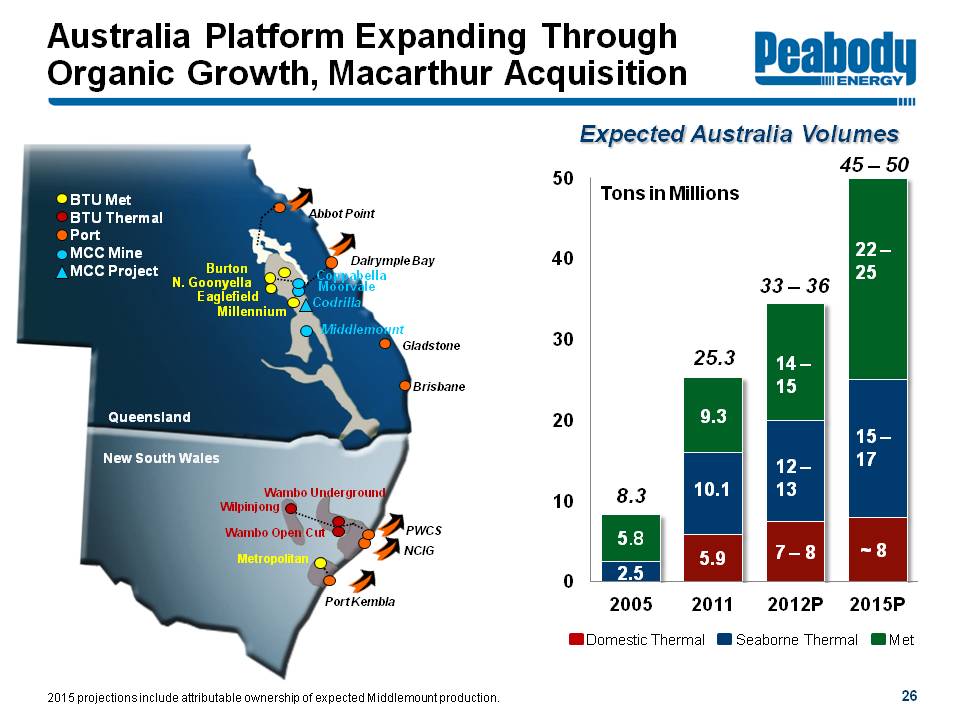
Australia Platform Expanding Through Organic Growth, Macarthur Acquisition
Peabody Energy
Queensland
Port Abbot Point Dalrymple Bay Gladstone Brisbane
BTU Met Burton N. Goonyella Eaglefield Millennium
MCC Mine Coppabella Moorvale Middlemount
MCC Project Codrilla
New South Wales
Port PWCS NCIG Port Kembla
BTU Thermal Wilpinjong Wambo Underground Wambo Open Cut
BTU Met Metropolitan
Expected Australia Volumes
Tons in Millions
2005 Seaborne Thermal 2.5 Met 5.8 Total 8.3
2011 Domestic Thermal 5.9 Seaborne Thermal 10.1 Met 9.3 Total 25.3
2012P Domestic Thermal 7-8 Seaborne Thermal 12-13 Met 14-15 Total 33-36
2015P Domestic Thermal ~8 Seaborne Thermal 15-17 Met 22-25 Total 45-50
2015 projections include attributable ownership of expected Middlemount production.
26
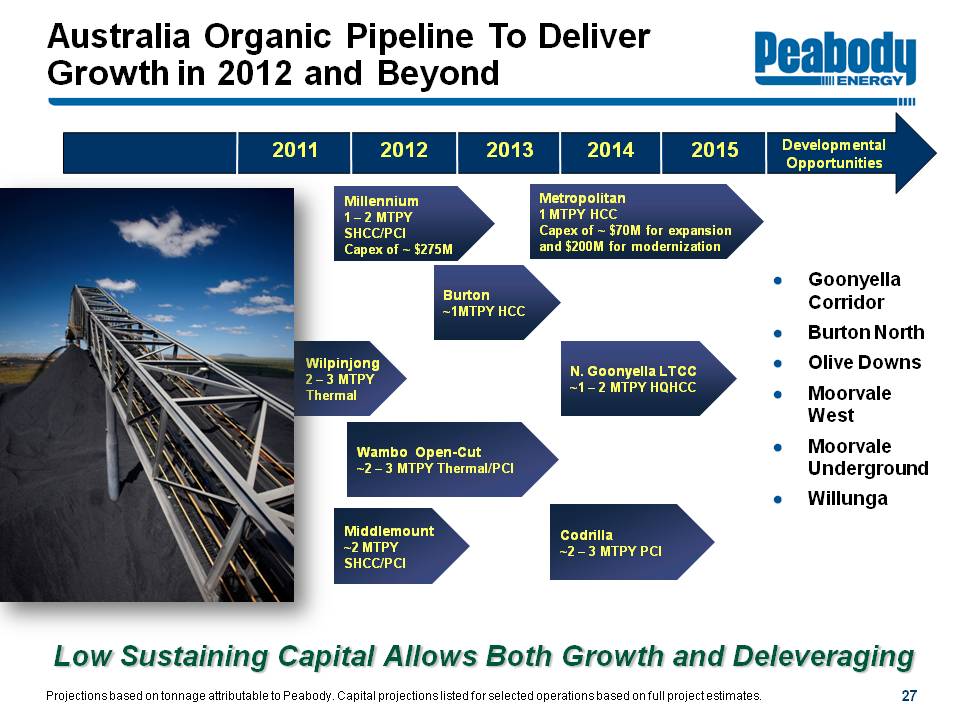
Australia Organic Pipeline To Deliver Growth in 2012 and Beyond
Peabody Energy
2011 2012 2013 2014 2015
Wilpinjong 2 - 3 MTPY Thermal
Millennium 1 - 2 MTPY SHCC/PCI Capex of ~$275M
Wambo Open-Cut ~2 - 3 MTPY Thermal/PCI
Middlemount ~2 MTPY SHCC/PCI
Burton ~1MTPY HCC
Metropolitan 1 MTPY HCC Capex of ~$70M for expansion and $200M for modernization
N. Goonyella LTCC ~1 - 2 MTPY HQHCC
Codrilla ~2 - 3 MTPY PCI
Developmental Opportunities Goonyella Corridor Burton North Olive Downs Moorevale West Moorevale Underground Willunga
Low Sustaining Capital Allows Both Growth and Deleveraging
Projections based on tonnage attributable to Peabody. Capital projections listed for selected operations based on full project estimates.
27
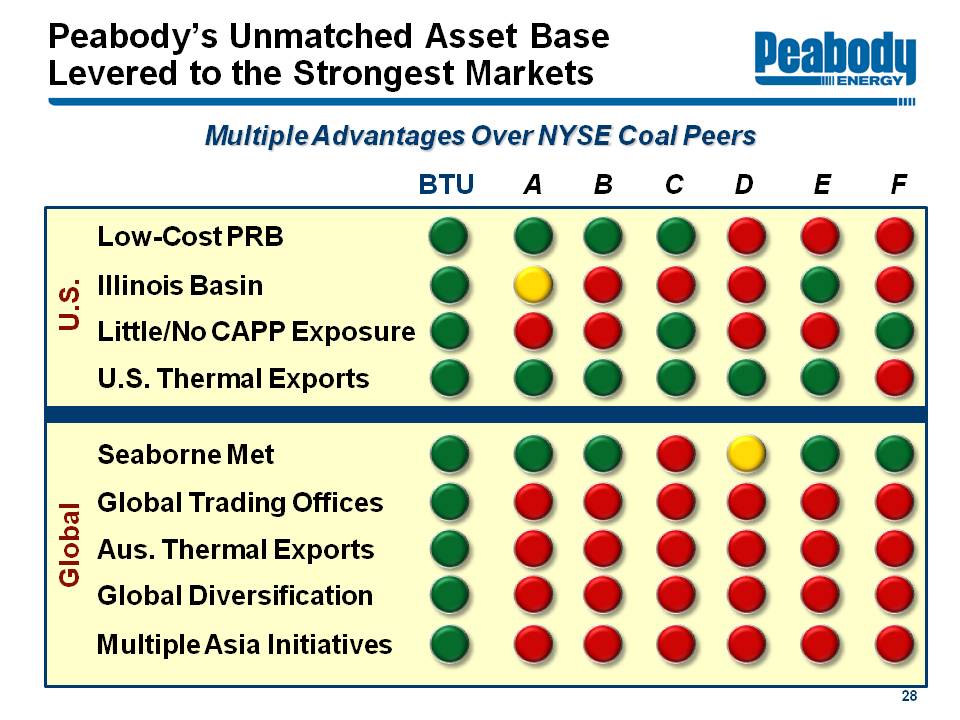
Peabody's Unmatched Asset Base Levered to the Strongest Markets
Peabody Energy
Multiple Advantages Over NYSE Coal Peers
BTU A B C D E F
U.S. Low-Cost PRB Illinois Basin Little/No CAPP Exposure U.S. Thermal Exports
Global Seaborne Met Global Trading Offices Aus. Thermal Exports Global Diversification Multiple Asia Initiatives
28
BTU: Multiple Catalysts for Value Creation in 2012
Peabody Energy
Record results and strong financial position
Targeting 2012 Australia growth of 8 - 11 million tons; further expansion in 2013
Significant pipeline for future growth
Fully contracted in U.S. for 2012, leader in low-cost regions
Platform, markets offer volume and price upside potential
29

Energizing The World One BTU At A Time
Bank of America - Merrill Lynch Global Metals and Mining Conference
Gregory H. Boyce Chairman and Chief Executive Officer
May 17, 2012
Peabody Energy
Appendix: Reconciliation of Adjusted EBITDA
Peabody Energy
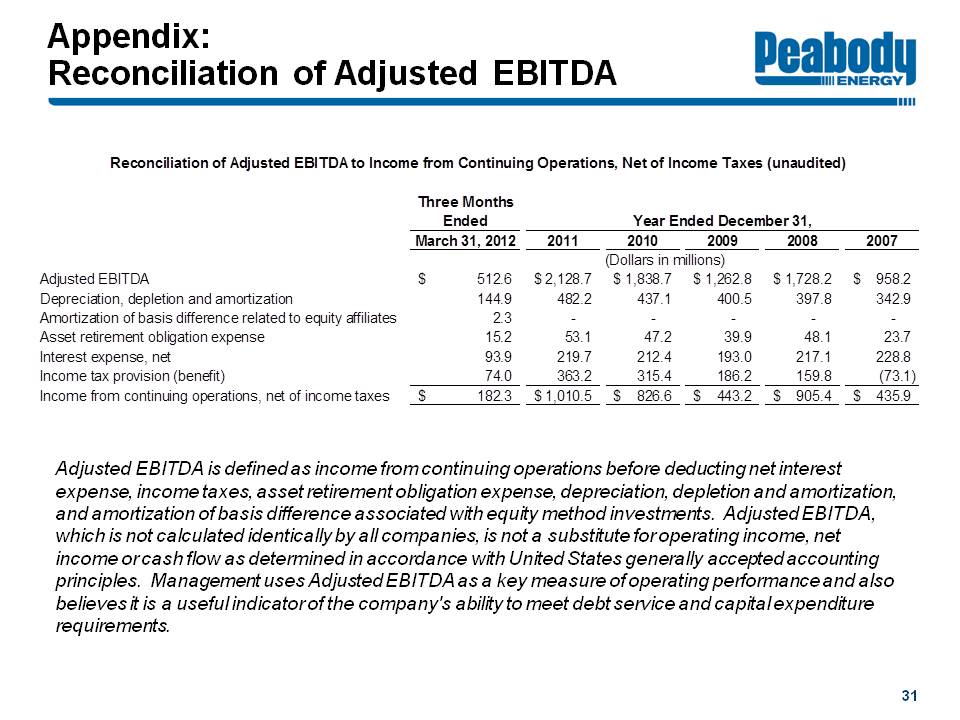
Reconciliation of Adjusted EBITDA to Income from Continuing Operations, Net of Income Taxes (unaudited)
Three Months Ended March 31, 2012 Year Ended December 31, 2011 2010 2009 2008 2007
(Dollars in millions)
Adjusted EBITDA $512.6 $2,128.7 $1,838.7 $1,262.8 $1,728.2 $958.2
Depreciation, depletion and amortization 144.9 482.2 437.1 400.5 397.8 342.9
Amortization of basis difference related to equity affiliates 2.3 - - - - -
Asset retirement obligation expense 15.2 53.1 47.2 39.9 48.1 23.7
Interest expense, net 93.9 219.7 212.4 193.0 217.1 228.8
Income tax provision (benefit) 74.0 363.2 315.4 186.2 159.8 (73.1)
Income from continuing operations, net of income taxes $182.3 $1,010.5 $826.6 $443.2 $905.4 $435.9
Adjusted EBITDA is defined as income from continuing operations before deducting net interest expense, income taxes, asset retirement obligation expense, depreciation, depletion and amortization, and amortization of basis difference associated with equity method investments. Adjusted EBITDA, which is not calculated identically by all companies, is not a substitute for operating income, net income or cash flow as determined in accordance with United States generally accepted accounting principles. Management uses Adjusted EBITDA as a key measure of operating performance and also believes it is a useful indicator of the company's ability to meet debt service and capital expenditure requirements.
31