Attached files
| file | filename |
|---|---|
| 8-K - HINES REIT Q1 2012 QUARTERLY PRESENTATION - HINES REAL ESTATE INVESTMENT TRUST INC | hrq1presentation_8k.htm |
Exhibit 99.1

Hines REIT Update
Hines REIT is closed to new investors.
Hines Securities, Inc., Member FINRA/SIPC. 5/12
As of March 31, 2012

Hines REIT Overview
• Commenced capital raising in 2004
• Raised and invested significant capital in 2006 and 2007 which
represented a peak in the overall economic cycle and real
estate cycle
represented a peak in the overall economic cycle and real
estate cycle
• In 2008 and 2009, amidst the economic downturn towards the
recession, we experienced significant declines in capital
raising and significant increases in redemption requests
recession, we experienced significant declines in capital
raising and significant increases in redemption requests
• At the end of 2009, capital raising ceased and we suspended
our redemption plan to prudently preserve liquidity
our redemption plan to prudently preserve liquidity
2

Hines REIT Overview
Since 2009, the Company has been keenly focused on
the following:
the following:
• Leasing: keeping our tenants in occupancy to preserve and maintain
operating income
operating income
• Strategic asset sales: identifying opportunities to sell certain stabilized
assets to harvest liquidity and attractive profits
assets to harvest liquidity and attractive profits
• Liquidity: ensuring we have sufficient funds to meet liquidity needs for
operating expenses, leasing capital, and debt refinancings, while still
maintaining reasonable levels of distributions to our shareholders
operating expenses, leasing capital, and debt refinancings, while still
maintaining reasonable levels of distributions to our shareholders
We continue to be patient and disciplined in managing our portfolio
in order to benefit from the overall economic recovery and recovery
of the U.S. office markets
in order to benefit from the overall economic recovery and recovery
of the U.S. office markets
3

Hines REIT Overview
• 57 projects / 24 different geographic markets / U.S. and Brazil
• Predominately Class A office, industrial and grocery-anchored
retail centers
retail centers
• Over 26 million square feet / 87% leased / approximately 2%
above the national average
above the national average
• Latest valuation of portfolio was as of March 2011 resulting in
estimated per share value of $7.78 effective May 2011
estimated per share value of $7.78 effective May 2011
• Significant cash on hand for near-term liquidity needs resulting in
a strong balance sheet
a strong balance sheet
4

Regional Diversification and Lease Expirations
as of March 31, 2012
as of March 31, 2012
5
1Data is based on Hines REIT’s pro-rata share of the estimated aggregate value. 2Data is based on Hines REIT’s effective ownership in each property
and is compiled based on leased square feet.
and is compiled based on leased square feet.
Regional Diversification1
City Diversification1
Lease expirations as % of total leasable square feet in the current portfolio2

Top 10 Tenants as of March 31, 2012
1Based on Hines REIT’s effective ownership in each property and compiled based on leased square feet.
6
|
Top 10 Tenants1
|
|
|
Shook, Hardy & Bacon LLP
International law firm 2555 Grand 2024 Expiration
|
Honeywell International
Engineering services Daytona-Laguna Portfolio & 345 Inverness Drive 2016, 2017 Expirations
|
|
Williams Companies
Integrated natural gas Williams Tower 2018, 2021 Expirations
|
Oracle
Multinational technology company 2100 Powell 2013 Expiration
|
|
Raytheon Company
Defense aerospace systems Raytheon/DIRECTV Buildings 2018 Expiration
|
Kay Chemical
Private specialty cleaning 4050 & 4055 Corporate Drive 2018 Expiration
|
|
State of California
State government 1515 S. Street 2012, 2018 Expirations
|
Norwegian Cruise Line
Cruise line Airport Corporate Center 2019 Expiration
|
|
Microsoft Corporation
Multinational software development Daytona-Laguna Portfolio 2015, 2017 Expirations
|
Foley & Lardner
International law firm
321 North Clark 2013, 2018 Expirations
|
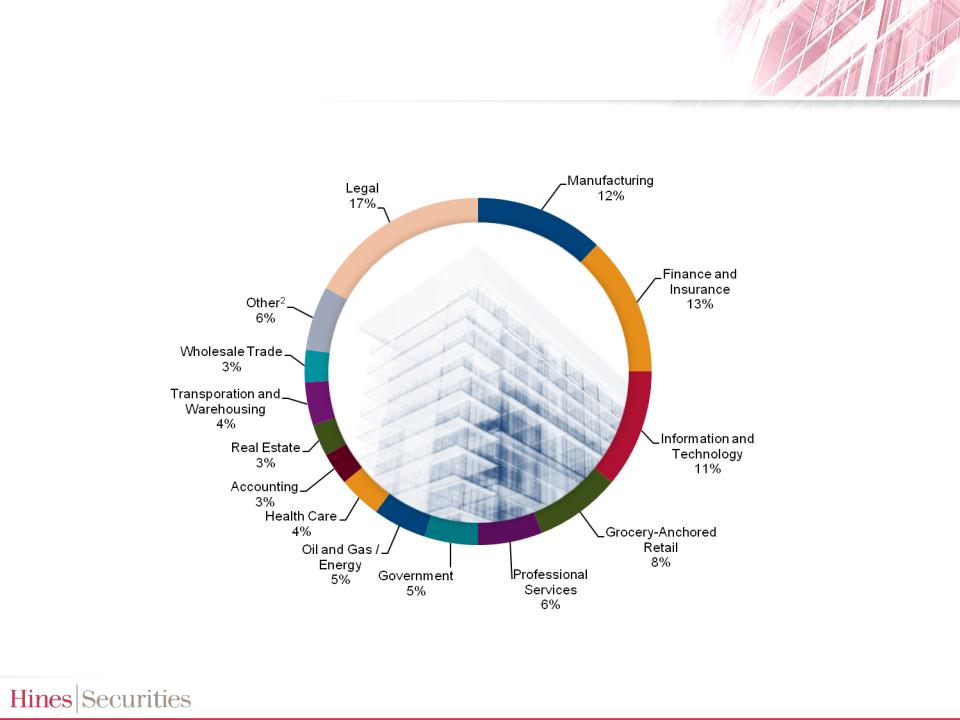
1Based on Hines REIT’s pro rata share of the leased square feet of each property. 2Other includes Arts/Entertainment, Other Services, Construction and
Retail industries, as well as those accounting for less than 1% of the portfolio.
Retail industries, as well as those accounting for less than 1% of the portfolio.
7
Tenant Industry Diversification1
as of March 31, 2012
as of March 31, 2012

Hines REIT Leasing Update
8
• Leasing has been a priority given the challenging economic environment which
had a broad impact on U.S. and International businesses
had a broad impact on U.S. and International businesses
• Many businesses adversely impacted
• Layoff of employees
• Reduced space needs
• Move to lower quality / less expensive space
• Out of Business or Bankrupt
• During 2011
• Lease renewals for approximately 3.5 million square feet (13% of our
gross square footage) to keep tenants in occupancy and extend the term of their
leases
gross square footage) to keep tenants in occupancy and extend the term of their
leases
• New leases for approximately 1.4 million square feet with new tenants moving into our
assets from other competitive space
assets from other competitive space

2012 Proactive Leasing Highlights
9
Chase Tower
Dallas, TX
Cornerstone Healthcare
Group
Group
New lease 21,000 SF
through 2022
through 2022
321 North Clark
Chicago, IL
26,000 SF of new leases
primarily to tenants in the
legal and professional
services industries
primarily to tenants in the
legal and professional
services industries
Grocery-Anchored Retail Portfolio
Champions Women’s Fitness
New lease 17,000 SF through 2022
Champions Village, Houston, TX
Kroger
Expansion 25,000 SF through 2032
Cherokee Plaza, Atlanta, GA

2012 Proactive Leasing Highlights
10
KPMG Building
San Francisco, CA
Tealeaf Technology, Inc.
New lease 28,000 SF
through 2017
New lease 28,000 SF
through 2017
Shell Plaza (One and Two)
Houston, TX
Shell Corporation
Expansion 50,000 SF in
addition to the 1.22 million SF
renewal and extension
through 2025
Expansion 50,000 SF in
addition to the 1.22 million SF
renewal and extension
through 2025

Hines REIT Leverage Overview
• Leverage level as of March 31, 2012 was 55%
• Consists primarily of asset level fixed rate mortgage loans
and a corporate level revolving credit facility which provides
$45 million of additional liquidity
and a corporate level revolving credit facility which provides
$45 million of additional liquidity
• Average weighted interest rate of approximately 5.64%
• Manageable debt maturities over the next few years
11

Debt Maturity Chart as of March 31, 2012
12
The amounts represented above are the projected loan balances at maturity assuming all required principal and interest payments are made
prior to maturity.
prior to maturity.
Portfolio Average
Weighted Interest Rate:
5.64%
Weighted Interest Rate:
5.64%

Distribution History*
*Annual distribution rates have been calculated based on the most recent primary offering price of $10.08 per share. In May 2011, we announced an
estimated per share value of $7.78. The distribution rate on the $7.78 share price is 6.5%. Rates assumes consistent distribution rate for 12-month
period. Hines REIT declared distributions from July 2011 through the month of June 2012 in an amount equal to $0.00138082 per share, per day. Of the
amount described above, $0.00041425 of the per share, per day dividend will be designated by the Company as a special distribution which will be a
return of a portion of the shareholders’ invested capital and, as such, will reduce their remaining investment in the Company. The special distribution
represents a portion of the profits from sales of investment property. The above designations of a portion of the distribution as a special distribution
will not impact the tax treatment of the distributions to our shareholders. We funded our cash distributions with cash flows from operating activities,
distributions received from our unconsolidated investments, proceeds from the sales of our real estate
investments and cash generated during prior periods.
13

Strategic Dispositions
• Significant capital demand for high quality stabilized assets
• Certain assets in the portfolio provided Hines REIT the
opportunity to capture significant gains and strengthen the
Company’s liquidity position
opportunity to capture significant gains and strengthen the
Company’s liquidity position
14

Strategic Dispositions
One North Wacker
Chicago, IL
Acquired: Mar. 2008
for $540 million
for $540 million
Sold 49% interest in Dec. 2011
for $298.9 million1
for $298.9 million1
Effective ownership: 22%2
1The Core Fund, in which Hines REIT invests, did not recognize a gain or loss on the sale due to the carrying amount of the noncontrolling interest being
adjusted to reflect the change in ownership of One North Wacker. 2Effective ownership as of 9/30/11, prior to the sale. 3This asset was owned indirectly
through the Core Fund.
adjusted to reflect the change in ownership of One North Wacker. 2Effective ownership as of 9/30/11, prior to the sale. 3This asset was owned indirectly
through the Core Fund.
15
Three First National
Chicago, IL3
Acquired: Mar. 2005 for
$245 million
$245 million
Sold: Aug. 2011
for $344 million
for $344 million
Effective ownership:18%2

Acquired: Feb. 2004
for $92 million
for $92 million
Sold: May 2010 for
$193 million
$193 million
Effective ownership:11.67%*
Atrium on Bay,
Toronto, ON, Canada
Acquired: Feb. 2007
for $215 million USD
for $215 million USD
Sold: Jun. 2011
for $353 million USD
for $353 million USD
Effective ownership:100%
Strategic Dispositions
*This asset was owned indirectly through the Core Fund.
16

Brazilian Industrial Parks
Araucaria, Elouveira and Vinhedo
Acquired: Dec. 2008 for $115 million
Sold: Jan. 2010 and Apr. 2010 for $141 million
Effective ownership:100%
Land Parcel Adjacent
to Williams Tower
Houston, TX
to Williams Tower
Houston, TX
Acquired: May 2008
Sold: Sept. 2010 generating net
proceeds of $12 million
proceeds of $12 million
Effective ownership:100%
Strategic Dispositions
17

Looking Forward: Hines REIT Exit Strategy
18
Goal: maximize investor returns
Possible exit options:
• Targeted sale of individual or
groups of assets
groups of assets
• Sale or merger
• Listing on a national exchange
Continue identifying
opportunities for strategic
asset sales
opportunities for strategic
asset sales

Alignment of Interest
19
Hines’ alignment of interests with investors -
• Hines has approximately $100 million invested
in Hines REIT
in Hines REIT
• Continues to earn half of its fees in equity / same as
receiving cash and reinvesting back into Hines REIT
receiving cash and reinvesting back into Hines REIT
• Waived 1/3 of cash asset management fees
from July 2011 through December 2012 in an effort to
enhance the REIT’s cash flows and distributions to
shareholders
from July 2011 through December 2012 in an effort to
enhance the REIT’s cash flows and distributions to
shareholders
• Fee waiver is projected to total over $7.5 million

Long-Term Priorities
20
Near-term priorities:
• Lease-up existing assets
• Strategic asset sales
• Manage debt maturities
• Manage liquidity
• Maximize distributions to investors
Long-term priorities:
• Evaluate exit strategies
• Maximize return of capital
• Maximize total return over the long term

Thank You
21