Attached files
| file | filename |
|---|---|
| 8-K - FORM 8-K - Beneficial Mutual Bancorp Inc | d354758d8k.htm |
Exhibit 99.1

| Beneficial Mutual Bancorp Shareholder Presentation May 17, 2012 |

| SAFE HARBOR STATEMENT This presentation may contain projections and other "forward-looking statements" within the meaning of the federal securities laws. These statements are not historical facts, rather statements based on the current expectations of Beneficial Mutual Bancorp, Inc. (the "Company") regarding its business strategies, intended results and future performance. Forward-looking statements are preceded by terms such as "expects," "believes," "anticipates," "intends" and similar expressions. Management's ability to predict results or the effect of future plans or strategies is inherently uncertain. Factors that could affect actual results include interest rate trends, the general economic climate in the market area in which the Company operates, as well as nationwide, the Company's ability to control costs and expenses, competitive products and pricing, loan delinquency rates, changes in federal and state legislation and regulation and other factors that may be described in the Company's filings with the Securities and Exchange Commission, including its Annual Reports on Form 10-K and Quarterly Reports on Form 10-Q and other required filings. These factors should be considered in evaluating the forward-looking statements and undue reliance should not be placed on such statements. The Company assumes no obligation to update any forward-looking statements. This presentation includes interim and unaudited financials, which are subject to further review by the Company's independent accountants. |

| COMPANY SNAPSHOT Founded in 1853 Oldest and largest bank headquartered in Philadelphia 3rd largest publicly traded mutual holding company by Assets |

| PRESENTATION TOPICS Our Market Current Focus Financial Performance St. Edmond's Update |

| OUR MARKET - GREATER PHILADELPHIA AREA We operate in a dynamic medium between regional and super regional competitors, and local community banks Large enough to compete with the largest financial institutions There are 118 banking institutions in the Philadelphia metro area including Beneficial 87 of these institutions have less than 10 branch locations Only 10 of these institutions including Beneficial have more than 50 branch locations Beneficial is positioned to take advantage of marketplace consolidation Source: SNL Interactive |

| OUR MARKET - GREATER PHILADELPHIA AREA 5th largest metropolitan region in the U.S. 63 colleges and universities Median household income of $58k versus national median of $50k 60 branches (35 in PA, 25 in NJ) Population of 6.0 million Sources: U.S. Census Bureau, SNL Interactive (2011) |

| OUR PRESENCE & MARKET OPPORTUNITY #1 Ranked Thrift and #9 Overall in Philadelphia MSA Still have opportunities for growth in our marketplace Source: SNL Interactive (2011) |

| PRESENTATION TOPICS Our Market Current Focus Financial Performance St. Edmond's Update |

| CURRENT FOCUS Cultural Transformation Educate our customers to do the right thing financially Train employees base on the "Beneficial Conversation" Capital Strength Maintain strong capital levels to allow strategic flexibility Continue fundamental organic growth Active balance sheet management Opportunistic acquisition strategy Continue to evaluate second step based on market and strategy Improved Profitability Balance sheet mix, and loan and deposit pricing Focused on operating efficiency, and cost structure Developing and growing fee based businesses - completed build-out of mortgage banking team Expanding C&I and Small Business teams to organically grow commercial loan portfolio |

| CURRENT FOCUS Relationship banking & focused deposit gathering Align our products and services to our customers' needs BankThanks Reward Program Mobile Banking All-Purpose Small Business Packages with Interest Bearing Checking Accounts Drive core business growth Development of alternative delivery channels Improve pricing and mix of municipal deposits Credit risk management Maintaining prudent underwriting standards Continue credit and loss prevention discipline Reducing non-performing asset levels Maximize recovery of workout loans |

| PRESENTATION TOPICS Our Market Current Focus Financial Performance St. Edmond's Update |

| 2011 SUMMARY The Company recorded net income of $11.0 million for the year ended December 31, 2011, compared to a net loss of $9.0 million for the year ended December 31, 2010 After increasing its provision for credit losses in 2010, the Company recorded a decrease in 2011 from $70.2 million to $37.5 million Capital levels improved and remain notably strong with tangible capital to tangible assets increasing to 11.3% at December 31, 2011, compared to 10.2% at December 31, 2010 The Company lowered the cost of its liabilities to 1.01% for the year, from 1.31% by reducing borrowings and re-pricing higher cost deposits During 2011, the Company built a new mortgage banking team to originate and sell all agency eligible mortgage loans to better position the balance sheet for interest rate risk. In 2011, the Company sold $56.3 million of residential mortgage loans originated during the year and recorded non-interest income of $1.2 million related to these loan sales. |

| 2011 SUMMARY During the year, the Company took advantage of low interest rates to increase profitability, improve the Bank's capital position, and reduce the Bank's interest rate risk profile The Company's 2011 expense management reduction program resulted in $7.7 million in operating expense reductions and improved the Company's efficiency ratio The Company entered into a definitive merger agreement with SE Financial Corp., the holding company for St. Edmond's Federal Savings Bank on December 5, 2011. The merger will enhance our already strong presence in southeastern Pennsylvania and increase our market share in Philadelphia and Delaware counties. |

| STATEMENT OF OPERATIONS Returned to profitability in 2011 |

| COST OF LIABILITIES $ in millions Cost of deposits has significantly declined with steady growth in deposit balances Actively assessing and managing deposit mix, deposit balance levels and pricing to maximize NIM and ROE Aggressively re-priced and ran off the municipal deposit portfolio in 2011 |

| ASSET QUALITY - NPA's & LOAN CHARGE-OFFS Non-performing assets stabilized and started to decrease during 2011 The charge-off rate declined 142 bps from 2.53% to 1.11% in 2011 |

| ASSET QUALITY - ALLL COVERAGE RATIOS Even though we have started to see some signs of stabilization in the loan portfolio, we continue to build loan reserves Our ratio of ALLL to total loans increased from 1.62% to 2.10% Our ALLL as a percentage of NPL's (excluding guaranteed student loans) increased from 39.48% to 50.24% |

| EFFICIENCY RATIO Efficiency ratio has improved since 2010 due to effective cost management measures Focused on improving operating efficiency Additional non-interest expense anticipated in 2012 with build out of Credit and Lending functions (1) Includes restructuring charges incurred for the respective periods 72.1% (1) |

| INTEREST RATE RISK PROFILE STRENGTHENED Strategically reduced interest rate risk in 2011 to be better positioned for rising rates Note: The Up 200 bps simulation above is a projection based on a number of assumptions and should not be relied upon as an indication of actual results. |

| CAPITAL LEVELS STRENGHTENED & REMAIN STRONG |

| BENEFICIAL COMMON SHARE REPURCHASES Adopted a 2.5 million share repurchase program in 2011 (subsequently amended to 2.35 million shares on January 31, 2012) Company will continue to repurchase shares in accordance with program guidelines Approximately 2.182 million shares remaining to be repurchased under the Plan |

| PRESENTATION TOPICS Our Market Current Focus Financial Performance St. Edmond's Update |

| ST. EDMOND'S TRANSACTION HIGHLIGHTS In-Market Strategic Acquisition Strengthens Presence within our Footprint Enhances customer base in 3 PA locations, and provides us with a presence in 2 new locations Will become # 1 in affluent suburb of Ardmore Stronger presence in South Philadelphia adding over 3,900 accounts and $64 million in deposits with a loyal customer base. Provides us with a presence in Deptford, NJ and Roxborough, PA Favorable Economics Accretive to 2012 EPS (9 months of earnings assuming April 1, 2012 closing; 12% accretive on an annualized basis) (1) Approx. 45% Estimated Cost Savings (with an assumption of retaining key personnel) Low Capital Dilution Low Execution Risk Comprehensive due diligence process $300 million asset size allows for a simple, smooth, timely conversion In-market transaction Cost savings are achievable given market overlap and manageable size (1) Assumes $1.4 million in cost savings in 2012 |
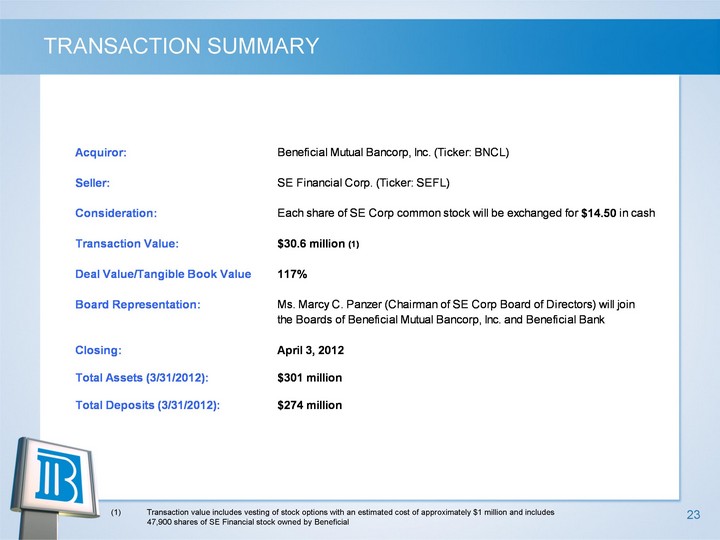
| TRANSACTION SUMMARY Transaction value includes vesting of stock options with an estimated cost of approximately $1 million and includes 47,900 shares of SE Financial stock owned by Beneficial |

| STRENGTHENS BENEFICIAL'S FOOTPRINT & DENSITY Beneficial: 60 locations St. Edmond's: 5 locations Beneficial maintains its rank as the largest Thrift in Philadelphia MSA and 9th overall In-Market Transaction strengthens customer base within footprint; will be # 1 in Ardmore Branch overlap at 3 locations provides opportunity for approx. 45% Cost Savings |

| PRO FORMA FINANCIAL IMPACT Favorable Economics Accretive to EPS immediately in 2012 (excluding merger expenses) Estimated Cost Savings of $1.8 million in 2012 and $3.6 million in 2013 Fully converted tangible book value dilution estimate of 1.7% Pro Forma Capital Position Remains Strong TCE/TA projected at 10.45% Tier 1 Leverage projected at 9.21% |
