Attached files
| file | filename |
|---|---|
| 8-K - FORM 8-K - AMERIANA BANCORP | d355436d8k.htm |
 Ameriana Bancorp
Annual Meeting
May 17, 2012
CEO Presentation
Exhibit 99.1 |
 Forward-Looking Statement
This presentation contains forward-looking statements,
which include statements about Ameriana’s future
financial performance, business plans and strategies.
Forward-looking statements involve future risks and
uncertainties, because of factors that could cause actual
results to differ materially from those expressed or
implied. Specific risk factors and other uncertainties that
could affect the accuracy of forward-looking statements
are included in Ameriana’s Form 10-K for the year ended
December 31, 2011. |
 Ameriana Bancorp
Annual Financial Performance
(Dollars in Thousands)
Year Ended
December 31,
2011
2010
Interest Income
$18,794
$19,985
Interest Expense
4,870
6,574
Net Interest Income
13,924
13,411
Provision for Loan Losses
1,385
1,933
Non-Interest Income
5,628
5,650
Non-Interest Expense
17,004
16,817
Income before Income Taxes
1,163
311
Income Tax Expense (Benefit)
21
(242)
Net Income
$ 1,142
$ 553 |
 Ameriana Bancorp
Quarterly Financial Performance
(Dollars in Thousands)
Three Months
Ended March 31,
2012
2011
Interest Income
$ 4,559
$ 4,766
Interest Expense
1,042
1,337
Net Interest Income
3,517
3,429
Provision for Loan Losses
255
360
Non-Interest Income
1,280
1,389
Non-Interest Expense
4,119
4,401
Income before Income Taxes
423
57
Income Tax Expense (Benefit)
78
(64)
Net Income
$ 345
$ 121 |
 Ameriana Bank Capital (as of 3/31/12)
Bank
Peer
Tier 1 Leverage Capital
8.98%
9.54%
Tier 1 RBC/Risk Wtd. Assets
12.42
14.25
Total RBC/Risk Wtd. Assets
13.69
15.51
Source: FDIC UBPR 3/31/2012 |
 Key
Metrics (as of 3/31/12) Bank
Peer
Non-accrual Loans/Total Loans
2.88%
2.67%
NCL+ OREO/Lns. + OREO
5.16
4.04
Net Loss/Avg. Loans
0.45
0.39
ALLL/Total Loans
1.28
1.89
Current Rest. Loans/Total Loans
2.02
0.92
Source: FDIC UBPR 3/31/2012 |
 Ameriana Bancorp
Financial Performance
(First Quarter 2012)
Positive Factors:
* On a fully tax-equivalent basis Eleven consecutive profitable quarters
Investments provided gains on sale
Net interest margin of 3.76% *, an improvement of 1.7 bps
over the 4
th
quarter of 2011
Increases in other service charges, brokerage and
insurance revenues
Non-interest expense decreased $282M from the same
quarter of 2011
The deposit mix continues to improve
Credit quality is slowly improving
•
•
•
•
•
•
• |
 Ameriana Bancorp
Financial Performance
Asset yields are somewhat below peer
Funding costs are somewhat higher than peer
Assets per employee is low (i.e. excess capacity)
DDAs, although increasing, remain below high
performing peer banks
Other non-personnel expenses are higher than peer
Personnel expense, due to number of offices,
is
higher than peer
Credit costs remain significant and negatively impact
earnings
Negative Factors:
•
•
•
•
•
•
• |
 Financial Performance (First Quarter 2012)
Profitability: (% of Avg. Assets)
Bank
Peer
Interest Expense
1.04
0.79
Other Operating Expense
1.06
0.97
Occupancy Expense
0.57
0.36
Personnel Expense
1.98
1.54
Total Overhead Expense
3.61
2.89
Efficiency
Ratio
82.09
66.43
Assets
Per
Employee
(in
millions)
2.84
4.70
Avg.
Pers.
Exp.
Per
Employee
($
Million)
55.56
68.81
Source: FDIC UBPR 3/31/2012 |
 Financial Performance (First Quarter 2012)
Profitability: (%)
Bank
Peer
Avg. Earning Assets/Avg. Assets
87.84
93.16
Avg. Int. Bearing Fds/Avg. Assets
84.08
79.23
Int. Expense/Avg. Earning Assets
4.80
4.64
NII/Average Earning Assets
3.76
3.83
Net Loans/Avg. Assets
71.81
62.20
Source: FDIC UBPR 3/31/2012 |
 Financial Performance (First Quarter 2012)
Profitability: (%)
Bank
Peer
Securities/Avg. Assets
9.91
20.09
DDA/Avg. Assets
5.53
8.57
CDs/Avg. Assets
32.67
15.07
Core Deposits
79.01
76.42
FHLB/Avg. Assets
6.92
2.74
Source: FDIC UBPR 3/31/2012 |
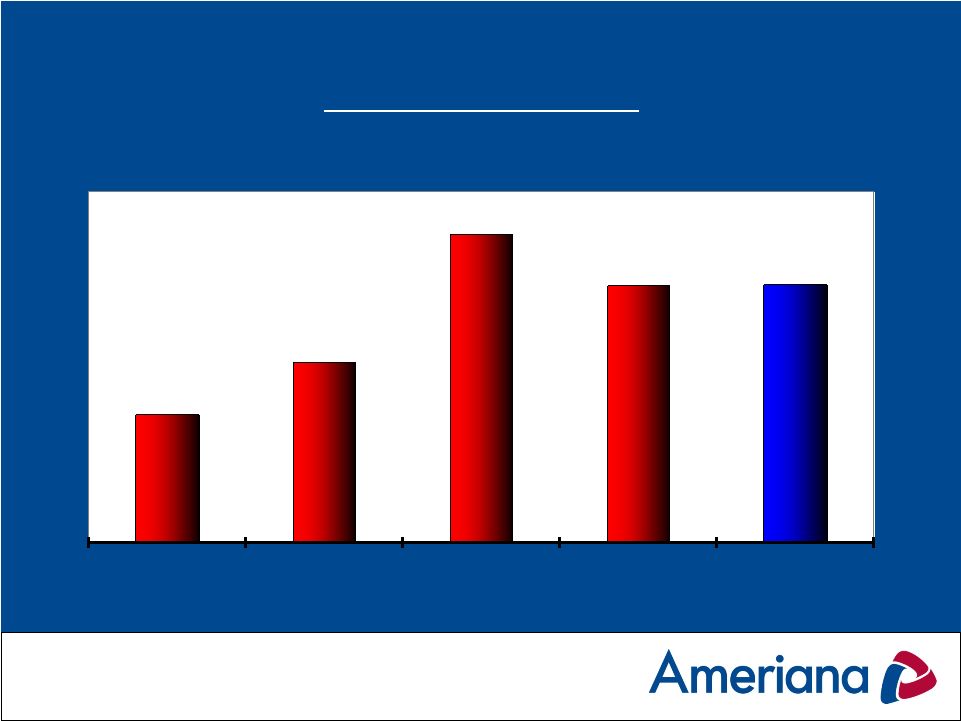
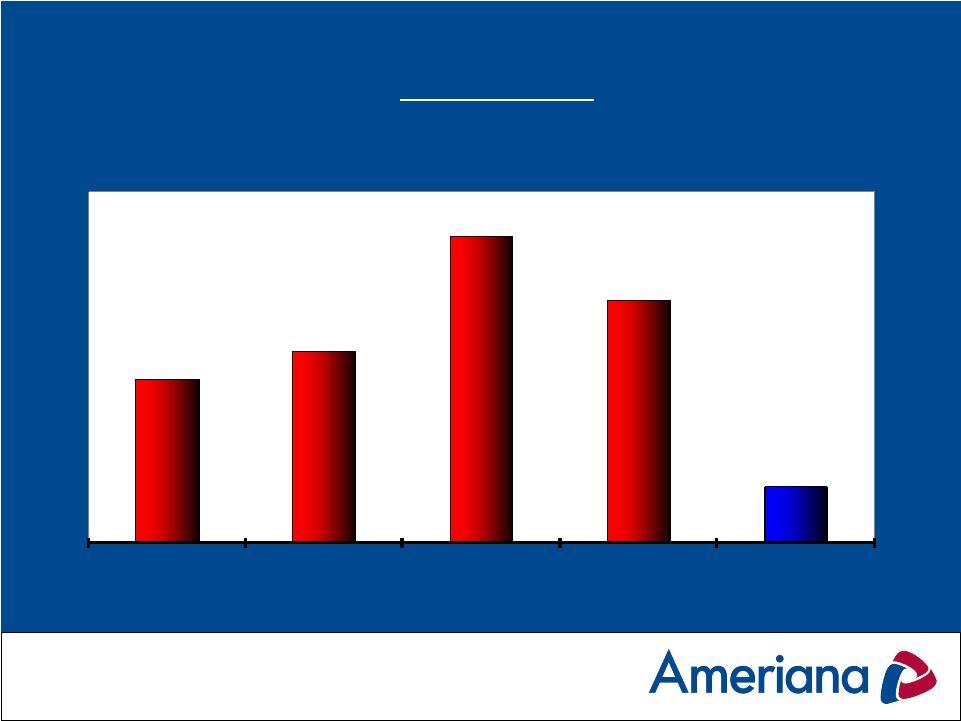
 Total Loans
(Dollars in Thousands)
$325,864
$326,573
$317,595
$317,087
$314,355
12/31/2008
12/31/2009
12/31/2010
12/31/2011
3/31/2012 |
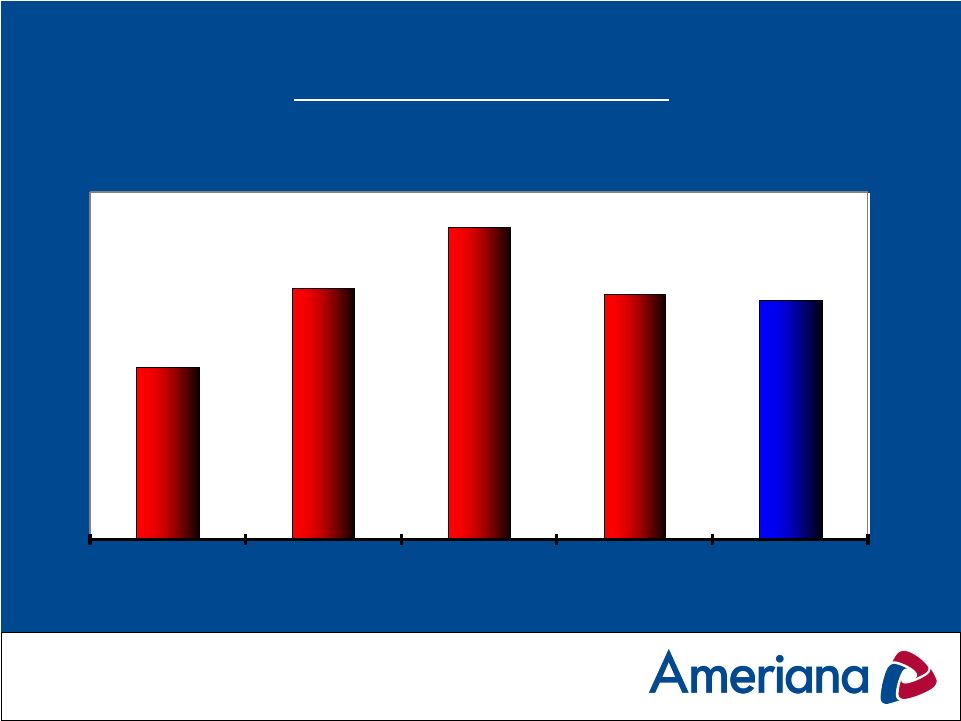
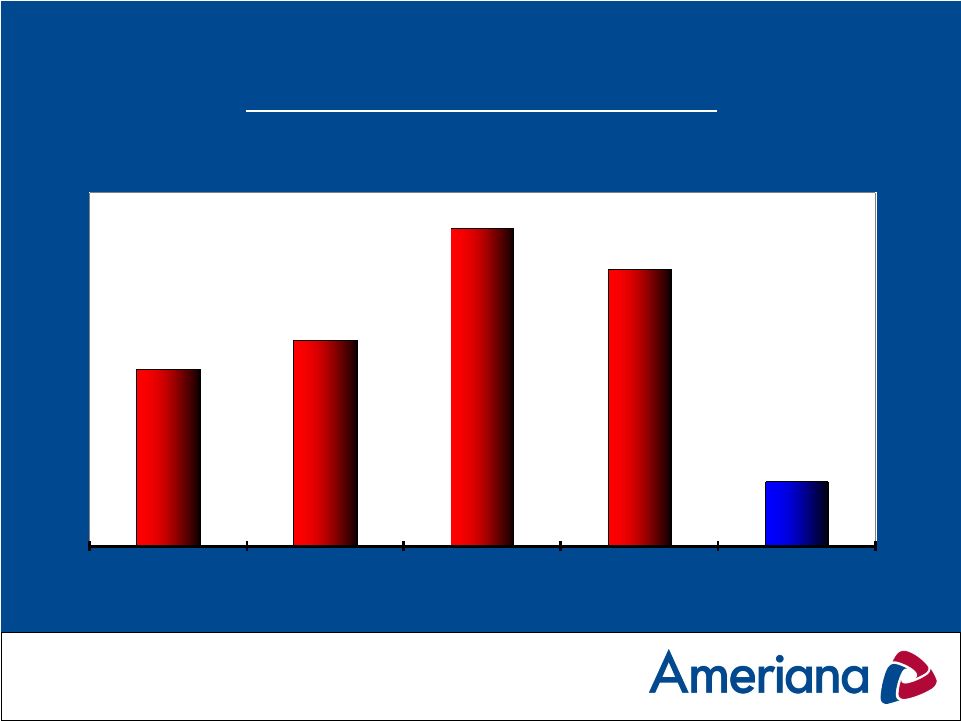
 Total Deposits
(Dollars in Thousands)
$324,406
$338,381
$337,978
$337,250
$354,872
12/31/2008
12/31/2009
12/31/2010
12/31/2011
3/31/2012 |
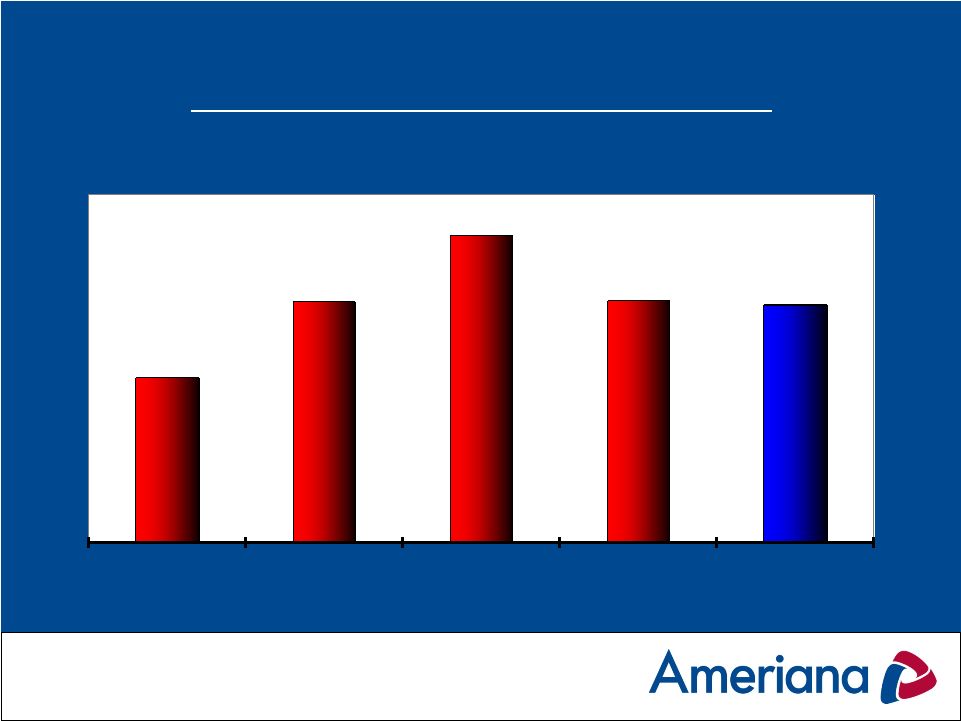
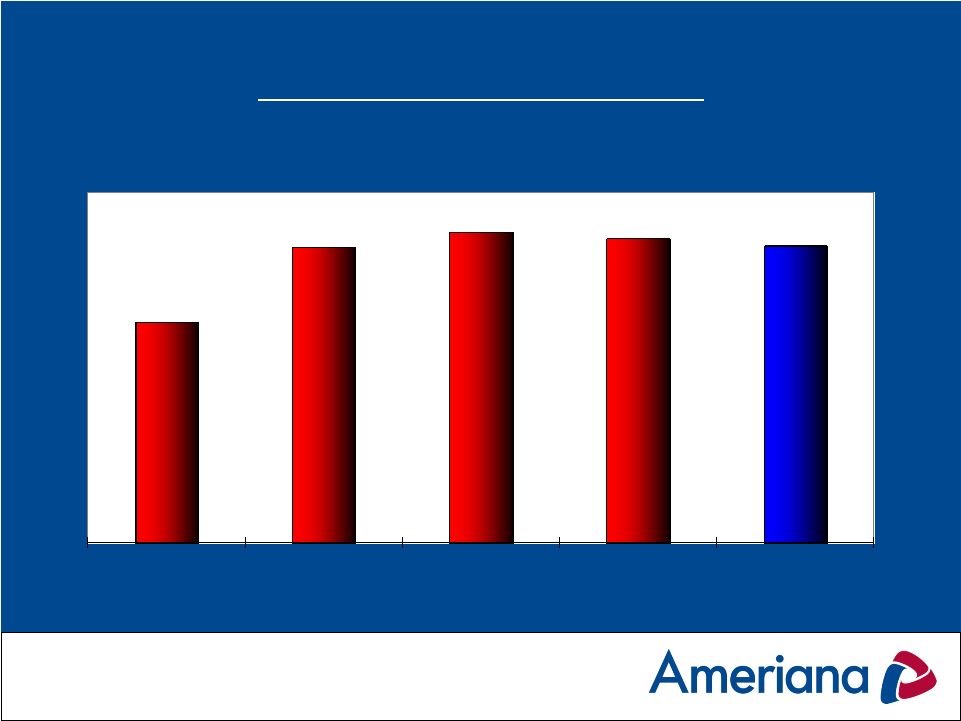
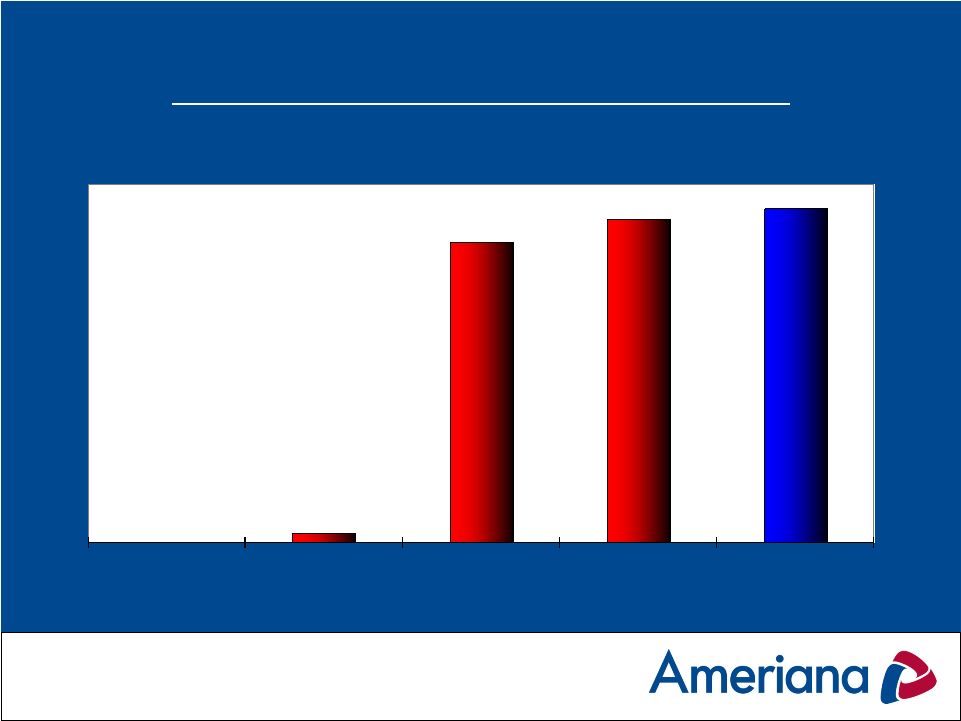
 Net Interest Income
(Dollars in Thousands)
$11,793
$12,689
$13,411
$13,924
$3,517
2008
2009
2010
2011
1Q 2012 |
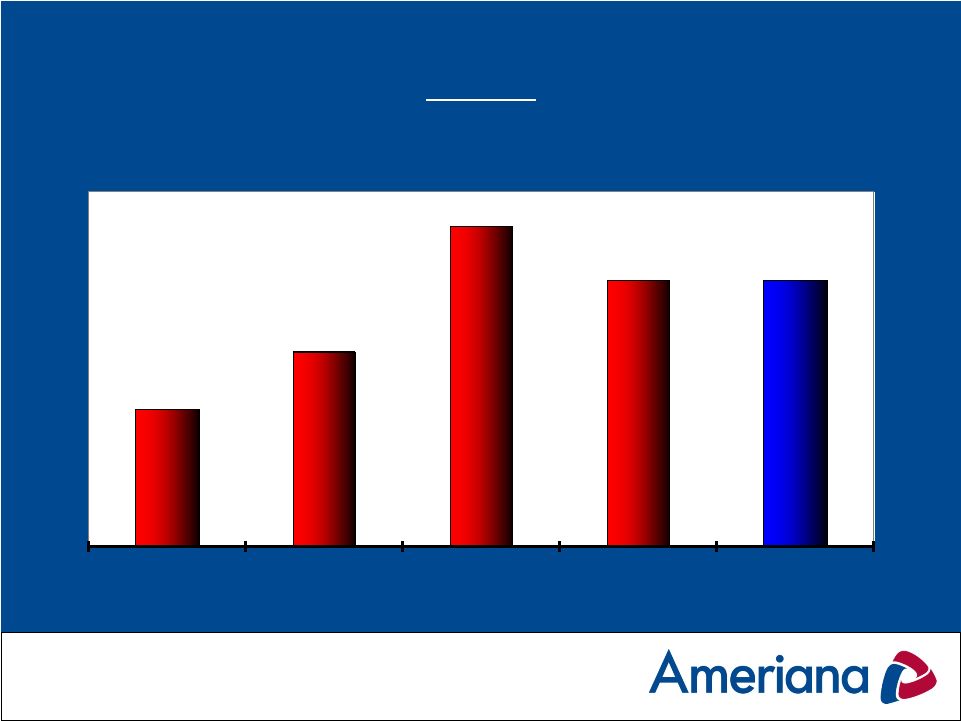
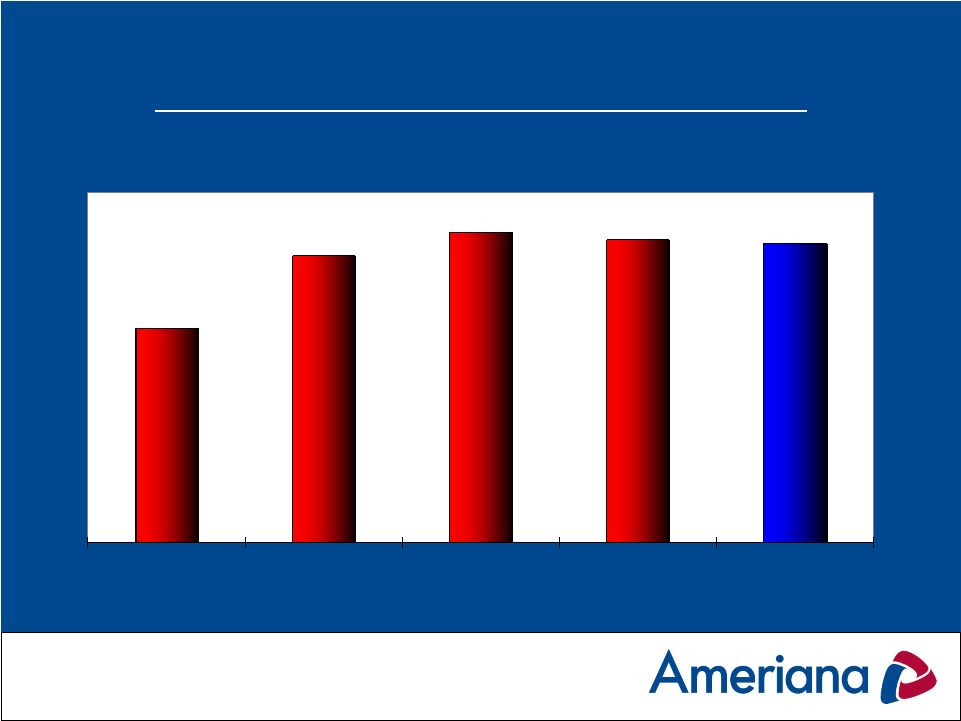
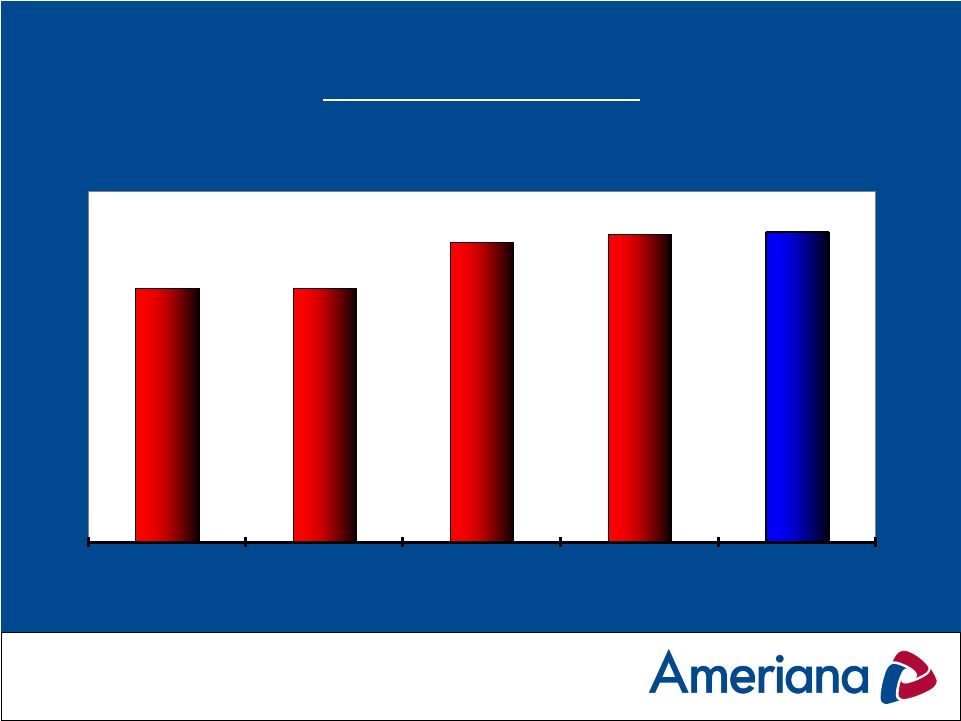 Net Interest Margin
(on a fully tax-equivalent basis)
3.08%
3.08%
3.63%
3.74%
3.76%
2008
2009
2010
2011
1Q2012 |
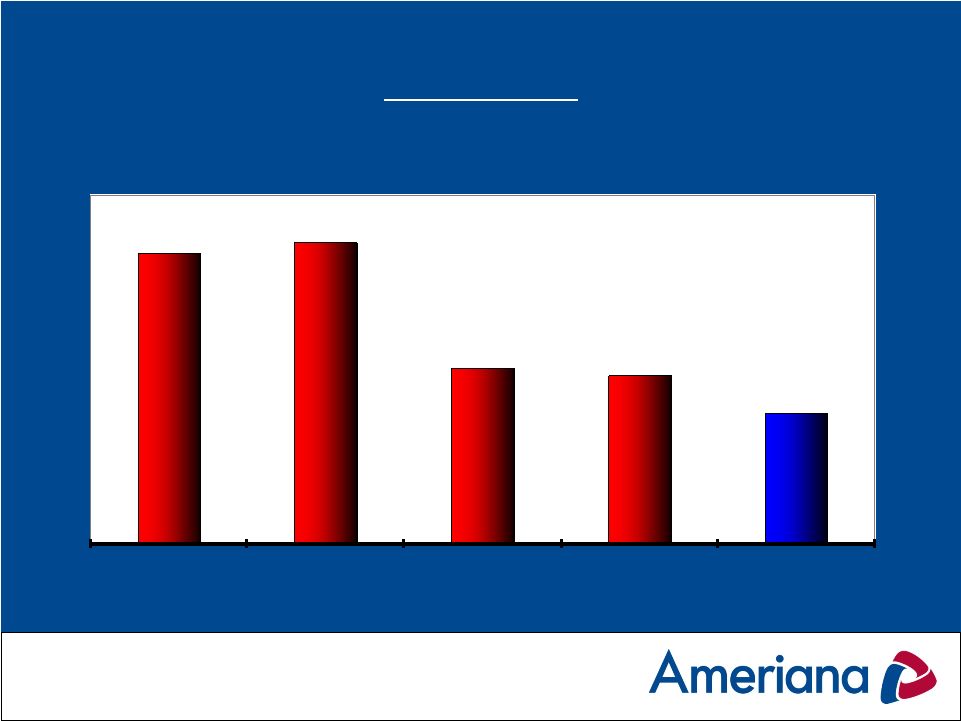
 Non-Performing Loans
(Dollars in Thousands)
$6,219
$9,053
$11,247
$8,828
$8,620
12/31/2008
12/31/2009
12/31/2010
12/31/2011
3/31/2012 |
 Non-Performing Loans/Total Loans
1.91%
2.78%
3.54%
2.79%
2.74%
12/31/2008
12/31/2009
12/31/2010
12/31/2011
3/31/2012 |
 OREO
(Dollars in Thousands)
$3,881
$5,517
$9,067
$7,545
$7,545
12/31/2008
12/31/2009
12/31/2010
12/31/2011
3/31/2012 |
 OREO/Total Loans
1.19%
1.68%
2.86%
2.39%
2.40%
12/31/2008
12/31/2009
12/31/2010
12/31/2011
3/31/2012 |
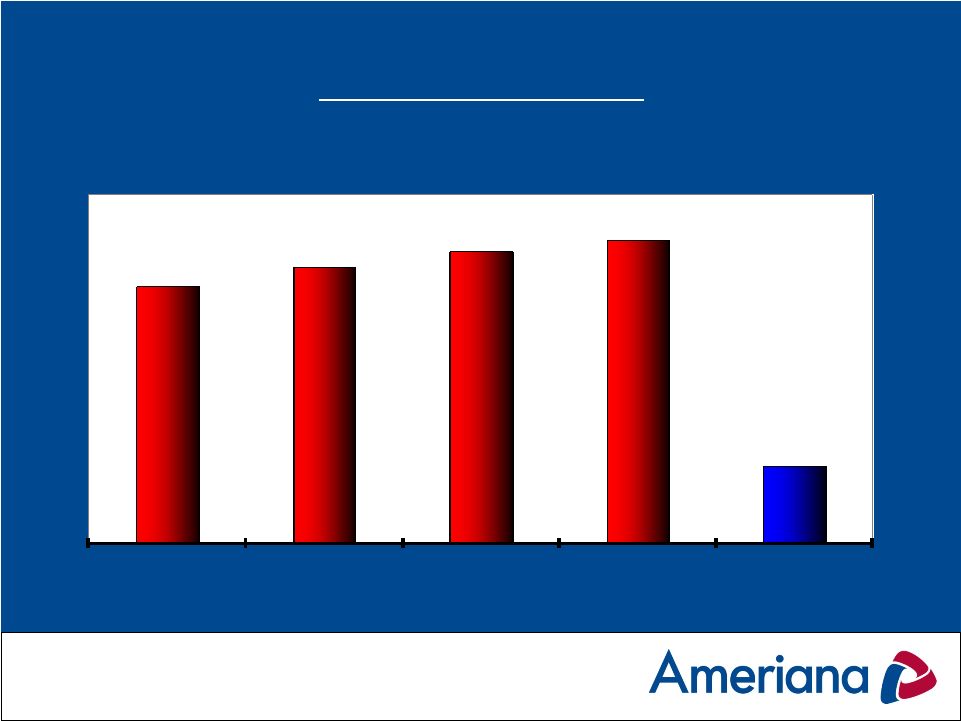
 Charge-offs
(Dollars in Thousands)
$1,051
$1,230
$1,970
$1,560
$365
2008
2009
2010
2011
1Q2012 |
 Net Charge-offs/ Avg. Loans
0.30%
0.35%
0.54%
0.47%
0.11%
2008
2009
2010
2011
1Q2012 |
 Allowance for Loan Losses
(Dollars in Thousands)
$2,991
$4,005
$4,212
$4,132
$4,032
12/31/2008
12/31/2009
12/31/2010
12/31/2011
3/31/2012 |
 Allowance for Loan Losses/Total Loans
0.92%
1.23%
1.33%
1.30%
1.28%
12/31/2008
12/31/2009
12/31/2010
12/31/2011
3/31/2012 |
 Largest Non-Accrual Loans (as of 3/31/2012)
($ in Millions)
•
Commercial Land Development
$1.123
•
Condominium Development
$1.103
•
Commercial Land Development
$0.938
•
Single-Family
Residential
$0.781
•
Single-Family Residential
$0.522
•
Commercial Real Estate
$0.352
Sub-total
$4.819
•
Residential, including lots (31 loans)
$3.065
•
Commercial (7 loans)
$0.623
Total Non-Accrual Loans (as of 3/31/2012)
$8.507 |
 Largest OREO (as of 3/31/2012)
($ in Millions)
•
Retail Strip Center –
Partially Occupied
$2.507
•
Single Family Residence -
Rented
$0.924
•
Land and developed lots
$0.877
•
Single Family Residence -
Rented
$0.837
•
Land and partially completed apartments
$0.500
Sub-total
$5.645
Total OREO (as of 3/31/2012)
$7.545 |
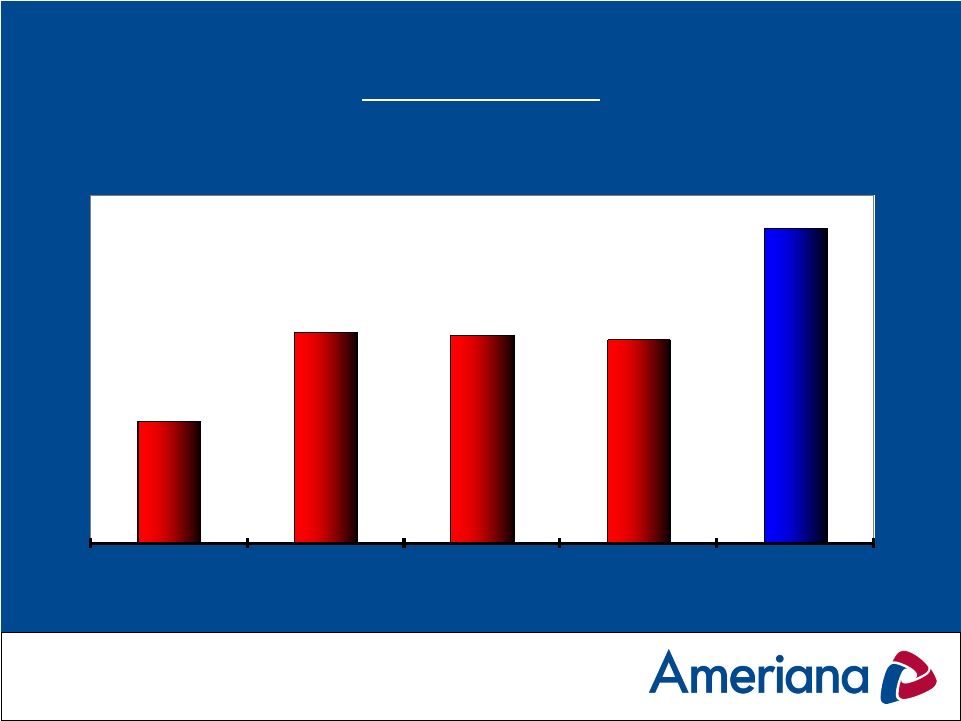
 Troubled Debt Restructurings (TDRs)
(Dollars in Thousands)
$0
$268
$8,393
$9,016
$9,325
12/31/2008
12/31/2009
12/31/2010
12/31/2011
3/31/2012 |
 Composition of Troubled Debt Restructurings
(TDRs -
as of 3/31/2012)
•
$4.5 million hotel loan
-
Substandard
•
$1.5 million residential loans (11)
-
Substandard
•
$0.6 million commercial loan (2)
-
Substandard
•
$1.1 million condo construction loan
-
Doubtful
•
$0.9 million residential loans (5)
-
Doubtful
•
$0.3 million commercial loans (3)
-
Doubtful
•
$0.4 million residential loans (5)
-
Pass
•
$9.3 million -
Total |
 Key Challenges for 2012
•
Margin Compression is likely
Low short-term interest rates, steep yield curve
Lack of viable investment alternatives
Deposit pricing is at all time lows
Extremely competitive loan pricing
Consumers preference for short-term money
market accounts
•
Regulatory and accounting environment
Dodd -
Frank
Basel III
FASB pronouncements |
 Industry Challenges for 2012
•
Economic Conditions
Current economic conditions slowly improving
Resurgent U.S. auto industry and regional impact
Continued price decline of residential housing market
Residential foreclosures still flooding the market
Continued unemployment
•
Uncertainty of the future of the GSEs
•
Competition
•
Capital
•
Liquidity
•
Global unrest and sovereign risk |
 Key Objectives for 2012
•
Asset Quality
•
Earnings
•
Capital
•
Liquidity
•
Customer and Brand Experience/Service Performance
•
Regulatory and Enterprise Risk Management
•
Technology Implementation and Operational Improvement
•
People |
 Asset Quality Objectives for 2012
•
Reduce the level of criticized and classified credits to
$8.0 million
•
Reduce OREO to $5.0 million
•
Maintain an adequate ALLL
•
Ensure proper risk rating of all loans
•
Obtain risk-adjusted pricing for loans |
 Earnings Objectives for 2012
•
Achieve net income of $2,059,000 for Bank
and $1,482,000 on a consolidated basis
•
Maintain our net interest margin
•
Increase fee income from lending
•
Reduce credit losses and OREO expenses
•
Increase fee income from AFS and AIA
•
Increase new checking accounts and demand
deposit balances
•
Reduce non-interest expense |
 Capital Objectives for 2012
•
Maintain well-capitalized status: minimum of 8.5%
Tier 1 Capital and 12.0% Total Risk Based Capital
•
Build capital to mitigate loan losses, and for acquisition
or expansion purposes
•
Evaluate other strategies for raising capital needed to
grow earning assets or for expansion |
 Liquidity Objectives for 2012
•
Maintain adequate on balance sheet liquidity
•
Meet or exceed all board established minimums and
regulatory standards
•
Monitor and adjust to changes in sources of liquidity
due to changing collateral requirements
•
Increase low cost deposit balances |
 Customer and Brand Experience/Service Performance
for 2012
•
Build on our “Welcome Home”
experience
•
Incorporate the skill from Priosys into all customer
interactions
•
Incorporate 360 Degrees of Service into our daily
routines
•
Enhance our community focused brand position
•
Increase the impact from our participation in
community events
•
Continue Refer-a-Friend |
 Customer and Brand Performance/Service Performance
for 2012
•
Build on our financial advising competency, including
our platform sales initiative
•
Continue Life/Money Chats
•
Conduct regular mystery shops and customer
satisfaction surveys
•
Provide meaningful training and educational
opportunities for all Associates
•
Measure, monitor and coach enhanced sales and
service, i.e. Custom Blend |
 Regulatory and Enterprise Risk Management
Objectives for 2012
•
Meet regulatory standards for risk management and
measurement
•
Monitor enterprise risk standards and meet Board
established guidelines
•
Meet the requirements of Dodd –
Frank
•
Evaluate the impact of Basel III Capital Standards
•
Meet FASB and SEC financial reporting standards |
 Technology Implementation and
Operational Improvement for 2012
•
Continue implementation of new systems included in the
five year technology plan
•
Enhance our mobile banking solution
•
Upgrade our on-line banking system
•
Improve all operating processes to streamline and
automate account processing |
 People Plan for 2012
•
Improve career counseling
•
Be an employer of choice and be recognized as a
“best place”
to work
•
Implement on-line time card record keeping system
|
 Stock Performance
Source: SNL Financial
Change %
As of 5/09/2012
YTD
1 Year
3 Years
SNL Bank & Thrift
19.85
(5.67)
1.35
SNL Bank < $500mm
17.48
0.29
(0.82)
KBW Bank
19.56
(6.88)
8.00
NASDAQ Bank
11.60
0.66
3.22
SNL Micro Cap
17.29
(8.64)
(6.66)
ASBI
35.10
7.62
42.67 |
 Questions? |