Attached files
| file | filename |
|---|---|
| 8-K - FORM 8-K - Fortune Brands Home & Security, Inc. | d352329d8k.htm |
 JP
Morgan Home Building and Building Products Conference
May 16, 2012
Exhibit 99.1
Advantage:
Fortune Brands
Home & Security |
 2
Fortune Brands
Home & Security
Disclaimer
Please note that the information included in this presentation
contains statements relating to future results, which are forward-
looking statements. We caution you that these forward-looking
statements speak only as of the date hereof, and we have no
obligation to update them. Actual results may differ materially
from those projected as a result of certain risks and uncertainties,
including the risks described in our annual report on Form 10-K as
filed with the SEC. For more information, including reconciliations
of certain non-GAAP financial information presented herein,
please
visit
the
“Investor
Center”
on
the
Company’s
website
at:
www.FBHS.com. |
 3
Fortune Brands
Home & Security
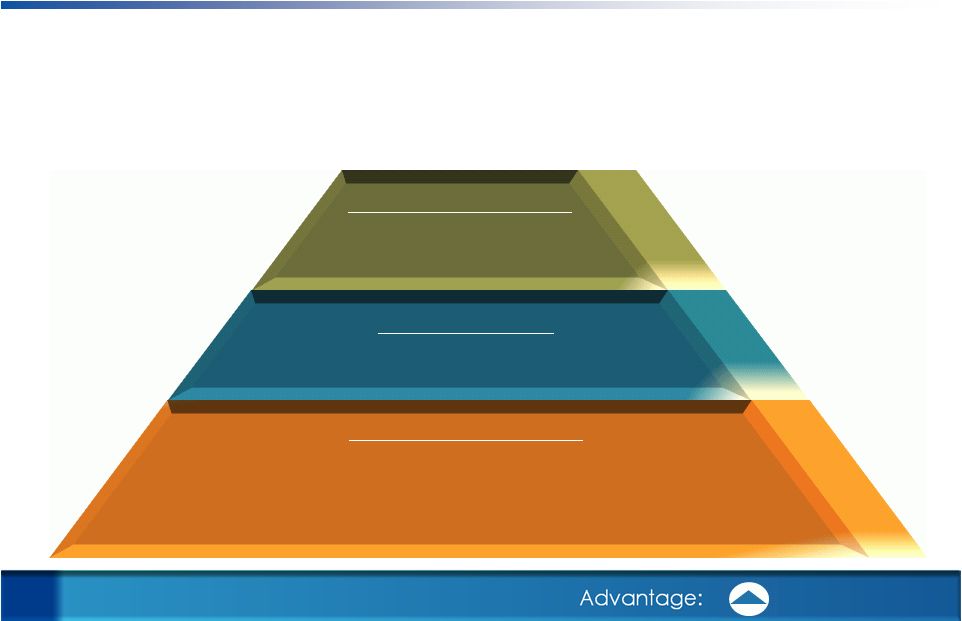
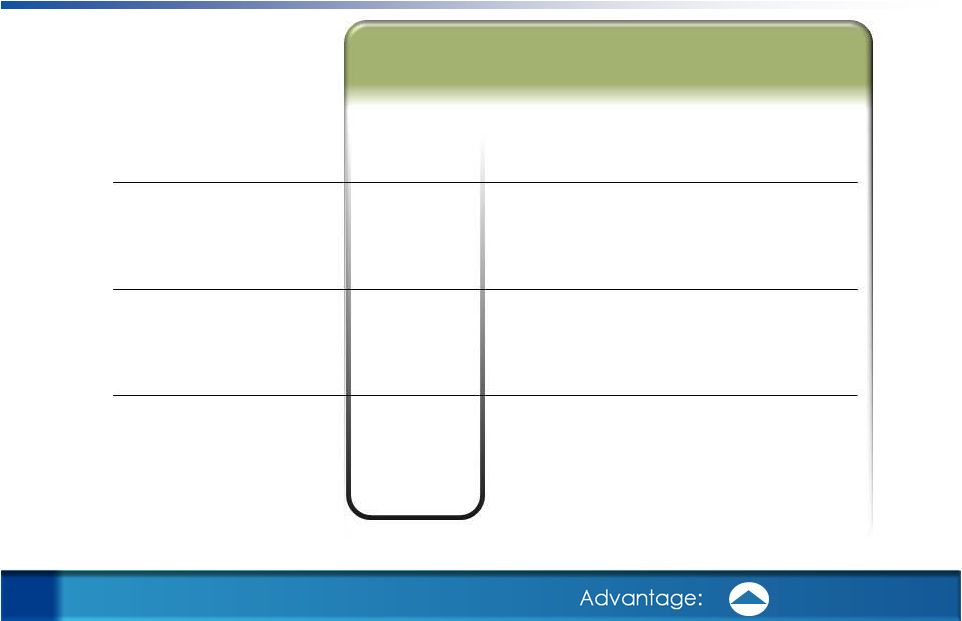
Our solid business model, which was fortified by the downturn, is the
foundation on which strong performance and market share growth is built.
Market Recovery
Strong Free Cash Flow
Effective Capital Deployment
Market Recovery
Share Gains
Attractive Product Categories
Consumer Driven Innovation
Operational and Management Excellence
Demonstrated Ability to Outperform the Market
Strong Capital Structure
Solid
Business
Model |
 4
Fortune Brands
Home & Security
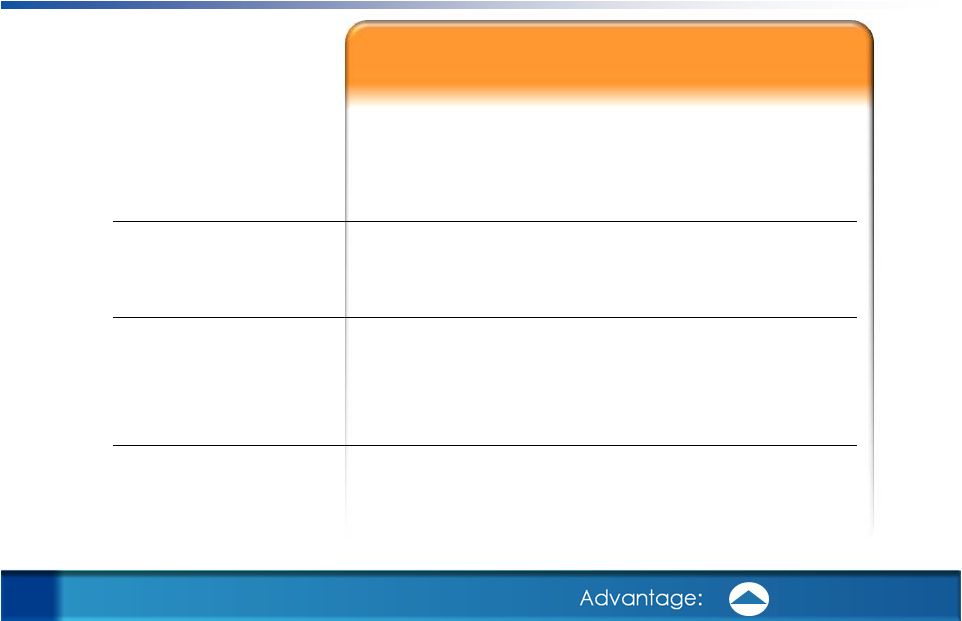
We believe this foundation and the aggressive moves we’ve made over the
past 3 years will allow us to continue to grow our market share and
leverage the housing market recovery.
Attractive Product Categories
Consumer Driven Innovation
Operational and Management Excellence
Demonstrated Ability to Outperform the Market
Strong Capital Structure
Market Recovery
Share Gains
Organic Growth
Solid
Business
Model |
 5
Fortune Brands
Home & Security
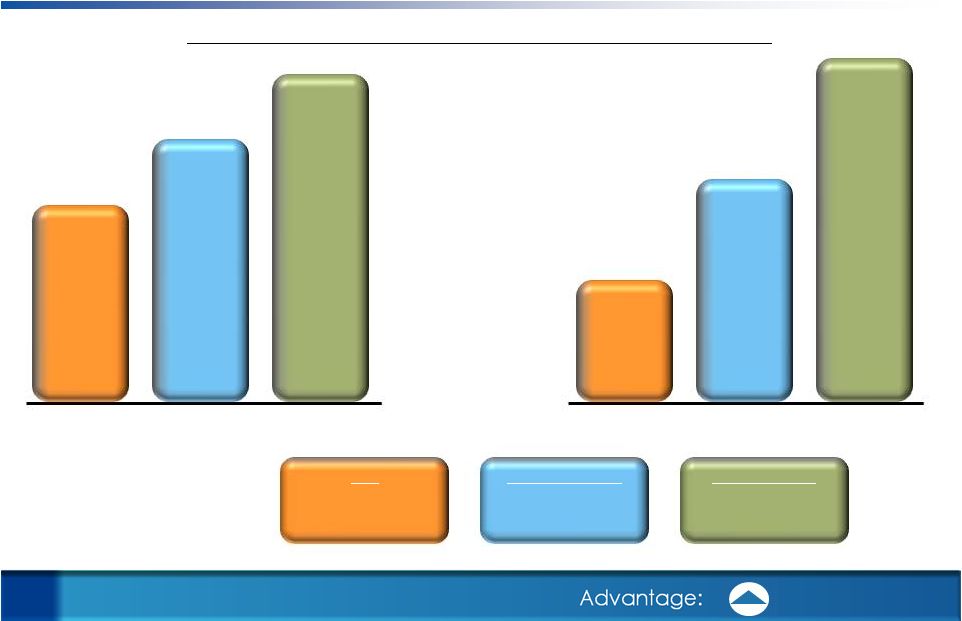
In addition, growing free cash flow and leveraging our strong balance sheet
can provide incremental growth opportunities.
Attractive Product Categories
Consumer Driven Innovation
Operational and Management Excellence
Demonstrated Ability to Outperform the Market
Strong Capital Structure
Free Cash Flow
Leverage Capital Structure
Market Recovery
Share Gains
Incremental Growth
Organic Growth
Solid
Business
Model |
 6
Fortune Brands
Home & Security
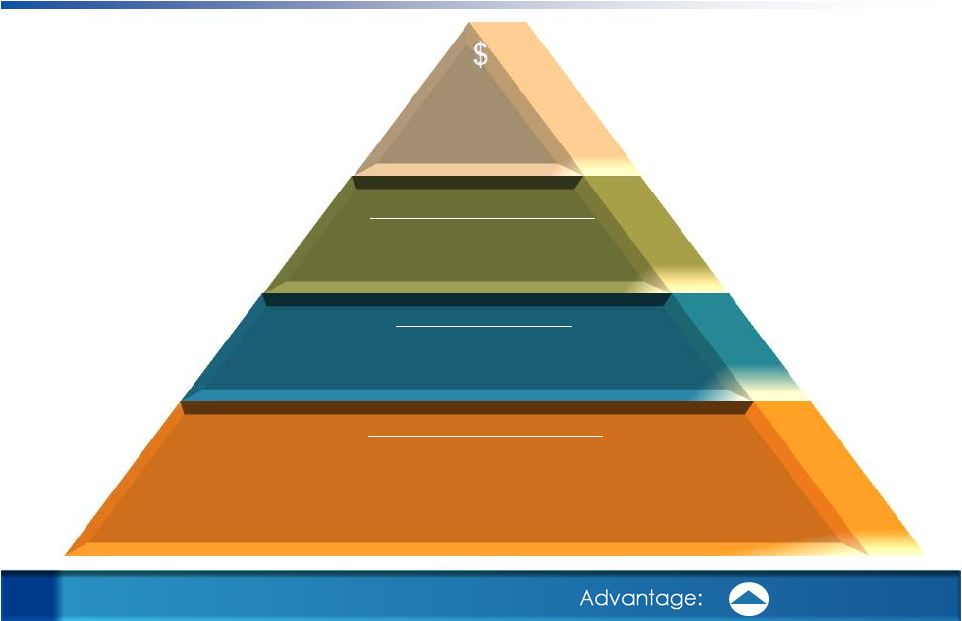
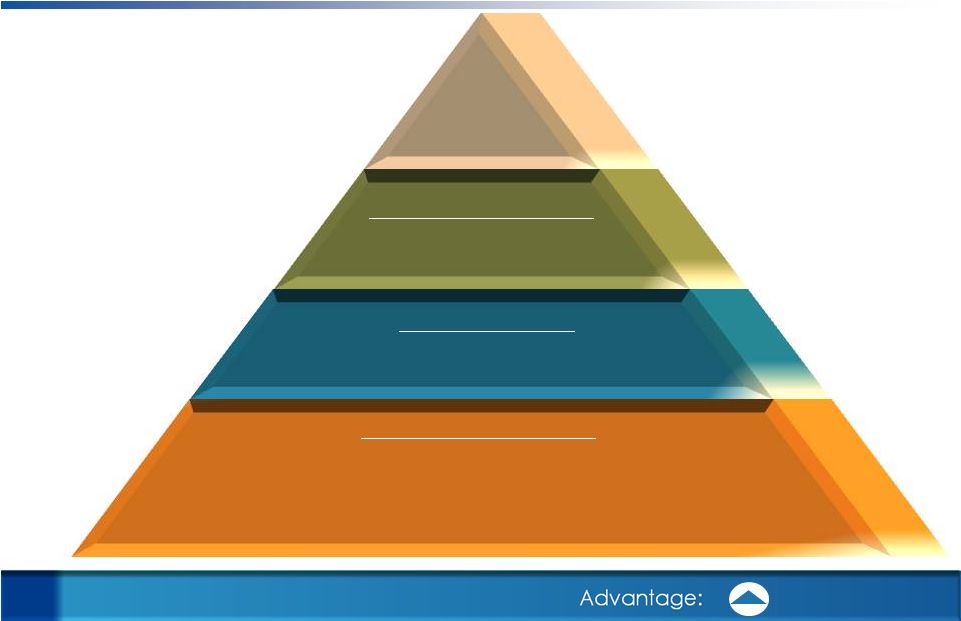
Long-term
Value
Creation
We believe our solid business model, growing free cash flow, and
strong
capital structure will create long-term shareholder value, both as the
market recovers and beyond the recovery.
Attractive Product Categories
Consumer Driven Innovation
Operational and Management Excellence
Demonstrated Ability to Outperform the Market
Strong Capital Structure
Long-term
Value
Creation
Free Cash Flow
Leverage Capital Structure
Incremental Growth
Market Recovery
Share Gains
Organic Growth
Attractive Product Categories
Consumer Driven Innovation
Operational and Management Excellence
Demonstrated Ability to Outperform the Market
Strong Capital Structure
Solid Business Model |
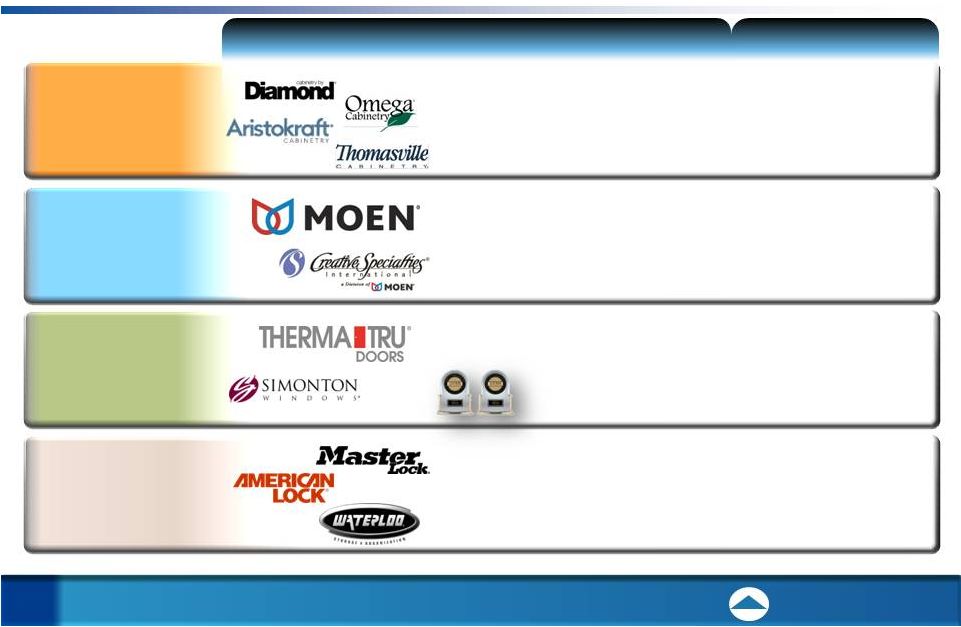 Brand Leadership
Position
We have leading brands and businesses in each segment, with
differentiated positions across categories and channels.
•
Primary
strength
in
dealer
channel
•
Fully
integrated
platform
•
Poised
to
leverage
scale
across
multiple
brands,
channels
and
price
points
•
Trusted
by
consumers
for
delivering
durable
dependable
products
•
Strength
with
builders
creates
wholesale
demand
•
Powerful
engine
for
growth
and
profitability
•
Leaders poised to leverage
the market recovery
•
Accelerating innovation
•
Building momentum
in global safety
•
Exceptional brand with growth
potential well beyond padlocks
•
More stable market not tied
to housing cycle
Kitchen & bath cabinet
manufacturer in
North America
Faucet brand in
North America
Fiberglass residential entry
door brand in U.S.
Padlock brand in
North America
#1
#1
#1
#1
Winner of two consumer
and five builder awards
from J.D. Power
Fortune Brands
Home & Security
7
Advantage:
Kitchen
& Bath
Cabinetry
Plumbing
&
Accessories
Advanced Material
Windows & Door
Systems
Security
&
Storage |
 8
Fortune Brands
Home & Security
Sales
are
balanced
across
four
segments,
with
Cabinets
and
Windows
&
Doors
having
above
average
potential
to
leverage
in
a
recovery
while
Plumbing
and
Security
&
Storage
operate
with
higher
returns
across
all
cycles.
We
believe
all
segments
have
the
potential
to
return
to
2006
sales
levels
in
a
full
recovery.
2011 Net Sales by Segment
Net Sales
$ millions
Kitchen &
Bath Cabinetry
38%
Plumbing &
Accessories
29%
Advanced Material
Windows & Door Systems
16%
Security &
Storage
17%
Kitchen & Bath Cabinetry
$2,133
$1,256
Plumbing & Accessories
$1,125
$ 963
Windows & Door Systems
$ 850
$ 553
Security & Storage
$ 586
$ 557
2006
2011 |
 9
Fortune Brands
Home & Security
We have a balanced, diverse business mix that is more repair & remodel driven
today; but we expect to see new construction mix grow in a recovery.
International is 17% of sales with Canada 12% and China 3%.
by End
Market* by Channel* *Source:
Company internal estimates for year ended December 31, 2011 Domestic Home Products
Market* 2011 Sales
Repair & Remodel
47%
New Construction
19%
Security & Storage
13%
4%
Commercial
International
17%
Wholesale
29%
Home Centers
29%
Dealer
14%
Other Retail
8%
International
17%
Builder Direct
3%
Repair & Remodel
72%
New
Construction
28% |
 10
Fortune Brands
Home & Security
Consumer driven innovation has led to consistently winning profitable new
business and has driven long-term outperformance to the market.
Track
Record
of
Leading
New
Product
Launches
across
All
Business
Segments
Vented Sidelites
New
Glass
Styles
2012
2011
The Original
Adding value for customers and winning
new business
Cabinets:
•
Martha Stewart Living
cabinetry at Home
Depot
stores
in
the
US
and
Canada
•
In-stock cabinetry at Lowe’s
•
Logix
System -
our proprietary tools simplify
organization and storage
Plumbing:
•
Moen’s
MotionSense
for a hands-free
kitchen faucet experience,
Spot Resist
finish,
Reflex
kitchen pull-down system and
the
Twist
multi-function handheld shower
Security & Storage:
•
Master Lock’s
PulseCode
electronic lock and
the
dialSpeed
electronic combination lock
•
Growing Safety and Commercial business
24% of 2011 sales came from products
introduced in the last three years
Kitchen
& Bath
Cabinetry
Plumbing
&
Accessories
Advanced Material
Windows & Door
Systems
Security
&
Storage |
 11
Fortune Brands
Home & Security
We have demonstrated growth that has exceeded the market over an
extended period of time and through multiple cycles. Sales performance
reflects both organic growth and acquisitions.
includes housing recessions of ‘90-’91, ‘94-’96,
‘00-’01, ‘06-’11 Sales Growth Rate
1989 2011 FBHS Organic Sales
U.S. Home Products Market
New Construction and
Replace & Remodel
FBHS
GAAP Sales
1
Excludes impact of acquisitions and divestitures.
~2%
4%
9%
1 |
 12
Fortune Brands
Home & Security
We quickly and strategically restructured early in the downturn (2007-
2009), and believe our operating platform is more efficient and scalable
to support revenue up to $5B with normal capital spending levels.
Substantially improved cost structures by proactively reducing footprint
nearly 40% from 2006 to 2009 and creating more flexible supply chains
Increased productivity through continuous improvement investments
Maintaining capacity to ramp up with industry-leading service levels and lead times
Can support revenue of up to $5B without capital spending above normal levels
Operating Margin
1
Manufacturing Facilities
Sales:
1
Before charges/gains.
2006
2007
2008
2009
2010
$4.7B
$4.6B
$3.8B
$3.0B
$3.2B
2011
$3.3B
2011
14.4%
12.3%
8.1%
5.8%
4.9%
64
56
47
41
40
38
2.7%
2010
2009
2008
2007
2006 |
 13
Fortune Brands
Home & Security
Market Outlook —
We have raised our growth expectations for
the overall housing market from low-single digits to mid-single
digits
based
on
the
broad
firming
that
we
saw
in
the
1
quarter.
Growth Rate Assumption:
4%
Mid-to-High Teens
Mid-Single Digits
Initial
January
Updated
April
1-2%
Mid-Single Digits
2%
Replace & Remodel Market:
New Construction Market:
FBHS Market:
st |
 14
Fortune Brands
Home & Security
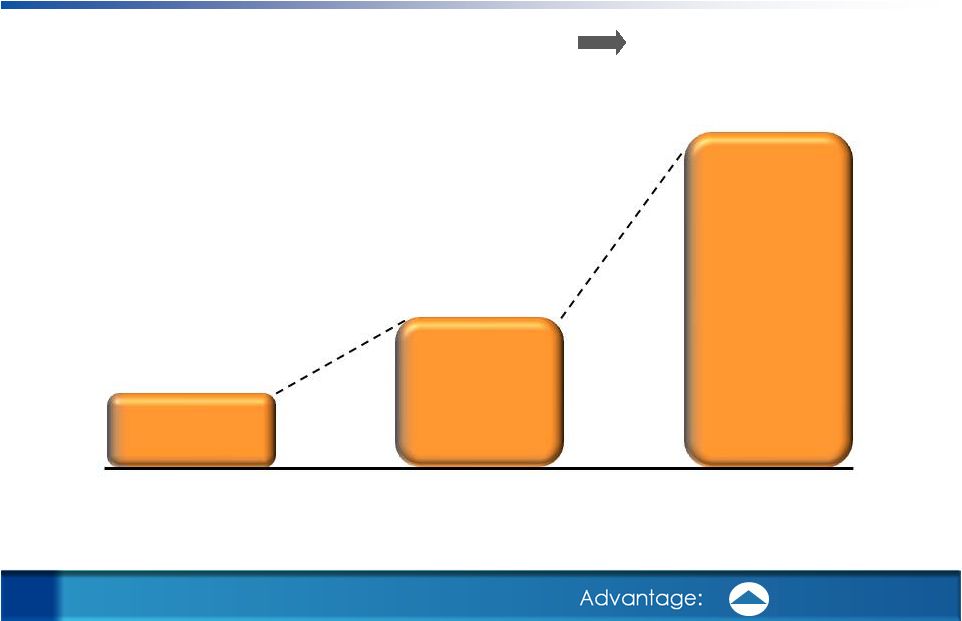
Growth opportunities initially reflect significant organic growth…but we are also focused
beyond the recovery, as we look for opportunities to leverage cash and a strong balance
sheet to expand into new markets and adjacent categories and return cash to
shareholders. “Capitalize on the Recovery”
-Organic Growth through Home Recovery
and the Impact of Share Gains
“Sustain Growth Beyond the Recovery”
-Market Expansion and Acquisitions with
Free Cash Flow and Capital Structure
Leverage brand building and consumer driven
innovation
Continue to gain market share and expand into
new channels
Drive organic international market growth
Continue to refine to our operating platform
Accelerate investment in market expansion
internationally for some segments
Acquire
to
expand
in
adjacent
markets
–
both
domestically and globally
Return cash to shareholders through some
combination of dividends and/or share
repurchases
Time |
 15
Fortune Brands
Home & Security
While the housing market slump has significantly reduced sales and profit, we believe the
business is positioned to return to previous levels when the housing market recovers. The
benefits of the more efficient operating platform should offset a potentially leaner
product mix. $ millions
2
Including incremental standalone corporate expenses.
Net Sales
$4,694
$3,007
$3,234
$3,329
% Growth
13%
(20%)
8%
3%
Operating Income
1
$ 678
$ 81
$ 187
$ 163
% Operating Margin
1
14%
3%
6%
5%
EBITDA
1
$ 826
$ 195
$ 296
$ 261
% EBITDA Margin
1
18%
6%
9%
8%
Unlevered Free Cash Flow
2
$ 464
$ 280
$ 146
$ 130
1
Before charges/gains.
2011
2010
2009
2006
Fiscal Year Ending December 31 |
 16
Fortune Brands
Home & Security
2012 is off to a solid start as we outperformed a market
that was stronger than anticipated.
$ millions, except EPS
Net Sales
$799
$715
12%
Market Growth
4%
Operating Income
$21
$3
533%
EBITDA
$45
$28
62%
% EBITDA Margin
6%
4%
EPS
$0.08
$0.00
2
Before charges/gains.
1
Company internal estimate of growth in the market for our home products.
1
2
2
2
2
2012
2011
% Change
Fiscal Q1 Ending March 31 |
 17
Fortune Brands
Home & Security
Flexible capital structure through a strong balance sheet and cash flow
should result in reduced risk and fuel incremental opportunities.
$ millions
Capital Structure:
(as of 3/31/12)
Term Loan
$350
Revolver ($650 facility)
70
Subsidiary Debt
11
Total Debt
$431
Net Debt/EBITDA
(as of 3/31/12)
1.1x
Balance
Sheet
Statistics:
(as
of
3/31/12)
Assets
$3,648
Total
Debt
431
Total
Liabilities
1,464
Equity
2,184
Trailing
12
Month
EBITDA
278
Debt-to-Capital
~16% |
 18
Fortune Brands
Home & Security
We raised our 2012 full year outlook based on an improved market
assumption, and we plan to continue to meaningfully outperform our market.
1
Before charges/gains.
EPS:
$0.77 –
$0.87
1
Net Sales:
High-Single Digit Growth
FBHS Market Assumption:
Mid-Single Digit Growth
Overall Housing Market Assumption:
Mid-Single Digit Growth |
 19
Fortune Brands
Home & Security
Longer term, we do not expect organic growth to be dependent on a full
market recovery for solid returns and cash flow, although returning to
“steady state”
is very attractive.
Potential Organic Market Recovery Scenarios
Operating Income
1
$200
$450
$700+
1
Before charges/gains.
Sales
Annual $ in B
$3
$4
$5
EBITDA
Annual $ in M
$300
$550
$800+
flat
~600,000
~0%
mid-recovery
~1,000,000
~3 –
4%
steady state
~1,500,000
~5 –
6%
Housing Starts
R&R Growth
1 |
 20
Fortune Brands
Home & Security
Free Cash Flow¹
Maintain 1.25x
Debt/EBITDA
Potential cash
available to drive
shareholder
value
Strong
cumulative
free
cash
flow
plus
maintaining
an
appropriate
debt
level
over
a
hypothetical
5-year
“steady
state”
recovery
cycle
could
fuel
exceptional value-creation opportunities.
$2.0B+
$1.4B
$600M+
1
Free cash flow is cash flow from operations less net capital expenditures plus proceeds from
the exercise of stock options. |
 21
Fortune Brands
Home & Security
Continue to invest in current businesses
-
products, markets, brands, supply chains
Return cash to shareholders
-
share buybacks and/or dividends
Pursue accretive acquisitions
In addition to investing in organic growth, we plan to use cash flow to create
additional returns and maximize shareholder value. The magnitude of potential
cash available could result in use of any or all of these strategies.
Primary focus on core categories
Fit within our market
attractiveness criteria
Ability to leverage existing capabilities,
market positions and structure
Good companies to be made great,
not turnarounds
New home & security categories
under two conditions:
–
Truly differentiated leader
with a capable management team
–
Clear path for organic growth
Acquisition Criteria |
 22
Fortune Brands
Home & Security
Long-term
Value
Creation
We believe our solid business model, growing free cash flow and strong
capital structure will create long-term shareholder value, both as the
market recovers and beyond the recovery.
Attractive Product Categories
Consumer Driven Innovation
Operational and Management Excellence
Demonstrated Ability to Outperform the Market
Strong Capital Structure
Free Cash Flow
Leverage Capital Structure
Market Recovery
Share Gains
Solid Business Model
Organic Growth
Incremental Growth
$ |
 Thank You
Advantage:
Fortune Brands
Home & Security |
Reconciliation of FBHS Net Sales Growth Rate to FBHS Organic Sales Growth
| Home & Security |
||||
| 1989-2011 Projected |
||||
| CAGR* |
||||
| Net sales growth (GAAP) |
9% | |||
| Net impact of acquisitions/divestitures |
(5)% | |||
|
|
|
|||
| Organic sales growth |
4% | |||
|
|
|
|||
* Compounded annual growth rate
Organic sales growth is the rate of compound annual net sales growth from 1989 through 2011, excluding the impact of acquisitions and divestitures. Organic sales growth is not a measure derived in accordance with GAAP. Management believes this measure provides useful supplemental information regarding the underlying level of sales growth. This measure may be inconsistent with similar measures presented by other companies.
Reconciliation of Operating Income before charges/gains to GAAP Operating Income (Loss)
| 2006 | 2009 | 2010 | 2011 | Q1 2011 | Q1 2012 | % change | ||||||||||||||||||||||
| (in millions) |
||||||||||||||||||||||||||||
| Operating income before charges/gains (1) |
$ | 678 | $ | 81 | $ | 187 | $ | 163 | $ | 3 | $ | 21 | 533 | % | ||||||||||||||
| Standalone corporate expenses (2) |
20 | 20 | 20 | 14 | 5 | — | (100 | )% | ||||||||||||||||||||
| Restructuring and other charges (3) |
(26 | ) | (52 | ) | (13 | ) | (20 | ) | (0 | ) | (2 | ) | 300 | % | ||||||||||||||
| Contingent acquisition consideration adjustment (4) |
— | — | — | — | — | 2 | — | |||||||||||||||||||||
| Business separation costs (5) |
— | — | — | (3 | ) | — | — | — | ||||||||||||||||||||
| Asset impairment charges |
— | — | — | (90 | ) | — | — | — | ||||||||||||||||||||
| Defined benefit plan accounting change (6) |
0 | 5 | 4 | (80 | ) | — | — | — | ||||||||||||||||||||
|
|
|
|
|
|
|
|
|
|
|
|
|
|
|
|||||||||||||||
| GAAP operating income (loss) |
$ | 672 | $ | 54 | $ | 198 | $ | (16 | ) | $ | 8 | $ | 21 | 170 | % | |||||||||||||
| (1) | Operating income before charges/gains is GAAP operating income (loss) adjusted to (i) exclude actuarial gains (losses) associated with the Company’s defined benefit plans, (ii) exclude asset impairment charges, (iii) exclude restructuring and other charges (iv) exclude business separation costs, (v) exclude income from a contingent acquisition consideration adjustment and (vi) include stand-alone corporate costs for the periods preceding the separation of the Company from Fortune Brands, Inc. Operating income before charges/gains is a measure not derived in accordance with GAAP. Management uses this measure to determine the returns generated by the Company and to evaluate and identify cost-reduction initiatives. Management believes this measure provides investors with helpful supplemental information regarding the underlying performance of the Company from year to year. This measure may be inconsistent with similar measures presented by other companies. |
| (2) | The Company estimates that it would have incurred approximately $14 million of incremental corporate expenses if it had functioned as an independent standalone public company for the twelve months ended December 31, 2011, approximately $20 million for each of the prior years and approximately $5 million in the three months ended March 31, 2011. |
| (3) | Restructuring charges are costs incurred to implement significant cost reduction initiatives and include workforce reduction costs and asset write-downs; “other charges” represent charges directly related to restructuring initiatives that cannot be reported as restructuring under GAAP. Such costs may include losses on disposal of inventories, trade receivables allowances from exiting product lines and accelerated depreciation resulting from the closure of facilities. |
| (4) | Represents gain attributable to reduction of estimated liability for contingent consideration associated with a business acquisition. |
| (5) | Business separation costs are costs related to non-cash non-recurring costs associated with the modification of share-based compensation awards as a result of the spin-off of the Company from Fortune Brands, Inc. |
| (6) | Defined benefit plan accounting change represents the impact on defined benefit plan expense of the actuarial gains (losses) associated with the Company’s defined benefit plans. |
Reconciliation of Before charges/gains Operating Margin to GAAP Operating Margin
| 2006 | 2007 | 2008 | 2009 | 2010 | 2011 | |||||||||||||||||||
| Before charges/gains operating margin (1) |
14.4 | % | 12.3 | % | 8.1 | % | 2.7 | % | 5.8 | % | 4.9 | % | ||||||||||||
| Standalone corporate expenses (2) |
0.4 | % | 0.4 | % | 0.5 | % | 0.7 | % | 0.6 | % | 0.4 | % | ||||||||||||
| Restructuring and other charges (3) |
(0.6 | )% | (2.0 | )% | (1.5 | )% | (1.7 | )% | (0.4 | )% | (0.6 | )% | ||||||||||||
| Business separation costs (4) |
— | — | — | — | — | (0.1 | )% | |||||||||||||||||
| Asset impairment charges |
— | — | (22.6 | )% | — | — | (2.7 | )% | ||||||||||||||||
| Defined benefit plan accounting change (5) |
0.0 | % | 0.2 | % | (2.6 | )% | 0.2 | % | 0.1 | % | (2.4 | )% | ||||||||||||
|
|
|
|
|
|
|
|
|
|
|
|
|
|||||||||||||
| GAAP operating margin |
14.3 | % | 10.9 | % | (18.0 | )% | 1.8 | % | 6.1 | % | (0.5 | )% | ||||||||||||
| (1) | Before charges/gains operating margin is operating margin derived in accordance with GAAP adjusted to (i) exclude actuarial gains (losses) associated with the Company’s defined benefit plans, (ii) exclude asset impairment charges, (iii) exclude restructuring and other charges (iv) exclude business separation costs, (v) exclude income from a contingent acquisition consideration adjustment and (vi) include stand-alone corporate costs for the periods preceding the separation of the Company from Fortune Brands, Inc. Before charges/gains operating margin is a measure not derived in accordance with GAAP. Management uses this measure to determine the returns generated by the Company and to evaluate and identify cost-reduction initiatives. Management believes this measure provides investors with helpful supplemental information regarding the underlying performance of the Company from year to year. This measure may be inconsistent with similar measures presented by other companies. |
| (2) | The Company estimates that it would have incurred approximately $14 million of incremental corporate expenses if it had functioned as an independent standalone public company for the twelve months ended December 31, 2011, approximately $20 million for each of the prior years and approximately $5 million in the three months ended March 31, 2011. |
| (3) | Restructuring charges are costs incurred to implement significant cost reduction initiatives and include workforce reduction costs and asset write-downs; “other charges” represent charges directly related to restructuring initiatives that cannot be reported as restructuring under GAAP. Such costs may include losses on disposal of inventories, trade receivables allowances from exiting product lines and accelerated depreciation resulting from the closure of facilities. |
| (4) | Business separation costs are costs related to non-cash non-recurring costs associated with the modification of share-based compensation awards as a result of the spin-off of the Company from Fortune Brands, Inc. |
| (5) | Defined benefit plan accounting change represents the impact on defined benefit plan expense of the actuarial gains (losses) associated with the Company’s defined benefit plans. |
Reconciliation of EBITDA Before Charges/Gains to GAAP Net Income (in millions)
| 2006 | 2009 | 2010 | 2011 | |||||||||||||
| EBITDA before charges/gains(1) |
$ | 826 | $ | 195 | $ | 296 | $ | 261 | ||||||||
| Depreciation(2) |
(105 | ) | (97 | ) | (92 | ) | (86 | ) | ||||||||
| Amortization of intangible assets |
(30 | ) | (16 | ) | (16 | ) | (14 | ) | ||||||||
| Restructuring and other charges(3) |
(26 | ) | (52 | ) | (13 | ) | (20 | ) | ||||||||
| Contingent acquisition consideration adjustment(4) |
— | — | — | — | ||||||||||||
| Business separation costs (5) |
— | — | — | (3 | ) | |||||||||||
| Related party interest expense, net |
(169 | ) | (85 | ) | (116 | ) | (23 | ) | ||||||||
| External interest expense |
(1 | ) | (0 | ) | (0 | ) | (3 | ) | ||||||||
| Standalone corporate expenses (6) |
20 | 20 | 20 | 14 | ||||||||||||
| Asset impairment charges |
— | — | — | (90 | ) | |||||||||||
| Defined benefit plan accounting change(7) |
0 | 5 | 4 | (80 | ) | |||||||||||
| Income tax (provision) benefit |
(180 | ) | (8 | ) | (18 | ) | 9 | |||||||||
|
|
|
|
|
|
|
|
|
|||||||||
| Net income (loss) |
$ | 335 | $ | (38 | ) | $ | 65 | $ | (35 | ) | ||||||
| Noncontrolling interests |
(1 | ) | (1 | ) | (1 | ) | (1 | ) | ||||||||
|
|
|
|
|
|
|
|
|
|||||||||
| Net income (loss) attributable to Home & Security |
$ | 334 | $ | (39 | ) | $ | 64 | $ | (36 | ) | ||||||
| Q1 2011 | Q1 2012 | % change |
TTM Q1 2012 | |||||||||||||
| EBITDA before charges/gains(1) |
$ | 28 | $ | 45 | 62% | $ | 278 | |||||||||
| Depreciation(2) |
(21 | ) | (21 | ) | 0% | (86 | ) | |||||||||
| Amortization of intangible assets |
(4 | ) | (3 | ) | (19)% | (13 | ) | |||||||||
| Restructuring and other charges(3) |
(0 | ) | (2 | ) | 0% | (22 | ) | |||||||||
| Contingent acquisition consideration adjustment(4) |
— | 2 | — | 2 | ||||||||||||
| Business separation costs (5) |
— | — | — | (3 | ) | |||||||||||
| Related party interest expense, net |
(23 | ) | — | (100)% | — | |||||||||||
| External interest expense |
(0 | ) | (2 | ) | — | (5 | ) | |||||||||
| Standalone corporate expenses (6) |
5 | — | (100)% | 9 | ||||||||||||
| Asset impairment charges |
— | — | — | (90 | ) | |||||||||||
| Defined benefit plan accounting change(7) |
— | — | — | (80 | ) | |||||||||||
| Income tax (provision) benefit |
5 | (6 | ) | (228)% | (2 | ) | ||||||||||
|
|
|
|
|
|
|
|
||||||||||
| Net income (loss) |
$ | (10 | ) | $ | 13 | (231)% | $ | (12 | ) | |||||||
| Noncontrolling interests |
(0 | ) | (0 | ) | 100% | (1 | ) | |||||||||
|
|
|
|
|
|
|
|
||||||||||
| Net income (loss) attributable to Home & Security |
$ | (10 | ) | $ | 13 | (225)% | $ | (13 | ) | |||||||
| (1) | EBITDA before charges/gains is net income (loss) derived in accordance with GAAP adjusted to (i) exclude depreciation, (ii) exclude amortization of intangible assets, (iii) exclude restructuring and other charges, (iv) exclude income from a contingent acquisition consideration adjustment, (v) exclude business separation costs, (vi) exclude related party interest expense, net, (vi) exclude external interest expense, (viii) exclude asset impairment charges, (ix) exclude actuarial gains (losses) associated with the Company’s defined benefit plans, (x) exclude income taxes, and (xi) include stand-alone corporate costs for the periods preceding the separation of the Company from Fortune Brands, Inc. EBITDA before charges/gains is a measure not derived in accordance with GAAP. Management uses this measure to assess returns generated by the Company. Management believes this measure provides investors with helpful supplemental information about the Company’s ability to fund internal growth, make acquisitions and repay debt and related interest. This measure may be inconsistent with similar measures presented by other companies. |
| (2) | Depreciation excludes accelerated depreciation included in restructuring and other charges. |
| (3) | Restructuring charges are costs incurred to implement significant cost reduction initiatives and include workforce reduction costs and asset writ downs; “other charges” represent charges directly related to restructuring initiatives that cannot be reported as restructuring under GAAP. Such costs may include losses on disposal of inventories, trade receivables allowances from exiting product lines and accelerated depreciation resulting from the closure of facilities. |
| (4) | Represents gain attributable to reduction of estimated liability for contingent consideration associated with a business acquisition. |
| (5) | Business separation costs are costs related to non-cash non-recurring costs associated with the modification of share-based compensation awards as a result of the spin-off of the Company from Fortune Brands, Inc. |
| (6) | The Company estimates that it would have incurred approximately $14 million of incremental corporate expenses if it had functioned as an independent standalone public company for the twelve months ended December 31, 2011, approximately $20 million for each of the prior years and approximately $5 million in the three months ended March 31, 2011. |
| (7) | Defined benefit plan accounting change represents the impact on defined benefit plan expense of the actuarial gains (losses) associated with the Company’s defined benefit plans. |
Reconciliation of Before charges/gains EBITDA margin to GAAP Net Income margin
| 2006 | 2009 | 2010 | 2011 | Q1 2011 | Q1 2012 | |||||||||||||||||||
| Before charges/gains EBITDA margin (1) |
18 | % | 6 | % | 9 | % | 8 | % | 4 | % | 6 | % | ||||||||||||
| Depreciation (2) |
(2 | %) | (3 | %) | (3 | %) | (3 | %) | (3 | %) | (3 | %) | ||||||||||||
| Amortization of intangible assets |
(1 | %) | (1 | %) | (0 | %) | (0 | %) | (1 | %) | (0 | %) | ||||||||||||
| Restructuring and other charges (3) |
(1 | %) | (2 | %) | (0 | %) | (1 | %) | (0 | %) | (0 | %) | ||||||||||||
| Contingent acquisition consideration adjustment (4) |
— | — | — | — | — | 0 | % | |||||||||||||||||
| Business separation costs (5) |
— | — | — | (0 | ) | 0 | % | — | ||||||||||||||||
| Related party interest expense, net |
(4 | %) | (3 | %) | (4 | %) | (1 | %) | (3 | %) | 0 | % | ||||||||||||
| External interest expense |
(0 | %) | (0 | %) | (0 | %) | (0 | %) | (0 | %) | (0 | %) | ||||||||||||
| Standalone corporate expenses (6) |
0 | % | 1 | % | 1 | % | 0 | % | 1 | % | — | |||||||||||||
| Asset impairment charges |
— | — | — | (3 | %) | — | — | |||||||||||||||||
| Defined benefit plan accounting change (7) |
0 | % | 0 | % | 0 | % | (2 | %) | — | — | ||||||||||||||
| Income tax (provision) benefit |
(4 | %) | (0 | %) | (1 | %) | 0 | % | 1 | % | (1 | %) | ||||||||||||
|
|
|
|
|
|
|
|
|
|
|
|
|
|||||||||||||
| GAAP Net income (loss) margin |
7 | % | (1 | %) | 2 | % | (1 | %) | (1 | %) | 2 | % | ||||||||||||
| (1) | Before charges/gains EBITDA margin is net income (loss) derived in accordance with GAAP adjusted to (i) exclude depreciation, (ii) exclude amortization of intangible assets, (iii) exclude restructuring and other charges, (iv) exclude income from a contingent acquisition consideration adjustment, (v) exclude business separation costs, (vi) exclude related party interest expense, net, (vi) exclude external interest expense, (viii) exclude asset impairment charges, (ix) exclude actuarial gains (losses) associated with the Company’s defined benefit plans, (x) exclude income taxes, and (xi) include stand-alone corporate costs for the periods preceding the separation of the Company from Fortune Brands, Inc. EBITDA before charges/gains is a measure not derived in accordance with GAAP. Management uses this measure to assess returns generated by the Company. Management believes this measure provides investors with helpful supplemental information about the Company’s ability to fund internal growth, make acquisitions and repay debt and related interest. This measure may be inconsistent with similar measures presented by other companies. |
| (2) | Depreciation excludes accelerated depreciation included in restructuring and other charges. |
| (3) | Restructuring charges are costs incurred to implement significant cost reduction initiatives and include workforce reduction costs and asset write-downs; “other charges” represent charges directly related to restructuring initiatives that cannot be reported as restructuring under GAAP. Such costs may include losses on disposal of inventories, trade receivables allowances from exiting product lines and accelerated depreciation resulting from the closure of facilities. |
| (4) | Represents gain attributable to reduction of estimated liability for contingent consideration associated with a business acquisition. |
| (5) | Business separation costs are costs related to non-cash non-recurring costs associated with the modification of share-based compensation awards as a result of the spin-off of the Company from Fortune Brands, Inc. |
| (6) | The Company estimates that it would have incurred approximately $14 million of incremental corporate expenses if it had functioned as an independent standalone public company for the twelve months ended December 31, 2011, approximately $20 million for each of the prior years and approximately $5 million in the three months ended March 31, 2011. |
| (7) | Defined benefit plan accounting change represents the impact on defined benefit plan expense of the actuarial gains (losses) associated with the Company’s defined benefit plans. |
Reconciliation of Unlevered Free Cash Flow to GAAP Cash Flow from Operations
(in millions)
| 2006 | 2009 | 2010 | 2011 | |||||||||||||
| Unlevered Free Cash Flow |
$ | 464 | $ | 280 | $ | 146 | $ | 130 | ||||||||
| Add: |
||||||||||||||||
| Capital Expenditures |
128 | 43 | 58 | 68 | ||||||||||||
| Standalone corporate expenses, net of tax |
13 | 13 | 13 | 9 | ||||||||||||
| Less: |
||||||||||||||||
| Proceeds from the disposition of assets |
11 | 11 | 3 | 4 | ||||||||||||
| Related party interest expense, net of tax |
110 | 56 | 75 | 15 | ||||||||||||
| External interest expense, net of tax |
0 | 0 | 0 | 2 | ||||||||||||
| Proceeds from the exercise of stock options |
— | — | — | 11 | ||||||||||||
|
|
|
|
|
|
|
|
|
|||||||||
| Cash flow from operations |
$ | 484 | $ | 269 | $ | 139 | $ | 175 | ||||||||
Unlevered free cash flow is cash flow from operations (i) less net capital expenditures (capital expenditures less proceeds from the sale of assets including property, plant and equipment) and estimated incremental standalone corporate expenses, net of tax, (ii) plus related party interest expense, net of tax, external interest expense, net of tax, and proceeds from the exercise of stock options. In computing unlevered free cash flow, net of tax reconciling items assume an income tax rate of 35%. Unlevered free cash flow is a measure not derived in accordance with GAAP. Management believes that unlevered free cash flow provides investors with helpful supplemental information about the Company’s ability to fund internal growth, make acquisitions, repay debt and related interest, pay dividends, and repurchase common stock. This measure may be inconsistent with similar measures presented by other companies.
DILUTED EPS BEFORE CHARGES/GAINS RECONCILIATION
Diluted EPS before charges/gains is net income (loss) calculated on a diluted per-share basis adjusted to reflect the borrowing arrangements and debt levels that actually existed immediately after the separation of the Company from Fortune Brands, Inc. as of October 4, 2011, the 1:1 share distribution resulting from the separation of the Company from Fortune Brands, Inc., standalone corporate costs and an adjusted pro forma effective tax rate of 35% and excludes restructuring and other charges and income from a contingent acquisition consideration adjustment.
For the first quarter of 2012, diluted EPS before charges/gains is net income calculated on a per-share basis excluding $1.6 million ($1.1 million after tax or $0.01 per diluted share) of restructuring and other charges, and income from a contingent acquisition consideration of $2.0 million ($1.3 million after tax or $0.01 per diluted share).
For the first quarter of 2011, diluted EPS before charges/gains is net income calculated on a per-share basis excluding $0.5 million ($0.3 million after tax) of restructuring and other charges, standalone corporate costs of $5.0 million ($3.1 million after tax or $0.02 per diluted share), capital structure changes of $19.8 million ($12.3 million after tax or $0.08 per diluted share), and an adjusted pro forma tax rate adjustment of $1.0 million ($0.01 per diluted share).
Diluted EPS before charges/gains is a measure not derived in accordance with GAAP. Management uses this measure to evaluate the overall performance of the Company and believes this measure provides investors with helpful supplemental information regarding the underlying performance of the Company from period to period. This measure may be inconsistent with similar measures presented by other companies.
| Three Months Ended March 31, | ||||||||||||
| 2012 | 2011 | % Change | ||||||||||
| Earnings Per Common Share - Diluted |
||||||||||||
| EPS Before Charges/Gains |
$ | 0.08 | $ | — | — | |||||||
| Restructuring and other charges |
(0.01 | ) | — | — | ||||||||
| Contingent acquisition consideration adjustment |
0.01 | — | — | |||||||||
| Standalone corporate costs |
— | 0.02 | (100.0 | ) | ||||||||
| Capital structure change |
— | (0.08 | ) | 100.0 | ||||||||
| Adjusted pro forma tax rate adjustment |
— | (0.01 | ) | 100.0 | ||||||||
|
|
|
|
|
|
|
|||||||
| Diluted EPS (GAAP) |
$ | 0.08 | $ | (0.07 | ) | 214.3 | ||||||
RECONCILIATION OF FULL YEAR 2012 EARNINGS GUIDANCE TO GAAP
For the full year, the Company is targeting diluted EPS before charges/gains to be in the range of $0.77 to $0.87 per share. On a GAAP basis, the Company is targeting diluted EPS to be in the range of $0.76 to $0.86 per share.